Article

A Preferred Orientation Angle for Bipolar Planetary Nebulae

Laboratory for Space Research, Hong Kong University, Hong Kong, China
*
Author to whom correspondence should be addressed.
Galaxies 2020, 8(2), 34; https://doi.org/10.3390/galaxies8020034
Submission received: 26 February 2020 / Revised: 16 March 2020 / Accepted: 16 March 2020 / Published: 20 April 2020
(This article belongs to the Special Issue Workplans II: Workshop for Planetary Nebula Observations)

Abstract

:
We present preliminary results from measuring Galactic orientation angles of 766 elliptical and bipolar Planetary Nebulae (PNe) in the Hong Kong/Australian Astronomical Observatory/Strasbourg Observatory H-alpha Planetary Nebula research platform and database (HASH DB). For elliptical PNe the distribution of orientation angles is found to be more or less uniform. However, for bipolar PNe there is statistically significant evidence for preferred orientation angles (as tentatively reported before with smaller samples) across the whole Galaxy.

1. Introduction

The shaping mechanisms of Planetary Nebulae are not fully understood. It is generally accepted that the mass-loss process is the key factor, other mechanisms like binarity, ISM interaction, magnetic fields and non-uniform radiation pressure may also play a role in creating the observed distributions of nebular emission. The influence of larger-scale Galactic properties on the final PNe shape is usually regarded as negligible. The question whether there is a preferred orientation angle of elliptical and bipolar PNe in our Galaxy, particularly towards the Galactic Bulge where the Galactic magnetic field could play a role in shaping PNe (Falceta-Gonçalves and Monteiro [1]), has been a long-standing controversy. While Melnick and Harwit [2], Phillips [3], Weidmann and Diaz [4], Rees and Zijlstra [5], and Danehkar and Parker [6] did find evidence for a preferred orientation of PNe towards the Galactic Bulge or the whole Galaxy, Corradi et al. [7] did not find any conclusive evidence for a non-uniform orientation. If a preferred orientation was to be convincingly demonstrated then this has important implications for how PNe form in our Galaxy.

2. Materials and Methods

2.1. Sample Selection

The HASH DB (Parker et al. [8,9]) currently includes 1562 elliptical and bipolar PNe designated as “true” following Frew and Parker [10] and Parker et al. [11], with a further 414 considered likely and 662 possible. For this preliminary work we included the first 766 (by HASH ID) true PNe from the HASH DB representing those for which we could measure an orientation “position angle” with some level of confidence. Only about 30 had to be excluded as we could not find a current image with sufficient resolution to determine a reliable object orientation on the sky.

2.2. Analysis

We inspected all available optical images in the HASH DB for each PN. We assume the best optical images are a reasonable representation of the true PN “projected” shape. Whenever there was a Hubble image available we used that, otherwise we used the highest quality optical image resources in terms of both sensitivity and resolution that would give us the highest level of confidence. This was usually the Hα/Sloan r’ quotient image (from the SHS or IPHAS surveys; Parker et al. [12], Drew et al. [13]) or an image from PanSTARRS (Chambers [14]). For the morphological classification we adopted the classification from the HASH PN database which essentially follows Corradi and Schwarz [15]. The PN orientation axis was taken to be that of the polar or major axis of the PN. Each PN examined was assigned a subjective confidence flag (1 for very confident, 2 for quite confident, 3 for not very confident) for the measurement of their Equatorial Position Angle (EPA).
The angle measurement is from North towards East, see Figure 1. Out of the 766 PNe where we could with some confidence measure the EPA, we classified 144 elliptical and 99 bipolar PNe with the confidence flag 1, 194 elliptical and 129 bipolar PNe with the confidence flag 2, and 157 elliptical and 43 bipolar PNe with the confidence flag 3. Note that for PNe with more than one main EPA (e.g., for some multipolar examples) we included all EPAs. 55 PNe had more than one EPA recorded, giving a total of 824 measured EPAs.
For this study projection effects were not taken into account as we do not have information to disentangle the true 3-D aspect from that seen along the line of sight. The fact that the data is two dimensional has two effects: First, it raises the possibility that some bipolar PNe were observed approximately along the lobes and consequently misclassified. Secondly, if we consider the angles of the PNe taken from the Galactic North Pole, through the lobe-to-lobe axis of PN towards the Galactic Plane the true angles will be more concentrated towards 90° (Rees and Zijlstra [5]).
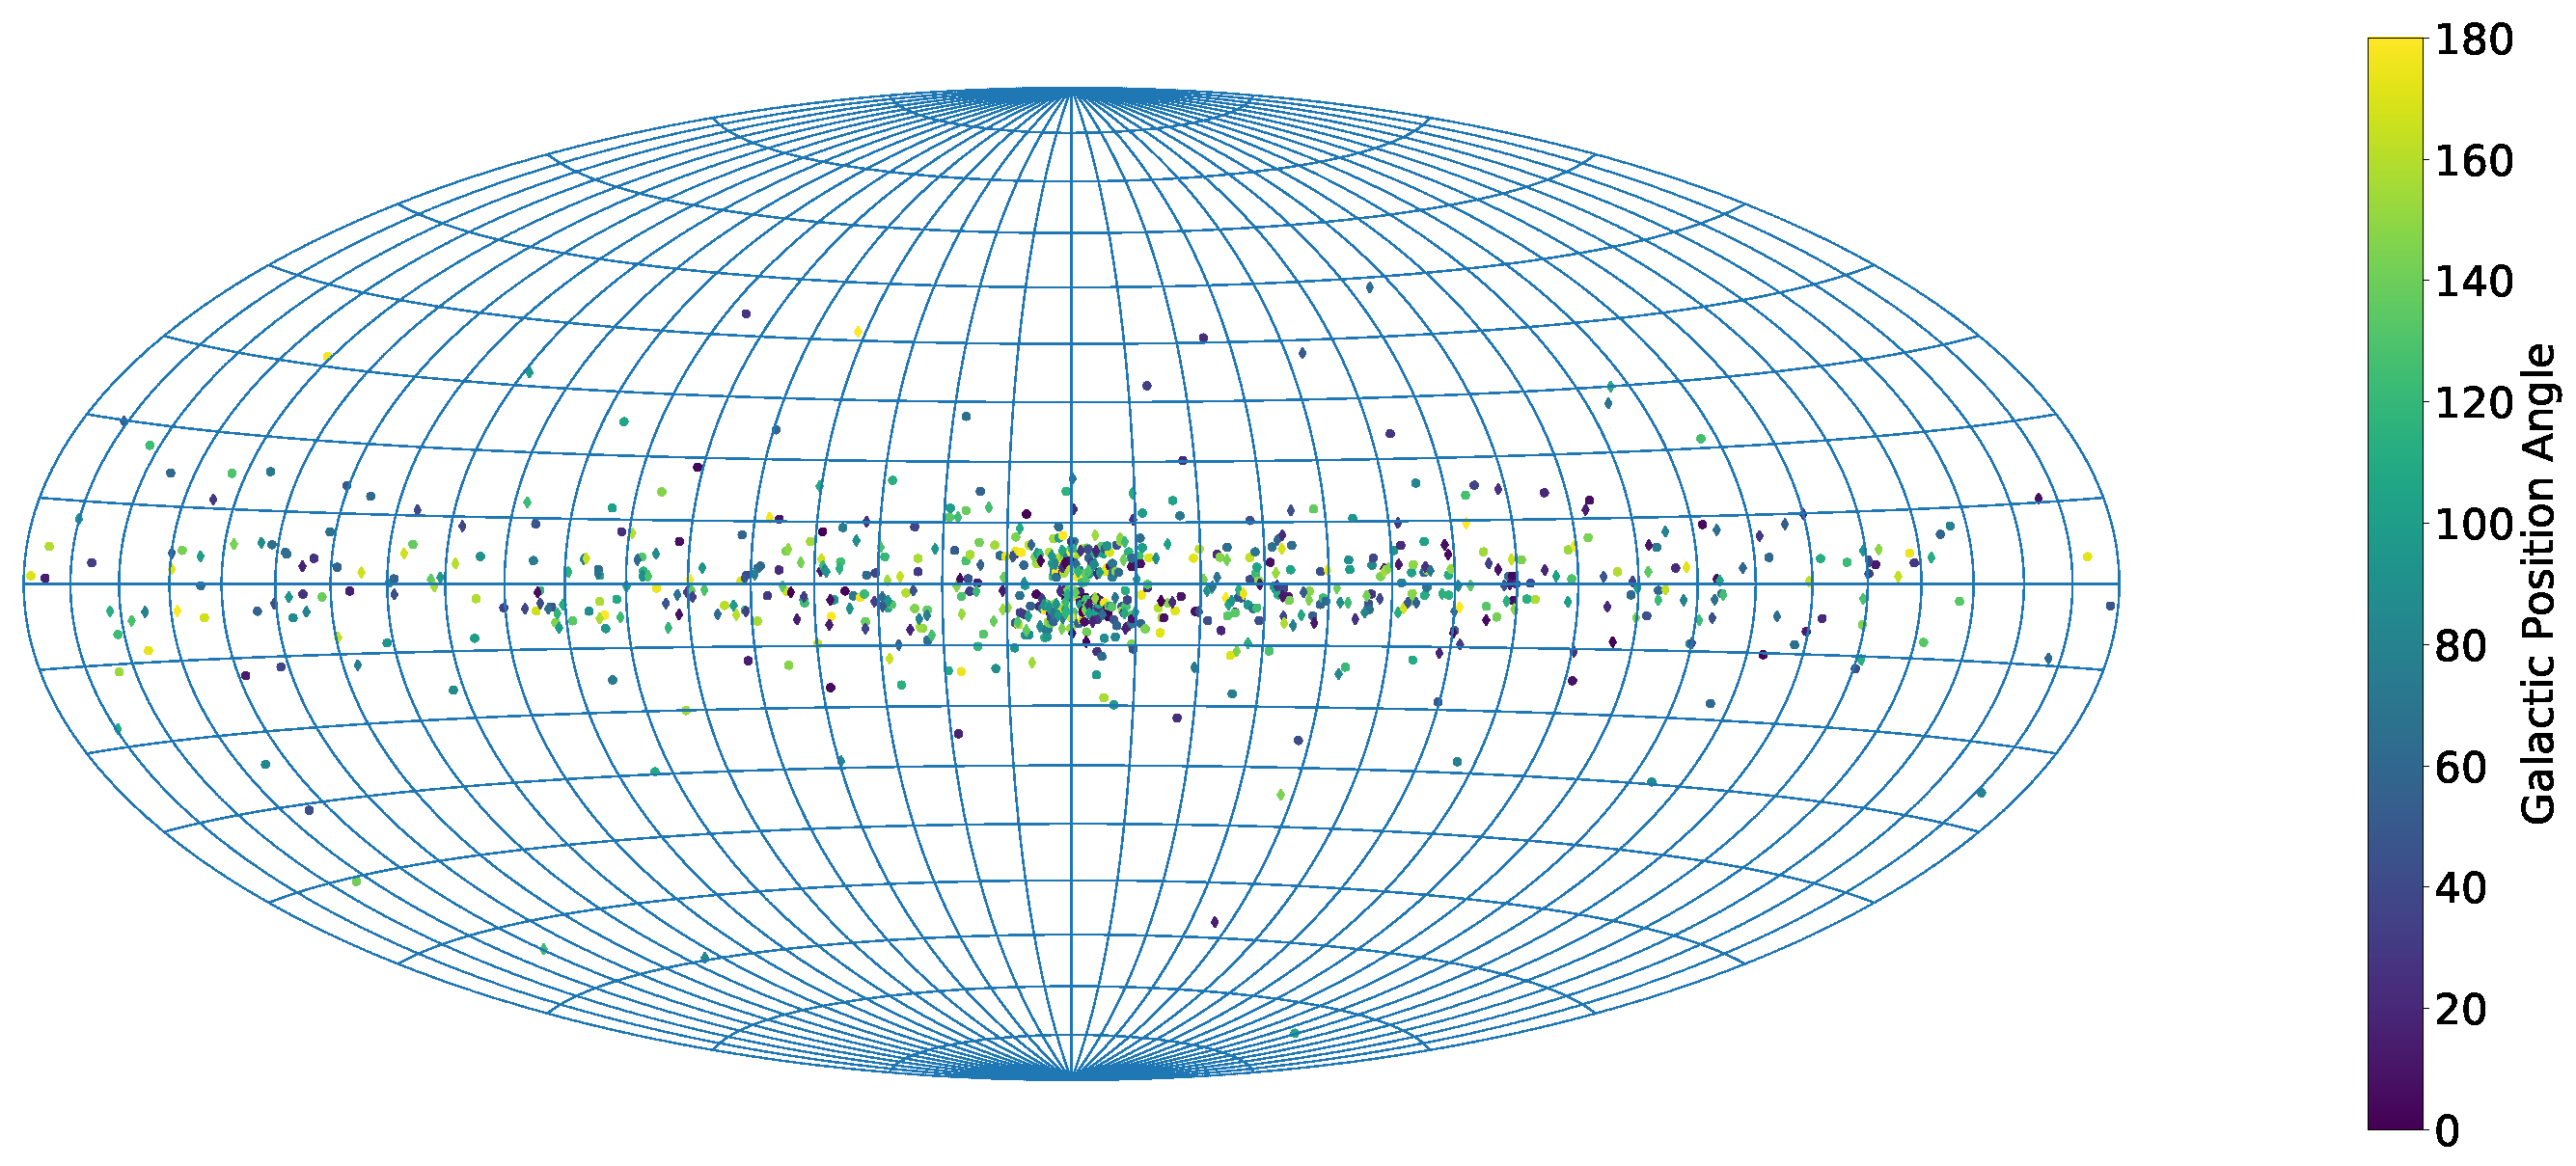
The EPA was then converted to the Galactic Position Angle (GPA, measured from the direction of the Galactic North towards the East) utilising the formula adopted by Corradi et al. [7] using standard relations for spherical triangles for epoch J2000. While Corradi et al. [7] measured the EPAs in the interval [0°,90°) assuming a priori a symmetric problem in the sense that a preferred orientation of the PNe elongations very close to the Galactic equator will be easier to detect, Weidmann and Diaz [4] demonstrated that this would blur any other preferred orientation. We therefore adopted the more widely used interval [0°,180°) for the EPAs and GPAs. The distribution on the sky of the PNe used for this study, colour-coded with their measured GPAs, is shown in Figure 2.
Because a measured value of 178 degrees is closer to 0 than it is to 175 degrees, circular statistics must be applied. For the circular statistics analysis we doubled the GPA to get a full circle. The Rayleigh “randomness” Test (Wilkie [16]) was applied to the GPA distribution to test the circular data. A p value of 1.0 means the distribution is uniform, while small numbers indicate not uniformity. A p value of 0.1 implies that there is a 90% probability that the distribution is non-uniform.
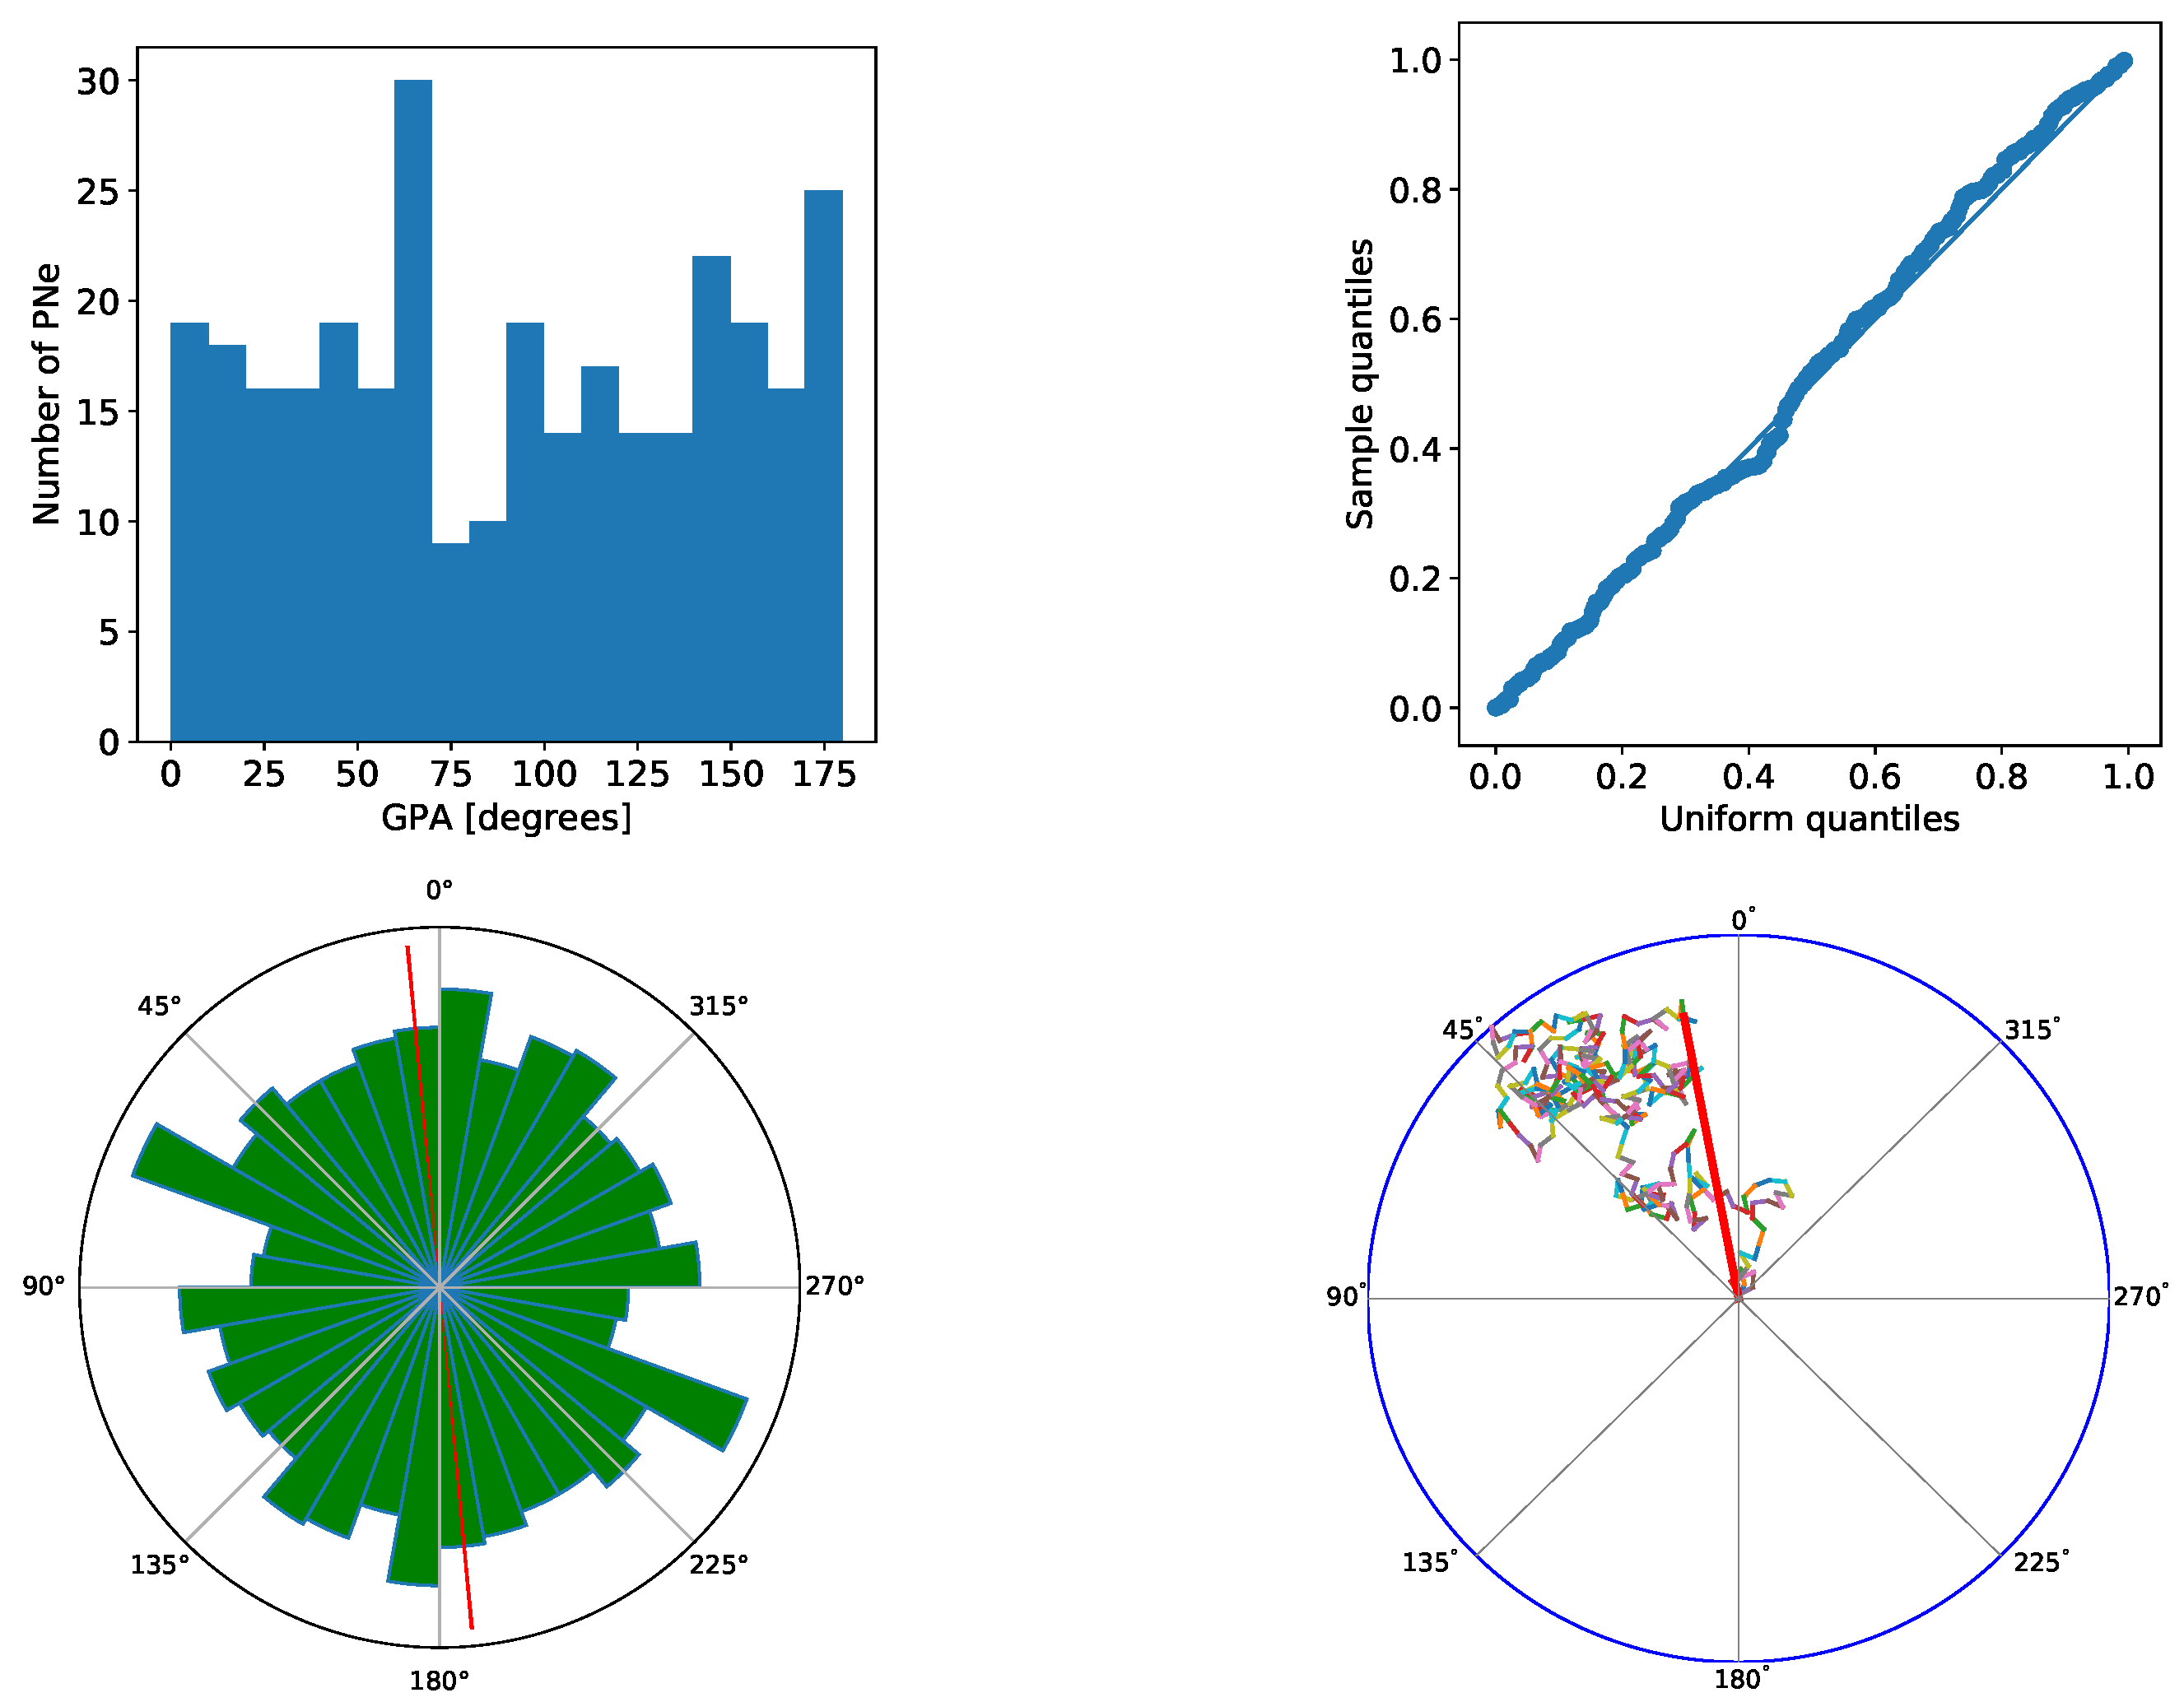
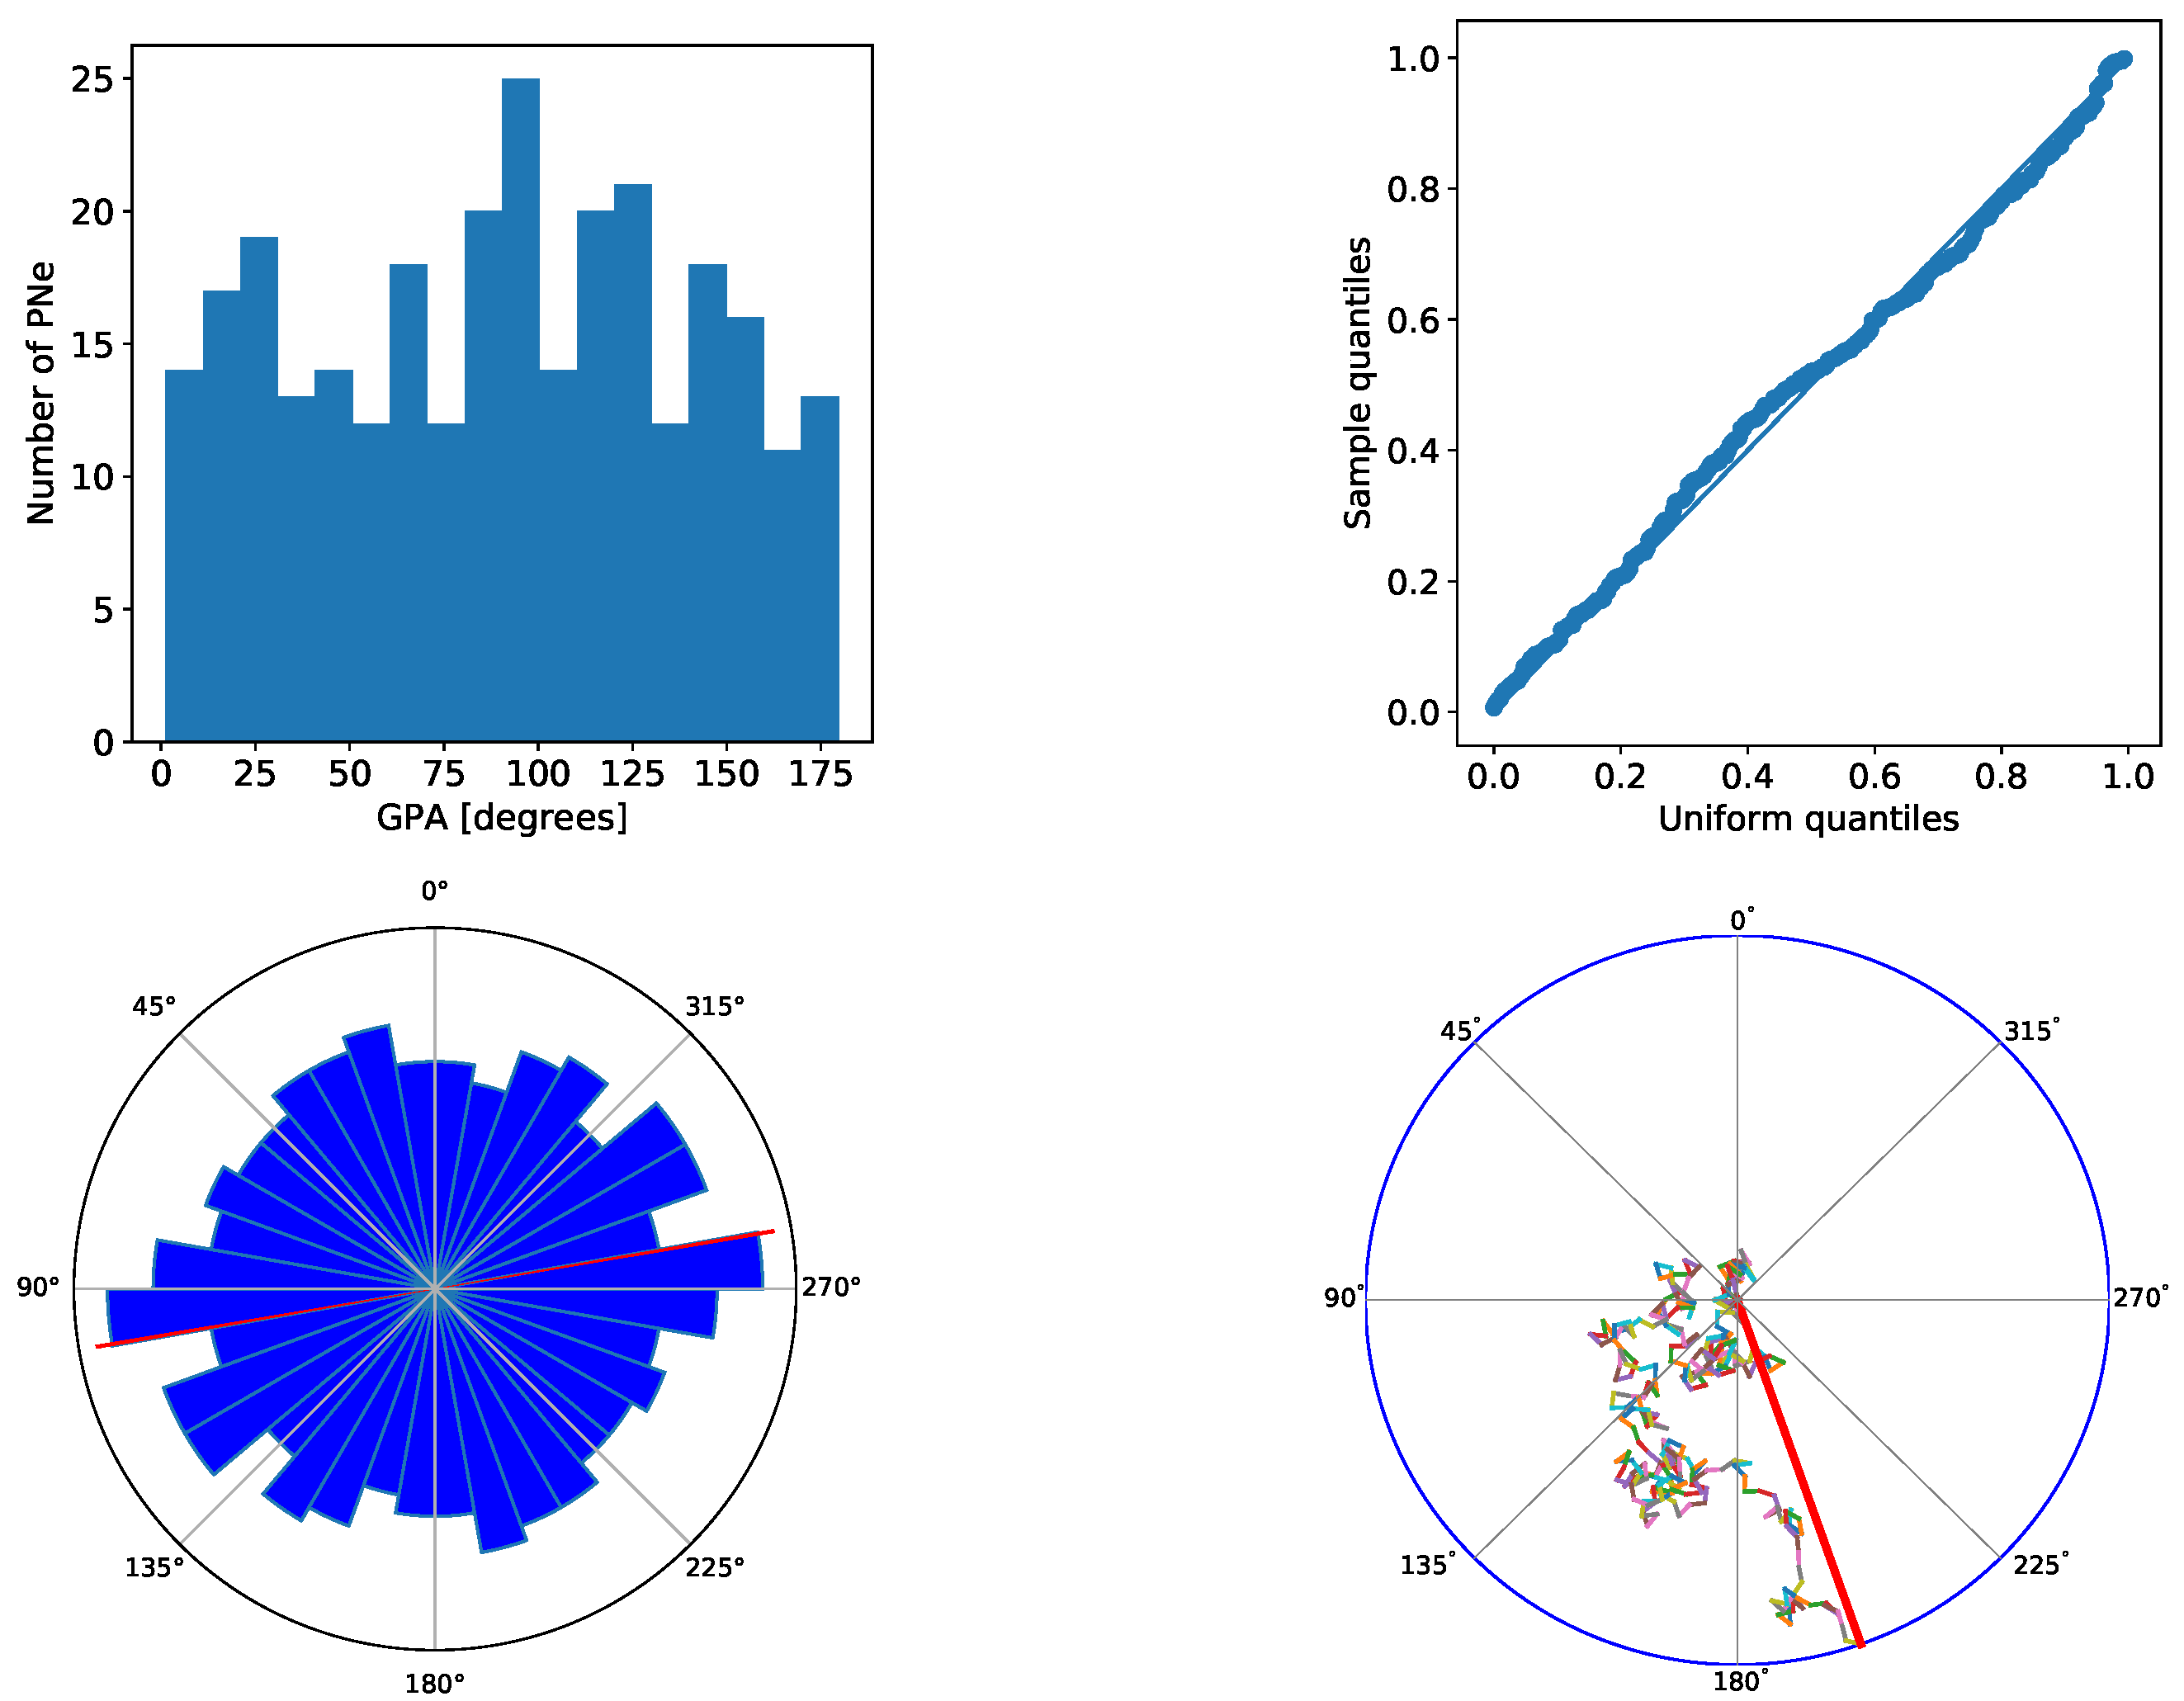
For the visualization of the GPA distributions (Figure 3 and Figure 4) we employed general histograms as well as “uniformity”, “rose”, and “vector” plots (Fisher [17]). In the uniformity plots deviations from the diagonal indicate a non-uniform distribution. For the rose plots the radius of each finger was determined so that each PN contributes the same area. Only the left side has actually been measured and then rotated by 180 degrees for better visibility. Note that the vector plots show the doubled GPAs so the angle of the resulting radius vector R (red line) needs to be divided by two to get the mean direction of the GPA distribution. For a given set of n unity vectors with angles α i , 0 α i < 180 , i = [ 1 , , n ] , the resulting vector R can be calculated as
R = ( i = 1 n cos 2 α i , i = 1 n sin 2 α i ) = ( C , S ) .
Thereby the half angle of R ,
Θ R = 1 2 arctan 2 S C ,
can be defined as the mean angle of the angular distribution and
D = n R
as the deviation from the mean angle (See Jammalamadaka and Sengupta [18] for the [0°360°) problem). We have repeated the analysis for individual directions, for different upper limits for the confidence flags, as well as for elliptical and bipolar PNe separately.

2.3. Tests

To test our analysis software we created mock samples with given mean GPA values and standard deviations from those angles. Both mean values and standard deviations were recovered by the software, with Rayleigh probabilities for uniformity of 0.0%. We also created mock samples with random GPA distributions. The Rayleigh probabilities for uniformity of those sets were between 30% and 100%. The repeated analysis of the sample from Rees and Zijlstra [5] reproduced their reported results.

3. Results

Figure 3 and Figure 4 show the GPA distributions for all 313 measured elliptical and 273 bipolar PNe with a confidence flag of 1 or 2. The Rayleigh probability for a uniform distribution is 33% for the elliptical PNe and 13% for the bipolar PNe. The mean values (marked by red lines in the vector and rose plots) for the individual distributions are 5° and 100° for elliptical PNe and for the bipolar PNe, respectively. The deviations from the mean angles are 147 for the elliptical and 132 for the bipolar PNe, a little less than half the sample size. The mean values for the elliptical and bipolar PNe are offset by ~90°. This has previously been reported by Melnick and Harwit [2].
These results are still preliminary and more work needs to be done. However, the statistical significance afforded by the numbers of PNe that can now be included in such a study due to the availability of HASH cannot be ignored and form the basis of a more detailed paper (Ritter and Parker in preparation).

4. Conclusions

This preliminary study is the most comprehensive investigation to date into the orientations of large numbers of elliptical and bipolar Galactic PNe now possible with the HASH DB. The significantly increased sample compared to those used in previous studies, combined with use of the best available data provides a major increase in statistical significance of the results. The Rayleigh probability for a uniform distribution of GPAs is found to be only 13% for the 273 bipolar PNe in this study. This non-random result, compared to that for the elliptical PNe, is seen not just in the Galactic Bulge but across the Galactic plane where bipolar PNe are also more likely to be located. Bipolar PNe are thought to arise from more massive progenitors (Fragkou et al. [19]) and in binary systems (De Marco [20], De Marco and Izzard [21]). These preliminary results may have significant implications for how bipolar PNe form and indicate influence of some connecting process at work across the Galaxy.

Author Contributions

Conceptualization, Q.A.P. and A.R.; methodology, Q.A.P.; software, A.R.; validation, Q.A.P.; formal analysis and investigation, A.R.; resources, Q.A.P.; writing—original draft, A.R.; writing—review and editing, Q.A.P.; visualization, A.R.; funding Q.A.P. All authors have read and agreed to the published manuscript version.

Funding

This research was funded by The University of Hong Kong and the Research Grants Council of Hong Kong under the RGC General Research fund grant numbers 17300417 and 17304018.

Conflicts of Interest

No conflict of interest. Funders had no role in design of the study nor in the collection, analyses, or interpretation of data, writing of the manuscript, or in decision to publish the results.

References

  1. Falceta-Gonçalves, D.; Monteiro, H. On the alignment of PNe and local magnetic field at the Galactic centre: Magnetohydrodynamical numerical simulations. Mon. Not. R. Astron. Soc. 2014, 438, 2853–2863. [Google Scholar] [CrossRef] [Green Version]
  2. Melnick, G.; Harwit, M. Orientation of Planetary Nebulae within the Galaxy. Mon. Not. R. Astron. Soc. 1975, 171, 441–444. [Google Scholar] [CrossRef] [Green Version]
  3. Phillips, J.P. The spatial orientations of bipolar nebulae. Astron. Astrophys. 1997, 325, 755–757. [Google Scholar]
  4. Weidmann, W.A.; Diaz, R.J. The Spatial Orientation of Planetary Nebulae within the Milky Way. Publ. Astron. Soc. Pac. 2008, 120, 380–392. [Google Scholar] [CrossRef]
  5. Rees, B.; Zijlstra, A.A. Alignment of the angular momentum vectors of planetary nebulae in the Galactic Bulge. Mon. Not. R. Astron. Soc. 2013, 435, 975–991. [Google Scholar] [CrossRef] [Green Version]
  6. Danehkar, A.; Parker, Q.A. Orientation of Galactic Bulge Planetary Nebulae toward the Galactic Center. Proc. Int. Astron. Union 2014, 312, 128–129. [Google Scholar] [CrossRef] [Green Version]
  7. Corradi, R.L.M.; Aznar, R.; Mampaso, A. Orientation of planetary nebulae within the Galaxy. Mon. Not. R. Astron. Soc. 1998, 617, 617–623. [Google Scholar] [CrossRef] [Green Version]
  8. Parker, Q.A.; Bojičić, I.S.; Frew, D.J. HASH: The Hong Kong/AAO/Strasbourg Hα planetary nebula database. J. Phys. Conf. Ser. 2016, 728, 032008. [Google Scholar] [CrossRef]
  9. Parker, Q.A.; Bojičić, I.S.; Frew, D.J. Exploiting the HASH Planetary Nebula Research Platform. Proc. Int. Astron. Union 2017, 323, 36–39. [Google Scholar] [CrossRef] [Green Version]
  10. Frew, D.J.; Parker, Q.A. Planetary Nebulae: Observational Properties, Mimics and Diagnostics. Publ. Astron. Soc. Aust. 2010, 27, 129–148. [Google Scholar] [CrossRef] [Green Version]
  11. Parker, Q.A.; Acker, A.; Frew, D.J.; Hartley, M.; Peyaud, A.E.J.; Ochsenbein, F.; Phillipps, S.; Russeil, D.; Beaulieu, S.F.; Cohen, M.; et al. The Macquarie/AAO/Strasbourg Hα Planetary Nebula Catalogue: MASH. Mon. Not. R. Astron. Soc. 2006, 373, 79–94. [Google Scholar] [CrossRef] [Green Version]
  12. Parker, Q.A.; Phillipps, S.; Pierce, M.J.; Hartley, M.; Hambly, N.C.; Read, M.A.; MacGillivray, H.T.; Tritton, S.B.; Cass, C.P.; Cannon, R.D.; et al. The AAO/UKST SuperCOSMOS Hα survey. Mon. Not. R. Astron. Soc. 2005, 362, 689–710. [Google Scholar] [CrossRef] [Green Version]
  13. Drew, J.E.; Greimel, R.; Irwin, M.J.; Aungwerojwit, A.; Barlow, M.J.; Corradi, R.L.M.; Drake, J.J.; Gänsicke, B.T.; Groot, P.; Hales, A.; et al. The INT Photometric Hα Survey of the Northern Galactic Plane (IPHAS). Mon. Not. R. Astron. Soc. 2005, 362, 753–776. [Google Scholar] [CrossRef]
  14. Chambers, K.C.; Pan-STARRS Team. The Pan-STARRS Surveys. Am. Astron. Soc. 2016, 227, 324.07. [Google Scholar]
  15. Corradi, R.L.M.; Schwarz, H.E. Morphological populations of planetary nebulae: Which progenitors? I. Comparative properties of bipolar nebulae. Astron. Astrophys. 1995, 293, 871–888. [Google Scholar]
  16. Wilkie, D. Rayleigh Test for Randomness of Circular Data. Appl. Stat. 1983, 32, 311. [Google Scholar] [CrossRef]
  17. Fisher, N.I. Statistical Analysis of Circular Data; Cambridge University Press: Cambridge, UK, 1995. [Google Scholar]
  18. Jammalamadaka, S.R.; Sengupta, A. Topics in Circular Statistics; World Scientific: Singapore; Hackensack, NJ, USA; London, UK; Hong Kong, China, 2001. [Google Scholar]
  19. Fragkou, V.; Parker, Q.A.; Zijlstra, A.A.; Crause, L.; Barker, H. A high-mass planetary nebula in a Galactic open cluster. Nat. Astron. 2019, 3, 851–857. [Google Scholar] [CrossRef]
  20. De Marco, O. The Origin and Shaping of Planetary Nebulae: Putting the Binary Hypothesis to the Test. Publ. Astron. Soc. Pac. 2009, 121, 316. [Google Scholar] [CrossRef] [Green Version]
  21. De Marco, O.; Izzard, R.G. Dawes Review 6: The Impact of Companions on Stellar Evolution. Publ. Astron. Soc. Aust. 2017, 34, 1. [Google Scholar] [CrossRef] [Green Version]
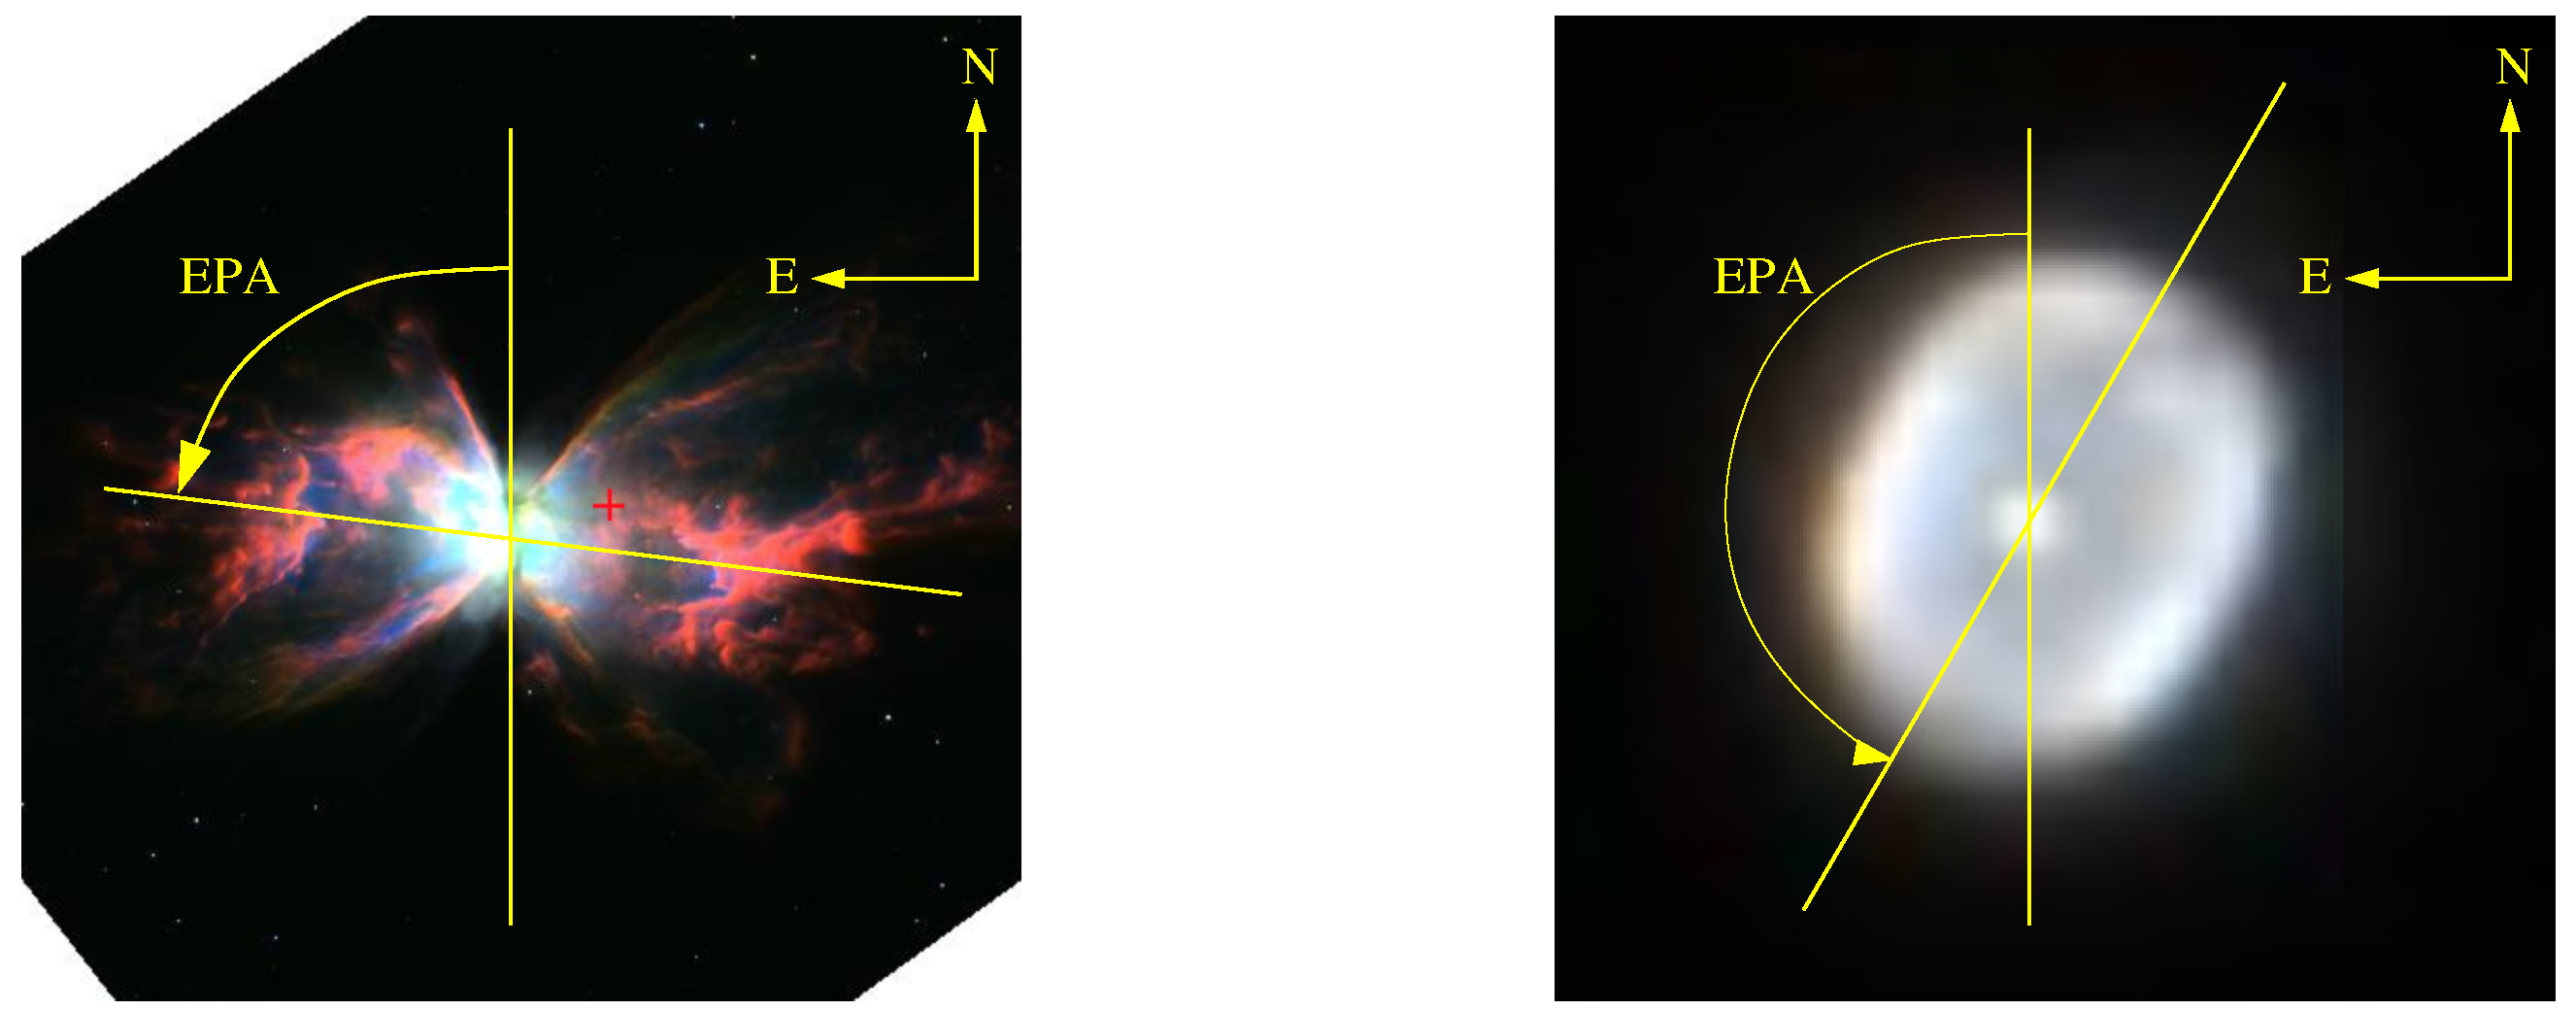
Figure 1. Typical examples of measuring the Equatorial Position Angle (EPA). Left: bipolar PN H 2-37 (HASH ID 93) and right elliptical PN M 1-11 (HASH ID 778), both from HST images. North is up and East is left. The EPA is the angle of the major axis measured from North towards the East.
Galaxies 08 00034 g001
Figure 2. All measured PNe in our sample. The colour code is their Galactic Position Angle (GPA).
Galaxies 08 00034 g002
Figure 3. Histogram (top left), Uniformity plot (top right), Rose plot (bottom left), Vector plot (bottom right) of GPAs for all 293 elliptical PNe with a confidence flag of 1 and 2. Deviations from the diagonal in the Uniformity plot indicate non-uniformity. Only the left side of the Rose plot has been measured and then rotated by 180 degrees for better visibility. The mean GPA has been marked with a red line. Note that for the Vector plot the GPAs were doubled to get to the full circle.
Galaxies 08 00034 g003
Figure 4. Same as Figure 3 but for 273 bipolar PNe where deviations in the uniformity plot are evident.
Galaxies 08 00034 g004