Abstract
The aim of this work is to examine distances to planetary nebulae (PNe) together with other properties that were derived from them, using the astrometry of Gaia Data Release 2 (DR2). We were able to identify 1571 objects classified as PNe, for which we assumed distances calculated following a Bayesian statistical approach. From those objects, we selected a sample of PNe with good quality parallax measurements and distance derivations, which we called Golden Astrometry PNe sample (GAPN). In this paper we will review the physical properties of the stars and nebulae in this subsample of PNe.
1. Introduction
It is well known that the planetary nebula (PN) phase represents a very short stage in the late evolution of low- and intermediate-mass stars, during which several solar masses of processed material can be ejected to the Interstellar Medium in the form of gas and dust. A better knowledge of the lifetimes of the PNe, the masses of both the central stars and the nebulae, and the total number of objects of this kind that are populating the Galaxy have important consequences for the understanding of the chemical evolution of our and other galaxies. In this work we shall use distances to the galactic PNe obtained from Gaia astrometric mission to infer absolute quantities such as luminosities, bolometric magnitudes and nebular sizes for a significant sample of PNe. Finally, the evolutionary status of the sample are studied by complementing this information with literature values on the nebular expansion velocities, interstellar reddening, temperatures of the central stars and evolutionary models.
2. Materials and Methods
We collected objects from different literature compilations of PNe, including catalogues from different authors and the Hong Kong/AAO/Strasbourg/ (HASH) database. Then, using CDS services to X-match their positions with Gaia DR2 astrometry, we were able to identify 1571 objects. The procedure followed for identifying central stars with astrometry in DR2 is carefully explained in [1].
To select objects with reliable astrometric data, it was necessary to consider the uncertainties present in DR2, as explained in Lindegren et al. [2]. According to this work, we also excluded those objects with low quality astrometric indexes (UWE < 1.96 and RUWE < 1.4), as well as compact nebulae (because the nebular flux can be brighter than the central star). This filtering allows us to select a sample of 211 objects, that we named Golden Astrometry PNe (GAPN). Central stars in GAPN were checked manually, and a visual inspection of the images with SDSS photometry was carried out in the skyserver, verifying that they were blue objects. These objects were not always located at the geometrical center of the nebula. Still, it is possible that in a small percentage of objects (as estimated under 5%) the identification be incorrect. To estimate their distances, we followed the Bayesian statistical approach proposed by Bailer-Jones et al. [3]. Notice should be paid that this approach is based on galaxy models and it does not take into consideration the physical properties or the extinction toward individual stars. To estimate physical radii, luminosities or kinematical ages, we used the literature values of the apparent sizes of the PNe, radial and expansion velocities, visual magnitudes, interstellar reddening and effective temperatures. A table with astrometry data of all objects in the GAPN sample and information about the sources from literature data that we have used is available at the CDS via anonymous ftp to cdsarc.u-strasbg.fr (130.79.128.5) or via http://cdsarc.u-strasbg.fr/viz-bin/cat/J/A+A/630/A150.
3. Results
3.1. Galactic Distribution, Completeness
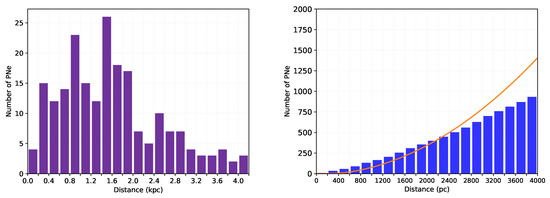
Focusing on our PNe distances distribution, Figure 1 (left panel), we observe that the population starts decreasing for distances further than 2 kpc, and that the furthest objects in our sample are located at approximately 4 kpc.

Figure 1.
Distances distribution of Golden Astrometry Planetary Nebulae (GAPN) sample (left) and distances cumulative histogram (blue bars) with the population density function (orange curve) for the general sample (right).
Furthermore, we analysed the completeness of our sample of PNe, using the general sample of 1571 objects. To do it, we calculated their spatial density in the solar neighborhood and we extrapolated it for the whole galaxy. In Figure 1 (right panel) we represent a cumulative distribution of this PNe population as a function of distance, together with the increasing function of population according to the density value obtained before. As can be seen, the prediction is fulfilled up to a distance of about 2300 pc. This value is similar to that found in the left panel, where the number of PNe drops for distances larger than about 2 kpc.
3.2. Morphology and Physical Sizes
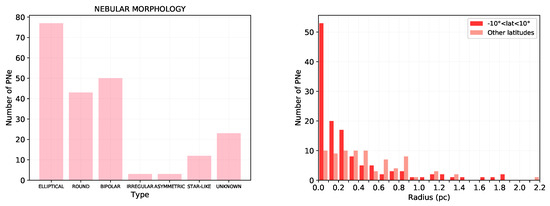
Planetary Nebulae display a large variety of morphologies. We adopted the morphological classification for GAPN sample in the HASH database, and found that the vast majority of the nebulae are catalogued as elliptical (36%), bipolar (24%) or round (20%). To a lesser extent, we have star-like (6%), irregular (1%) and asymmetric (1%) PNe. Note that there is also a non-negligible percentage (22%) of objects with unknown morphology in this sample. Such morphological distribution is shown in Figure 2 (left panel).

Figure 2.
Morphological classification (left) and radii distribution separated in low latitudes and other latitudes (right).
The knowledge of distances allowed us to obtain the physical size of the PNe from the observed nebular angular sizes, retrieved from the HASH database, where values are taken from the 10% isophote. We adopted as a typical size, the average value between minor and major axes angular sizes, given in this database.
This way, a typical radius for the nebulae (R) can then be obtained without taking into account the projection effects or the complexity of some of the nebular shapes, simply by computing the product of the estimated distance by the angular size. Right panel of Figure 2 shows the distribution of such typical radii for the case of low latitude nebulae, with latitude values between −10 and 10 degrees, as compared with the remaining objects.
3.3. Expansion Velocities and Kinematical Ages
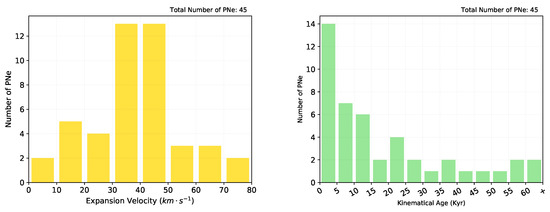
Once we had calculated nebular physical radii for most of the GAPN objects, we searched the literature for expansion velocity measurements in order to estimate the corresponding kinematical ages. We excluded from this analysis those objects displaying a clear non-spherical morphology, those known to have a binary central star (CS) and those with H-deficient spectra. Then, based mostly on the literature values of expansion velocities from Frew [4] we obtained self-consistent values for a subsample of 45 PNe (see section 5 in [1]). Furthermore, following the prescription by Jacob et al. [5], we applied an overall correction factor for the expansion velocities of 1.5 to take into account expected observational limitations. As it can be seen in the left panel of Figure 3, most of expansion velocities take values between 30 and 50 . While the mean value turns out to be .

Figure 3.
Expansion velocities (left) and kinematical ages distributions (right).
Once we have the radius and the expansion velocity of each of these PNe, we can estimate their kinematical age. In the right panel of the same figure we show the obtained values distribution. In addition, we can calculate an average value for the kinematical age:
This value can be somehow underestimated, due to the fact that young PNe are easier to detect (as they are brighter) than old ones, so probably our sample might have a bias towards young PNe.
3.4. Temperatures and Luminosities of the Central Stars
The knowledge of accurate distances allows to derive new luminosity values that can be used to place the stars in a Hertzsprung-Russel (HR) diagram and to compare with evolutionary models. For this task, the temperature and bolometric magnitudes of the central stars are needed. We focus on the GAPN sample whose objects have literature values (apparent visual magnitudes, extinction and temperature values); mainly using data from Frew [4], but also from different authors (Kaler et al. [6], Ciardullo et al. [7], Tylenda et al. ([8,9]), Moreno-Ibañez et al. [10] and Napiwotzki [11]). The effective temperature () is usually estimated by Zanstra method (Zanstra [12]), consisting on measuring [HI] or [HeII] nebular fluxes. In this work, we focus on the Helium Zanstra Method literature values.
As explained in [1], we retrieved visible magnitudes and extinction and temperature values from the literature, and together with distance estimations we calculated their absolute visible magnitudes. Then, using the calibration by Vacca et al. [13], we were able to obtain the absolute bolometric magnitude: , where . Finally, we derived the luminosities from these last values.
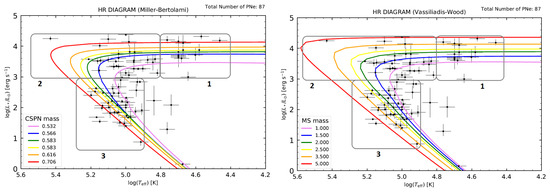
With these parameters, we can locate the PNe in the HR diagram, together with the evolutionary tracks by Miller Bertolami [14] and Vassiliadis-Wood [15], as shown in both panels of Figure 4. Then, by interpolation, we can estimate the mass and evolutionary age (we assume the definition of later post-AGB phase starting at from [14]) of each object.

Figure 4.
Central Stars location in the HR diagram, together with the evolutionary tracks by Miller Bertolami (left) and Vassiliadis-Wood (right). Note that the left panel shows CSPN masses, while the right panel shows Main Sequence (MS) star masses. Region 1: > 3.0 and < 4.8; Region 2: > 3.0 and > 4.8; Region 3: < 3.0 and > 4.9.
For a more detailed analysis, we divided the diagram into three regions, according to the evolutionary phase, corresponding to early, medium and late evolutionary states (see Table 1). Then, we obtained the mean values and dispersions for the radius, mass and evolutionary age (for each model). We also calculated an expansion velocity mean value per region, which can be compared with the mean observational expansion velocity from literature data. These results are shown in Table 1.

Table 1.
Mean values of different parameters in three regions of the HR diagram, together with their dispersion values, in brackets.
As we can see, the nebular mean radius value increases trough the different regions (for both models), according to the corresponding evolutionary phase. Concerning masses, we see that the mean value is similar in the three regions. Furthermore, regarding the expansion velocities, the results show that there is no direct relationship between this value and the evolutionary phase. In both models, the region in which we found more consistent values (on average) is the early evolutionary phase.
4. Discussion
We can obtain some conclusions from the analysis of our PNe sample. Firstly, looking at PNe location, we can conclude that most of them (about 60% of the PNe in our study) are located near the galactic plane and in the galactic centre direction (longitudes close to 0). Concerning distances, we observe that we can claim completeness up to approximately 2.3 kpc (for the general sample of 1571 PNe) even though we detected some nebulae farther than 4 kpc. It is important to note that many external factors can contribute to the difficulty to detect PNe and consequently to the incompleteness of our sample: the presence of high extinctions close to the galactic plane, low surface brightness in old nebulae (over yr) or the lack of a parallax measurement in Gaia DR2 because either the CSs are weak objects or the nebulae are too compact.
If we compare our distance estimations results with those derived by other authors (see [1] for details), we appreciate a significant agreement with those obtained from astrometric methods (USNO and HST). On the other hand, we found that distances obtained from non-LTE model fitting are in most cases overestimated and would need to be carefully reviewed.
Regarding nebular sizes, it can be noted that those PNe close to the galactic plane tend to be smaller than the rest. In general, most of them have radii larger than the typical PN adopted value of 0.1 pc (Osterbrock and Ferland 2006 [16]). In addition, if we focus on the nebular morphologies, we can conclude that around 80% of PNe are elliptical, bipolar or round.
Considering physical radii and observational expansion velocities taken from the literature, we derived the so-called kinematical ages of the nebulae. Although most of the PNe are rather young, with ages under 15,000 yr, we also found nebulae spanning ages well beyond those values (see [1] for details). From the average kinematical age value and the mean physical radius of the sample, we obtained a value for the visibility time (i.e., the amount of time elapsed since the PN was created) of the PNe population, , similar to that derived by Jacob et al. [5].
Finally, we compared the position of the CSs in the HR diagram with the new evolutionary tracks by Miller Bertolami [14] and those by Vassiliadis-Wood [15]. Models by Miller Bertolami [14] are brighter and faster than the classical ones due to the different treatment of microphysics and convection. However, the only region for which [14] provides younger ages is region 3, which corresponds to the oldest nebulae (see Table 1). It must be taken into account that we have a rather high uncertainty in the derivation of masses and ages values, and that the statistics is possibly insufficient. Despite this, the HR diagram positions of the stars provide valuable evolutionary information, and the size of the envelopes and expansion results quite agree with the evolutionary stage of the CSPNe.
Summarizing, we have confirmed that Gaia distances are compatible with previous astrometric derivations and that the location of the CSs in a HR diagram provide valuable evolutionary information when combined with typical radii of the objects and other observational properties.
Author Contributions
Conceptualization, M.M. and A.M.; software, I.G.-S.; investigation, I.G.-S., M.M. and A.M; writing–original draft preparation, I.G.-S. and M.M.; writing–review and editing, I.G.-S., M.M, A.M., A.U. and C.D. All authors have read and agreed to the published version of the manuscript.
Funding
Funding from Spanish Ministry projects ESP2016-80079-C2-2-R, RTI2018-095076-BC22, Xunta de Galicia ED431B 2018/42, and AYA-2017-88254-P is acknowledged by the authors. M.M. thanks the Instituto de Astrofísica de Canarias for a visiting stay funded by the Severo Ochoa Excellence programme. IGS acknowledges financial support from the Spanish National Programme for the Promotion of Talent and its Employability grant BES-2017-083126 cofunded by the European Social Fund.
Acknowledgments
This work has made use of data from the European Space Agency (ESA) Gaia mission and processed by the Gaia Data Processing and Analysis Consortium (DPAC). This research has made use of the SIMBAD database, HASH database, and the ALADIN applet.
Conflicts of Interest
The authors declare no conflict of interest. The funders had no role in the design of the study; in the collection, analyses, or interpretation of data; in the writing of the manuscript, or in the decision to publish the results.
Abbreviations
The following abbreviations are used in this manuscript:
| PN | Planetary Nebula |
| CS | Central Star |
| DR2 | Data Release 2 |
| GAPN | Golden Astrometry Planetary Nebulae |
| HASH | Hong Kong/AAO/Strasbourg/ |
| HR | Hertzsprung-Russel |
| MS | Main Sequence |
| WD | White Dwarf |
References
- González-Santamaría, I.; Manteiga, M.; Manchado, A.; Ulla, A.; Dafonte, C. Properties of central stars of planetary nebulae with distances in Gaia DR2. Astron. Astrophys. 2019, 630, A150. [Google Scholar] [CrossRef]
- Lindegren, L.; Hernandez, J.; Bombrun, A.; Klioner, S.; Bastian, U.; Ramos-Lerate, M.; de Torres, A.; Steidelmuller, H.; Stephenson, C.; Hobbs, D.; et al. Gaia Data Release 2. The astrometric solution. Astron. Astrophys. 2018, 616, A2. [Google Scholar] [CrossRef]
- Bailer-Jones, C.A.L.; Rybizki, J.; Fouesneau, M.; Mantelet, G.; Andrae, R. Estimating Distance from Parallaxes. IV. Distances to 1.33 Billion Stars in Gaia Data Release 2. Astron. J. 2018, 156, 58. [Google Scholar] [CrossRef]
- Frew, D.J. Planetary Nebulae in the Solar Neighbourhood: Statistics, Distance Scale and Luminosity Function. Ph.D. Thesis, Macquarie University, Sydney, Australia, 2008. [Google Scholar]
- Jacob, R.; Schoenberner, D.; Steffen, M. The evolution of planetary nebulae. VIII. True expansion rates and visibility times. Astron. Astrophys. 2013, 558, A78. [Google Scholar] [CrossRef]
- Kaler, J.B.; Lutz, J.H. Dust-distances to planetary nebulaeæ. Publ. Astron. Soc. Pac. 1985, 97, 700–706. [Google Scholar] [CrossRef]
- Ciardullo, R.; Bond, H.E.; Sipior, M.S.; Fullton, L.K.; Zhang, C.Y.; Schaefer, K.G. A HUBBLE SPACE TELESCOPE Survey for Resolved Companions of Planetary Nebula Nuclei. Astron. J. 1999, 118, 488–508. [Google Scholar] [CrossRef][Green Version]
- Tylenda, R.; Acker, A.; Stenholm, B.; Gleizes, F.; Raytchev, B. The B and V magnitudes of the central stars of planetary nebulae. Astron. Astrophys. 1991, 89, 77–90. [Google Scholar]
- Tylenda, R.; Acker, A.; Stenholm, B.; Koeppen, J. The extinction constants for galactic planetary nebulae. Astron. Astrophys. 1992, 95, 337–354. [Google Scholar]
- Moreno-Ibáñez, M.; Villaver, E.; Shaw, R.A.; Stanghellini, L. Compact planetary nebulae in the Galactic disk: Analysis of the central stars. Astron. Astrophys. 2016, 593, A29. [Google Scholar] [CrossRef]
- Napiwotzki, R. Spectroscopic investigation of old planetaries. IV. Model atmosphere analysis. Astron. Astrophys. 1999, 350, 101–119. [Google Scholar]
- Zanstra, H. Temperatures of Stars in Planetary Nebulæ. Nature 1928, 121, 790. [Google Scholar] [CrossRef]
- Vacca, W.D.; Garmany, C.D.; Shull, J.M. The Lyman-Continuum Fluxes and Stellar Parameters of O and Early B-Type Stars. Astrophys. J. 1996, 460, 914–931. [Google Scholar] [CrossRef]
- Bertolami, M.; Marcelo, M. New models for the evolution of post-asymptotic giant branch stars and central stars of planetary nebulae. Astron. Astrophys. 2016, 588, A25. [Google Scholar] [CrossRef]
- Vassiliadis, E.; Wood, P.R. Post–Asymptotic Giant Branch Evolution of Low- to Intermediate-Mass Stars. Astrophys. J. Suppl. Ser. 1994, 92, 125–144. [Google Scholar] [CrossRef]
- Osterbrock, D.E.; Ferland, G.J. Astrophysics of Gaseous Nebulae and Active Galactic Nuclei; University Science Books: Sausalito, CA, USA, 2006. [Google Scholar]
© 2020 by the authors. Licensee MDPI, Basel, Switzerland. This article is an open access article distributed under the terms and conditions of the Creative Commons Attribution (CC BY) license (http://creativecommons.org/licenses/by/4.0/).