1. Introduction
BL Lacertae at z = 0.069 [
1] is a high energy blazar [
2] that is detectable at all wavelengths, from radio waves to high energy γ-rays. Blazars are highly variable BL Lac objects, i.e., AGN with relativistic beaming properties. Indeed, the high frequency component of the spectrum is often attributable to Compton scattering—Doppler boosting from relativistic electrons of lower energy spectral components.
This object is also a microvariable source as well. Such a source exhibits rapid, low amplitude variation, and is sometimes called intra-day variability. Our source produces very high cadence variations in the optical range, a phenomenon which has been studied by many, but is not represented by a single accepted model. What has been addressed is that relativistic jets are an important contribution to such variability [
3,
4].
From this, we believe that there are several relativistic components aligned closely to the line of sight for this object. Indeed, the challenge is to find and describe the relativistic components from an optical light curve—something we wish to accomplish here. We use a geometrical beaming model as an alternative to intrinsically occurring variations in intensity by other means.
2. Observations
Observational data were collected over seven nights of BL Lac. All images were taken with the Johnson–Cousins R filter, and with the Remote Observatory for Variable Object Research (ROVOR) robotic telescope of Brigham Young University [
5]. This automated telescope is a 0.4 m
f/9 optical telescope is in central Utah, and was constructed for rapid observations. The telescope uses an Apogee Ap47p camera with a 1024 × 1024 13 µm pixel Marconi 47-10 CCD detector. All images were binned 2 × 2 before data reduction. The data logs are shown in
Table 1 below, indicating the date of observation, number of data points, time duration, secular drift, and number of identifiable flares of BL Lac for each night.
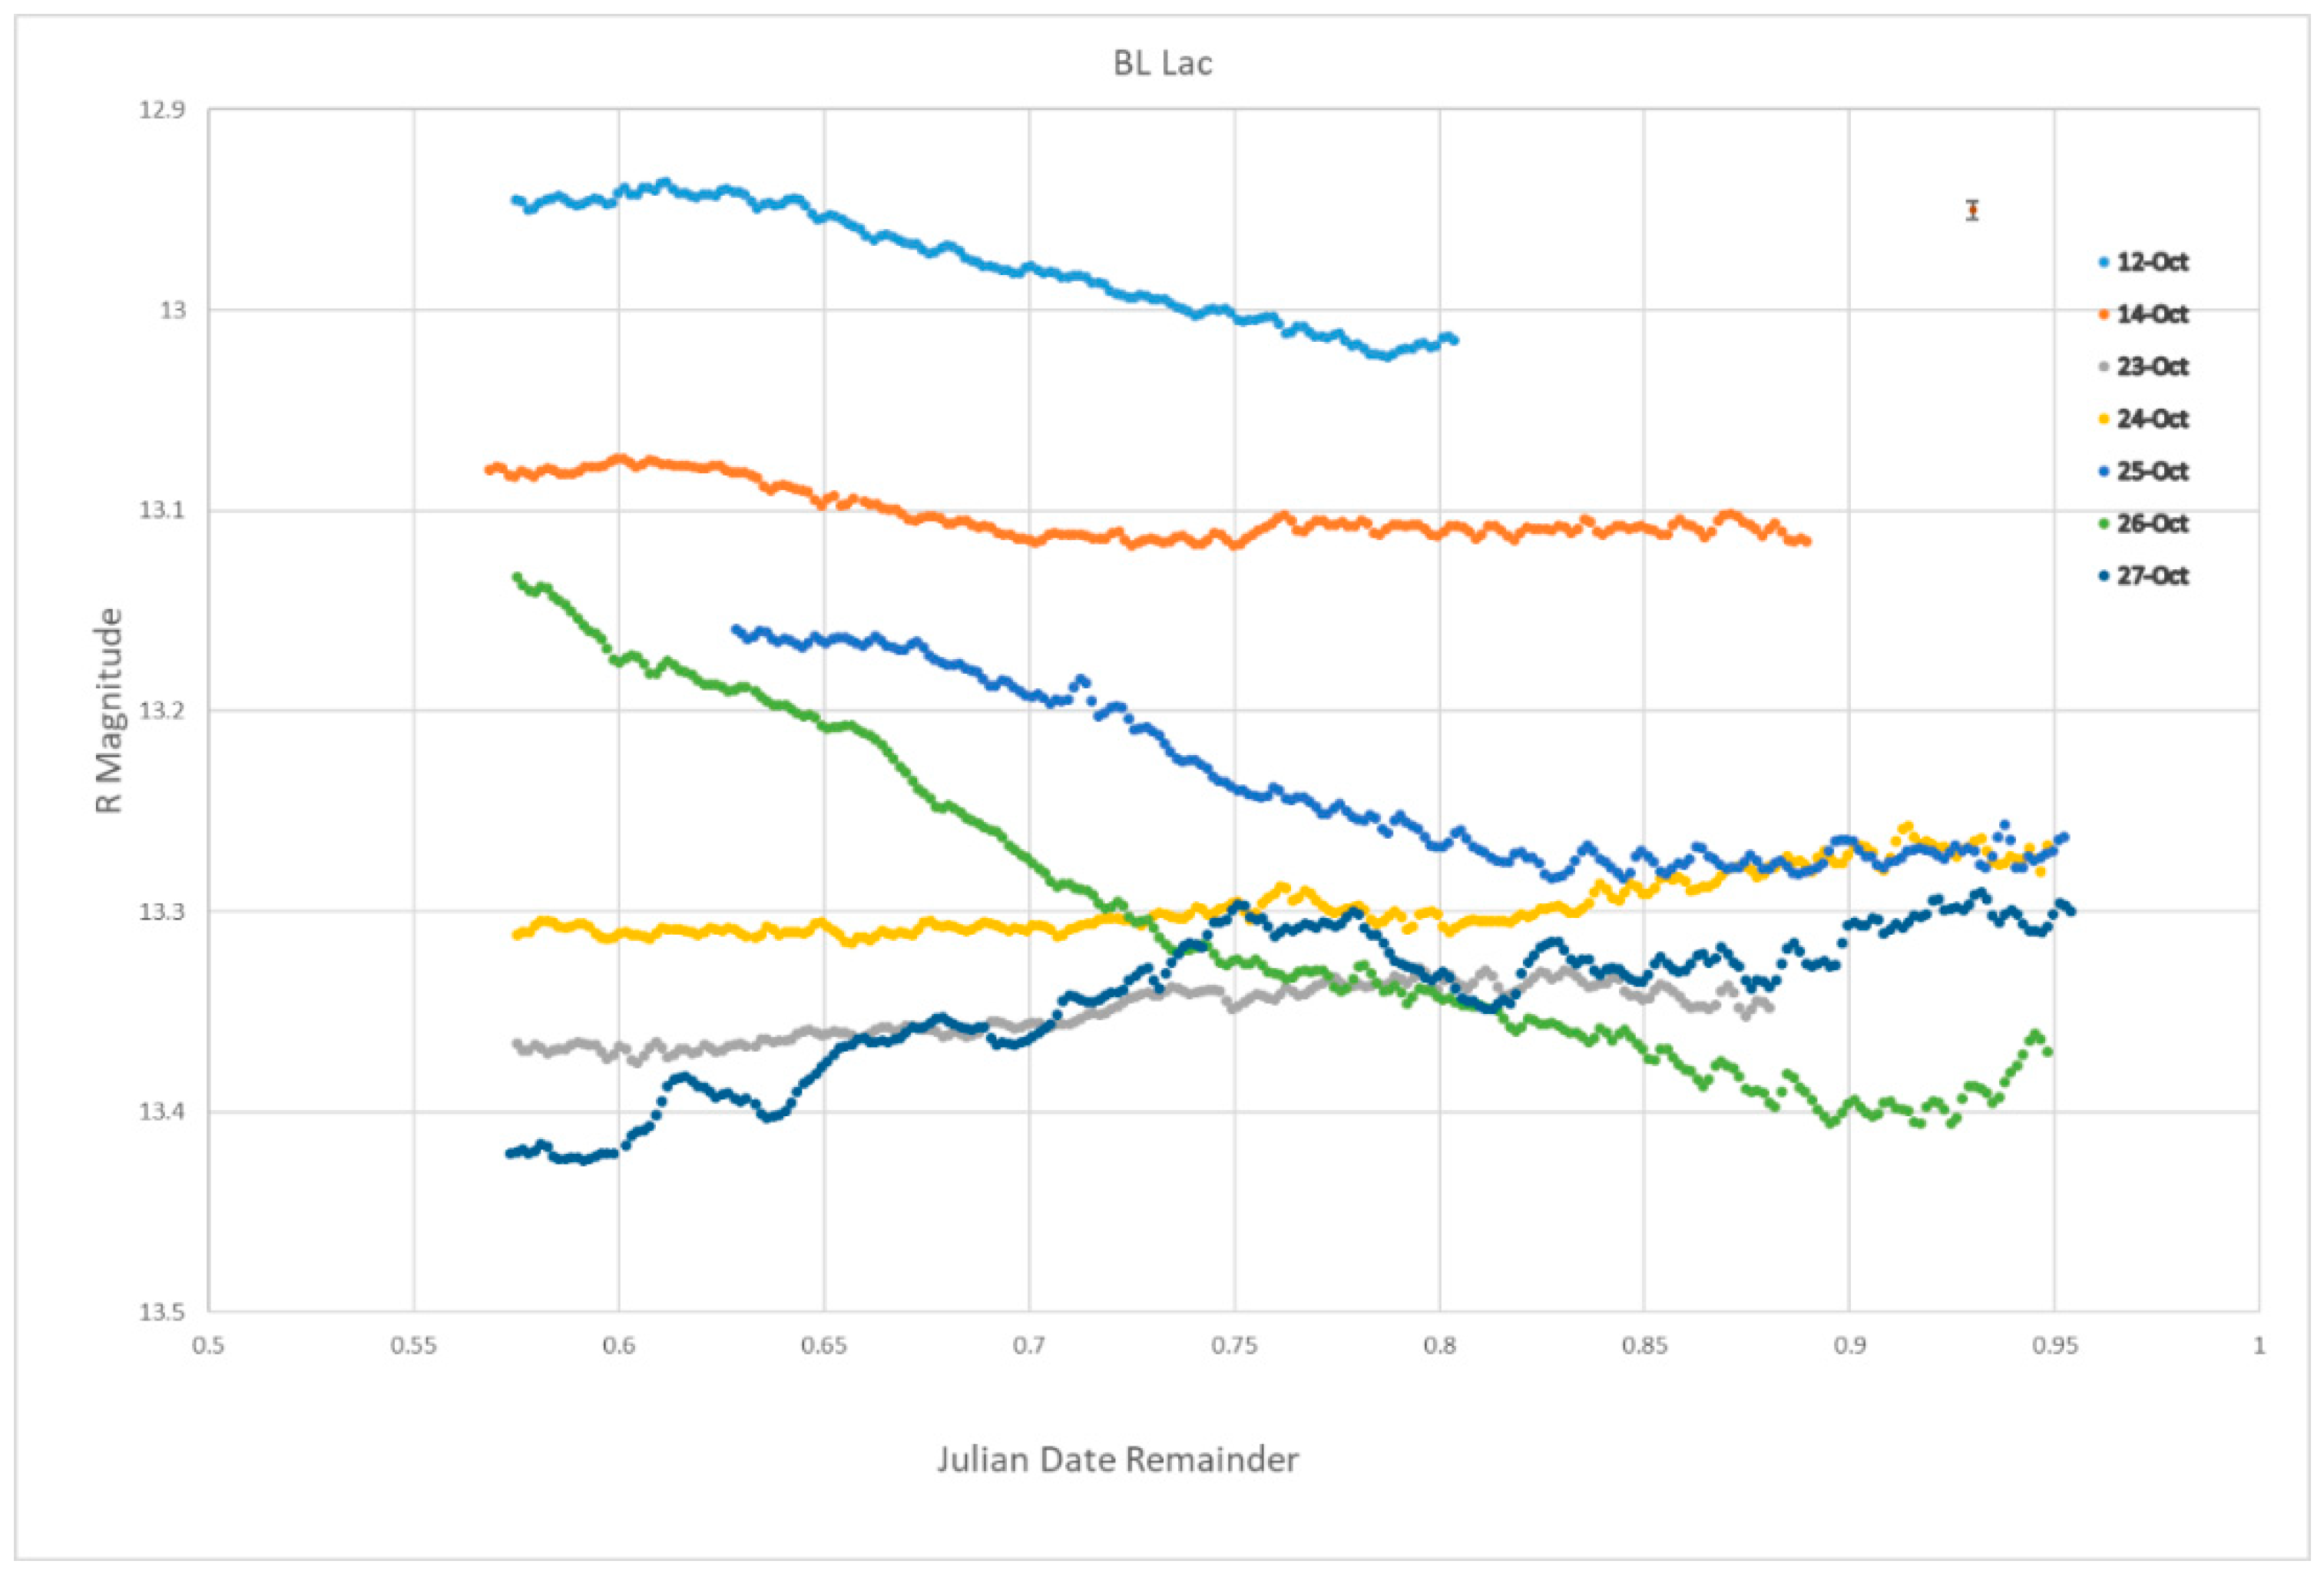
In
Figure 1 below, we see all seven nights displayed in magnitude form. One can see from inspection that each night is very different from each other, and that some display a considerable amount of secular drift, that is, the difference in magnitude between the beginning and the end of the night.
All images were reduced using
Mira Pro 7.0 commercial image processing software [
6]. Aperture photometry was performed using an aperture of 10 arcsec diameter. The finding chart and comparison star magnitudes were taken from Smith, et al. [
7]. All data are available upon request.
With aperture photometry, on a given frame, after background subtraction, the aperture flux of the variable is compared to the flux of each comparison star. In this way, changes in transparency (local conditions as well as changes in air mass) should not affect the values. There are secondary effects, however, so to take those into account, the fluxes of several comparison stars are also compared to each other. We plot in
Figure 2 both the variability of the source, as well as the variability of two selected comparison stars to each other.
Previous work by Clements and Carini [
8] shows similar activity of BL Lac. In particular, they show nightly variations ranging from 0.1 to 0.6 magnitude, which is similar to the activity shown above in
Figure 1.
3. Analysis
We converted apparent magnitude values to flux values to help us with our later calculations. Then, we applied standard smoothing and curve fitting algorithms. We evaluated the light curve, and scrutinized it for micro-outbursts. The flux, apart from major variability, has a standard deviation, σ, after smoothing, of 0.5%. Any flux more than 1.0% greater than the median value for local quiescence was deemed to be a micro-outburst.
Figure 2 shows a sample of smoothed data (weighted boxcar smoothing) in apparent magnitude for BL Lac.
Long-term variability of BL Lac is well documented [
9] and can vary by two orders of magnitude in brightness (five magnitudes) at shorter wavelengths. Additionally, shorter-term variability over the course of days and weeks is shown in
Figure 1 above. The generally accepted model of such variability regards the Doppler boosting from a plasma jet pointed almost directly towards the observer. What we wish to address in this paper as well, is the very high cadence variability as also shown in
Figure 1, one night of which is shown in considerably more detail in
Figure 2 above.
We use a strictly geometrical model to analyze the data. The advantage of our model is that we only need to consider a minimum number of free parameters. Geometric models similar to the one we present have been considered in the past. For instance, a shifting jet is considered in the long-term activity of CTA 102 [
10]. In our case, however, due to the microvariable nature of our source, we are considering several relativistic components, but with differing angles to the line of sight. Since we are dealing with the prototype BL Lac object which necessarily involves Doppler boosting, in this model we assume the slowly varying portion of each light curve is composed mainly of boosted emission from true quiescence, which we determine from the historical light curve, as having an apparent magnitude in R of 15.99 [
9]. Thus, the emission is already boosted before we even analyze the microvariability. The microflares then represent a small and temporary change in angle to the line of sight from the original angle, but this time of independent optical components (plasmons).
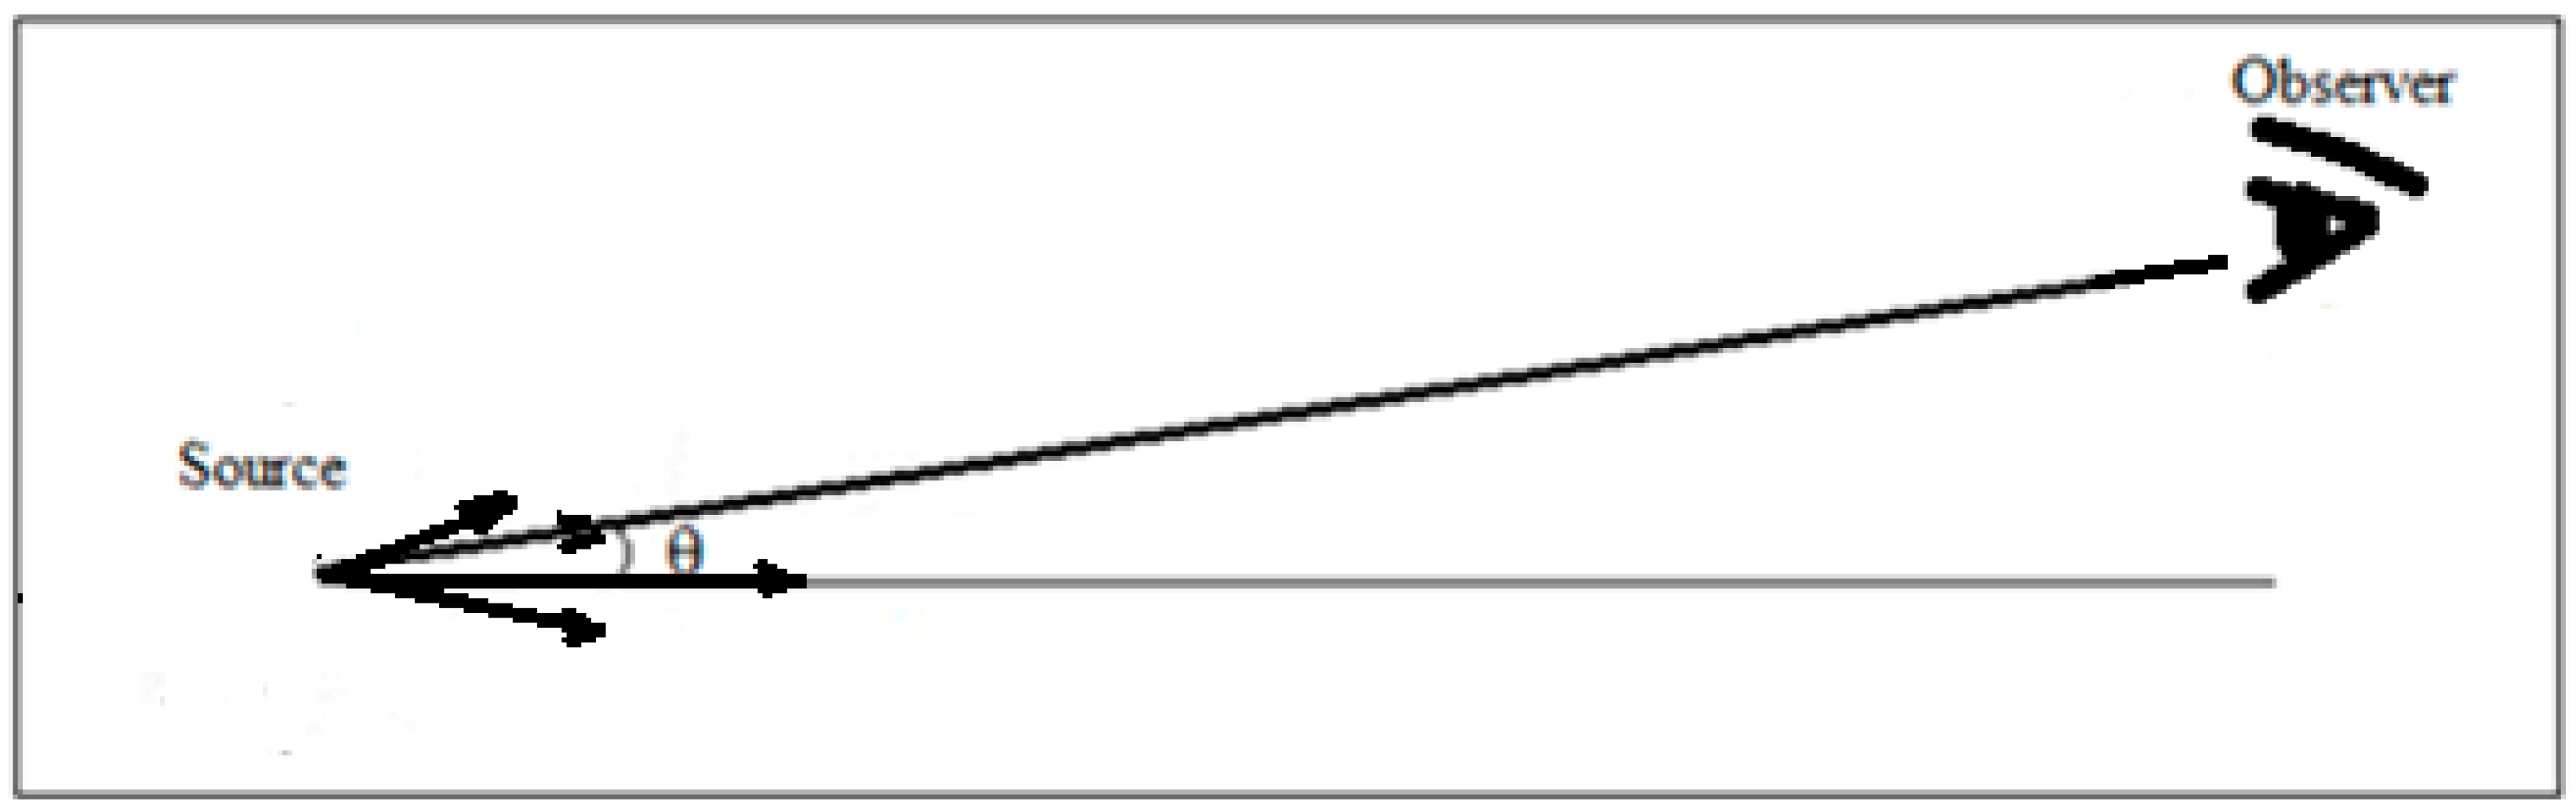
We follow along the lines of the detailed calculations of jet dynamics that have been previously applied to Mrk 501 [
11], but now as applied to the high cadence, microvariability part of the model for BL Lac. The geometry of this model is depicted in
Figure 3 as shown below.
From this model, we can then calculate those angles of the microflares from the following equations:
where
and
M represents the luminosity magnification as seen from the laboratory frame, δ is the Doppler factor, and β is the Lorentz factor, respectively.
4. Results
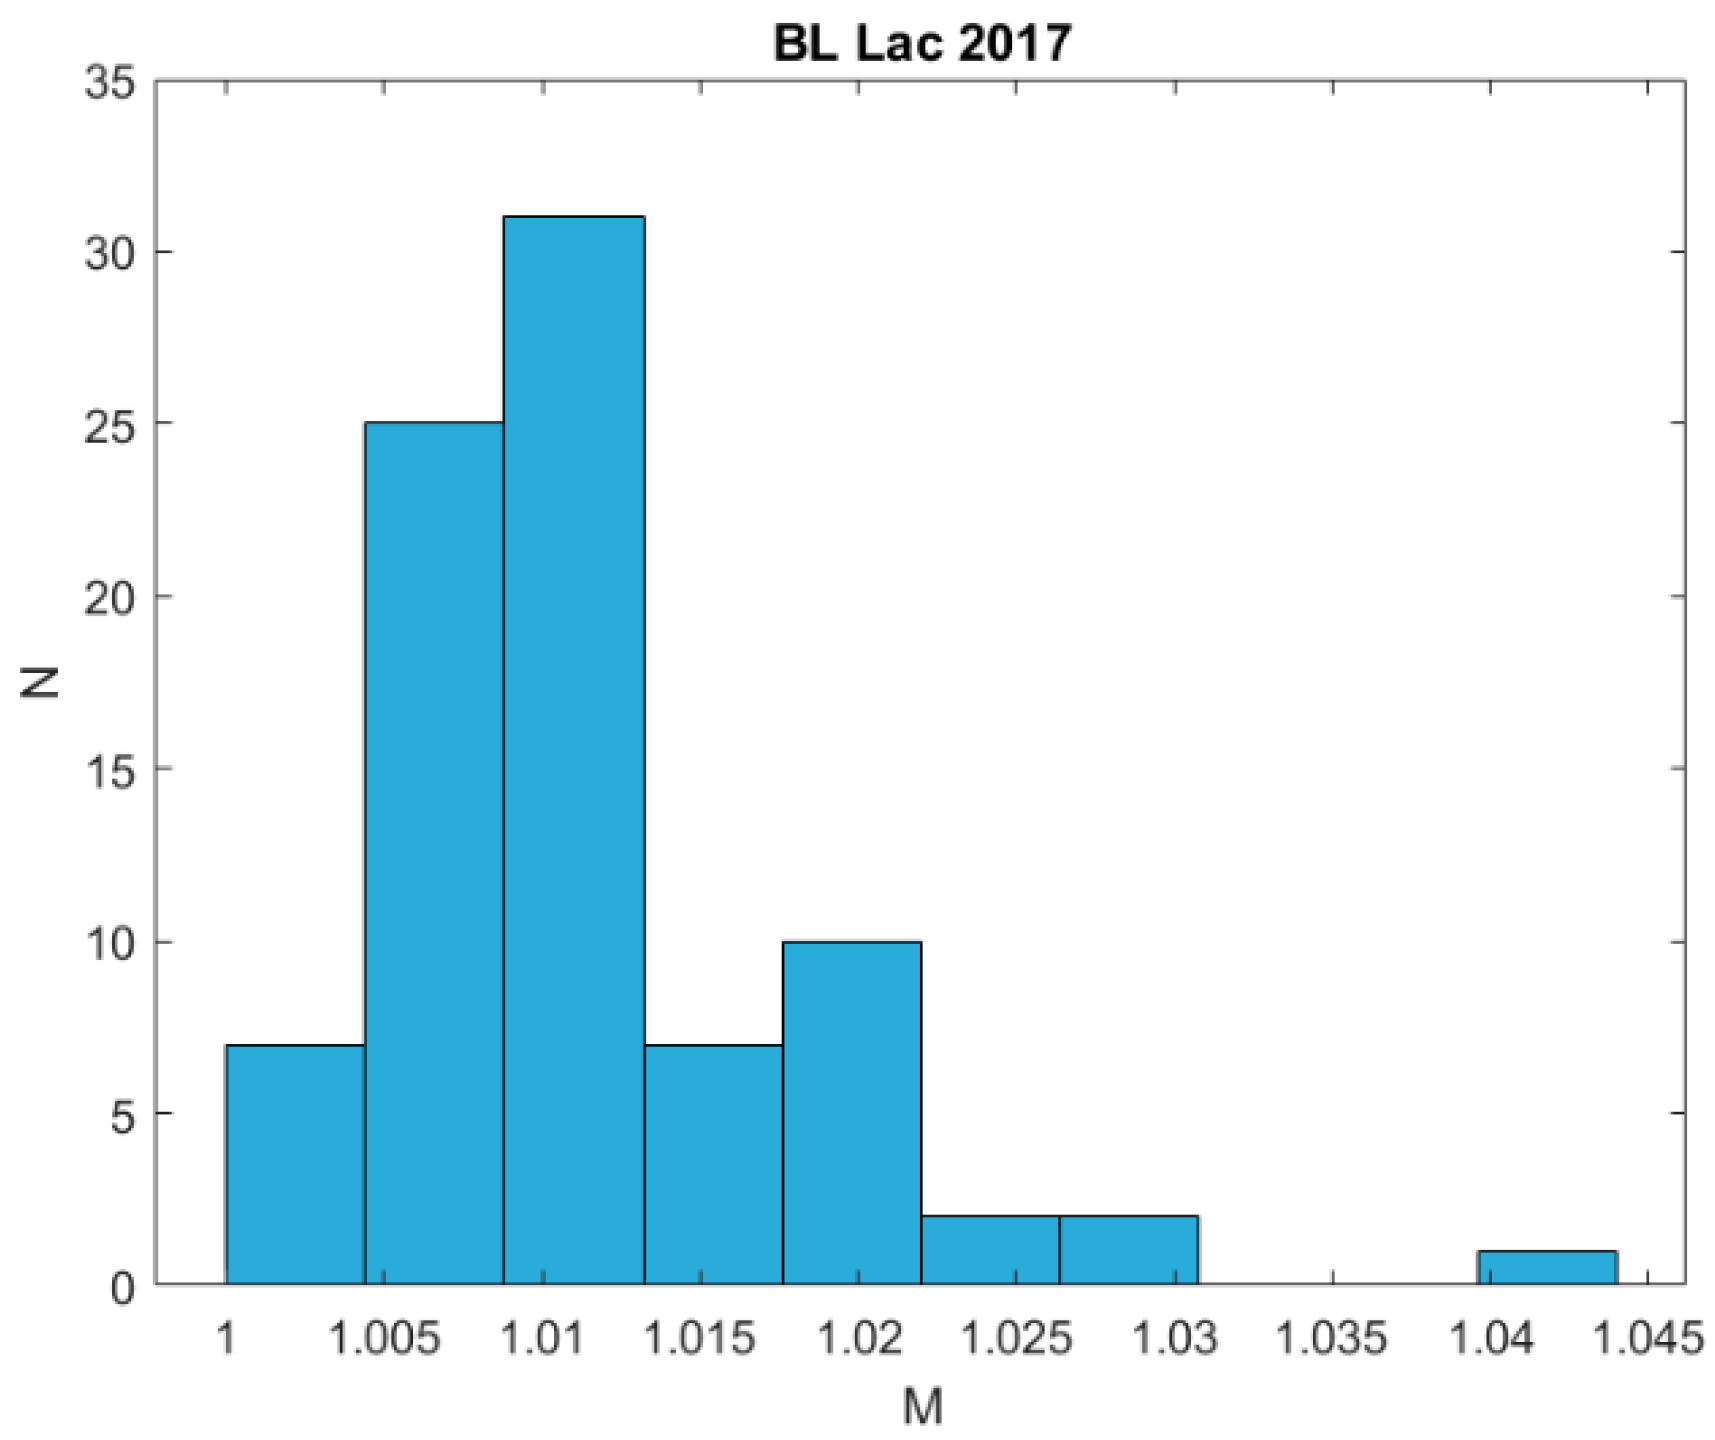
The statistical results of analyzing all the very high-quality October 2017 data of BL Lac microvariability are shown in
Figure 4 and
Figure 5 below. We take our magnification
M from a baseline as taken from our own observations. Indeed, we are not dealing with the angle to the line of sight to the blazar itself, which would be a magnification taken from quiescence (R = 15.99) [
9], but rather of plasmon ejection from an established but slowly varying line of sight, which we hypothesize is responsible for the microvariability, implying rather small angles.
Figure 4 shows the distribution of the luminosity magnification,
M, of the ensemble of microbursts presented, here in histogram form. One notices a roughly Gaussian distribution, as may be expected, with a single outlier as a comparatively very bright microburst.
We also show in
Figure 5 below the distribution of the angle deviation of the optical components responsible for heightened microvariable activity. Here notice that we have a distribution that is skewed to the larger angles. (This includes, of course, that outlier that was presented in
Figure 4.) The angle of deviation ranges from essentially zero to around 0.16 degrees. Even a small change in angle, which we are now calling Δθ, can be responsible for a measurable microburst.
Let us compare our results using the aforementioned jet model on BL Lac, to the results of using the same model as applied to a very different object, Mrk 501 [
11]. The objects are quite different (one is a BL Lac object while the other is an optical galaxy); they also have very different light curves. The cadence of BL Lac itself is of much higher frequency and much lower amplitude than as seen for Mrk 501. Nevertheless, the histograms for the distribution of luminosity magnification
M seem rather similar. This would validate, at least to some degree, the hypothesis that the cause of the underlying variability for each object is the same, namely Doppler boosting of jets and beams directed close to the line of sight.
5. Conclusions
BL Lacertae is a blazar that has been extensively studied, and has displayed considerable variability at many time scales. Indeed, this object has become the prototype for an entire class of AGN, so understanding its behavior is very important. Multiband microvariability observations have been made by others [
8,
13]. Indeed, it has been observed in particular by Bhatta and Webb [
13] that when brighter, BL Lac becomes bluer, and furthermore that emission is highly correlated across the various optical bands. Our observations were made in only one filter, R, but from previous work [
13], we may assume that our documented outbursts were also well represented at other wavelengths. Here we add to the general understanding of this object by presenting very high-quality data sets (small relative error in brightness, long strings of data, and excellent temporal resolution), and analyzing these sets in terms of a simple jet model of multiple components.
We find that with very few assumptions, a plausible model can be made for its optical light curve, particularly for its microvariability. This is not to say that other alternatives are not possible, but simply that this one is a reasonable one to consider. Indeed, other models such as magnetic reconnection [
14] may be an important component for longer term variability. In comparison with Mrk 501, when using the same jet model, we obtain very similar results in terms of distribution of luminosity enhancement, despite the vast differences in the extent and kind of variability. Since BL Lac is well studied and is the prototype for an entire subclass of objects, it is important that we try to understand its behavior. We hope that by further research of BL Lacertae itself, we can shed light on this very important subgroup of AGN.


