Abstract
Radio continuum emission of planetary nebulae is a rich source of information about their structure and physical parameters. Although radio emission is well studied, planetary nebulae show higher spectral indices than expected for homogeneous sphere. A few competing models exist in the literature to explain this discrepancy. We propose that it is related to non-spherical morphology of most of planetary nebulae.
Keywords:
planetary nebulae; AGB and post-AGB; interstellar medium; radio continuum; winds; outflows 1. Introduction
Planetary nebulae (PNe) mark the last phase of evolution of stars with the initial mass in the range of ∼1–8 M prior to descending to white dwarf cooling track. PNe shells have been studied in radio frequencies for over seven decades now. Continuum radio emission in PNe originates predominantly from thermal free-free emission of electrons [1,2]. Short variability timescale and negative spectral index suggested non-thermal origin of radio emission for a few young PNe [3].
A lot of PNe show 5 GHz/1.4 GHz spectral index higher than a model of a homogeneous spherical shell. Reference [4] introduced a model in which the nebular image consists of regions having two different values of optical thickness to fit the observations. On the other hand, Reference [5] claimed that at least 10–20% of PN shells are associated with strong radial density gradients, which also produces higher 5 GHz/1.4 GHz flux ratio with respect to homogeneous model.
Reference [6] showed that the strong radial density gradient could not explain the observed 5 GHz/1.4 GHz spectral index. They proposed that the observed spectral index is related to morphology, or results from temperature variations within a nebula. Here, we further investigate the observed spectral index in PNe.
2. Methodology
The radio flux from a source with a uniform surface brightness distribution (hereinafter referred to as uniform model) covering a solid angle is
and the optical thickness of the nebula
Reference [7] where is the electron temperature, and are proton and electron density, respectively. The Gaunt factor, , is given by [8]. The emission measure is integrated along the line of sight.
determines the turnover frequency of the spectrum for which ∼ 1. The optically thin spectrum has a spectral index of , after applying an analytical approximation for , and is proportional to . The optically thick spectrum has a spectral index of 2 and is proportional to . Additionally, scales the absolute flux in the whole range of the spectrum.
Brightness temperature at 5 GHz can be defined as
where is the angular diameter in arcsec and radio flux at 5 GHz in mJy. Brightness temperature is a function of optical thickness for uniform surface brightness emission:
We studied the observed 5 GHz/1.4 GHz spectral index as a function of using the same dataset as in [6], combining fluxes measured by single-dish instruments and interferometers. The fluxes from single-dish instruments showed different results from interferometer measurements [4]. However, this applied to large PNe in some data sets and did not affect the results significantly [6].
We used optical diameters from [9]. Optical H and radio free-free emission should represent the same region. In the case of non-spherical PNe, we adopted the geometric mean of the two axes, which we used to compute the brightness temperature at 5 GHz. Radio diameters were available for about half of PNe, observed with interferometers. However, these measurements are unreliable for small PNe [4]. For large PNe, radio diameters are consistent with optical diameters. We used from optical spectra [10].
The spectral index rises steeply at 2–2.5 (Figure 1). For an optically thick source, approaches electron temperature and the spectral index approaches 2. The upper right corner of the Figure 1 is populated by young and dense PNe, whereas evolved PNe have low and populate the lower left corner. For most PNe, the spectral index is higher than predicted by the uniform model for the same (Figure 1).
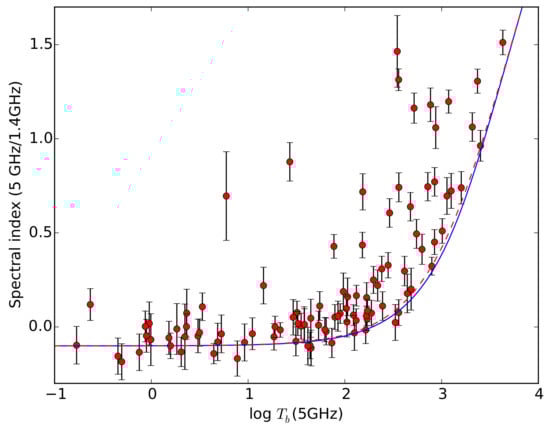
Figure 1.
The 5 GHz to 1.4 GHz spectral index as a function of brightness temperature at 5 GHz for uniform (blue line) and spherical models (red dashed line) for = 10,000 K.
In the next step, we modeled spectra of individual PNe using derived brightness temperatures and available radio continuum fluxes. The uniform model gives very similar results to a model of homogeneous sphere (see, e.g., Figure 1), so, for simplicity, we used the former one, though it is less realistic. The only free parameter was . All the spectra were consistent with free–free emission mechanism. However, the uniform model cannot fit the turnover frequency observed for lowest frequencies in the majority of PNe. To reproduce a non-negligible optical thickness at the lowest frequencies, a higher value of is required in most PNe. However, higher results in exceeding the observed flux in the optically thin part of the spectrum.
In order to scale down the flux, non-uniform brightness distribution is needed, with part of the nebula with higher dominating the total radio flux, or lower in the outermost parts of a PN. However, this latter possibility seems to be ruled out by spatially resolved optical spectroscopy [11].
We introduced a factor in Equation (1) so that we could increase (and thus optical thickness) to achieve a good fit of the turnover frequency and simultaneously scale down the absolute flux:
where the fitted parameters are and . In this model, is the ratio of the emitting area to area of zero surface brightness within the PN. Thus, only part of the solid angle contributes to the total flux of the PN, while has zero contribution. The emitting area is smaller but has higher optical thickness compared to a uniform model. A new model fits well for both turnover frequency and absolute flux. Reference [6] presents fits for individual PNe.
The parameter depends on the surface brightness distribution of a PN. PNe with ≈ 0 can be fit equally well with a uniform or spherical model. However, almost all PNe require . ≈ 1 indicate that a small part of the PN with high dominates the radio flux. This cannot be simply the central part of the PN closest to the central star. Otherwise, the measured radio diameter would be smaller and represents this central region. Thus, radio emission can be distributed in a bright rim (e.g., cylindrical shell projected along its axis), or there are small scale blobs distributed over the entire solid angle of the PN.
We searched for a somewhat more realistic model than described by Equation (5). We considered a case of strong limb brightening in a projected spherical shell. However, the optical thickness of the limb brightened rim still appeared too low to reproduce the turnover frequency, even for a very thin shell.
In order to explain the observed large limb brightening in an optical range, Reference [12] applied a model of a prolate ellipsoidal shell (PES). Reference [13] showed that this model can successfully explain variety of morphologies. This tempted us to explore this model for our purposes. In this case dense, the limb brightened region with high could make a major contribution to the radio flux.
The inner and outer shell are defined as ellipsoids with minor and major axes of and . is inversely proportional to the inner radius in each direction. Due to the large parameter space (inclination angle i, ratio, t, ), we did not use the PES model to fit individual PNe, but to fit spectral indices and brightness temperatures. The PES model explains the observed spectral indices of PNe better than the spherical model, but, for some PNe, it would require extreme parameter values (Figure 2).
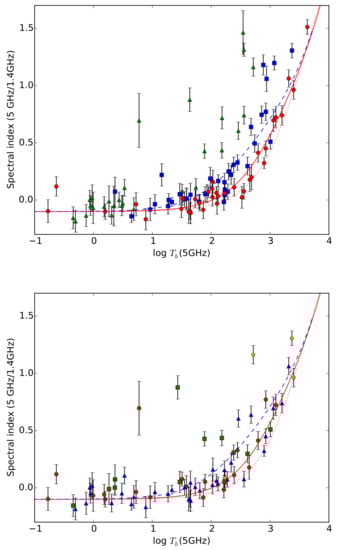
Figure 2.
The 5 GHz to 1.4 GHz spectral index as a function of brightness temperature at 5 GHz. The solid red line and blue dashed line denote a PES model with and and , respectively. The dotted line marks the spherical model. In the top figure, PNe are split into three groups with respect to the parameter: (red circles), (blue squares), and (green triangles). In the bottom figure, PNe are split according to morphological type: spherical (red circles), elliptical (blue triangles), bipolar (green squares), and multipolar PNe (yellow pentagons) (bottom).
The PNe with high brightness temperature are usually compact. The diameters are less reliable. Uncertainty in the determination of propagates to . In order to reproduce the observed spectral index—brightess temperature diagram and diameters should be systematically underestimated. This would decrease and shift PNe leftward from the model.
We checked if the position of the PNe in the diagram correlates with morphological type. We used morphological types from [14,15,16]. The location of various morphological types appears to be correlated with position in a spectral index— diagram.
Multipolar PNe are only seen among relatively high brightness temperatures, thus they are represented only among young PNe. Bipolar PNe are more likely to show the spectral index excess from other types of PNe. Perhaps, bipolar PNe show more complicated brightness distribution—the radio flux may be dominated by compact core (which becomes optically thick), and the lobes give less contribution to the total flux but are still detected in radio images (otherwise, observed radio diameters would be much lower from optical diameters, as they would only refer to the core, which is not the case). Unexpectedly, the model also failed to fit some PNe classified as round. This suggests that they have non-spherical morphologies producing a projected circular appearance. Confirmation would require morpho-kinematical analysis.
3. Discussion
We confirm that uniform and spherical models cannot fit the observed radio spectra and brightness temperatures of most of the PNe. Spherical, homogeneous PNe appear to be very rare, even among PNe having circular appearances. The PES model can explain the observed spectral indices of a some of PNe. However, it cannot reproduce most of the PNe with or bipolar PNe. For these PNe, most likely, a small part of the nebula with high contributes most of the radio flux.
4. Conclusions
Radio continuum fluxes and diameters are not sufficient to definitely solve the problem. Fitting observed radio brightness distribution of individual PNe, especially the ones characterized with large excess of the spectral index with respect to the uniform model, would certainly reduce ambiguities.
Author Contributions
M.H. performed the analysis and wrote the paper. P.A.M.v.H. and A.Z. commented on the paper and contributed to the data interpretation. K.Ś., A.K., L.B., B.D. and A.Z. commented on the paper.
Funding
We gratefully acknowledge financial support from National Science Centre, Poland, Grant No. 2016/23/B/ST9/01653.
Conflicts of Interest
The authors declare no conflict of interest.
References
- Pazderska, B.M.; Gawroński, M.P.; Feiler, R.; Birkinshaw, M.; Browne, I.W.A.; Davis, R.; Kus, A.J.; Lancaster, K.; Lowe, S.R.; Pazderski, E.; et al. Survey of planetary nebulae at 30 GHz with OCRA-p. Astron. Astrophys. 2009, 498, 463. [Google Scholar] [CrossRef]
- Chhetri, R.; Ekers, R.D.; Kimball, A.; Miszalski, B.; Cohen, M.; Manick, R. High radio frequency sample of bright planetary nebulae in the Southern hemisphere detected in the AT20G survey. Mon. Not. R. Astron. Soc. 2007, 382, 1607. [Google Scholar] [CrossRef]
- Suárez, O.; Gómez, J.F.; Bendjoya, P.; Miranda, L.F.; Guerrero, M.A.; Uscanga, L.; Green, J.A.; Rizzo, J.R.; Ramos-Larios, G. Time-variable Non-thermal Emission in the Planetary Nebula IRAS 15103-5754. Astrophys. J. 2015, 806, 105. [Google Scholar] [CrossRef]
- Siódmiak, N.; Tylenda, R. An analysis of the observed radio emission from planetary nebulae. Astron. Astrophys. 2001, 373, 1032–1042. [Google Scholar] [CrossRef]
- Phillips, J.P. Density gradients in Galactic planetary nebulae. Mon. Not. R. Astron. Soc. 2007, 378, 231. [Google Scholar] [CrossRef]
- Hajduk, M.; van Hoof, P.A.; Śniadkowska, K.; Krankowski, A.; Błaszkiewicz, L.; Dąbrowski, B.; Zijlstra, A.A. Radio observations of planetary nebulae: No evidence for strong radial density gradients. Mon. Not. R. Astron. Soc. 2018, 479, 4931. [Google Scholar] [CrossRef]
- Olnon, F.M. Thermal bremsstrahlung radiospectra for inhomogeneous objects, with an application to MWC 349. Astron. Astrophys. 1975, 39, 217. [Google Scholar]
- Van Hoof, P.A.M.; Williams, R.J.R.; Volk, K.; Chatzikos, M.; Ferland, G.J.; Lykins, M.; Porter, R.L.; Wang, Y. Accurate determination of the free-free Gaunt factor—I. Non-relativistic Gaunt factors. Mon. Not. R. Astron. Soc. 2014, 444, 420. [Google Scholar] [CrossRef]
- Frew, D.J.; Parker, Q.A.; Bojičić, I.S. The Hα surface brightness-radius relation: A robust statistical distance indicator for planetary nebulae. Mon. Not. R. Astron. Soc. 2016, 455, 1459. [Google Scholar] [CrossRef]
- Cahn, J.H.; Kaler, J.B.; Stanghellini, L. A catalogue of absolute fluxes and distances of planetary nebulae. Astron. Astrophys. Suppl. Ser. 1992, 94, 399. [Google Scholar]
- Sandin, C.; Schönberner, D.; Roth, M.M.; Steffen, M.; Böhm, P.; Monreal-Ibero, A. Spatially resolved spectroscopy of planetary nebulae and their halos. I. Five galactic disk objects. Astron. Astrophys. 2004, 486, 545. [Google Scholar] [CrossRef]
- Masson, C.R. On the structure of ionization-bounded planetary nebulae. Astrophys. J. 1990, 348, 580. [Google Scholar] [CrossRef]
- Aaquist, O.B.; Kwok, S. Radio Morphologies of Planetary Nebulae. Astrophys. J. 1996, 462, 813. [Google Scholar] [CrossRef]
- Phillips, J.P. The relation between elemental abundances and morphology in planetary nebulae. Mon. Not. R. Astron. Soc. 2003, 340, 883. [Google Scholar] [CrossRef]
- Stanghellini, L.; Villaver, E.; Manchado, A.; Guerrero, M.A. The Correlations between Planetary Nebula Morphology and Central Star Evolution: Analysis of the Northern Galactic Sample. Astrophys. J. 2002, 576, 285. [Google Scholar] [CrossRef]
- Sahai, R.; Morris, M.R.; Villar, G.G. Young Planetary Nebulae: Hubble Space Telescope Imaging and a New Morphological Classification System. Astron. J. 2011, 141, 134. [Google Scholar] [CrossRef]


© 2018 by the authors. Licensee MDPI, Basel, Switzerland. This article is an open access article distributed under the terms and conditions of the Creative Commons Attribution (CC BY) license (http://creativecommons.org/licenses/by/4.0/).