CHANG-ES: XVIII—The CHANG-ES Survey and Selected Results

 , , ,
, , ,
Abstract
1. Introduction to the CHANG-ES Survey
1.1. Motivation
1.2. Techniques and Data Products
2. CHANG-ES Highlights
2.1. AGNs
2.1.1. A Remarkable Nearby TDE: NGC 4845
2.1.2. Circular Polarization
2.1.3. Hidden AGN-Related Activity Revealed
2.1.4. Frequency of AGNs
2.2. Edge-on Disks and Thermal/Nonthermal Separation
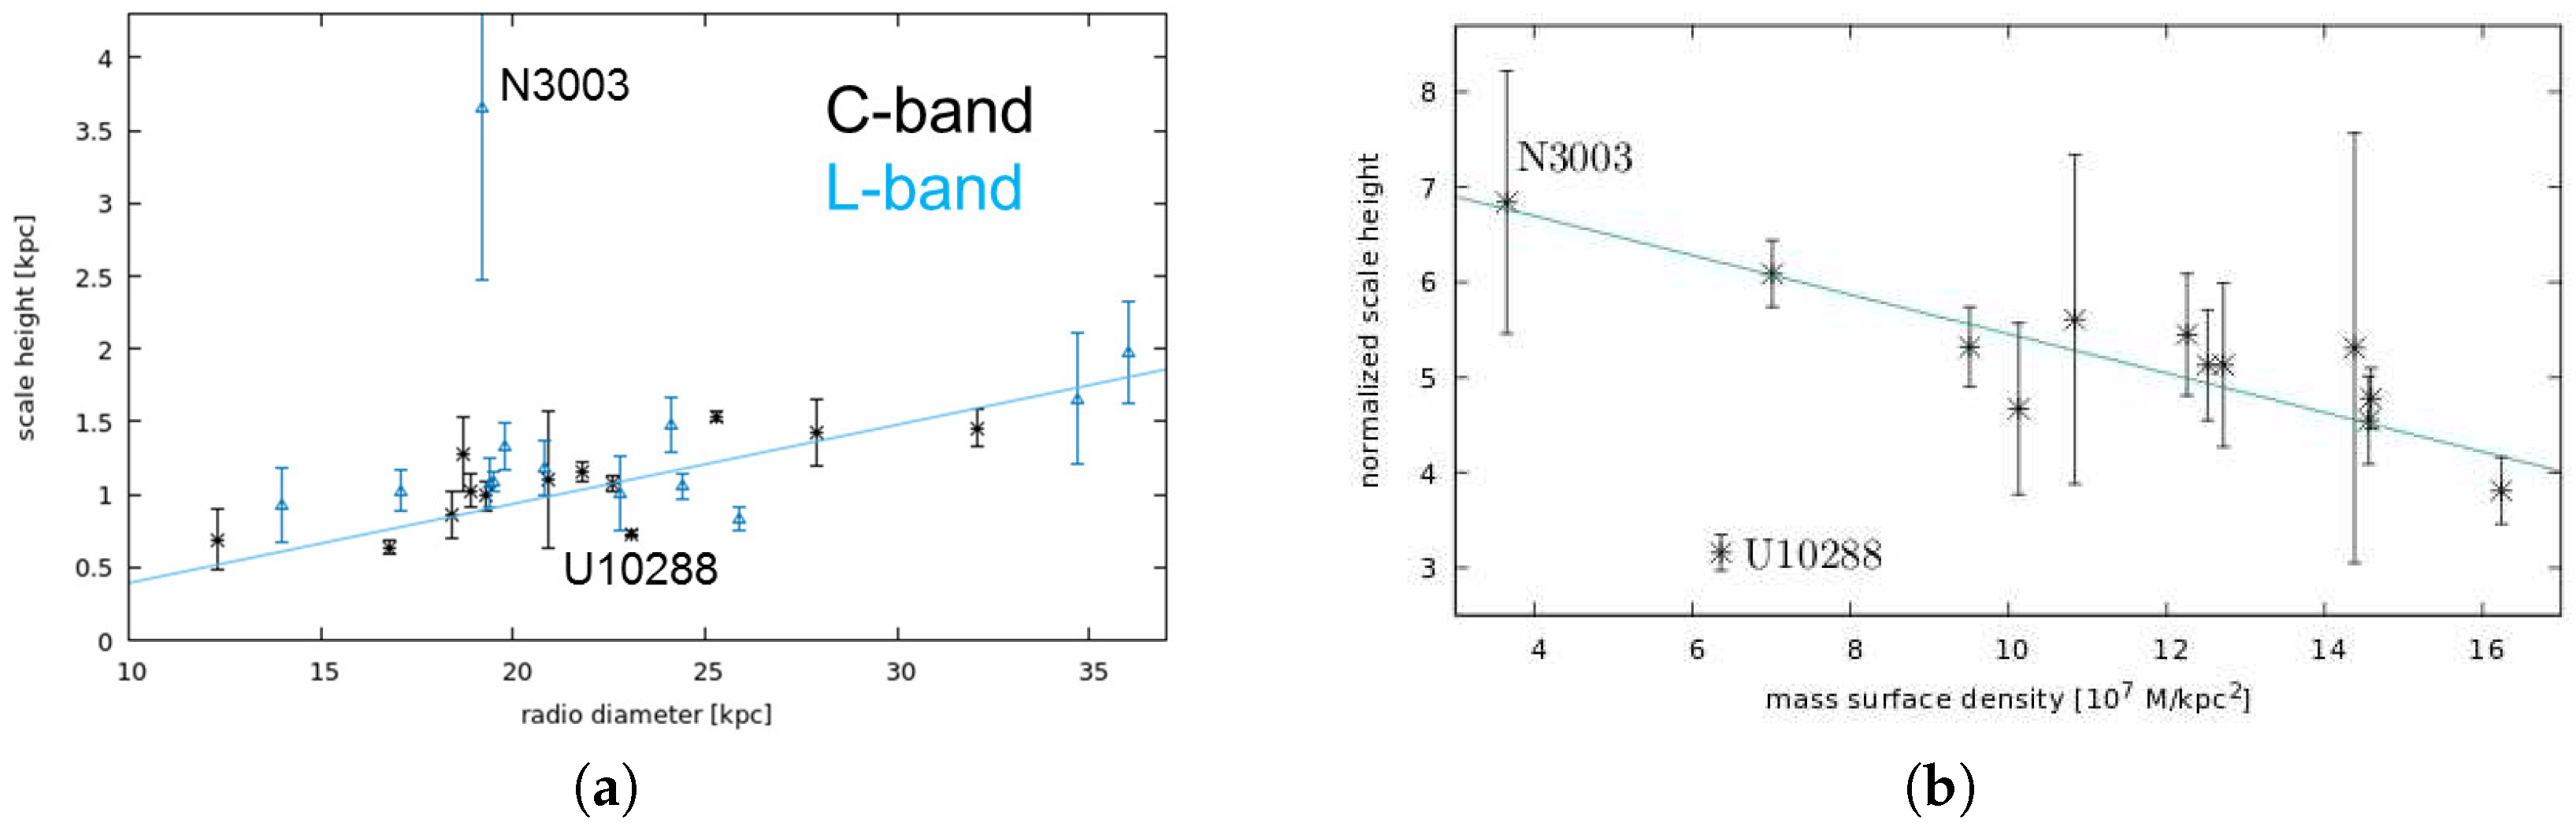
2.3. Vertical Scale Heights, Winds, and Some Unexpected Results
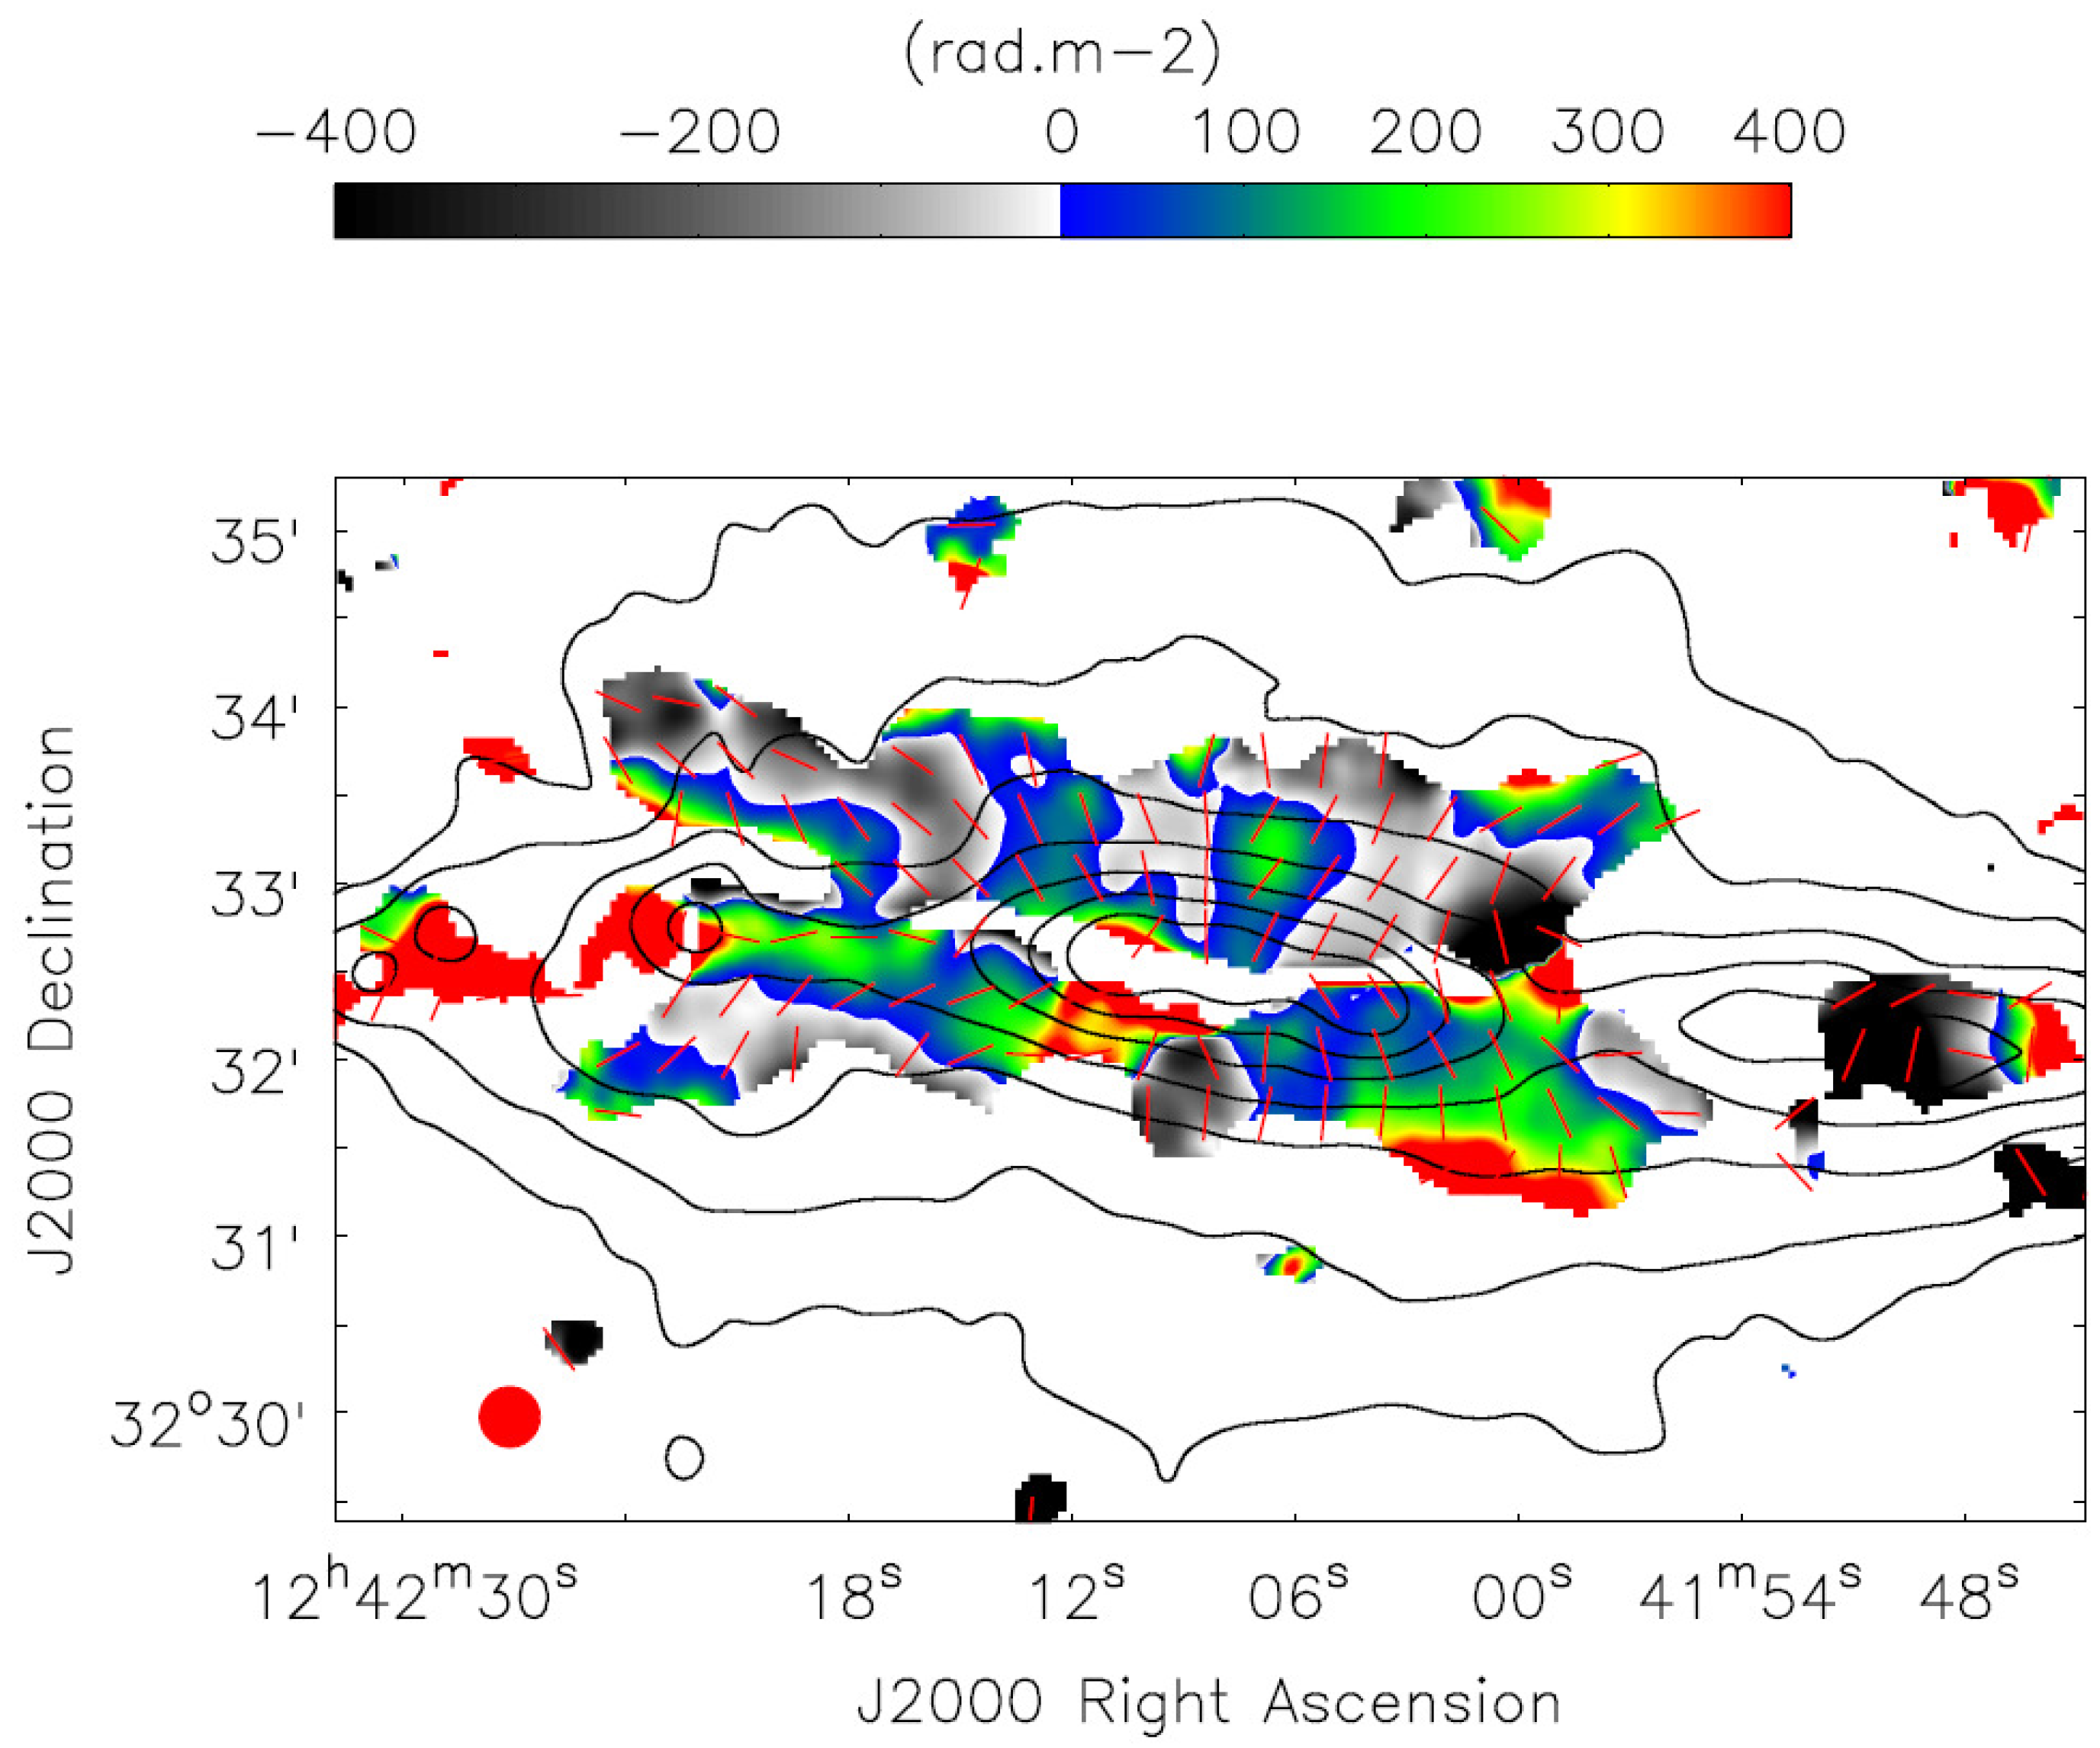
2.4. Magnetic Fields and Their Orientation—Reversing Fields
2.5. Individual Galaxies
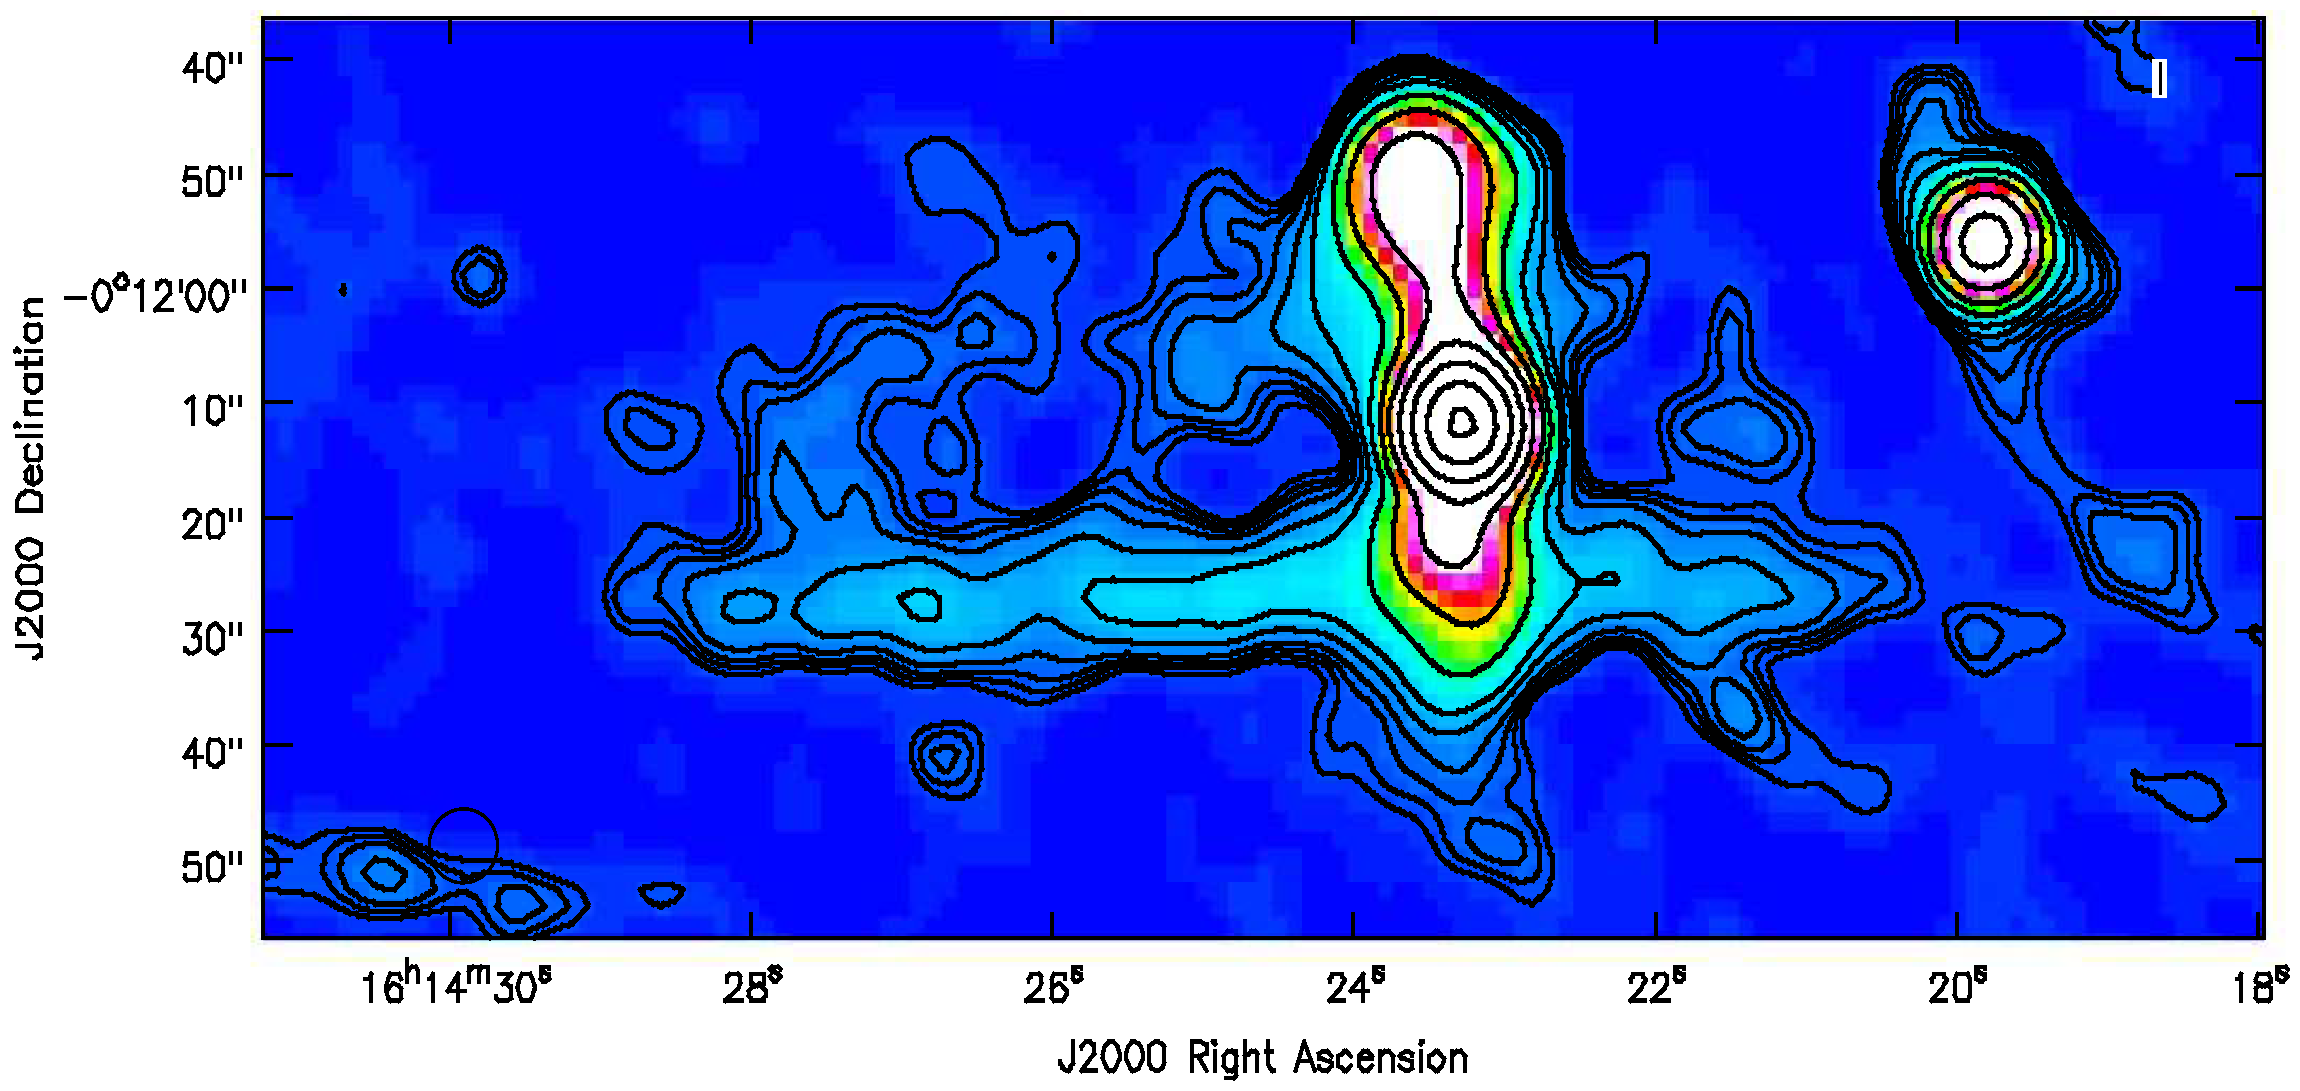
2.5.1. UGC 10288
2.5.2. NGC 4666
2.5.3. NGC 4388
2.5.4. NGC 3556 and LOFAR Data
2.5.5. NGC 891 and NGC 4565
3. Conclusions
Author Contributions
Funding
Acknowledgments
Conflicts of Interest
References
- Hummel, E.; Beck, R.; Dettmar, R.-J. An Effelsberg/VLA radio continuum survey of an optically selected sample of edge-on spiral galaxies. Astron. Astrophys. Suppl. Ser. 1991, 87, 309–317. [Google Scholar]
- Irwin, J.; English, J.; Sorathia, B. High-Latitude Radio Emission in a Sample of Edge-on Spiral Galaxies. Astron. J. 1999, 117, 2102–2140. [Google Scholar] [CrossRef]
- Wiegert, T.; Irwin, J.; Miskolczi, A.; Schmidt, P.; Mora, S.C.; Damas-Segovia, A.; Stein, Y.; English, J.; Rand, R.J.; Santistevan, I.; et al. CHANG-ES. IV. Radio Continuum Emission of 35 Edge-on Galaxies Observed with the Karl G. Jansky Very Large Array in D Configuration—Data Release 1. Astron. J. 2015, 150, 81. [Google Scholar] [CrossRef]
- Irwin, J.; Beck, R.; Benjamin, R.A.; Dettmar, R.-J.; English, J.; Heald, G.; Henriksen, R.N.; Johnson, M.; Krause, M.; Li, J.-T.; et al. Continuum Halos in Nearby Galaxies: An EVLA Survey (CHANG-ES). I. Introduction to the Survey. Astron. J. 2012, 144, 43. [Google Scholar] [CrossRef]
- Irwin, J.; Wiegert, T.; Merritt, A.; Weżgowiec, M.; Hunt, L.; Woodfinden, A.; Stein, Y.; Damas-Segovia, A.; Li, J.; Wang, Q.D.; et al. CHANG-ES XX. High Resolution Radio Continuum Images of Edge-on Galaxies and their AGNs. 2019, in press. [Google Scholar]
- Walterbos, R.; Irwin, J.; Wiegert, T.; Merritt, A.; Weżgowiec, M.; Woodfinden, A.; Stein, Y.; Damas-Segovia, A.; Li, J.; Wang, Q.D.; et al. CHANG-ES XXI. Radio continuum emission of 35 edge-on galaxies observed with the Karl G. Jansky Very Large Array in C-configuration—Data Release 4. 2019, in press. [Google Scholar]
- Silk, J.; Mamon, G.A. The current status of galaxy formation. Res. Astron. Astrophys. 2012, 12, 917–946. [Google Scholar] [CrossRef]
- Zschaechner, L.; Rand, R.J. The H I Kinematics of NGC 4013: A Steep and Radially Shallowing Extra-planar Rotational Lag. Astrophys. J. 2015, 808, 153. [Google Scholar] [CrossRef]
- Henriksen, R.N.; Irwin, J.A. Magnetized galactic haloes and velocity lags. Mon. Not. R. Astron. Soc. 2016, 458, 4210–4221. [Google Scholar] [CrossRef]
- Tully, R.B. Nearby Galaxies Catalog; Cambridge University Press: Cambridge, UK; New York, NY, USA, 1988. [Google Scholar]
- Rau, U.; Cornwell, T.J. A multi-scale multi-frequency deconvolution algorithm for synthesis imaging in radio interferometry. Astron. Astrophys. 2011, 532, A71. [Google Scholar] [CrossRef]
- Irwin, J.; Beck, R.; Benjamin, R.A.; Dettmar, R.-J.; English, J.; Heald, G.; Henriksen, R.N.; Johnson, M.; Krause, M.; Li, J.-T.; et al. Continuum Halos in Nearby Galaxies: An EVLA Survey (CHANG-ES). II. First Results on NGC 4631. Astron. J. 2012, 144, 44. [Google Scholar] [CrossRef]
- Vargas, C.; Walterbos, R.A.M.; Rand, R.J.; Stil, J.; Krause, M.; Li, J.-T.; Irwin, J. CHANG-ES XVII: Hα Imaging of Nearby Edge-on Galaxies, New SFRs, and an Extreme Star Formation Region—Data Release 2. Astrophys. J. 2019. submitted. [Google Scholar]
- Irwin, J.A.; Henriksen, R.N.; Krause, M.; Wang, Q.D.; Wiegert, T.; Murphy, E.J.; Heald, G.; Perlman, E. CHANG-ES V: Nuclear Outflow in a Virgo Cluster Spiral after a Tidal Disruption Event. Astrophys. J. 2015, 809, 172. [Google Scholar] [CrossRef]
- Nikolajuk, M.; Walter, R. Tidal disruption of a super-Jupiter by a massive black hole. Astron. Astrophys. 2013, 552, A75. [Google Scholar] [CrossRef]
- Irwin, J.A.; Henriksen, R.N.; Weżgowiec, M.; Damas-Segovia, A.; Wang, Q.D.; Krause, M.; Heald, G.; Dettmar, R.-J.; Li, J.-T.; Wiegert, T.; et al. CHANG-ES XI. Circular polarization in the cores of nearby galaxies. Mon. Not. R. Astron. Soc. 2018, 476, 5057–5074. [Google Scholar] [CrossRef]
- Perlman, E.S.; Meyer, E.T.; Wang, Q.D.; Yuan, Q.; Henriksen, R.; Irwin, J.; Krause, M.; Wiegert, T.; Murphy, E.J.; Heald, G.; et al. Compact Resolved Ejecta in the Nearest Tidal Disruption Event. Astrophys. J. 2017, 842, 126. [Google Scholar] [CrossRef]
- Kennett, M.; Melrose, D. Propagation-induced Circular Polarisation in Synchrotron Sources. Publ. Astron. Soc. Aust. 1998, 15, 211–216. [Google Scholar] [CrossRef]
- Irwin, J.A.; Schmidt, P.; Damas-Segovia, A.; Beck, R.; English, J.; Heald, G.; Henriksen, R.N.; Krause, M.; Li, J.-T.; Rand, R.J.; et al. CHANG-ES VIII. Uncovering hidden AGN activity in radio polarization. Mon. Not. R. Astron. Soc. 2017, 464, 1333–1346. [Google Scholar] [CrossRef]
- King, A. How big can a black hole grow? Mon. Not. R. Astron. Soc. 2016, 456, L109–L112. [Google Scholar] [CrossRef]
- Tabatabaei, F.S.; Beck, R.; Krügel, E.; Krause, M.; Berkhuijsen, E.M.; Gordon, K.D.; Menten, K.M. High-resolution radio continuum survey of M 33. II. Thermal and nonthermal emission. Astron. Astrophys. 2007, 475, 133–142. [Google Scholar] [CrossRef]
- Tabatabaei, F.S.; Schinnerer, E.; Krause, M.; Dumas, G.; Meidt, S.; Damas-Segovia, A.; Beck, R.; Murphy, E.J.; Mulcahy, D.D.; Groves, B.; et al. The Radio Spectral Energy Distribution and Star-formation Rate Calibration in Galaxies. Astrophys. J. 2017, 836, 185. [Google Scholar] [CrossRef]
- Li, J.-T.; Beck, R.; Dettmar, R.-J.; Heald, G.; Irwin, J.; Johnson, M.; Kepley, A.A.; Krause, M.; Murphy, E.J.; Orlando, E.; et al. CHANG-ES - VI. Probing Supernova energy deposition in spiral galaxies through multiwavelength relationships. Mon. Not. R. Astron. Soc. 2016, 456, 1723–1738. [Google Scholar] [CrossRef]
- Vargas, C.J.; Mora-Partiarroyo, S.C.; Schmidt, P.; Rand, R.J.; Stein, Y.; Walterbos, R.A.M.; Wang, Q.D.; Basu, A.; Patterson, M.; Kepley, A.; et al. CHANG-ES X: Spatially Resolved Separation of Thermal Contribution from Radio Continuum Emission in Edge-on Galaxies. Astrophys. J. 2018, 853, 128. [Google Scholar] [CrossRef]
- Heesen, V.; Dettmar, R.-J.; Krause, M.; Beck, R.; Stein, Y. Advective and diffusive cosmic ray transport in galactic haloes. Mon. Not. R. Astron. Soc. 2016, 458, 332–353. [Google Scholar] [CrossRef]
- Heesen, V.; Krause, M.; Beck, R.; Adebahr, B.; Bomans, D.J.; Carretti, E.; Dumke, M.; Heald, G.; Irwin, J.; Koribalski, B.S.; et al. Radio haloes in nearby galaxies modelled with 1D cosmic ray transport using SPINNAKER. Mon. Not. R. Astron. Soc. 2018, 476, 158–183. [Google Scholar] [CrossRef]
- Krause, M.; Irwin, J.; Wiegert, T.; Miskolczi, A.; Damas-Segovia, A.; Beck, R.; Li, J.-T.; Heald, G.; Müller, P.; Stein, Y.; et al. CHANG-ES. IX. Radio scale heights and scale lengths of a consistent sample of 13 spiral galaxies seen edge-on and their correlations. Astron. Astrophys. 2018, 611, A72. [Google Scholar] [CrossRef]
- Stein, Y.; Dettmar, R.-J.; Irwin, J.; Beck, R.; Weżgowiec, M.; Miskolczi, A.; Krause, M.; Heesen, V.; Wiegert, T.; Heald, G.; et al. CHANG-ES. XIII. Transport processes and the magnetic fields of NGC 4666: indication of a reversing disk magnetic field. Astron. Astrophys. 2019, 623, A33. [Google Scholar] [CrossRef]
- Miskolczi, A.; Heesen, V.; Horellou, C.; Bomans, D.-J.; Beck, R.; Heald, G.; Dettmar, R.-J.; Blex, S.; Nikiel-Wroczyński, B.; Chyży, K.T.; et al. CHANG-ES XII. A LOFAR and VLA view of the edge-on star-forming galaxy NGC 3556. Astron. Astrophys. 2019, 622, A9. [Google Scholar] [CrossRef]
- Mora-Partiarroyo, S.C.; Krause, M.; Basu, A.; Beck, R.; Wiegert, T.; Irwin, J.; Henriksen, R.; Stein, Y.; Vargas, C.J.; Heesen, V.; et al. CHANG-ES XV: Large-scale Magnetic Field Reversals in the Radio Halo of NGC 4631. Astron. Astrophys. 2019. submitted. [Google Scholar]
- Schmidt, P.; Krause, M.; Heesen, V.; Beck, R.; Irwin, J.A.; Heald, G.; Rand, R.J.; Li, J.-T.; Murphy, E.J. CHANG-ES XV: An in-depth view of the cosmic-ray transport in the edge-on spiral galaxies NGC 891 and NGC 4565. Astron. Astrophys. 2019. submitted. [Google Scholar]
- Brentjens, M.A.; de Bruyn, A.G. Faraday rotation measure synthesis. Astron. Astrophys. 2005, 441, 1217–1228. [Google Scholar] [CrossRef]
- Woodfinden, A.; Henriksen, R.N.; Irwin, J. Evolving Galactic Dynamos and Fits to the Reversing Magnetic Field in the Halo of NGC 4631. Mon. Not. R. Astron. Soc. 2019. submitted. [Google Scholar]
- Henriksen, R.N.; Woodfinden, A.; Irwin, J.A. Exact spirally symmetric galactic dynamos. arXiv, 2018; arXiv:1802.07689. [Google Scholar]
- Henriksen, R.N.; Woodfinden, A.; Irwin, J.A. Exact axially symmetric galactic dynamos. Mon. Not. R. Astron. Soc. 2018, 476, 635–645. [Google Scholar] [CrossRef]
- Mora-Partiarroyo, S.C.; Krause, M.; Basu, A.; Beck, R.; Wiegert, T.; Irwin, J.; Henriksen, R.; Stein, Y.; Vargas, C.J.; Heesen, V.; et al. CHANG-ES XIV: Cosmic-ray Propagation and Magnetic Field Strengths in the Radio Halo of NGC 4631. Astron. Astrophys. 2019. submitted. [Google Scholar]
- Irwin, J.; Krause, M.; English, J.; Beck, R.; Murphy, E.; Wiegert, T.; Heald, G.; Walterbos, R.; Rand, R.J.; Porter, T. CHANG-ES. III. UGC 10288—An Edge-on Galaxy with a Background Double-lobed Radio Source. Astron. J. 2013, 146, 164. [Google Scholar] [CrossRef]
- Stein, Y.; Dettmar, R.-J.; Weżgowiec, M.; Irwin, J.; Beck, R.; Wiegert, T.; Krause, M.; Li, J.-T.; Heesen, V.; Miskolczi, A.; et al. CHANG-ES XIX: The galaxy NGC 4013—A diffusion-dominated radio halo with plane-parallel disk and vertical halo magnetic fields. Astron. Astrophys. 2019. submitted. [Google Scholar]
- Beck, R. Magnetic fields in spiral galaxies. Astron. Astrophys. Rev. 2016, 24, 4. [Google Scholar] [CrossRef]
- Moss, D.; Stepanov, R.; Arshakian, T.G.; Beck, R.; Krause, M.; Sokoloff, D. Multiscale magnetic fields in spiral galaxies: evolution and reversals. Astron. Astrophys. 2012, 537, A68. [Google Scholar] [CrossRef]
- Damas-Segovia, A.; Beck, R.; Vollmer, B.; Wiegert, T.; Krause, M.; Irwin, J.; Weżgowiec, M.; Li, J.; Dettmar, R.-J.; English, J.; et al. CHANG-ES VII. Magnetic Outflows from the Virgo Cluster Galaxy NGC 4388 2016. Astrophys. J. 2016, 824, 30. [Google Scholar] [CrossRef]
- Shimwell, T.W.; Tasse, C.; Hardcastle, M.J.; Mechev, A.P.; Williams, W.L.; Best, P.N.; Röttgering, H.J.A.; Callingham, J.R.; Dijkema, T.J.; de Gasperin, F.; et al. The LOFAR Two-metre Sky Survey. II. First data release. Astron. Astrophys. 2019, 622, A1. [Google Scholar] [CrossRef]
- Beck, R.; Krause, M. Revised equipartition and minimum energy formula for magnetic field strength estimates from radio synchrotron observations. Astron. Nachrichten 2005, 326, 414–427. [Google Scholar] [CrossRef]
- Irwin, J.; Damas-Segovia, A.; Krause, M.; Miskolczi, A.; Li, J.; Stein, Y.; English, J.; Henriksen, R.; Beck, R.; Wiegert, T.; et al. CHANG-ES: XVIII—The CHANG-ES Survey and Selected Results. Galaxies 2019. submitted. [Google Scholar]
| 1. | |
| 2. | |
| 3. |


| Parameter | Value | Ref |
|---|---|---|
| Galaxy Distance range | 4.442 Mpc | [3] |
| Galaxy SFR range | 0.027.29 /yr | [3] |
| Galaxy optical diameter range | 3.915.8 arcmin | [4] |
| Array configurations (L-band, C-band) | B C D, C D | [3] |
| (L-band, C-band) | 1.58, 6.00 GHz | [3] |
| (L-band, C-band) | 512 MHz, 2.0 GHz | [3] |
| No. of spectral channels (L-band, C-band) | 2048, 1024 | [3] |
| Approx. Spatial resolution range | 360 arcsec | [3,5,6] |
| Typical resolutions in arcsec (high-res, low-res uv weightings): | ||
| B configuration L-band | 3, 6 | |
| C configuration C-band | 3, 6 | |
| C configuration L-band | 10, 15 | |
| D configuration C-band | 10, 15 | |
| D configuration L-band | 35, 45 | |
| Approx. rms range (all configurations and bands) | 3 95 Jy/beam | [3,5,6] |
| Paper Title | Ref |
|---|---|
| CHANG-ES I: Continuum Halos in Nearby Galaxies: An EVLA Survey: Introduction to the Survey | [4] |
| CHANG-ES II: Continuum Halos in Nearby Galaxies: An EVLA Survey: First Results on NGC 4631 | [12] |
| CHANG-ES III: UGC 10288—An Edge-on Galaxy with a Background Double-lobed Radio Source | [37] |
| CHANG-ES IV: Radio continuum emission of 35 edge-on galaxies observed with the | |
| Karl G. Jansky Very Large Array in D-configuration — Data Release 1 | [3] |
| CHANG-ES V: Nuclear Outflow in a Virgo Cluster Spiral after a Tidal Disruption Event | [14] |
| CHANG-ES VI: Probing Supernova energy deposition in spiral galaxies through Multiwavelength | |
| relationships | [23] |
| CHANG-ES VII: Magnetic Outflows from the Virgo Cluster Galaxy NGC 4388 | [41] |
| CHANG-ES VIII: Uncovering Hidden AGN activity in radio polarization | [19] |
| CHANG-ES IX: Radio scale heights and scale lengths of a consistent sample of 13 spiral galaxies | |
| seen edge-on and their correlations | [27] |
| CHANG-ES X: Spatially Resolved Separation of Thermal Contribution from Radio Continuum | |
| Emission in Edge-on Galaxies | [24] |
| CHANG-ES XI: Circular polarization in the cores of nearby galaxies | [16] |
| CHANG-ES XII: A LOFAR and VLA View of the Edge-on Star Forming Galaxy, NGC 3556 | [29] |
| CHANG-ES XIII: Transport processes and the Magnetic Fields of NGC 4666 — Indication of a | |
| Reversing Disk Magnetic Field | [28] |
| CHANG-ES XIV: Cosmic-ray Propagation and Magnetic Field Strengths in the Radio Halo of NGC 4631 | [36] |
| CHANG-ES XV: Large-scale Magnetic Field Reversals in the Radio Halo of NGC 4631 | [30] |
| CHANG-ES XVI: An In-Depth View of the Cosmic-ray Transport in the Edge-on Spiral Galaxies | |
| NGC 891 and NGC 4565 | [31] |
| CHANG-ES XVII: H-alpha Imaging of Nearby Edge-on Galaxies, New SFRs, and an Extreme | |
| Star Formation Region — Data Release 2 | [13] |
| CHANG-ES XVIII: The CHANG-ES Survey and Selected Results | [44] |
| CHANG-ES XIX: The Galaxy NGC 4013 — A diffusion-dominated radio halo with plane-parallel | |
| disk and vertical halo magnetic fields | [38] |
| CHANG-ES XX: High Resolution Radio Continuum Images of Edge-on Galaxies and their AGNs | |
| —Data Release 3 | [5] |
| CHANG-ES XXI: Radio continuum emission of 35 edge-on galaxies observed with the | |
| Karl G. Jansky Very Large Array in C-configuration — Data Release 4 | [6] |
© 2019 by the authors. Licensee MDPI, Basel, Switzerland. This article is an open access article distributed under the terms and conditions of the Creative Commons Attribution (CC BY) license (http://creativecommons.org/licenses/by/4.0/).
Share and Cite
Irwin, J.; Damas-Segovia, A.; Krause, M.; Miskolczi, A.; Li, J.; Stein, Y.; English, J.; Henriksen, R.; Beck, R.; Wiegert, T.; et al. CHANG-ES: XVIII—The CHANG-ES Survey and Selected Results. Galaxies 2019, 7, 42. https://doi.org/10.3390/galaxies7010042
Irwin J, Damas-Segovia A, Krause M, Miskolczi A, Li J, Stein Y, English J, Henriksen R, Beck R, Wiegert T, et al. CHANG-ES: XVIII—The CHANG-ES Survey and Selected Results. Galaxies. 2019; 7(1):42. https://doi.org/10.3390/galaxies7010042
Chicago/Turabian StyleIrwin, Judith, Ancor Damas-Segovia, Marita Krause, Arpad Miskolczi, Jiangtao Li, Yelena Stein, Jayanne English, Richard Henriksen, Rainer Beck, Theresa Wiegert, and et al. 2019. "CHANG-ES: XVIII—The CHANG-ES Survey and Selected Results" Galaxies 7, no. 1: 42. https://doi.org/10.3390/galaxies7010042
APA StyleIrwin, J., Damas-Segovia, A., Krause, M., Miskolczi, A., Li, J., Stein, Y., English, J., Henriksen, R., Beck, R., Wiegert, T., & Dettmar, R.-J. (2019). CHANG-ES: XVIII—The CHANG-ES Survey and Selected Results. Galaxies, 7(1), 42. https://doi.org/10.3390/galaxies7010042