1. Introduction
The correlations between blazar emissions in different energy bands are best probed with long-term monitoring, providing unbiased sampling. Especially for ground-based observatories this is hard to achieve for even a small number of sources. The
Fermi satellite has transformed the monitoring of blazars in the high-energy (HE)
-ray band (
MeV) through its continuous surveillance of the whole sky every three hours (although somewhat less uniform after its hardware failure in March 2018) as detailed in [
1,
2]. In the optical and radio bands many monitoring programs are run thanks to the large number of available telescopes. However, in other energy bands the monitoring capabilities are limited. In the X-ray band the Neil Gehrels
Swift observatory runs a limited monitoring effort and can follow up on flares. MAXI on board the International Space Station provides all-sky capabilities within 1 orbit with limited sensitivity. In the very-high-energy (VHE)
-ray band (
GeV) the monitoring effort is limited by sensitivity, e.g., for FACT and HAWC [
3], or by time constraints due to competition with other objects. The latter strongly influences the monitoring efforts of the three large imaging atmospheric Cherenkov telescope (IACT) facilities H.E.S.S., MAGIC and VERITAS. Nonetheless, they have been running limited monitoring projects on a number of blazars.
Here, we report on the ongoing monitoring efforts by H.E.S.S. and MAGIC of the flat spectrum radio quasar (FSRQ) PKS 1510-089. It is located at a redshift
and possesses a bright broad-line region (BLR), e.g., [
4,
5]. Hence, VHE photons produced within the boundaries of the BLR should be absorbed. As the emission region of
-rays was thought to be close to the central black hole, VHE emission from FSRQs was considered unlikely by many. However, several detections of FSRQs [
6,
7,
8,
9,
10,
11,
12] challenge this picture and suggest that jets are able to produce
-rays also further downstream in the jet.
To verify that these are not simply one-time-only flaring events, but that FSRQs produce VHE emission on all time scales, monitoring programs have been initiated with H.E.S.S. and MAGIC on PKS 1510-089. While these are not unbiased, they have already provided important information. During a strong multiwavelength flaring event in 2015, variability on night-by-night scales at VHE
-rays was observed for the first time from this source [
13,
14,
15]. Furthermore, MAGIC observations integrated during low-states in the HE band revealed a significant VHE signal with an average, integrated flux
cm
s
[
16]. Hence, PKS 1510-089 is not only variable in VHE
-rays but also a persistent source. This has a direct and very important consequence: the absorption of VHE photons through the BLR cannot be too severe, and the emission region must be at the edge or even outside of the BLR at all times. This, in turn, implies that the usual model for FSRQ
-ray emission, namely inverse-Compton scattering of BLR photons, might not be correct.
This paper gives the status of the H.E.S.S. monitoring efforts on PKS 1510-089, and its early results. One of the important outcomes is the detection of an unprecedented VHE flare in 2016, which was also followed-up with MAGIC. Details of this flare are reported here. Additional multiwavelength data are gathered for comparison from
Fermi-LAT in the HE
-ray band, from
Swift-XRT in the X-ray band and from ATOM [
17] in the R-band.
2. Monitoring with H.E.S.S.
After the detection in 2009 [
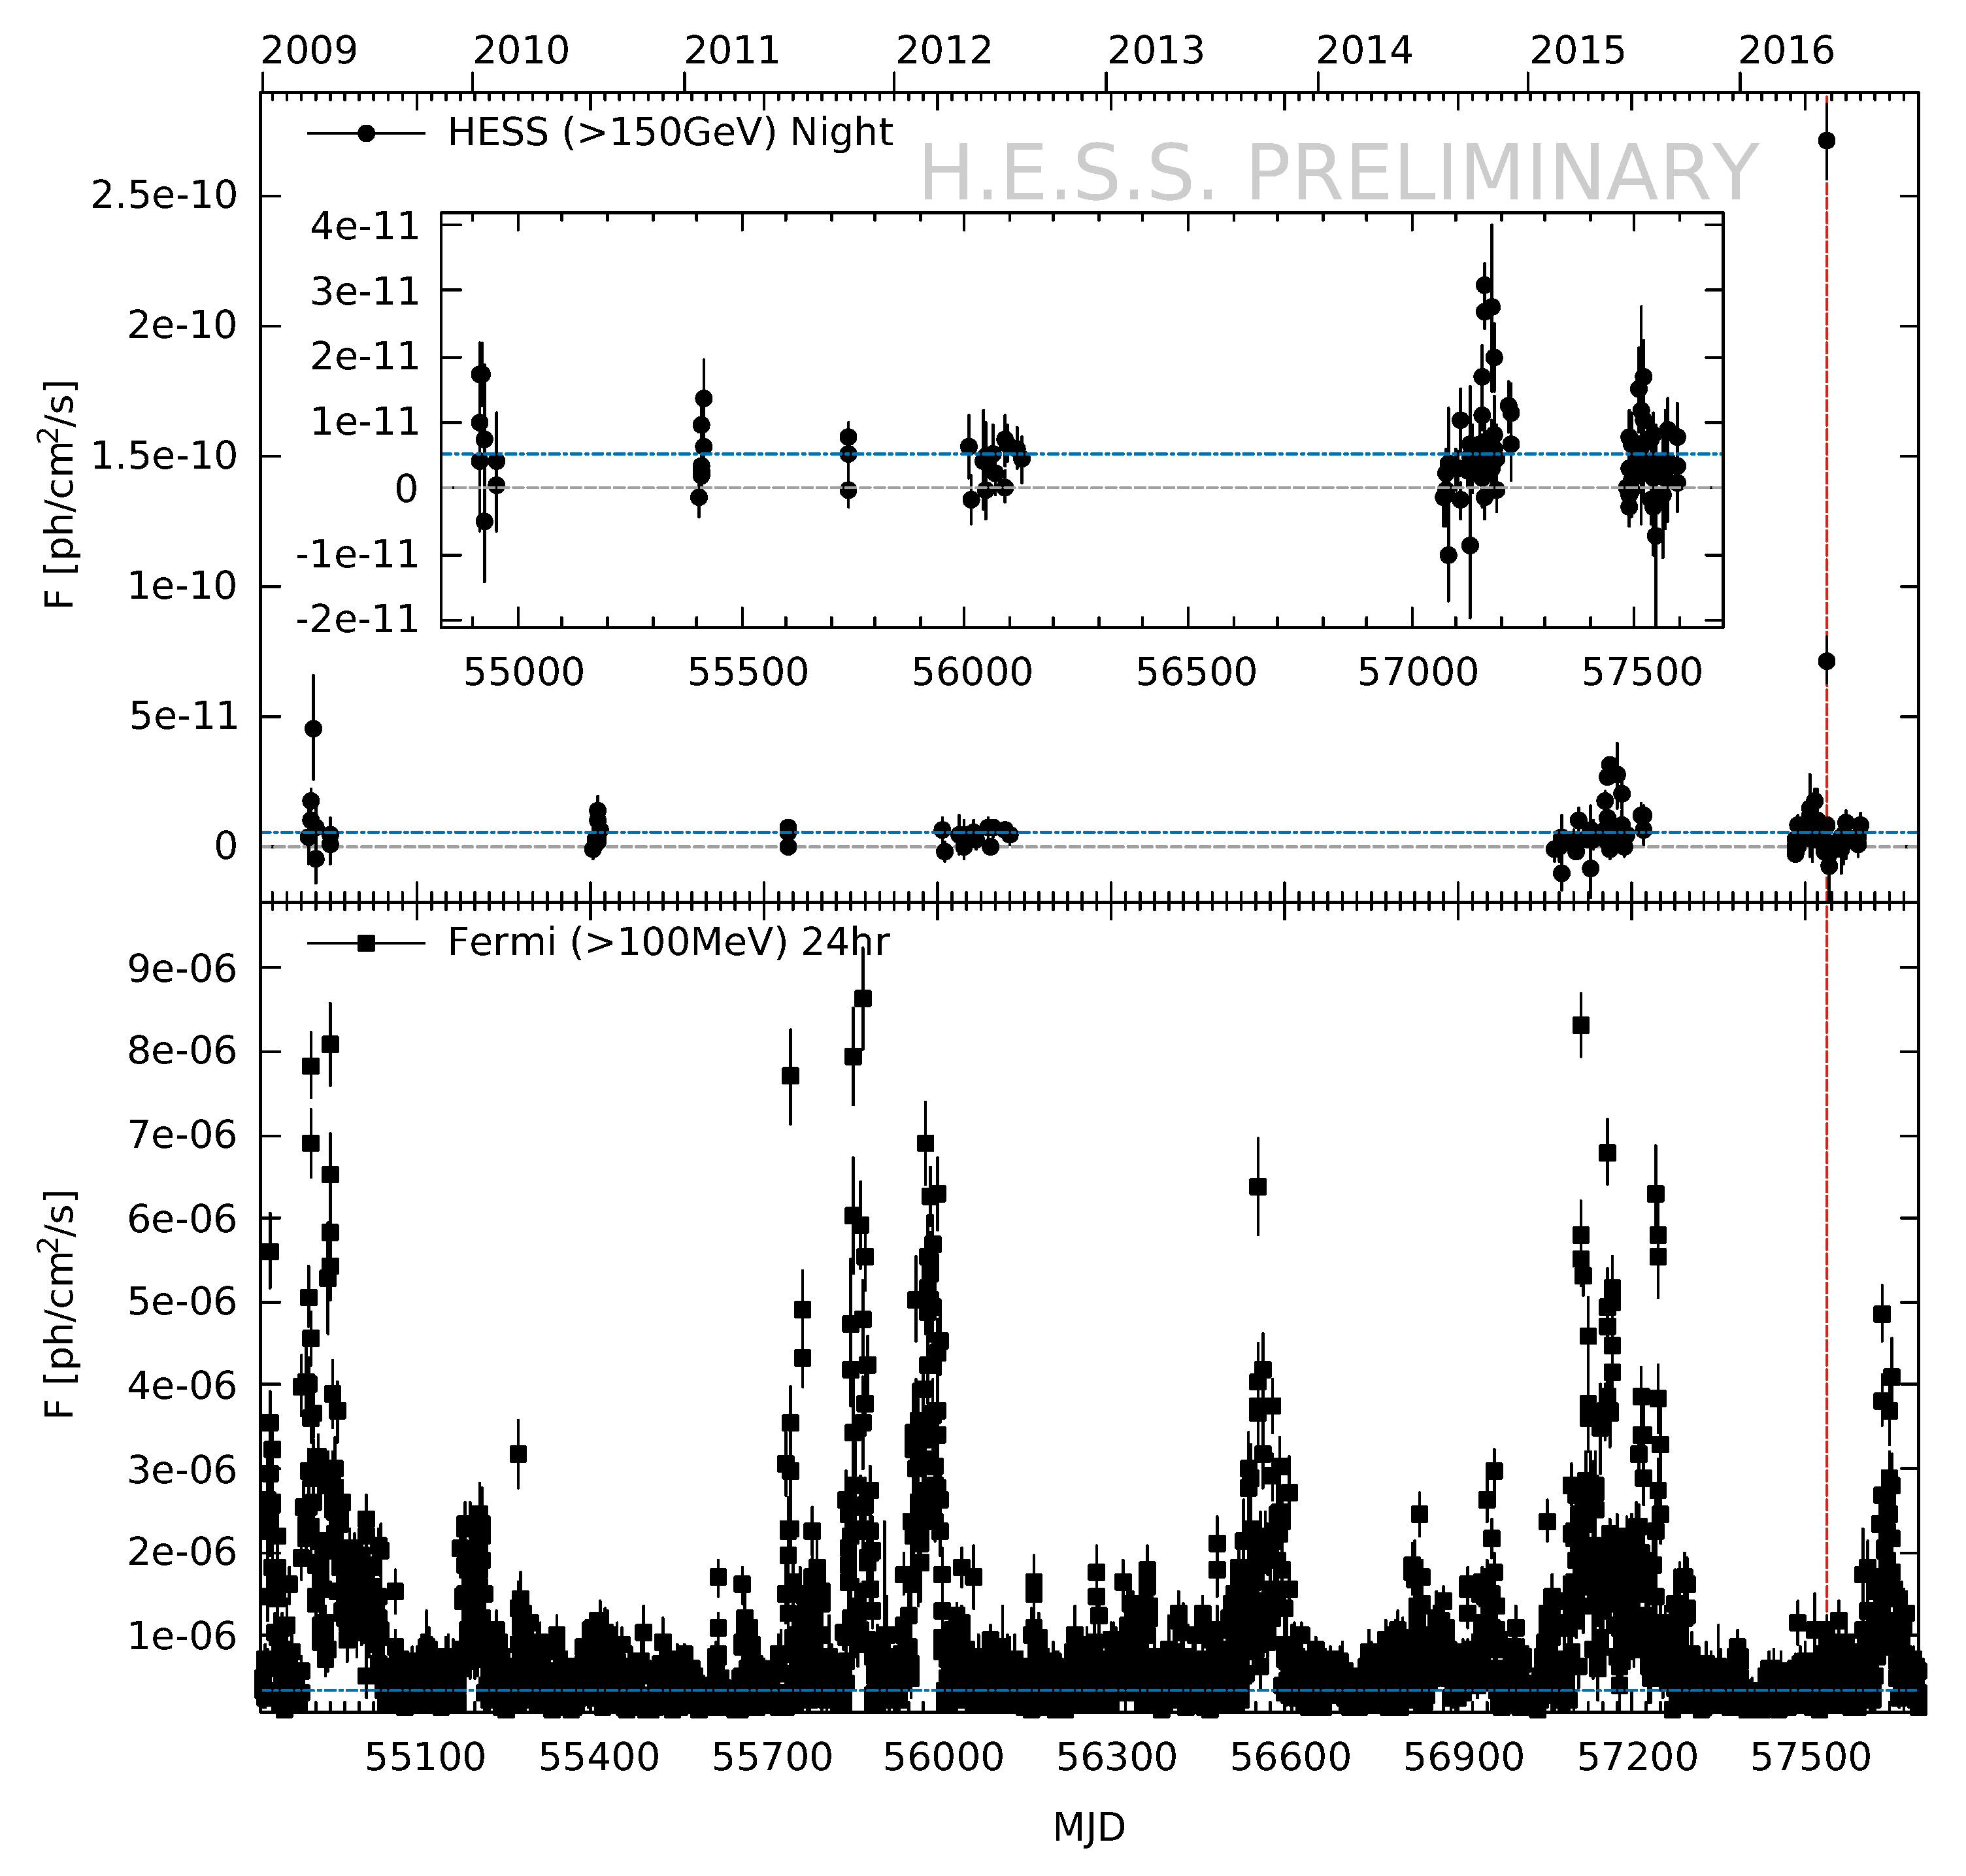
8], H.E.S.S. has continued observing PKS 1510-089 with low cadence. Since 2015 this effort has been significantly increased with several hours of observations each month during the visibility period (which typically lasts from February to July each year) resulting in observations almost every night without moon interference. The resulting nightwise lightcurve including all observations is shown in
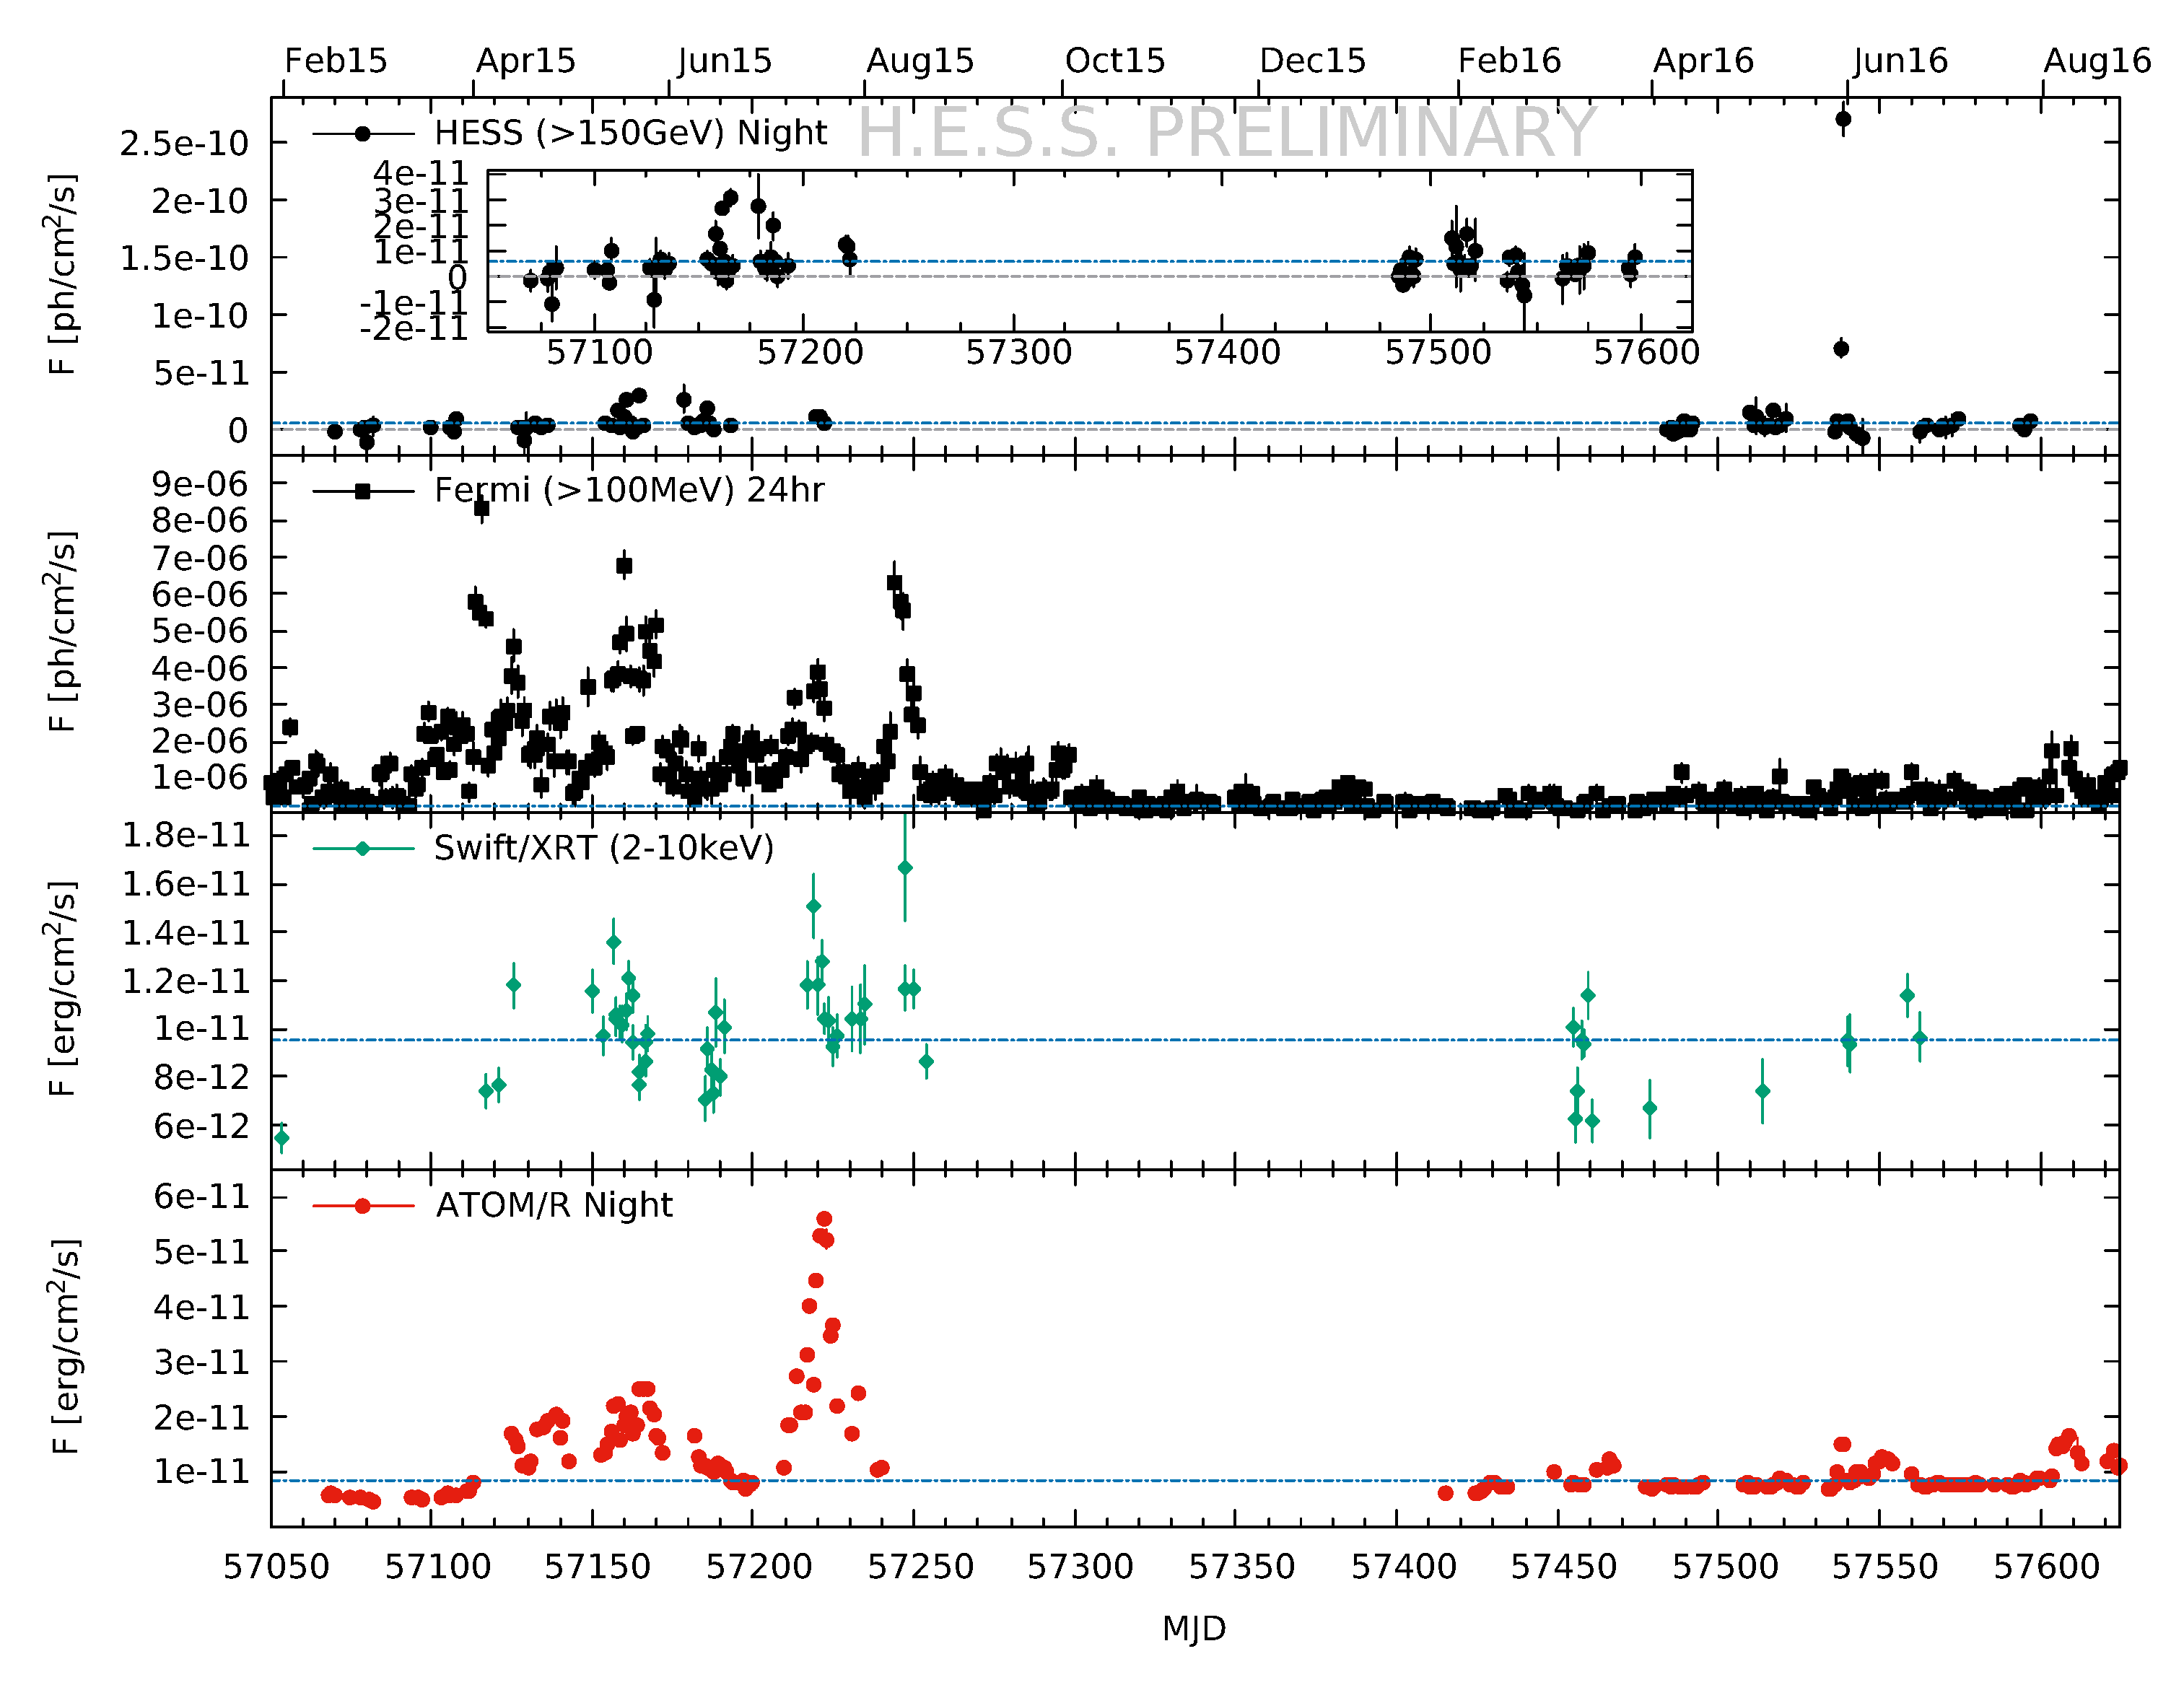
Figure 1, and a focus on the 2015 and 2016 season is shown in
Figure 2. Note that nightwise bins do not guarantee a significant flux per night due to the limited sensitivity and the dimness of the source in the low state. In fact, about 50% of the nights shown in
Figure 1 are compatible with zero. The bright VHE flare in 2016 clearly stands out with peak fluxes up to 10 times higher than the previous record holder in 2015. In order to reveal details of the other times, the inset shows the zoom in on the fluxes without the 2016 flare. The flare is further discussed in
Section 3. The average, integrated flux for the whole time frame is
cm
s
, which is compatible within errors with the MAGIC low-flux level, but includes the bright states, as well. The average of the 2015–2016 time frame is compatible with the average of the whole time frame. In both cases, a constant flux is ruled out with very high significance. This is underlined by the fractional variability [
18]
where
is the variance,
is the mean square error, and
is the average flux of the source in the considered data set. For the whole data set
, and for the 2015–2016 time frame
. These large values are driven by the 2016 flare. Removing the two nights of that event give
, which still implies significant variability. Defining the variability time scale between two subsequent flux points as [
19]
the minimum variability time scale is
h, which was exhibited during the major flare in 2016. The error on the variability time scale has been derived through error propagation.
The bottom panel in
Figure 1 shows the nightwise HE
-ray fluxes obtained with
Fermi-LAT. The average, integrated flux in this band is
cm
s
for the whole time frame, and
cm
s
for 2015–2016. The source has been very active in this band for large parts of the considered time frame with
for the whole time frame, and
for 2015–2016. The minimum variability time scale is
h for the whole time frame exhibited during a flare in 2011, and
h for the 2015–2016 time frame exhibited in August 2015.
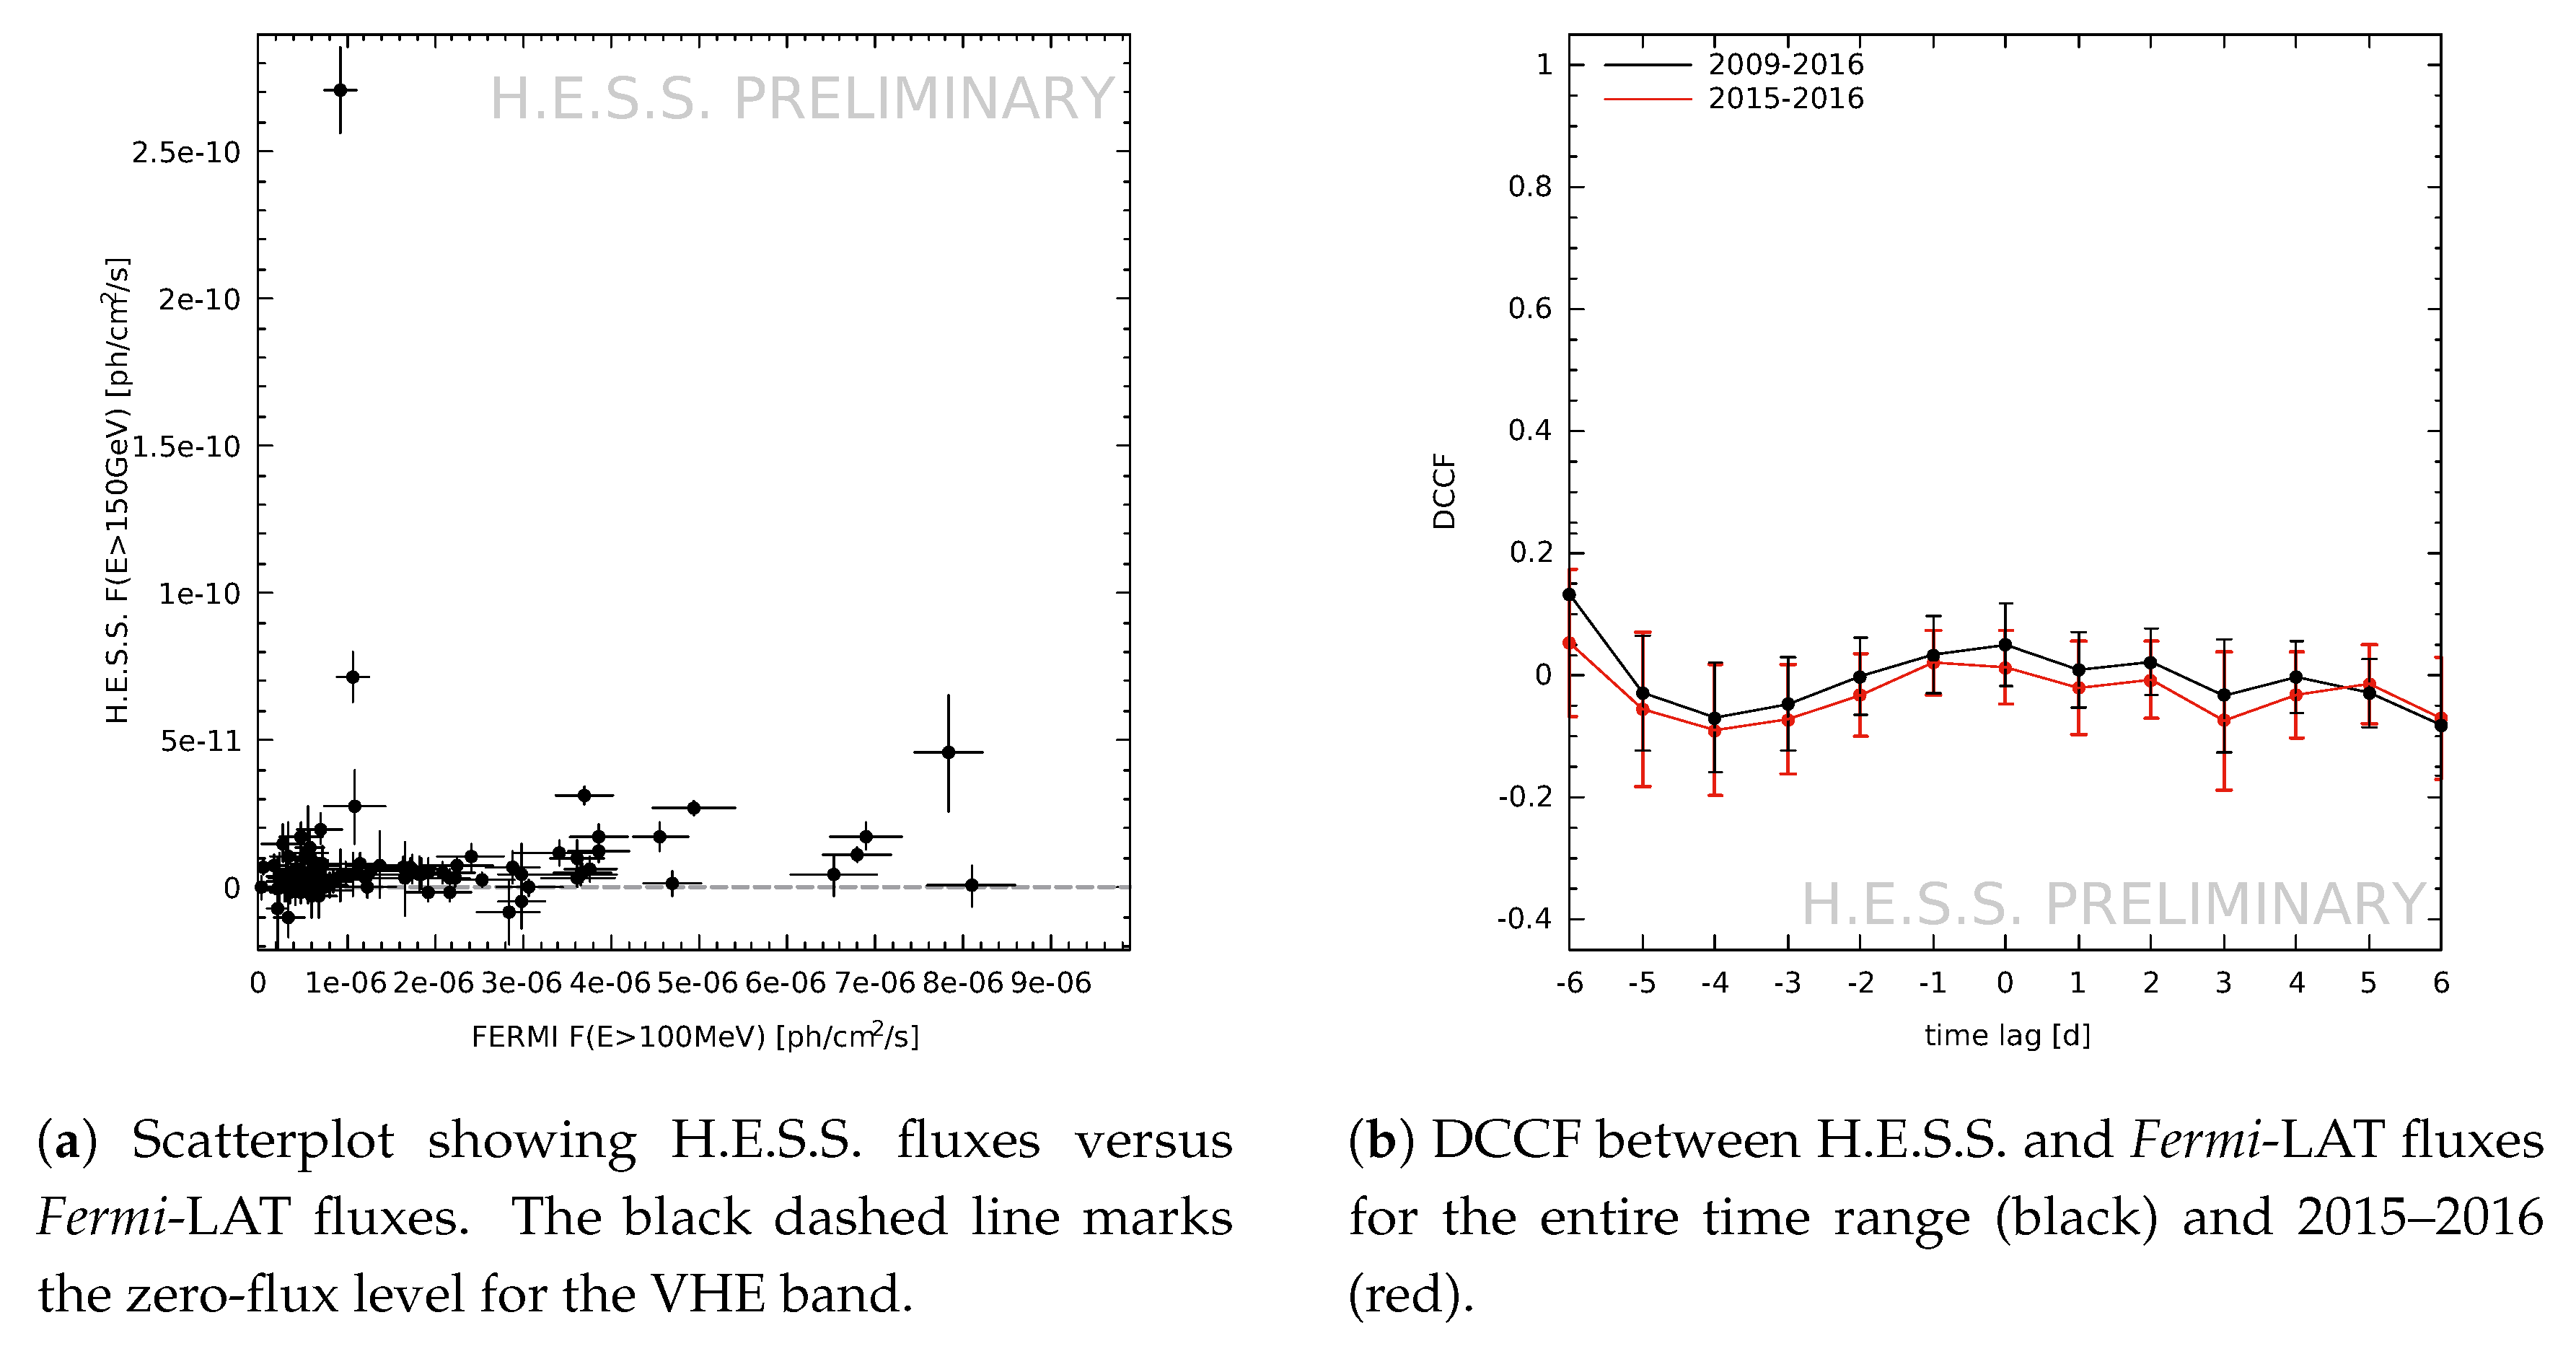
Unfortunately, many of the HE flares were not followed up with with H.E.S.S. due to observational constraints. Nonetheless, it is interesting to investigate whether there is any correlation between these two bands. Plotting the simultaneously recorded fluxes of the two bands against each other can reveal direct correlations. The scatterplot is shown for H.E.S.S. and
Fermi-LAT fluxes in
Figure 3a. The discrete cross-correlation function (DCCF) can uncover correlations with time-delays in non-simultaneous and unevenly spaced data [
20]:
where
and
are the fluxes of two lightcurves with mean
and
and variance
and
, respectively. The sum goes over all
N pairs
in the time interval
. The DCCF between the VHE and HE
-ray fluxes is shown in
Figure 3b for the full time frame and 2015–2016, respectively.
The scatterplot does not contain any strong evidence for a direct correlation between VHE (here integrated above 150 GeV) and HE fluxes in the data. While on several occasions a high HE flux is accompanied with a significant VHE flux, this is not a general rule, as also VHE-flux levels compatible with zero are recorded for similar HE fluxes. On the other hand, similar VHE fluxes can occur at different HE-flux levels. The 2016 VHE flare again stands out for the relatively low simultaneous HE fluxes. The non-correlation of VHE and HE fluxes is also underlined by the flat DCCF. It should be noted that the different integration times (a few hours for H.E.S.S. and h for Fermi-LAT) might influence the conclusions here given the relatively fast variability found in this source.
For the 2015-2016 time frame, data from
Swift-XRT and ATOM have been analyzed, giving the X-ray and R-band lightcurves for these years. The X-ray average, integrated flux is
erg cm
s
. The flux is incompatible with a constant flux with high significance, and
. The fastest variability is
h.
1 Given the low cadence in these observations as visible in the third panel of
Figure 2, it is difficult to distinguish flares from a ground state. In the optical R-band, the average, integrated flux is
erg cm
s
. The flux is highly variable with
, and
h. The lightcurve, shown in the bottom panel of
Figure 2, reveals a highly active state in 2015 and a mostly quiet state in 2016. In April and May 2015 ATOM recorded correlated activity in the optical band with the HE
-ray band. The very bright optical flare in July 2015, which was the brightest flux state ever recorded with ATOM in PKS 1510-089, only had a mild counterpart in the HE band. Compared to the other optical flares in 2015, the July outburst was more than 2 times brighter.
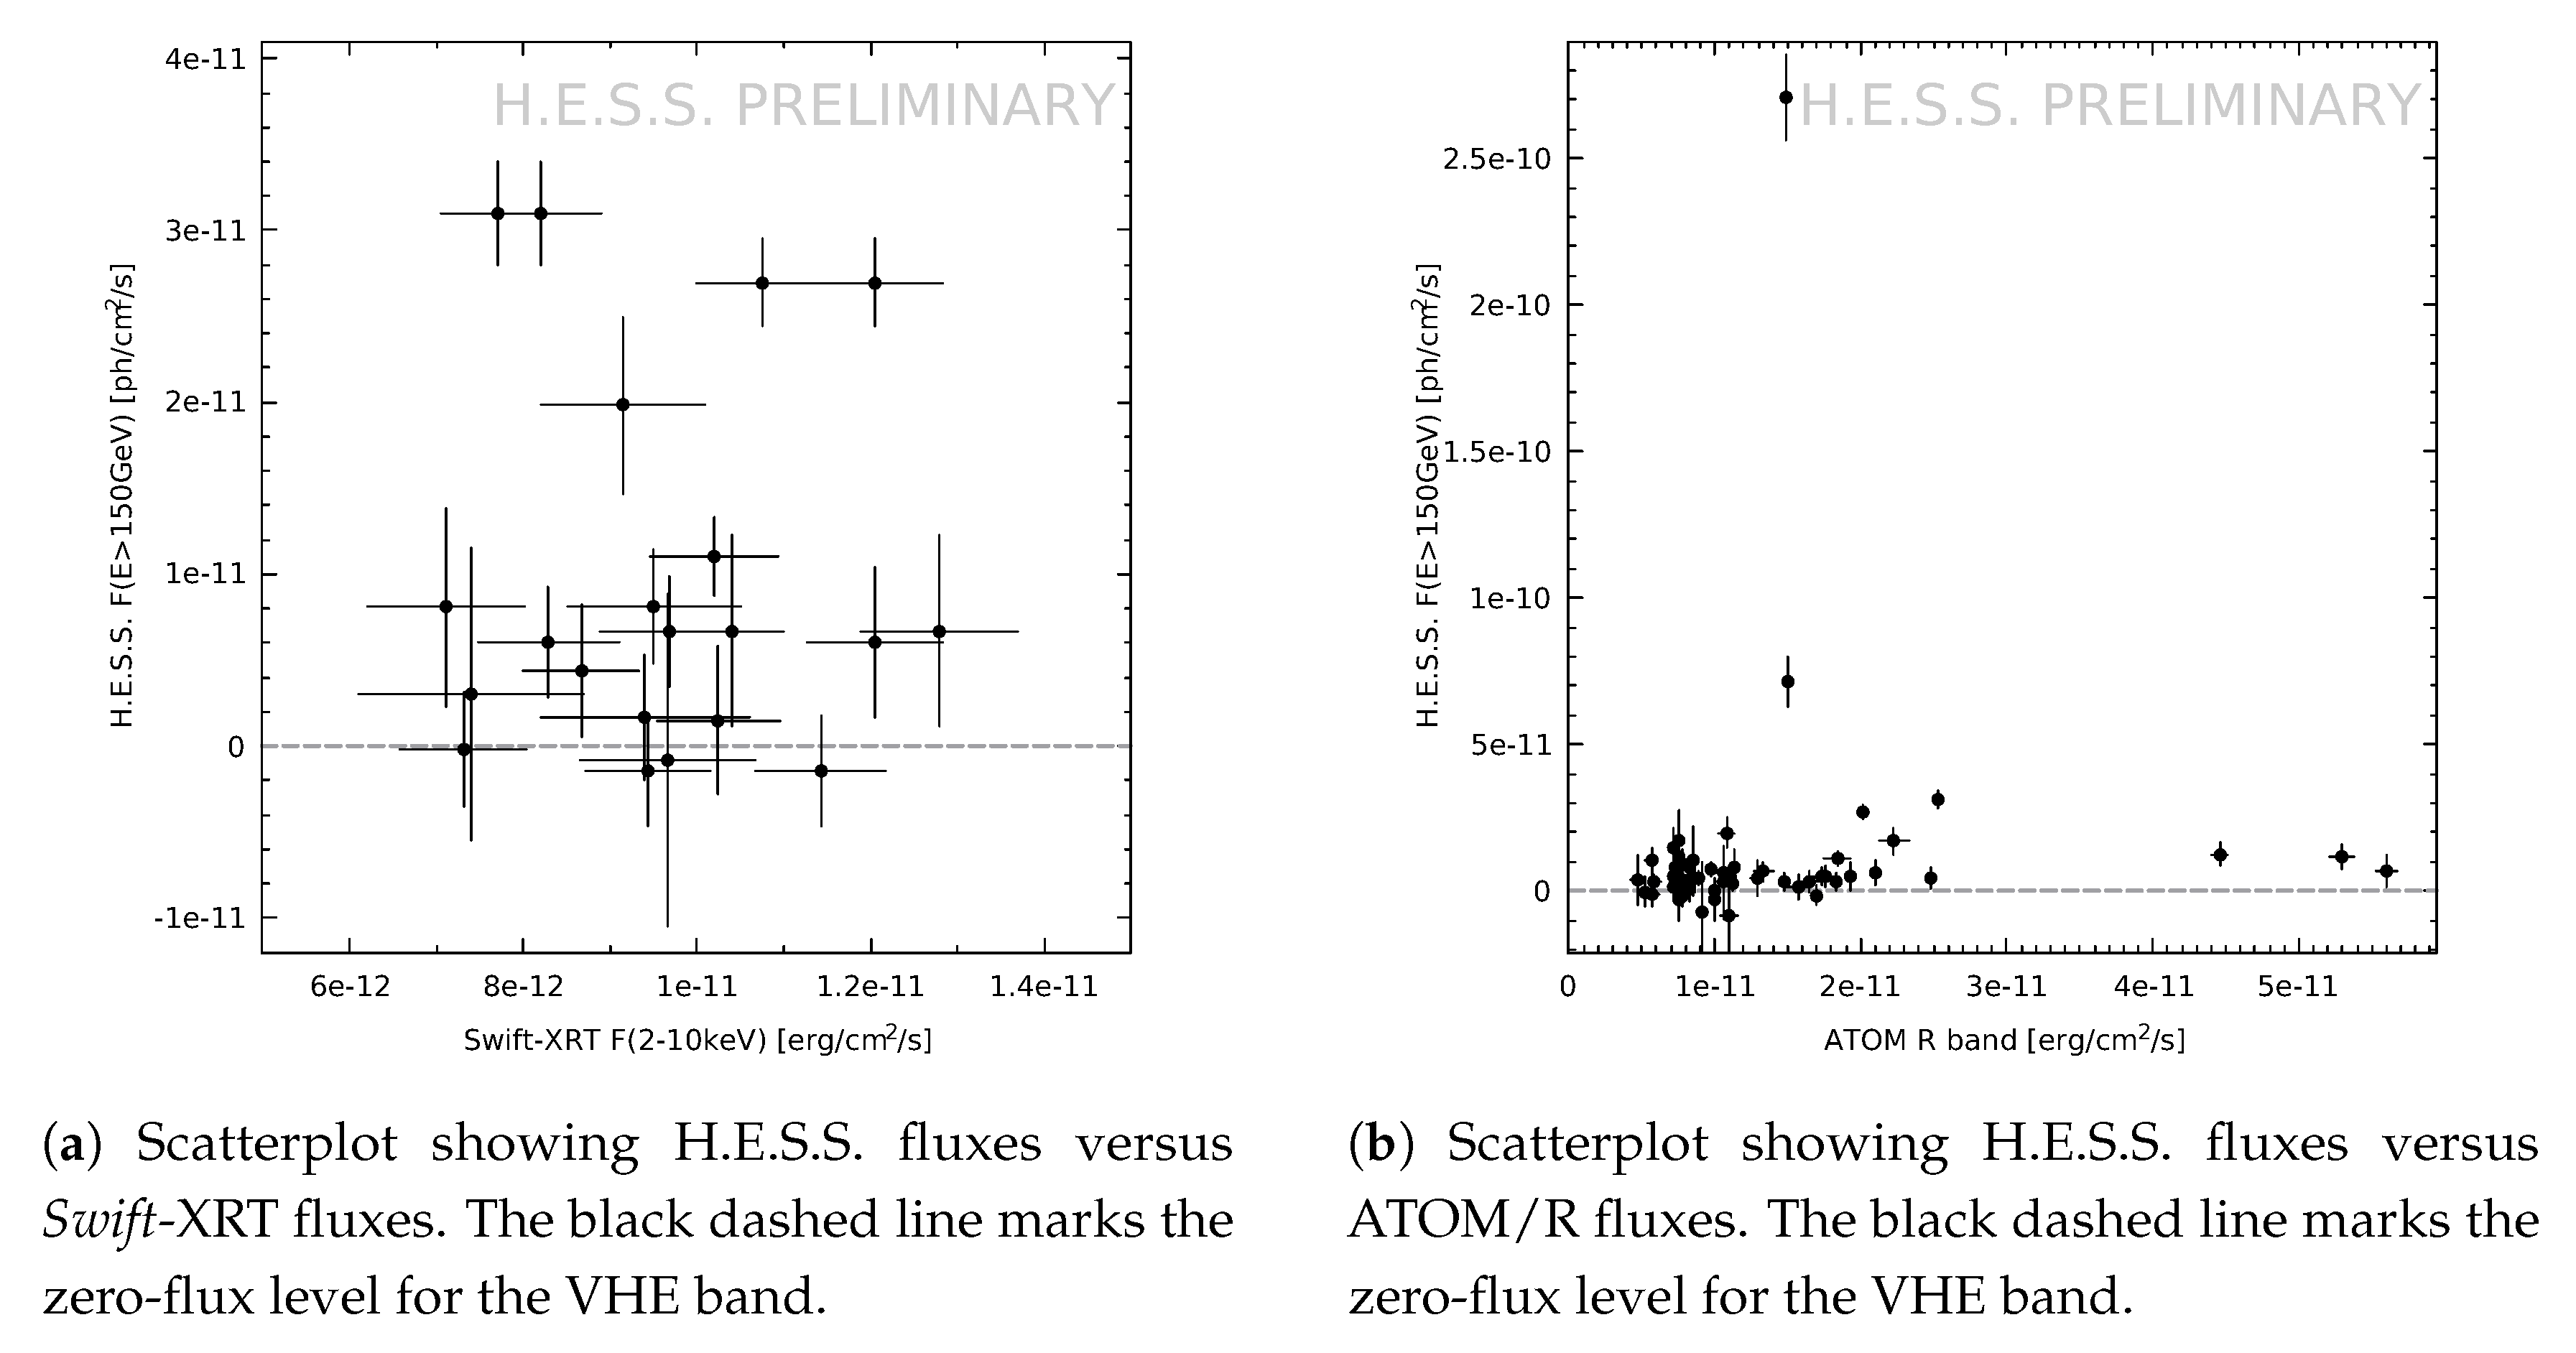
Scatterplots have also been produced for VHE versus X-ray and VHE versus R-band fluxes, which are shown in
Figure 4a,b, respectively. As the number of data points are low, no DCCFs have been calculated. No conclusions can be drawn from the VHE versus X-ray scatterplot at this point. Unfortunately, no X-ray coverage was obtained during the 2016 VHE flare. The VHE versus R-band scatterplot suggests that high optical fluxes (i.e., above
erg/cm
/s) imply significant VHE fluxes (i.e., fluxes that deviate by more than 1
from zero). The low number of data points makes this a weak conclusion. However, high VHE fluxes do not imply high optical fluxes (using the same threshold), as is demonstrated by the 2016 VHE flare.
3. The 2016 VHE Flare
The summary of the monitoring results in
Section 2 has already hinted at the unprecedented nature of the flare in 2016. The nightly lightcurve around this event is shown in
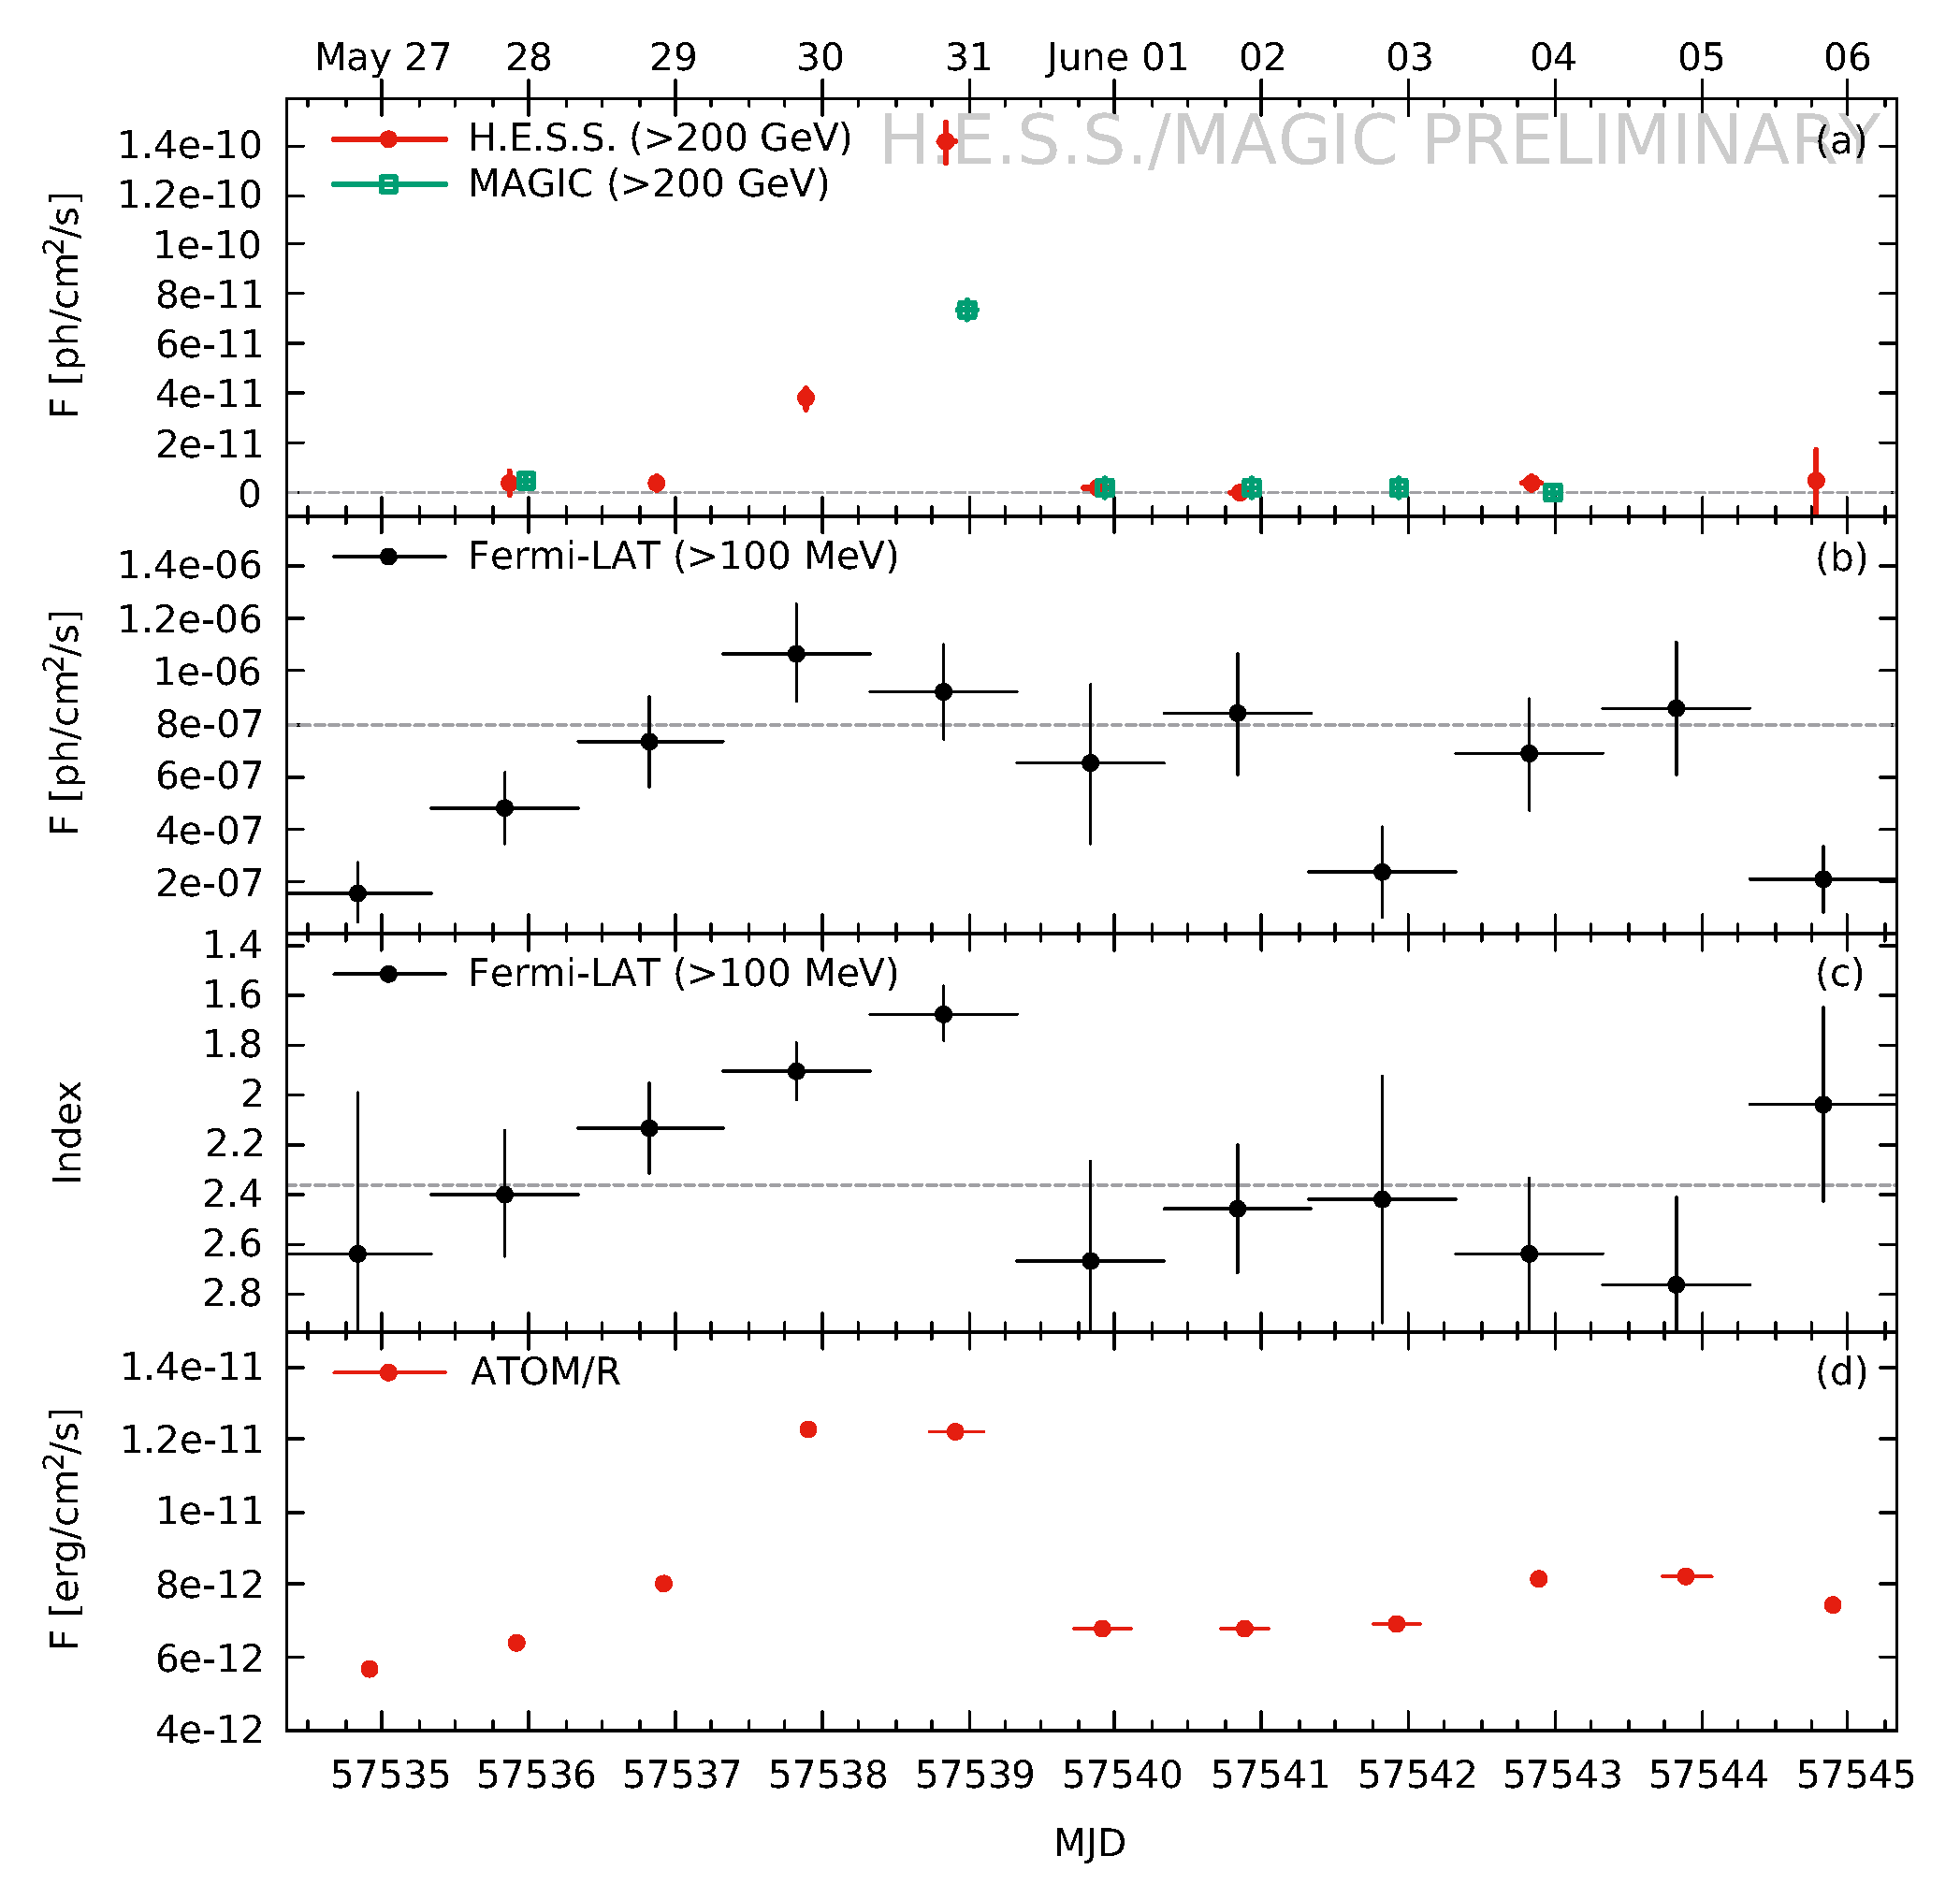
Figure 5. The flare lasted less than 3 days in the VHE band with a peak in the late hours of MJD 57538 (30 May 2016 —hereafter “maximum night”). In the HE band a flux rise seems to have happened. However, this is barely significant, as it is hovering around the long-term average and more than a factor 10 below previous flares. On the other hand, the spectral index clearly reduces compared to the average ∼2.4, peaking at ∼1.6. Hence, while the integrated flux in the HE band barely changed, the spectrum itself significantly hardened. The optical flux rises by a factor of 2 from the beginning of the event to its peak. However, this again is a much smaller flux than that exhibited in previous outbursts. Unfortunately, there is no strictly simultaneous coverage of this flare in any other band.
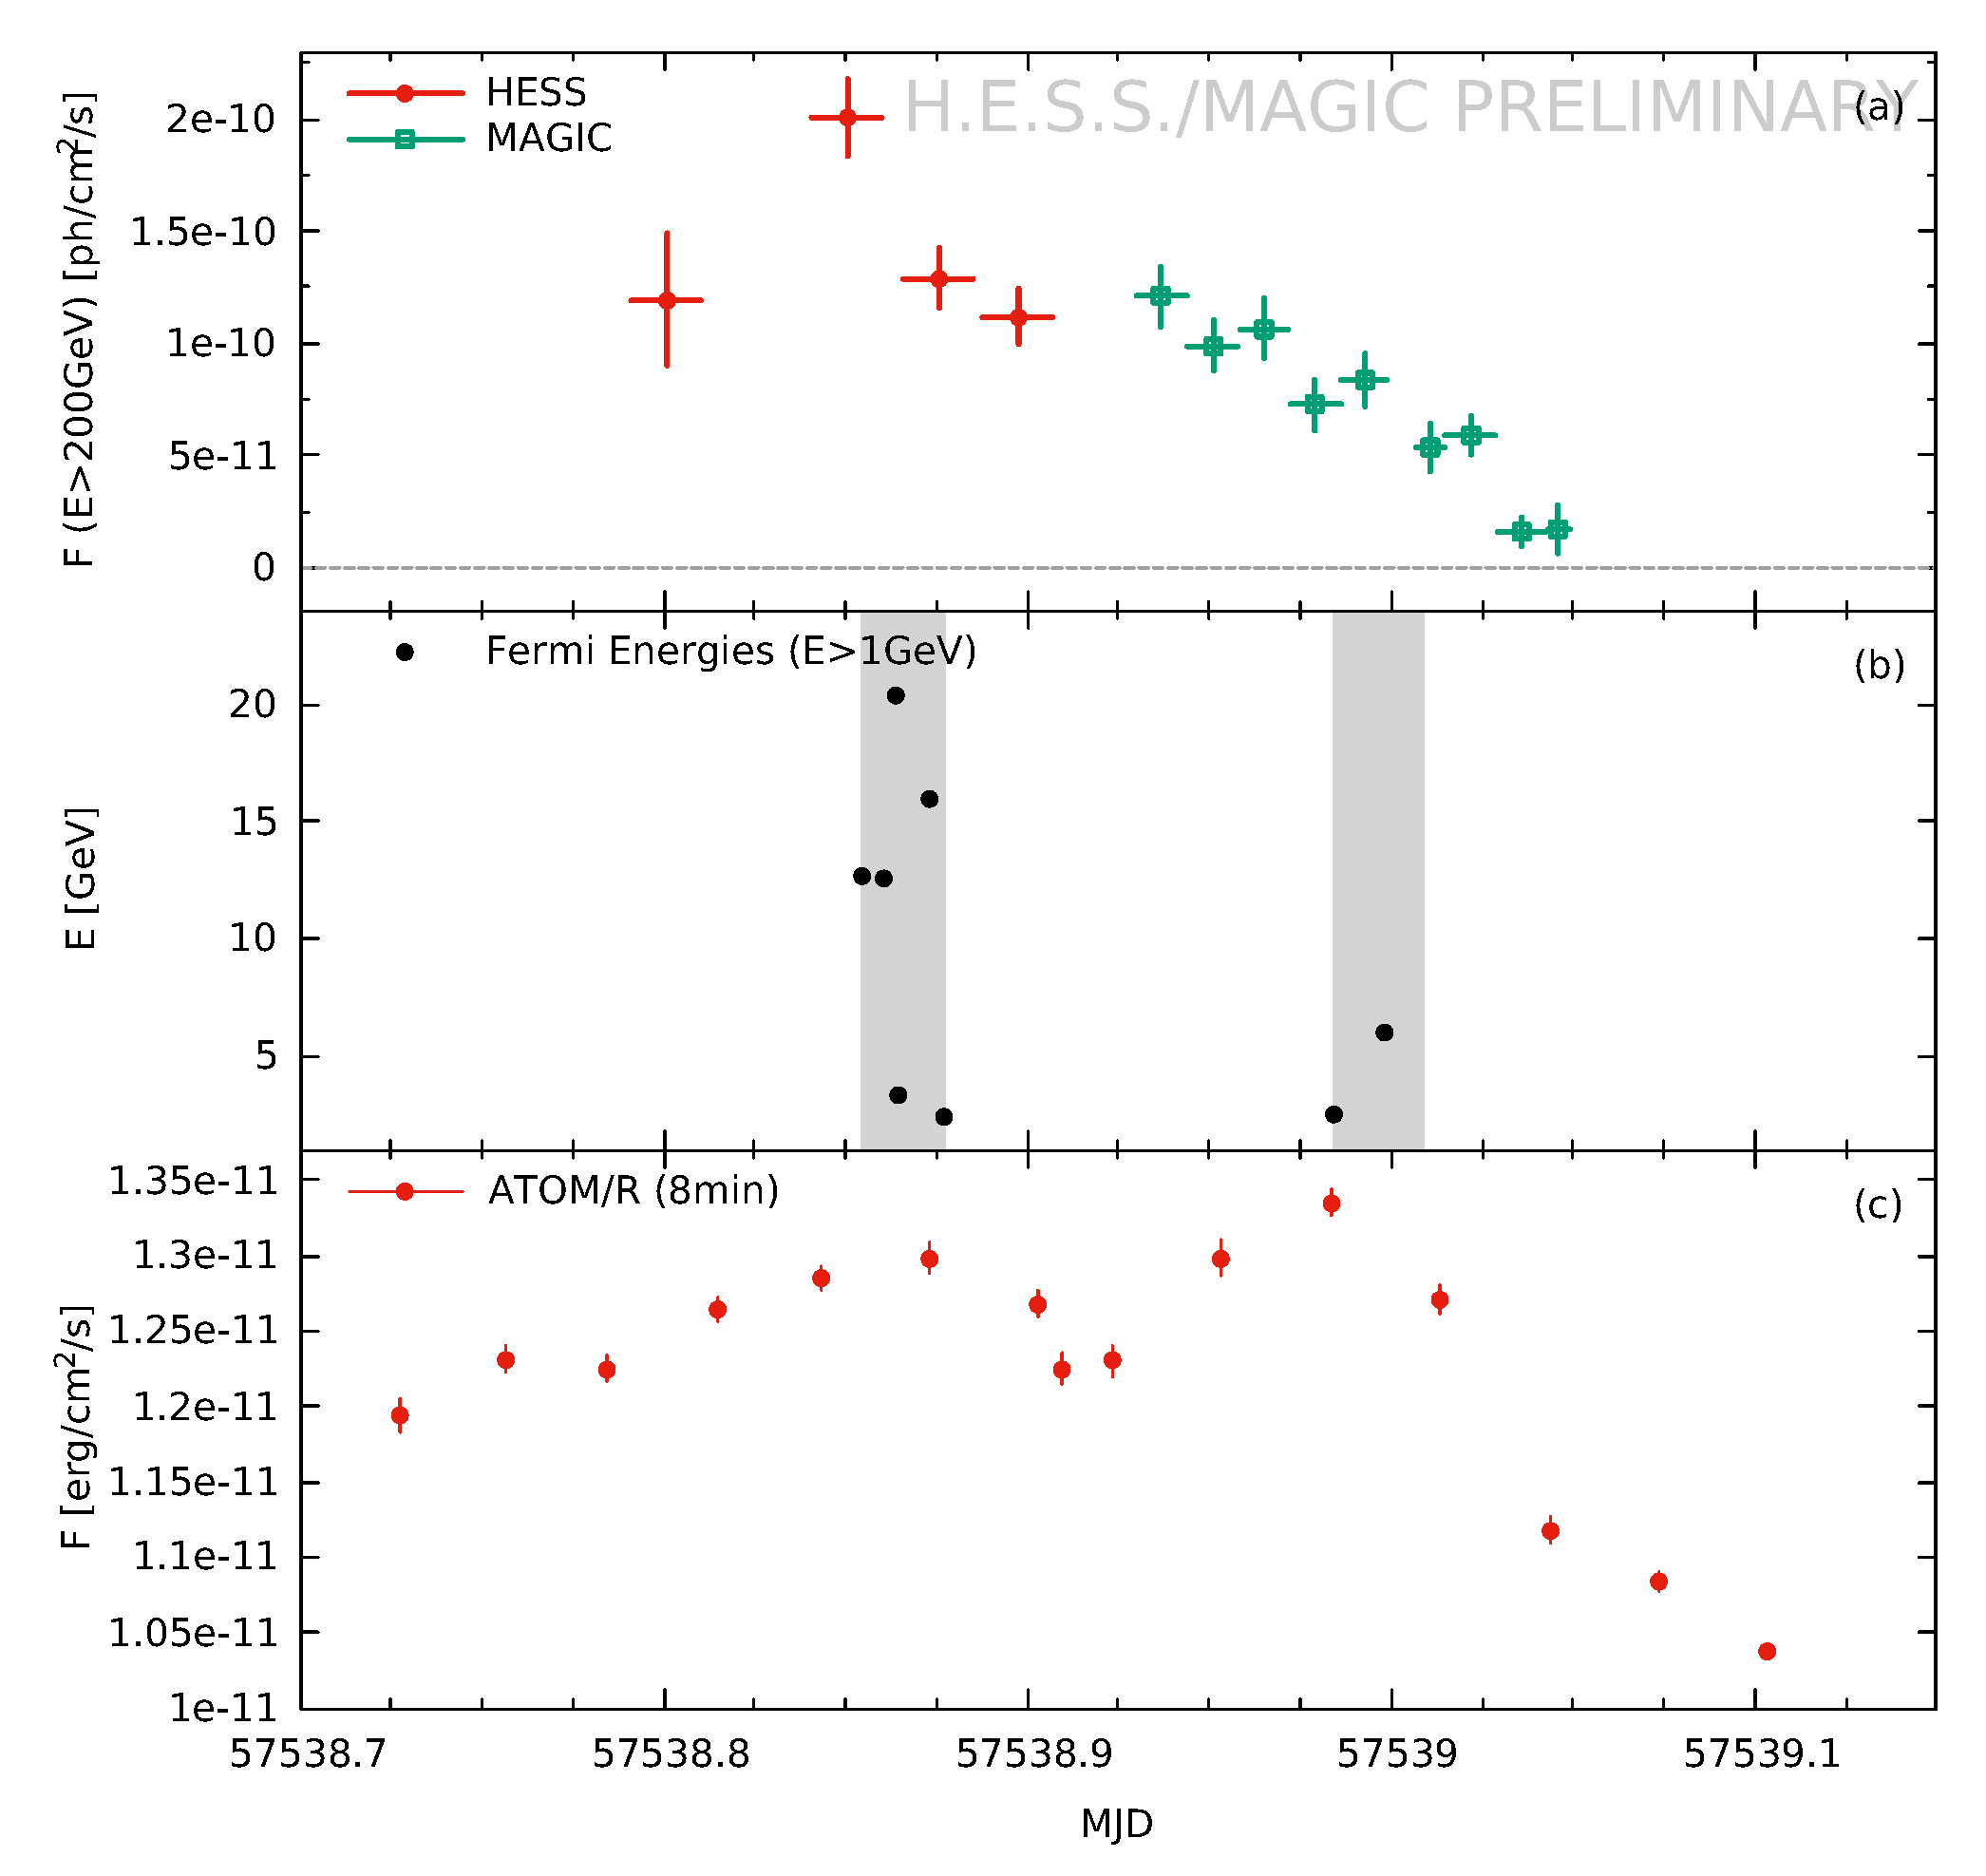
A detailed lightcurve of the maximum night is shown in
Figure 6. The VHE flux exhibits a peak with a flux ∼80% of the Crab above an energy of
GeV and a subsequent decay. From the peak to the minimum the flux fell by almost an order of magnitude. As the low flux in the HE band coupled with the small effective area of
Fermi-LAT inhibits short-time binning, individual photons recorded with
Fermi-LAT with energies
GeV are shown in the second panel.
Fermi-LAT recorded photons with energies up to
GeV during the H.E.S.S. observation window, but only 2 photons with energies
GeV in the MAGIC observation window. This is indicative of a softening of the spectrum at that time. The optical R-band flux recorded with ATOM exhibits a double-peaked structure, which is different than the VHE
-ray lightcurve. The optical flux only changes by ∼30%.
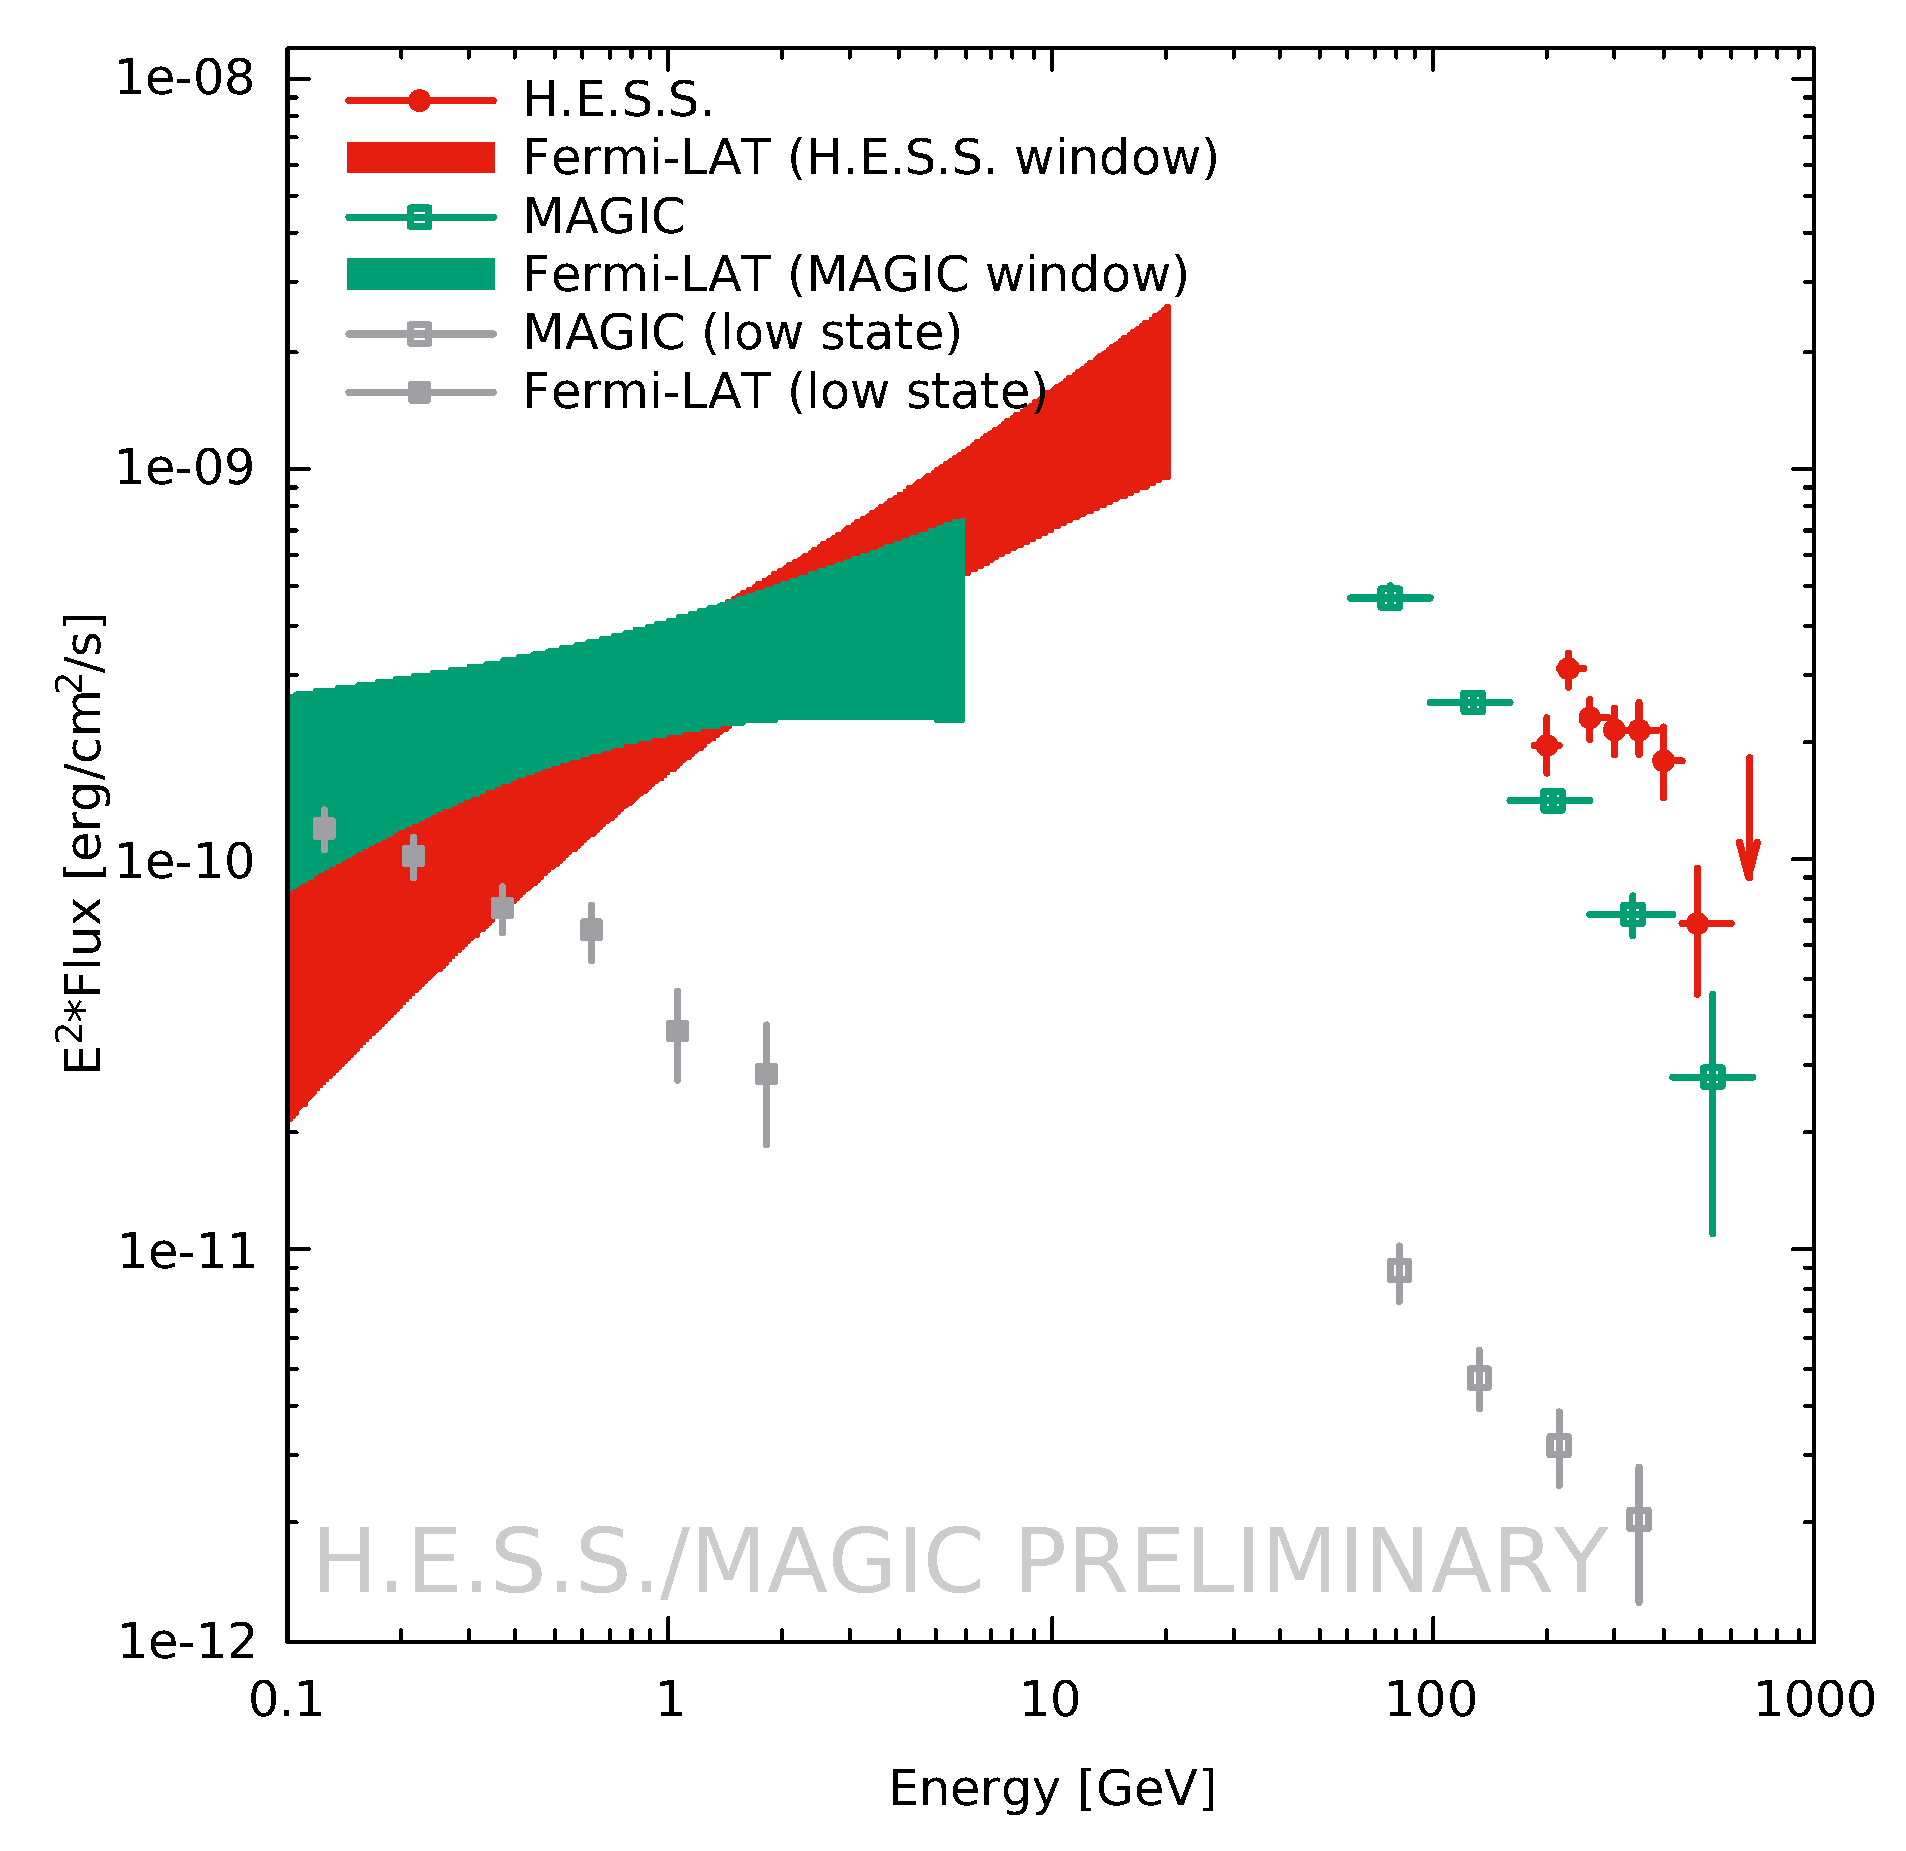
The
-ray spectra of the maximum night are shown in
Figure 7 along with the HE and VHE
-ray low-state spectra [
16]. The VHE
-ray spectra have been corrected for the absorption by the extragalactic background light (EBL) using the model of [
21]. The resulting deabsorbed spectra of the flare are compatible with power-laws with indices
and
, respectively. The HE
-ray spectra in the two VHE observation windows are compatible within errors being
during the H.E.S.S. time frame and
during the MAGIC time frame, respectively. The spectral breaks between the HE and the VHE
-ray band are, therefore,
during the H.E.S.S. time frame and
during the MAGIC time frame. The comparison with the low-state data clearly shows the significant shift of the peak energy from
MeV to
GeV during this flare.
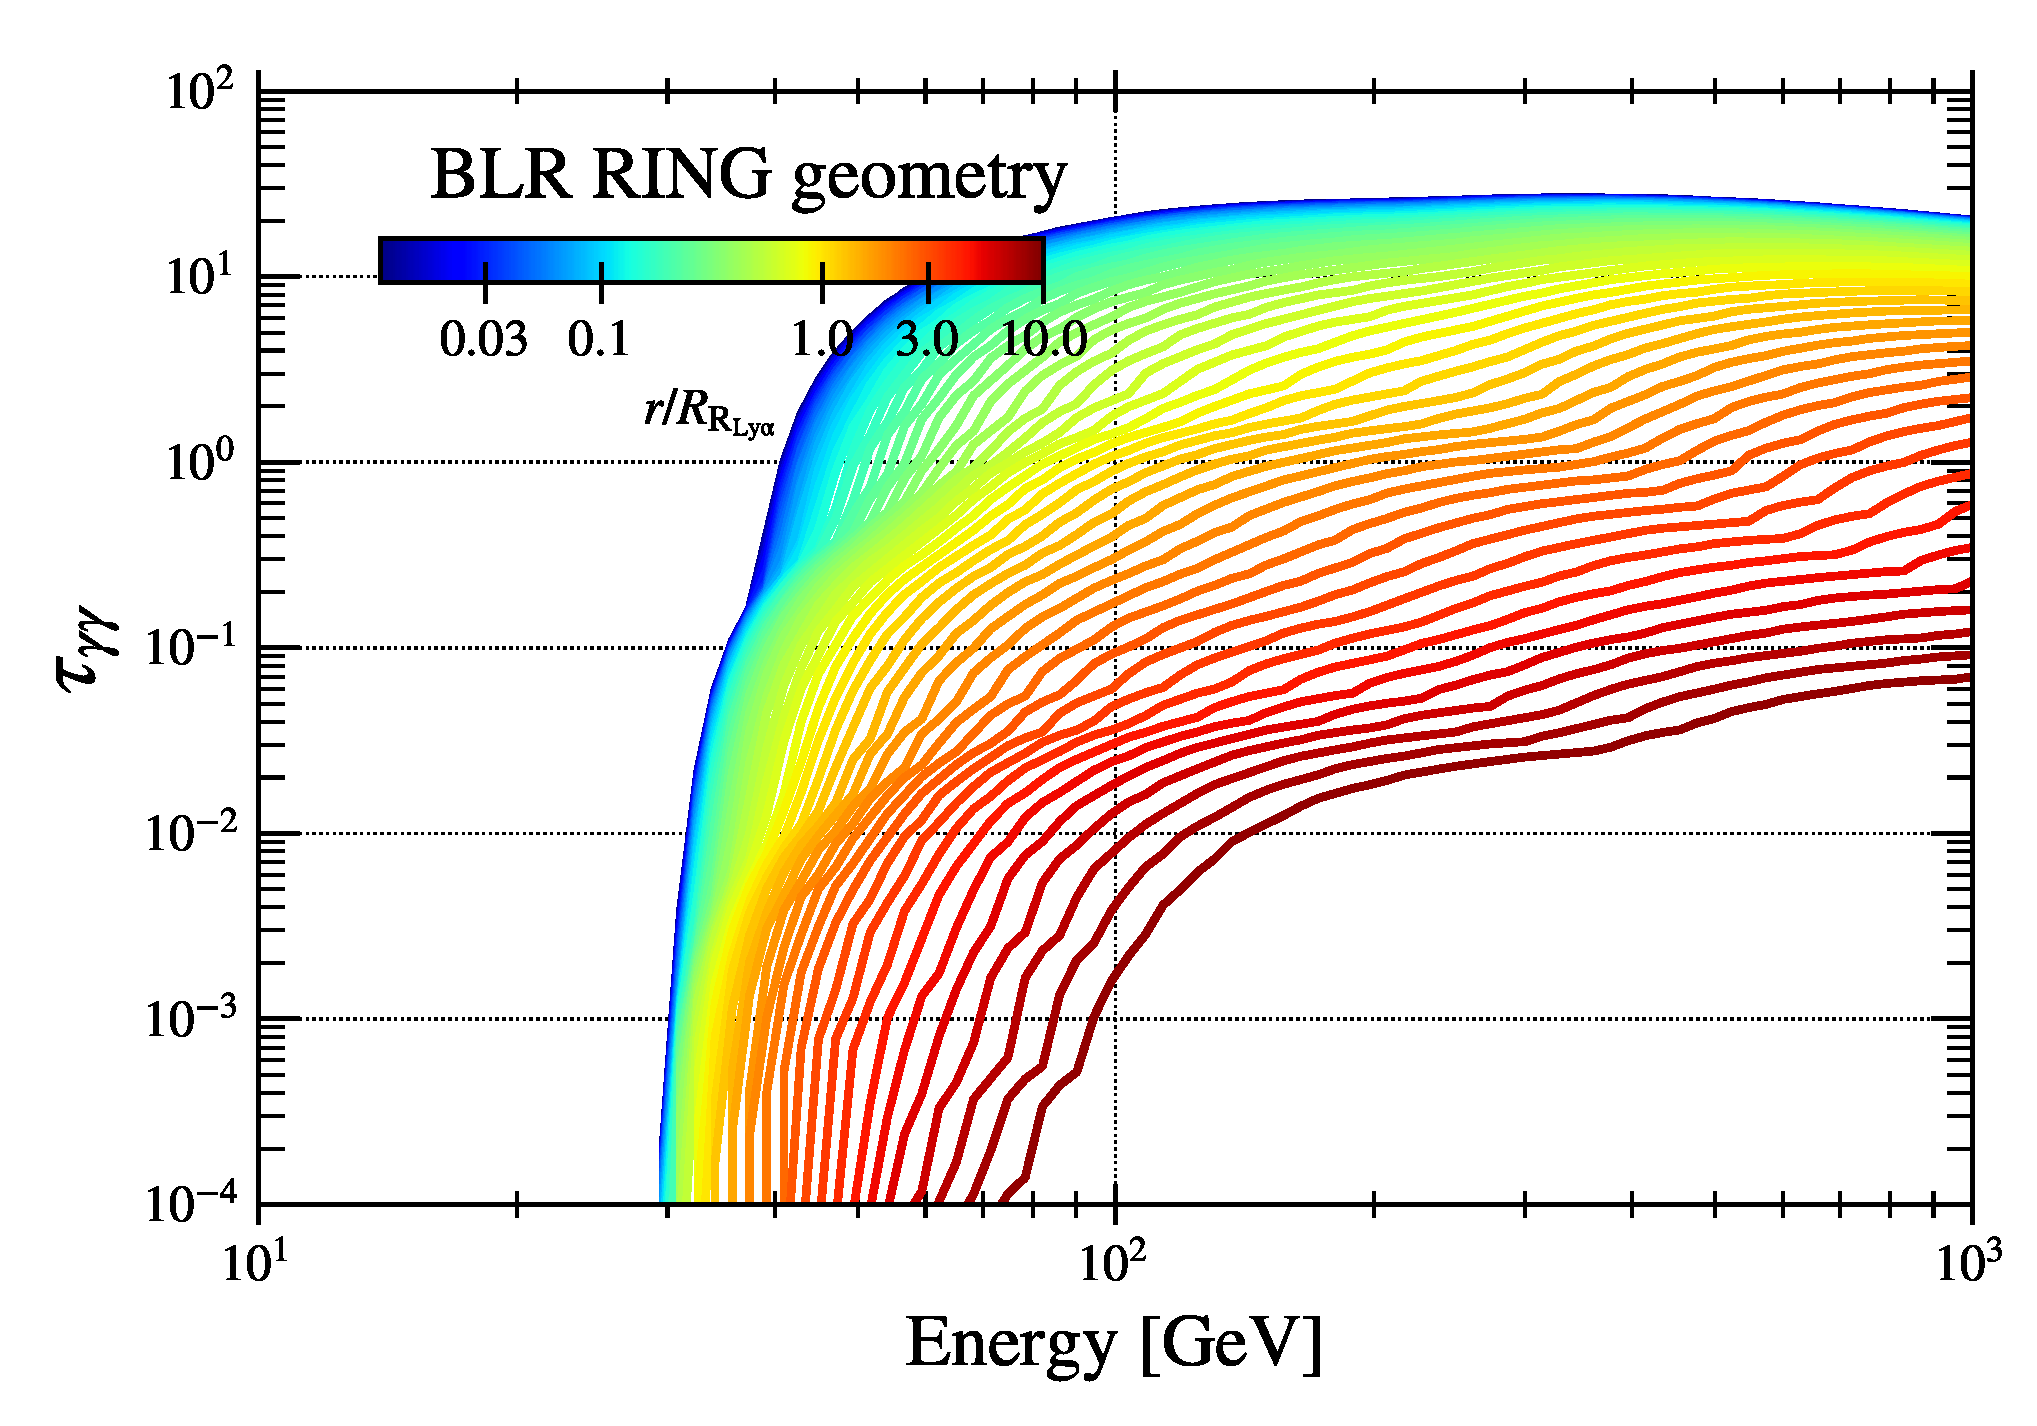
The spectral break can have several causes. The underlying particle distribution could exhibit a break due to the interplay of acceleration and cooling. The break could also be a sign of the Klein-Nishina reduction of the inverse-Compton cross-section at high energies. That the break remains roughly constant between the respective observation time windows while the spectra get softer, could be an indication of the Klein-Nishina reduction. A third possibility is that the spectral softening results from the absorption of VHE photons by external soft photon fields, such as those from the BLR. The resulting optical depth for different VHE emission region distances from the black hole is shown in
Figure 8. Obviously, the distance of the emission region from the black hole has a strong influence on the optical depth
.
One can conservatively estimate an upper limit on the degree of absorption by assuming that the spectrum detected by
Fermi-LAT represents also the intrinsic spectrum in the VHE domain. The degree of absorption
can then be derived by
where
is the extrapolated flux, and
is the observed flux.
Without going into details [
14], the calculation for the H.E.S.S. data set give a maximum value of
for the highest energies of
, while the MAGIC data gives a maximum value of
. These estimates agree within errors. Assuming the absorption is due to the BLR, the absorption values can be translated into a minimum distance of the emission region from the black hole. The emission region could be located at roughly
cm
pc from the black hole (c.f.
Figure 8). Assuming that the distance of the Ly
line represents the radius of the BLR [
22], the flaring region would at the very least be located on the outer edge of the BLR. This underlines the statement given above during the discussion of the monitoring data: the jet must be able to produce VHE
-rays on distances on the order of a significant fraction of a parsec from the black hole.
4. Summary & Conclusions
FSRQs are by now established VHE
-ray emitters. However, whether they are able to produce the VHE emission at all times or only during short bright flares has been an open question. This has led to the establishment of monitoring programs by the IACT experiments H.E.S.S. and MAGIC on the FSRQ PKS 1510-089, which is one of the closest of this type of blazars (redshift
). These programs are supplemented with multiwavelength data in the HE
-ray, X-ray and optical regime. The first important result obtained by MAGIC is that PKS 1510-089 can be detected at VHE
-rays during low states in the HE band [
16]. Similarly, variability has also been established through MAGIC observations [
13].
The H.E.S.S. monitoring described in detail here adds important features to these earlier results. Strong variability is detected in the VHE -ray domain, while the observations also hint to a persistent flux at other times. Interestingly, comparison of the VHE -ray lightcurve with other energy bands does not reveal any obvious correlation. This exemplifies the need for deep monitoring programs across the entire multiwavelength spectrum. Otherwise important effects—such as better sampling of correlation functions, variability time scales, etc.—might be missed for the interpretation of certain events.
The latter statement is further emphasized by the detection of an unprecedented VHE -ray flare in 2016 with H.E.S.S. that was followed up with MAGIC, as well. It was more than 10 times brighter than any flux seen at VHE -rays before (with a peak flux of 80% of the Crab) and lasted only 2 days. It was accompanied by a significant hardening of the HE -ray spectrum as observed with Fermi-LAT, while the HE fluxes remained rather low compared to other flares. The optical R-band observations with ATOM revealed a mild counterpart that was also much dimmer than previous flares, but exhibited a different flux evolution compared to the VHE band. Unfortunately, no other simultaneous data is available that could further constrain the spectrum.
All these observations reveal that the jet of PKS 1510-089 is able to accelerate particles to high energies to produce VHE -rays at all times. It also implies that these emission regions are probably located beyond the BLR, as otherwise the VHE emission should be strongly absorbed. This has been shown here specifically for the 2016 VHE flare. A simple estimate of the maximum absorption allowed for by the data results in a lower limit on the black hole distance, which indicates a location of the emission region on the edge of or beyond the BLR.
In conclusion, deep and, preferably, unbiased monitoring programs on FSRQs and blazars in general are important to reveal the general behavior of the sources, as well as to uncover new and unexpected features.
