1. Herschel Planetary Nebula Survey
The life cycle of matter in the Universe is synonymous with the stellar evolution, because the chemical evolution of galaxies is made possible by stellar mass loss that would expel nucleosynthesized matter into the interstellar environments. Planetary nebulae (PNe) are low to intermediate initial mass stars that have completed mass loss during the preceding asymptotic giant branch (AGB) phase. PNe, consisting of a hot central star (>30,000 K; evolving to become a white dwarf) and an extensive circumstellar shell, are in the evolutionary stage during which the object becomes the most luminous and the circumstellar shell reaches its largest extent before the shell begins to dissipate into the ISM.
While PNe are famous for their spectacular circumstellar structures seen often via bright optical emission lines arising from the ionized gas component of the nebula, the ionized part of PNe is surrounded by the neutral gas and dust components of lower temperature (i.e., the photo-dissociated region, or the PDR). Hence, each of these ionic/atomic/molecular/dust components in the circumstellar shell of a PN contains variable clues about the history of mass loss from the central star. By investigating spatially extended emission from each of the ionized, atomic, and molecular gas and dust components of PNe, one can infer ionic, elemental, and molecular/dust abundances and the mass loss and evolutionary histories of the central star. Therefore, PNe provide unique laboratories to further our understanding of the stellar evolution and the chemical evolution of galaxies.
Historically, there is a wealth of archival PN data in the UV and optical. The bright ionized gas in PNe is also bright in the radio continuum. With the advent of new technologies, PN observations in the X-ray and IR follow suit. A new window of opportunity in the far-IR is opened lately by a suite of space telescopes. We conduct the Herschel Planetary Nebula Survey (HerPlaNS) [
1] and its follow-up archival study, HerPlaNS+, using PN data collected with the Herschel Space Observatory [
2].
2. NGC 6781
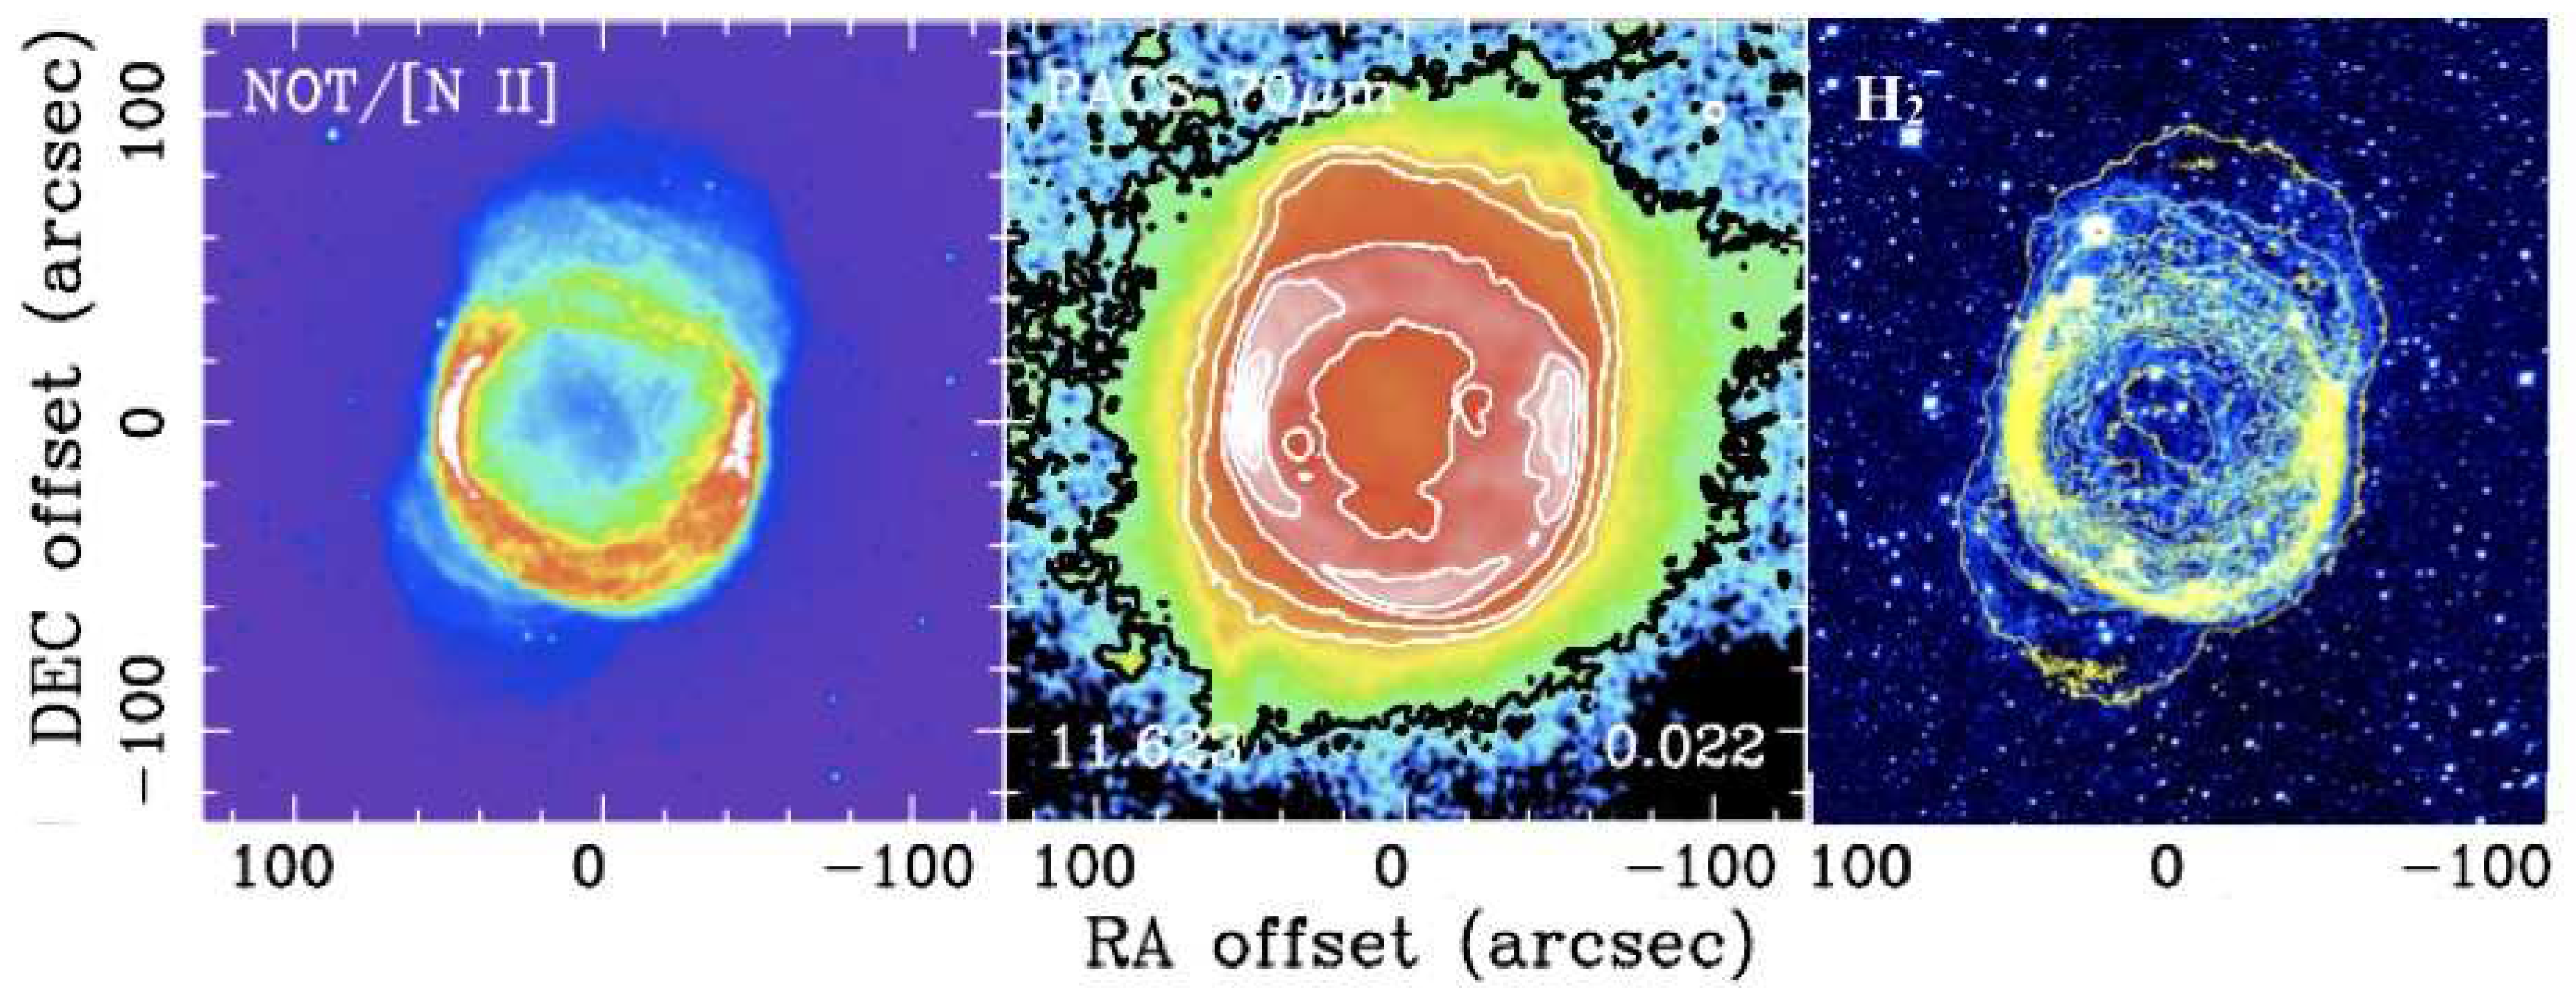
NGC 6781 is a PN exhibiting its almost pole-on bipolar nebula structure via its optical, near-IR, and radio images [
3,
4,
5] as well as our own far-IR images [
1], as shown in
Figure 1. Because the observed distributions of emission at different wavelengths representing distinct nebular components appear very similar to one another, a highly steep temperature gradient (and hence, density gradient) is expected in the observed parts of the circumstellar nebula. This probable presence of a steep density gradient is actually consistent with expectations from two-wind interactions, in which fast wind emanating from the central star during the PN phase catches up with the slower-moving AGB wind, interacting and piling up at the interface between the two winds.
Our own observations of NGC 6781 in the far-IR with Herschel [
1] nearly complete the full spectral coverage for this PN, providing one of the most comprehensive panchromatic data set ever assembled for a PN. By taking advantage of this extensive data set, we set out to generate a coherent model of NGC 6781 that satisfies the adopted panchromatic data as comprehensively as possible. To this end, we derive the empirical characteristics of the central star and its nebula with a greater amount of self-consistency, and use the derived quantities as input parameters and/or constraints to construct a dusty photoionization model consisting of ionized, atomic, and molecular gas plus dust grains ([
6] to which readers are encouraged to refer, as a fair amount of details is left out from this contribution).
2.1. Plasma Diagnostics
We determine the electron density and temperature ( and ) of the ionized gas component of NGC 6781 from 9 diagnostic lines based on 15 line ratios computed from 28 line fluxes of collisionally excited and recombination lines out of 81 individual lines measured from the adopted spectra of the object. By iterating the - diagnostics, we compute first while fixing 10,000 K, and re-compute using the derived for lines of similar excitation energies.
These diagnostics yield between 100 and 10,000 cm and between 7070 and 10,800 K. Also, diagnostics of mid-IR H thermal emission lines, guided by resolved images, suggest that the inner cavity of the bipolar nebula is 300 cm, the nebula waist is 960 cm, and there is a physically thin pile-up of molecular gas at 10,000 cm surrounding the nebula waist.
2.2. Abundance Analyses
The measured line fluxes yield ionic abundances for 19 species, from which elemental abundances for 9 species are determined. In comparison with abundance patterns of theoretical AGB models [
7,
8], the derived abundances suggest that the central star of NGC 6781 was initially a 2.25–3.0 M
star and that Si and S depletion is consistent with the presence of dust grains.
2.3. Properties of the Central Star
The measured photometry of the central star is fit with a grid of synthesized spectra [
9] to determine the luminosity (
) as a function of the distance (
D) and the effective temperature of the star (
). Also in comparison with the AGB nucleosynthesis models [
7,
8], we conclude that the best fit quantities for NGC 6781 are 0.46 kpc, 104–196 L
, and 10–140 kK. Our luminosity fitting results turn out to be fairly robust as Gaia finds the object to be located at 0.49 kpc [
10].
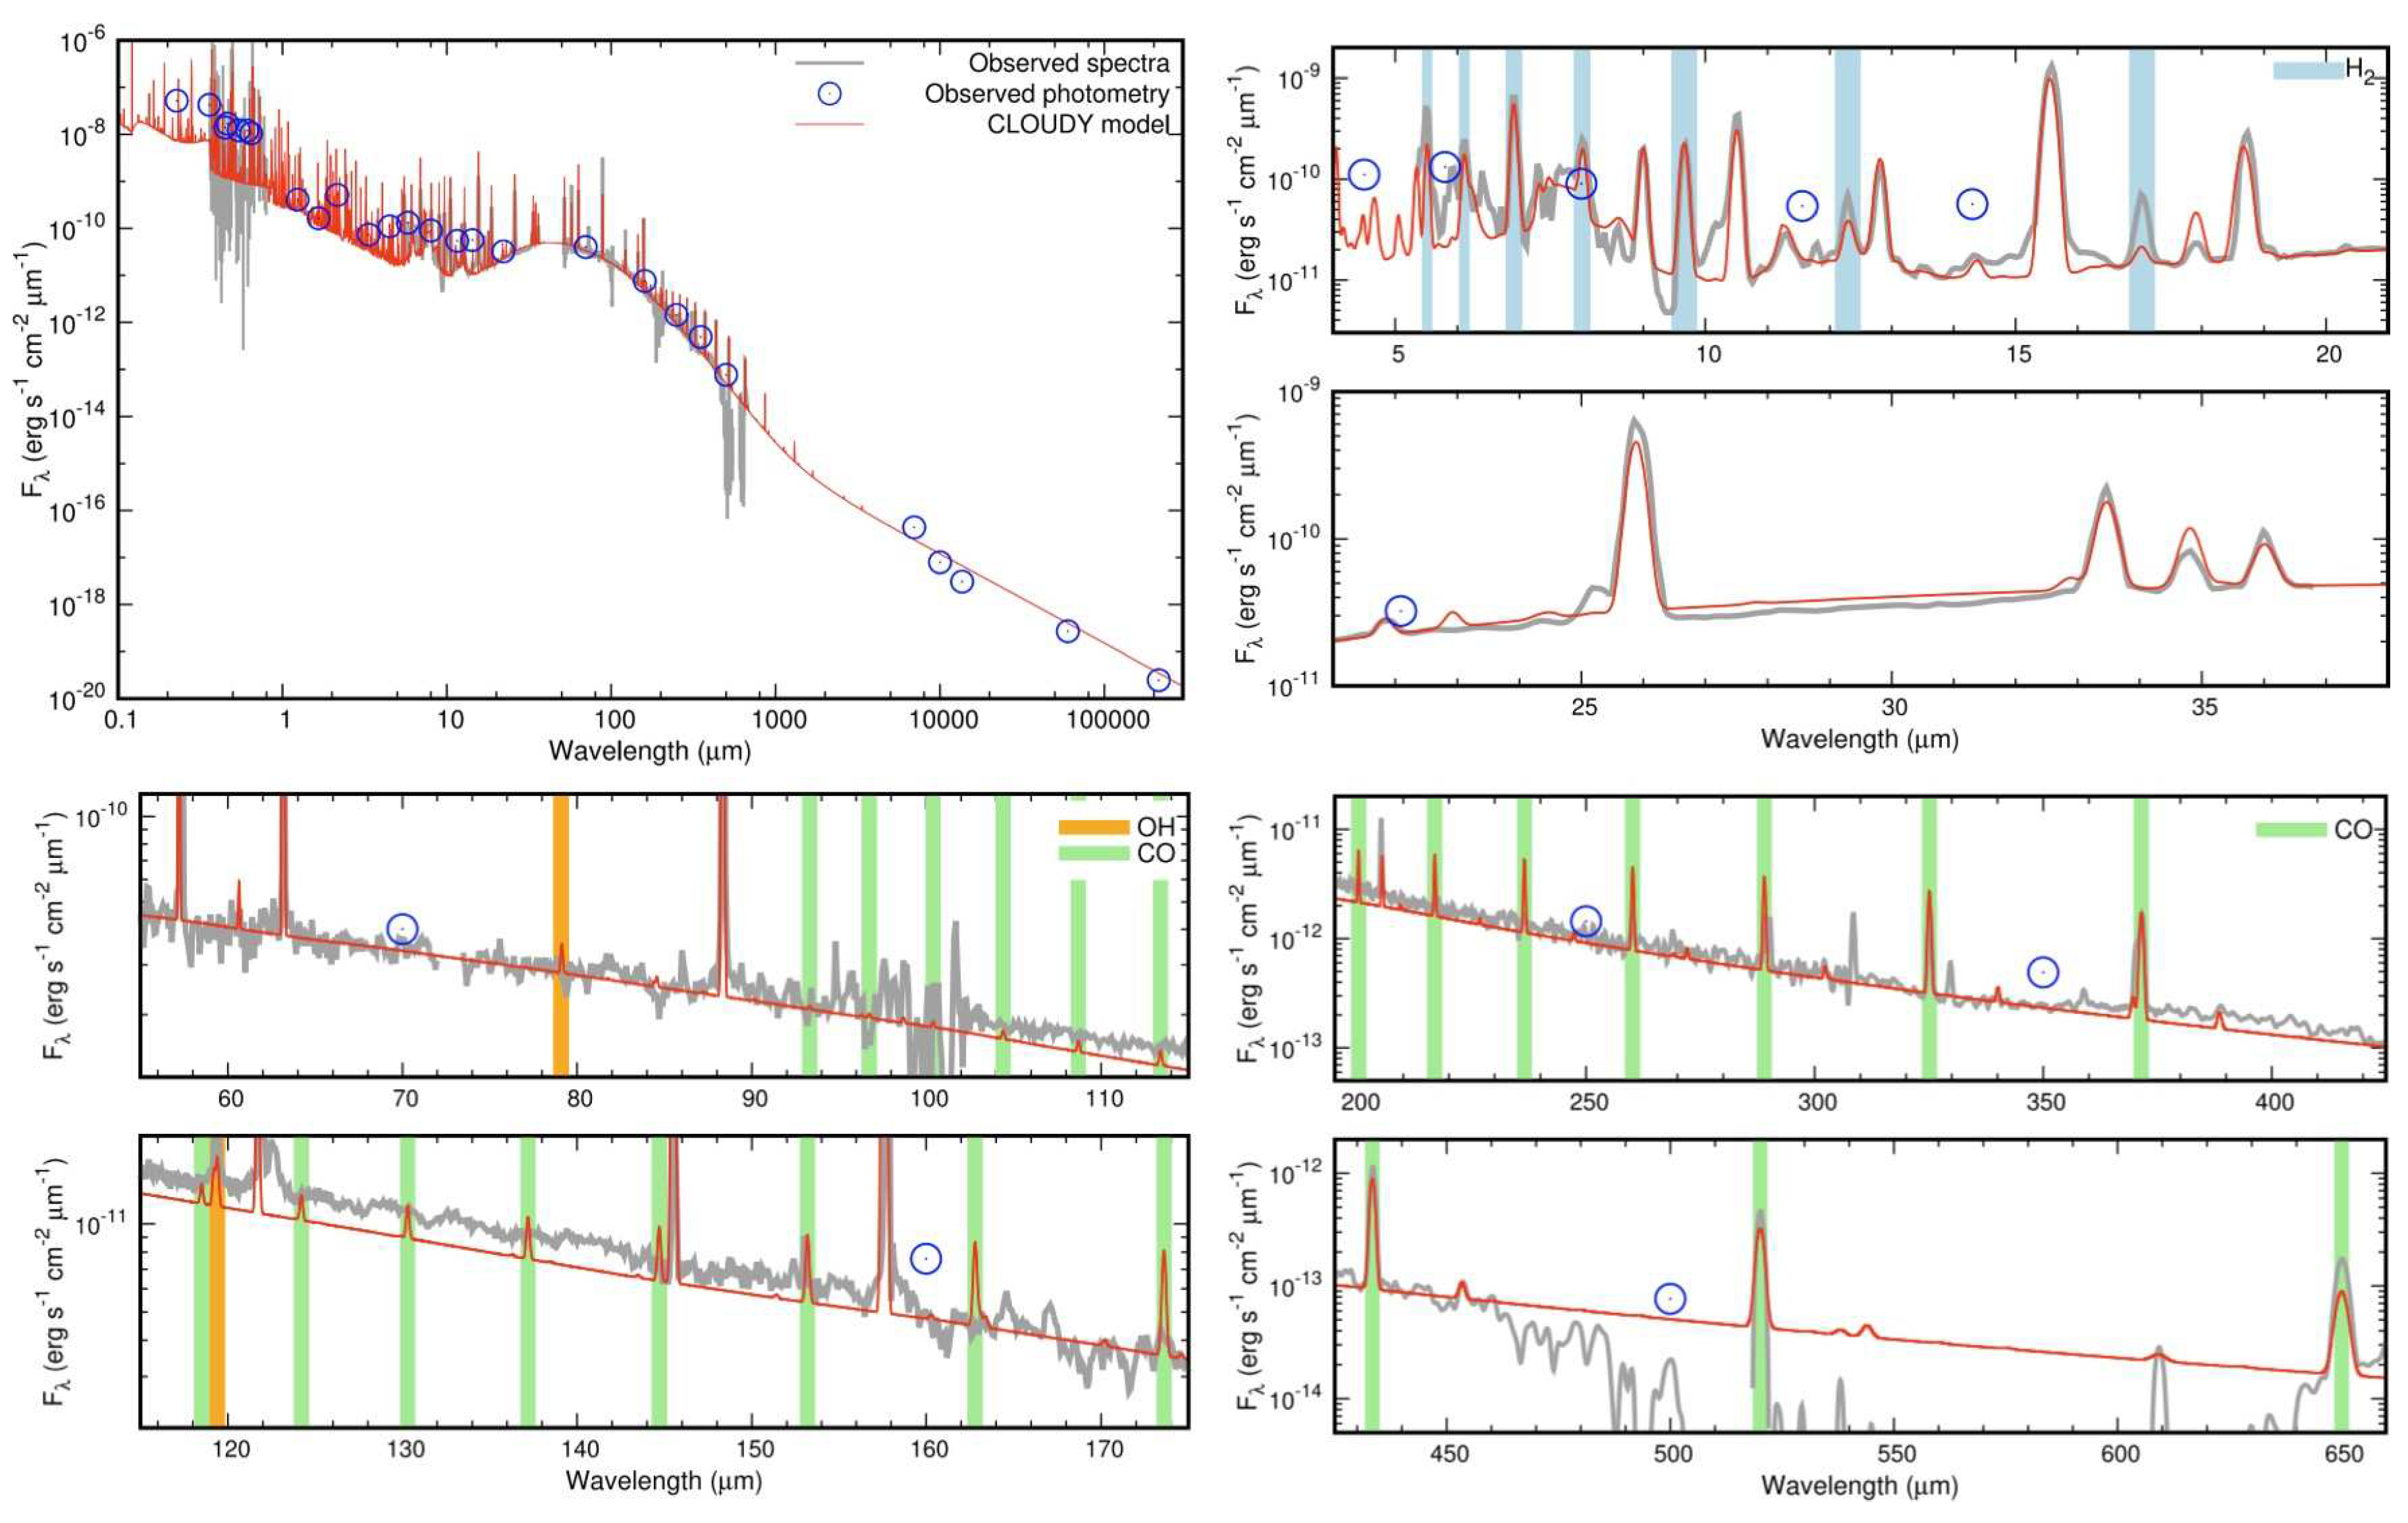
3. Cloudy Best-Fit Modeling of NGC 6781
We perform best-fit dusty photoionization modeling for NGC 6781 using the Cloudy code [
11]. The analyses outlined in the previous section yield input model parameters, while the 3-D shape of the nebula is inferred from the apparent nebula morphology seen in resolved images at various wavelengths. To find the best-fit spectral energy distribution (SED) model, we vary 13 parameters—
,
, the inner radius of the shell (
), elemental abundances (
(He/N/O/Ne/Si/Cl/Ar), except for
(C) which is fixed), dust and PAH mass fraction, and the minimum temperature of the PDR—within given ranges of respective uncertainties.
We terminate iterations when the predicted flux density at 250 m reaches the corresponding observed value. Practically, this condition sets the maximum radius of the shell () as this quantity controls the amount of dust in the outer regions of the shell, and hence, the amount of dust continuum in the far-IR. In this sense, is not a free parameter. The goodness of the fit is determined by (16 for the best-fit model) calculated from the deviation of 136 constraints (37 broadband fluxes, 78 gas emission line fluxes relative to H as well as I(H), 19 flux densities in mid-IR, far-IR, and radio wavelengths, and the ionization boundary radius, ) between a model and the adopted data.
4. Highlights of the Results
We briefly highlight a number of notable characteristics that are found in the best-fit model.
4.1. The Presence of the PDR in PNe
As the observed SED clearly indicates, a significant amount of energy output from NGC 6781 happens in the PDR via molecular and dust continuum emission (
Figure 2). In the best-fit model, 70% of the dust component is found to exist beyond the ionization boundary, suggesting that the density distribution continues beyond the observed ionized nebula as the PDR. In addition, a model without the PDR is also constructed and is found to underestimate the far-IR fluxes significantly. Therefore, while PNe are generally known to be almost synonymous to compact H
ii regions in the Universe, they also contain a significant amount of cold atomic and molecular gas and dust grains.
4.2. The Amount of Matter in the Circumstellar Nebula
From the best-fit model we can account for the amount of “observed” matter in the nebula. The best-fit model yields that the nebula harbors 0.09 M
of ionized gas, 0.12 M
of atomic gas, 0.20 M
of molecular gas, plus 0.0015 M
of dust grains, totaling 0.41 M
of circumstellar matter. Assuming that the central star is a 2.5 M
initial mass star, it should have evolved to become a white dwarf of 0.63 M
by now [
7]. This implies that we expect 1.87 M
of circumstellar matter, and hence, means that we observationally account for only 22% of the circumstellar matter expected to exist in the circumstellar nebula of NGC 6781. Implications of this finding are enormous.
AGB evolutionary models predict that a 2.5 M initial mass star would experience 25 AGB thermal pulse (TP) episodes while ejecting the total mass of about 1.25 M. However, the predicted amount of the mass-loss ejecta would remain small ( M) until the 22nd TP episode. This means that the amount of the ejecta would increase precipitously over the last three TP episodes, reaching 0.70 M during the last TP episode. Therefore, our best-fit model accounts for roughly 60% of the amount of mass theoretically predicted to have been ejected during the last TP episode.
It has been naively expected that the history of mass loss can be learned from the density distribution in the circumstellar shells of PNe and AGB stars. However, the present result indicates that the instrument sensitivities is still not sufficient to probe the history of stellar mass loss, even beyond one TP ejection. Hence, there is still a long way to go to observationally account for the full mass-loss history of these stars. Alternatively, this could mean that theoretical models may need to be re-calibrated in terms of mass-loss prescriptions so that less mass gets ejected.
4.3. Gas-to-Dust Mass Ratio
The integrated gas-to-dust mass ratio (of the last TP) turns out to be 273 (=0.41/0.0015). This value is much smaller than the value of
found from a group of C-rich AGB stars [
12]. Note, however, that for this previous work, the amount of dust was estimated from N-band photometry of warm dust while the amount of gas was derived from CO J = 1-0 measurements of cold gas. This means that these gas and dust components may not have been sampled from the same location in the observed AGB circumstellar shells. So, the ratio may not be as high but certainly higher than 100.
5. Future Prospects
Our HerPlaNS+ archival survey will yield a fair number of PNe showing resolved structures in the far-IR, in dust continuum and/or fine-structure lines of atomic gas. Also, we are conducting an optical 2-D spectroscopy campaign for a handful of PNe for which far-IR PN data already exist. Hence, we can perform similar investigations based on comprehensive panchromatic data sets for a number of objects in near future to see if the observationally accounted amount of circumstellar mass in PNe is systematically lower than theoretical predictions or not. If this trend is found to persist among PNe, it could really mean that theoretical predictions need to be re-calibrated accordingly. Implications of this possibility is significant, as our understanding of the life cycle of matter in the Universe relies on our understanding of the stellar evolution.
Author Contributions
Writing original draft, T.U.; Investigation, M.O.
Funding
Masaaki Otsuka was supported by the research funds 104-2811-M-001-138 and 104-2112-M-001-041-MY3 from the Ministry of Science and Technology (MOST), Toshiya Ueta was partially supported by an award to the original Herschel observing program (OT1_tueta_2) under Research Support Agreement (RSA) 1428128 issued through JPL/Caltech, and by NASA under grant NNX15AF24G issued through the Science Mission Directorate.
Acknowledgments
This work is partly based on observations made with the Herschel Space Observatory, a European Space Agency (ESA) Cornerstone Mission with significant participation by National Aeronautics and Space Administration (NASA).
Conflicts of Interest
The authors declare no conflict of interest.
References
- Ueta, T.; Ladjal, D.; Exter, K.M.; Otsuka, M.; Szczerba, R.; Siódmiak, N.; Aleman, I.; van Hoof, P.A.M.; Kastner, J.H.; Montez, R., Jr.; et al. The Herschel Planetary Nebula Survey (HerPlaNS) I. Data overview and analysis demonstration with NGC6781. Astron. Astrophys. 2014, 565, A36. [Google Scholar] [CrossRef]
- Pilbratt, G.L.; Riedinger, J.R.; Passvogel, T.; Grone, G.; Doyle, D.; Gageur, U.; Heras, A.M.; Jewell, C.; Metcalfe, L.; Ott, S.; et al. Herschel Space Observatory. An ESA facility for far-infrared and submillimetre astronomy. Astron. Astrophys. 2010, 518, L1. [Google Scholar] [CrossRef]
- Phillips, J.P.; Ramos-Larios, G.; Guerrero, M.A. Optical and mid-infrared observations of the planetary nebula NGC 6781. Mon. Not. R. Astron. Soc. 2011, 415, 513–524. [Google Scholar] [CrossRef]
- Puget, P.; Stadler, E.; Doyon, R.; Gigan, P.; Thibault, S.; Luppino, G.; Barrick, G.; Benedict, T.; Forveille, T.; Rambold, W.; et al. WIRCam: The infrared wide-field camera for the Canada-France-Hawaii Telescope. Proc. SPIE 2004, 5492, 978. [Google Scholar]
- Bachiller, R.; Huggins, P.J.; Cox, P.; Forveille, T. The spatio-kinematic structure of the CO envelopes of evolved planetary nebulae. Astron. Astrophys. 1993, 267, 177. [Google Scholar]
- Otsuka, M.; Ueta, T.; van Hoof, P.A.M.; Sahai, R.; Aleman, I.; Zijlstra, A.A.; Chu, Y.-H.; Villaver, E.; Leal-Ferreira, M.L.; Kastner, J.; et al. The Herschel Planetary Nebula Survey (HerPlaNS): A Comprehensive Dusty Photoionization Model of NGC6781. Astrophys. J. Suppl. Ser. 2017, 231, 22. [Google Scholar] [CrossRef] [PubMed]
- Karakas, A.I. Updated stellar yields from asymptotic giant branch models. Mon. Not. R. Astron. Soc. 2010, 403, 1413–1425. [Google Scholar] [CrossRef]
- Vassiliadis, E.; Wood, P.R. Evolution of low- and intermediate-mass stars to the end of the asymptotic giant branch with mass loss. Astrophys. J. 1993, 413, 641–657. [Google Scholar] [CrossRef]
- Rauch, T. A grid of synthetic ionizing spectra for very hot compact stars from NLTE model atmospheres. Astron. Astrophys. 2003, 403, 709. [Google Scholar] [CrossRef]
- Brown, A.G.A.; Vallenari, A.; Prusti, T.; de Bruijne, J.H.J.; Babusiaux, C.; Bailer-Jones, C.A.L.; Biermann, M.; Evans, D.W.; Eyer, L.; Jansen, F.; et al. Gaia Data Release 2. Summary of the contents and survey properties. arXiv 2018, arXiv:1804.09365. [Google Scholar]
- Ferland, G.J.; Porter, R.L.; van Hoof, P.A.M.; Williams, R.J.R.; Abel, N.P.; Lykins, M.L.; Shaw, G.; Henney, W.J.; Stancil, P.C. The 2013 Release of Cloudy. Revista Mexicana Astronomía Astrofísica 2013, 49, 137–163. [Google Scholar]
- Knapp, G.R. Mass loss from evolved stars. IV—The dust-to-gas ratio in the envelopes of Mira variables and carbon stars. Astrophys. J. 1985, 293, 273–280. [Google Scholar] [CrossRef]
© 2019 by the authors. Licensee MDPI, Basel, Switzerland. This article is an open access article distributed under the terms and conditions of the Creative Commons Attribution (CC BY) license (http://creativecommons.org/licenses/by/4.0/).


