Article

Faraday Tomography of the SS433 Jet Termination Region

1
Graduate School of Science, Kyushu University, 744 Motooka Nishi-ku, Fukuoka 819-0395, Japan
2
Department of Physics, Faculty of Sciences, Kyushu University, 744 Motooka Nishi-ku, Fukuoka 819-0395, Japan
3
Department of Astrophysics/IMAPP, Radboud University, PO Box 9010, NL-6500 GL Nijmegen, The Netherlands
4
Faculty of Advanced Science and Technology, Kumamoto University, 2-39-1, Kurokami, Kumamoto 860-8555, Japan
5
Mizusawa VLBI Observatory, National Astronomical Observatory Japan, 2-21-1 Osawa, Mitaka, Tokyo 181-8588, Japan
6
SRON Netherlands Institute for Space Research, Sorbonnelaan 2, 3584 CA Utrecht, The Netherlands
7
Graduate School of Engineering, Kagoshima University, 1-21-35 Korimoto, Kagoshima 890-0065, Japan
8
Oxford e-Research Centre (OeRC), Keble Road, Oxford OX1 3QG, UK
*
Author to whom correspondence should be addressed.
Galaxies 2018, 6(4), 137; https://doi.org/10.3390/galaxies6040137
Submission received: 26 October 2018 / Revised: 23 November 2018 / Accepted: 1 December 2018 / Published: 9 December 2018
(This article belongs to the Special Issue The Power of Faraday Tomography)

Abstract

:
A jet termination region provides us with useful information about how a jet interacts with the interstellar medium. Identifying the strength and orientation of magnetic fields at the terminal is crucially important to understanding the mechanism of cosmic-ray acceleration. In this article, we report results of our Faraday-tomography analysis of the eastern region of the radio nebula W50, where a jet from the microquasar SS433 seems to terminate. We apply QU-fitting, a method of Faraday-tomography, to data from the Australia Telescope Compact Array (ATCA) at 1.3–3.0 GHz. In the analysis, we distinguish multiple polarized sources along the line of sight. We identify Galactic emission candidates at Faraday depths around 0 rad m−2 and 300 rad m−2. The Galactic emission around 0 rad m−2 is possibly located in front of W50. We also find emission from W50 with Faraday depths between φ = −112 to 228 rad m−2.

1. Introduction

At shock waves created in a jet termination region, cosmic ray particles are accelerated by a magnetic field [1]. Understanding the detailed structure of the magnetic field of a jet termination region gives us clues that can reveal the mechanism of cosmic ray particle acceleration. Recently, Abeysekara et al. (2018) succeeded in observing TeV gamma-ray emission from a jet of the microquasar SS433, and this object is notable as an origin of accelerated cosmic ray particles [2].
SS433 is located at the center of the shell of the large radio nebula W50 and is ejecting a spiral jet with a speed of 0.26 times the speed of light [3]. W50 has an elongated structure in the east-west direction, and the protruding structures are called “ears” (Figure 1) [4,5]. The ears were suggested to be formed by interactions between the nebula and the microquasar SS433 [6]. As the major axis of W50 is well aligned with the SS433 jet, there is a strong association between W50 and SS433. The SS433 jet reached the eastern edge of W50 and formed a terminal shock corresponding to the brightest part of the filament (right panel of Figure 1, regions I and II correspond to the terminal shock). The southern part of the filament shows fainter emission than the terminal shock (right panel of Figure 1, region IV), and the origin of this structure has not yet been revealed. Dubner et al. (1998) found that the eastern ear exhibits a coiling helical pattern [6]. That previous work suggested that this pattern mirrors the precessing jet of SS433. The region (III) of Figure 1 corresponds to this helical structure.
The eastern ear has been observed frequently at various wavelengths. For example, Brinkmann et al. (2007) found an X-ray ring in the eastern ear which overlaps with the terminal shock and the helical structure [7]. With images of [OIII] 5007 Å and Hα + [NII] 6548, 6584 Å, Boumis et al. (2007) detected optical filaments, and some of them correspond to this helical structure [8]. Polarization observations at radio wavelengths have been rarely carried out [5,9,10]. Recently, Farnes et al. (2017) performed full polarization observation of the whole region of W50 with the Australia Telescope Compact Array (ATCA) [11]. They found a ring-like magnetic field at the terminal shock.
Sakemi et al. (2018) carried out a detailed polarization analysis of the eastern region of W50 using the ATCA dataset [12]. They found a well-aligned magnetic field along the terminal shock and suggested the possibility of a spiral magnetic field that may be associated with the helical structure. This work also performed a Faraday-tomography analysis and revealed a variety of features toward the filament.
The previous Faraday-tomography analysis was, however, applied only to narrow regions of specific interest. In this paper, we expand the previous analysis to all of the filament (regions I, II, and IV) and the helical structure (region III) to obtain more detailed profiles of the magnetic fields. This paper is organized as follows: In Section 2, we briefly review the observation and the model. The results are provided in Section 3. A discussion about the filament and the helical structure appears in Section 4, followed by our conclusions in Section 5.

2. Observation and Model

2.1. Observation

The previous work [12] and this work used the same radio data introduced by Farnes et al. (2017) [11]. However, this current paper extends our analysis. The data were obtained with the ATCA using the Compact Array Broadband Backend (CABB) system, which enabled an instantaneous bandwidth of 2.0 GHz centered at 2.1 GHz with 2048 spectral channels [11,13]. The CABB instrument has been optimizing polarization calibration, especially over wide fields and wide bandwidths. The array configurations included three types with an abundance of short baselines (H75, H168, and H214) suited for the study of diffuse emission from W50. The hybrid configurations were nominally sensitive to a largest angular scale of 36 arcmin. The 3° × 2° field was mosaicked with 198 pointings with an angular resolution of 3.9 × 2.9 arcmin.
The MIRIAD standard calibration was performed with the flux/bandpass calibrator PKS1934-638 and the gain/phase/leakage calibrator J1859 + 129. Flagging were iteratively performed. The frequency-dependent instrumental leakages were calculated across the full bandwidth using the MIRIAD task GPCAL. The final solutions were linearly interpolated across the 198 pointings.
MIRIAD was used to create Stokes I, Q, and U image cubes considering the primary beam effects. Datacubes with a 10 MHz channel width across the observing band were created for our analysis. It was challenging to estimate the image rms noise level, because the W50 field was filled with Galactic diffuse emission. We estimated the rms by selecting a large peripheral area of the image excluding W50. The noise levels were listed in Table 2 of our previous work [12]. The noise levels differed for each frequency, and the specific noise values of Stokes I, Q, and U at 2.1 GHz were 12.3 mJy/beam, 9.57 mJy/beam, and 9.05 mJy/beam, respectively. See References [11,12] for further details of these data.

2.2. Model

We here introduce the analyzed regions and the functions that we used to model them. We performed Faraday-tomography to separate polarized sources along the line of sight. We divided the filament and the helical structure into the 54 pixels shown in Figure 1b and performed Faraday-tomography on all the individual pixels. The pixel size is comparable to the beam size.
We employed Markov chain Monte Carlo QU-fitting as our choice of the Faraday-tomography method [14,15,16]. QU-fitting is a model-fitting method to reconstruct of polarized sources along a line of sight from an observed polarized spectrum. For the fitting model, we adopted a Gaussian which consists of a Faraday depth φ (rad m−2), an intrinsic polarization angle χ 0 (rad), and a full-width at half-maximum (FWHM) (rad m−2). We assume that a Gaussian corresponds to a polarized source along the line of sight. A Faraday depth is defined as being proportional to an integrated value of the thermal electron number density times the parallel component of the magnetic field along the line of sight. The integration interval is the distance between the observer and a polarized source. Four models were applied to each pixel: one, two, three, and four Gaussians respectively. We carried out the Fourier transform of these models, and obtained Stokes Q and U for each model. We compared the Stokes Q and U values with the observed values, and chose the best-fit model which has the lowest Bayesian Information Criterion (BIC) value. QU-fitting can trace polarized sources more accurately than Faraday rotation measure synthesis (RM synthesis), which was carried out in Farnes et al. (2017) [11,17].
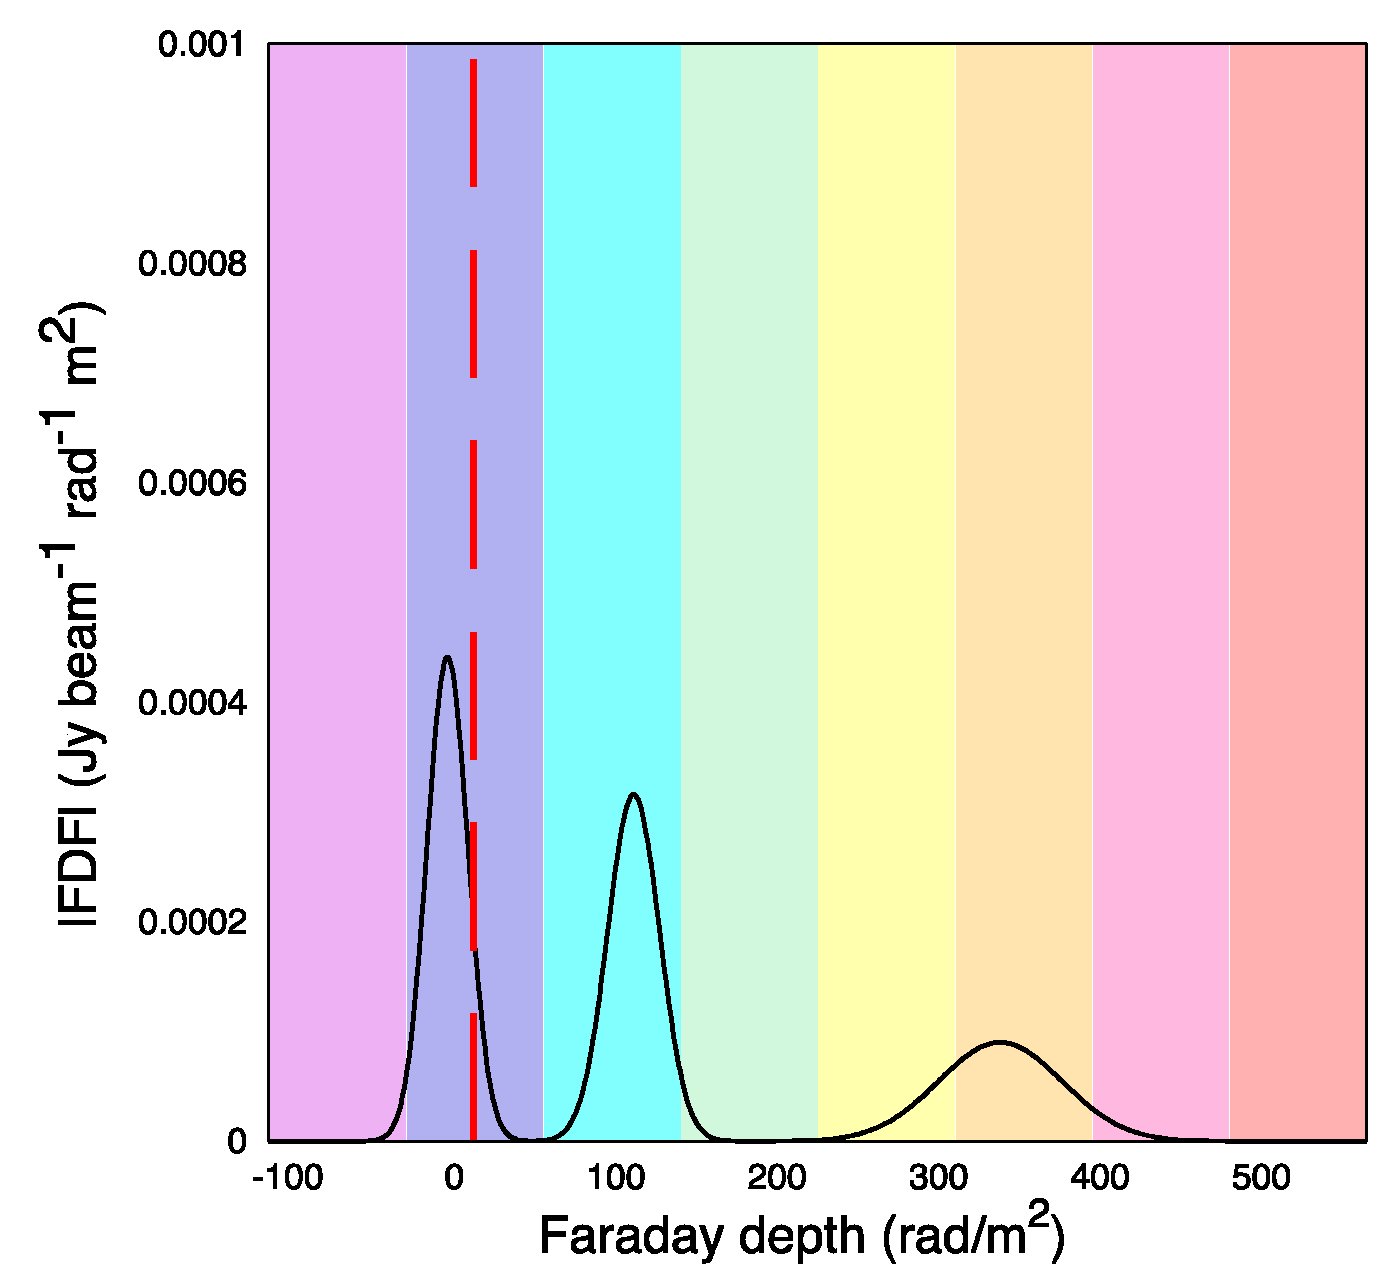
Figure 2 shows an example plot of the best-fit model. The horizontal axis is Faraday depth, and the vertical axis is the amplitude of the Faraday Dispersion Function (FDF). A Gaussian component corresponds to a polarized source. In the case of this example, there are three polarized sources which are either located along the line of sight or are in proximity to each other within the analyzed region. To identify any trends between the fitted components, we divide Faraday depth space into eight ranges. The width of each range is 85 rad m−2, which is determined from the FWHM of the rotation measure spread function [18]. We set the foreground rotation measure (RM) value to 15 rad m−2, which was determined from the observation of pulsars located near SS433, at the center of the blue range in Figure 2 [11]. A RM is commonly defined as the slope of the polarization angle (rad) versus the square of the wavelength (m2). A RM and a Faraday depth obtained from Faraday-tomography are, therefore, typically different.

3. Results

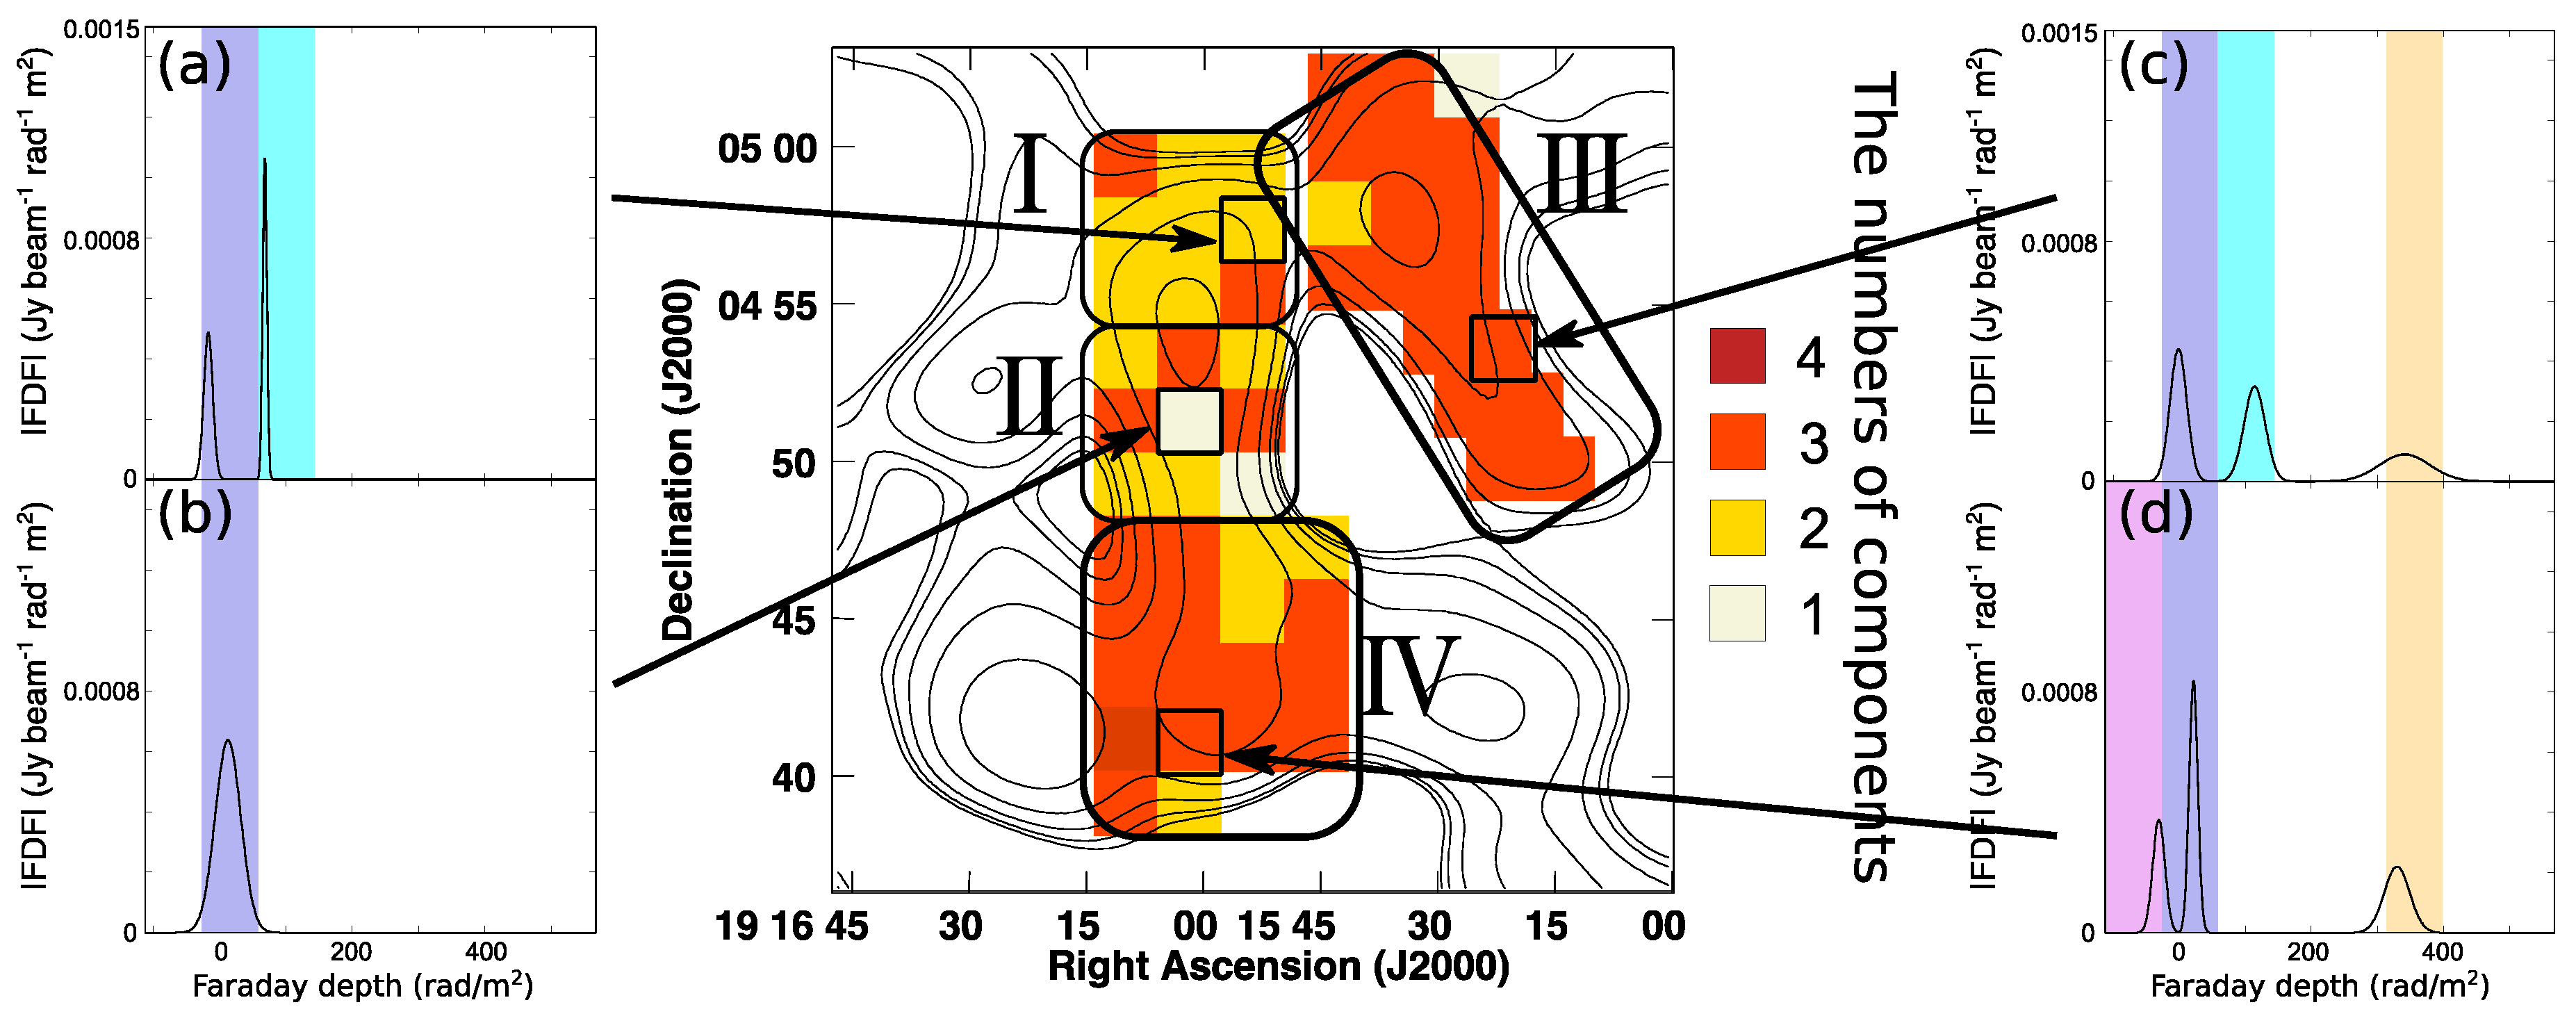
The middle panel of Figure 3 shows the number of Gaussian components derived from the best QU-fitting model for each pixel. The northern terminal shock (region I) tends to be fitted with a two-Gaussian model, while the southern terminal shock (region II) shows a more complicated distribution. The helical structure (region III) and the southern filament (region IV) tend to be fitted with a three-Gaussian model. Both sides of Figure 3 indicate the typical |FDF| models for each of the four regions. Now, we take a closer look at these four individual regions.
The northern terminal shock (region I) has components in the blue (φ = −26 to 58 rad m−2) and the cyan (φ = 59 to 143 rad m−2) ranges (Figure 3a). The component in the blue range seems to be shared by all four regions. The Gaussian widths of the two components tend to be narrower than the components seen in the other three regions.
Almost all pixels in the southern terminal shock (region II) have one Gaussian component in the blue range, although the peak position is higher compared to that in region I (Figure 3b). Even the exceptions have the component whose Faraday depth is very close to the blue range. We tried to find any other trend between the components in region II, but there is no other feature except a dispersion between the number of components (middle panel of Figure 3).
The helical structure (region III) has two components, in the blue and cyan ranges (Figure 3c). This trend is similar to region I, but the Gaussian widths are much wider than seen in that region. This likely indicates that the emitting sources in the direction of region III have larger scales, or there are more turbulent magnetic fields in region III. Region III also has another component in the orange range (φ = 314 to 398 rad m−2). The amplitude of this large-φ component tends to be lower than those seen at smaller Faraday depths.
The southern part of the filament (region IV) also has two components relatively near φ = 0 rad m−2, but they are in the purple (φ = −112 to −27 rad m−2) and the blue ranges (φ = −26 to 58 rad m−2), as shown in Figure 3d. Region IV also has a large-φ component around φ = −300 rad m−2. Overall, region IV shows similar features to region III.

4. Discussion

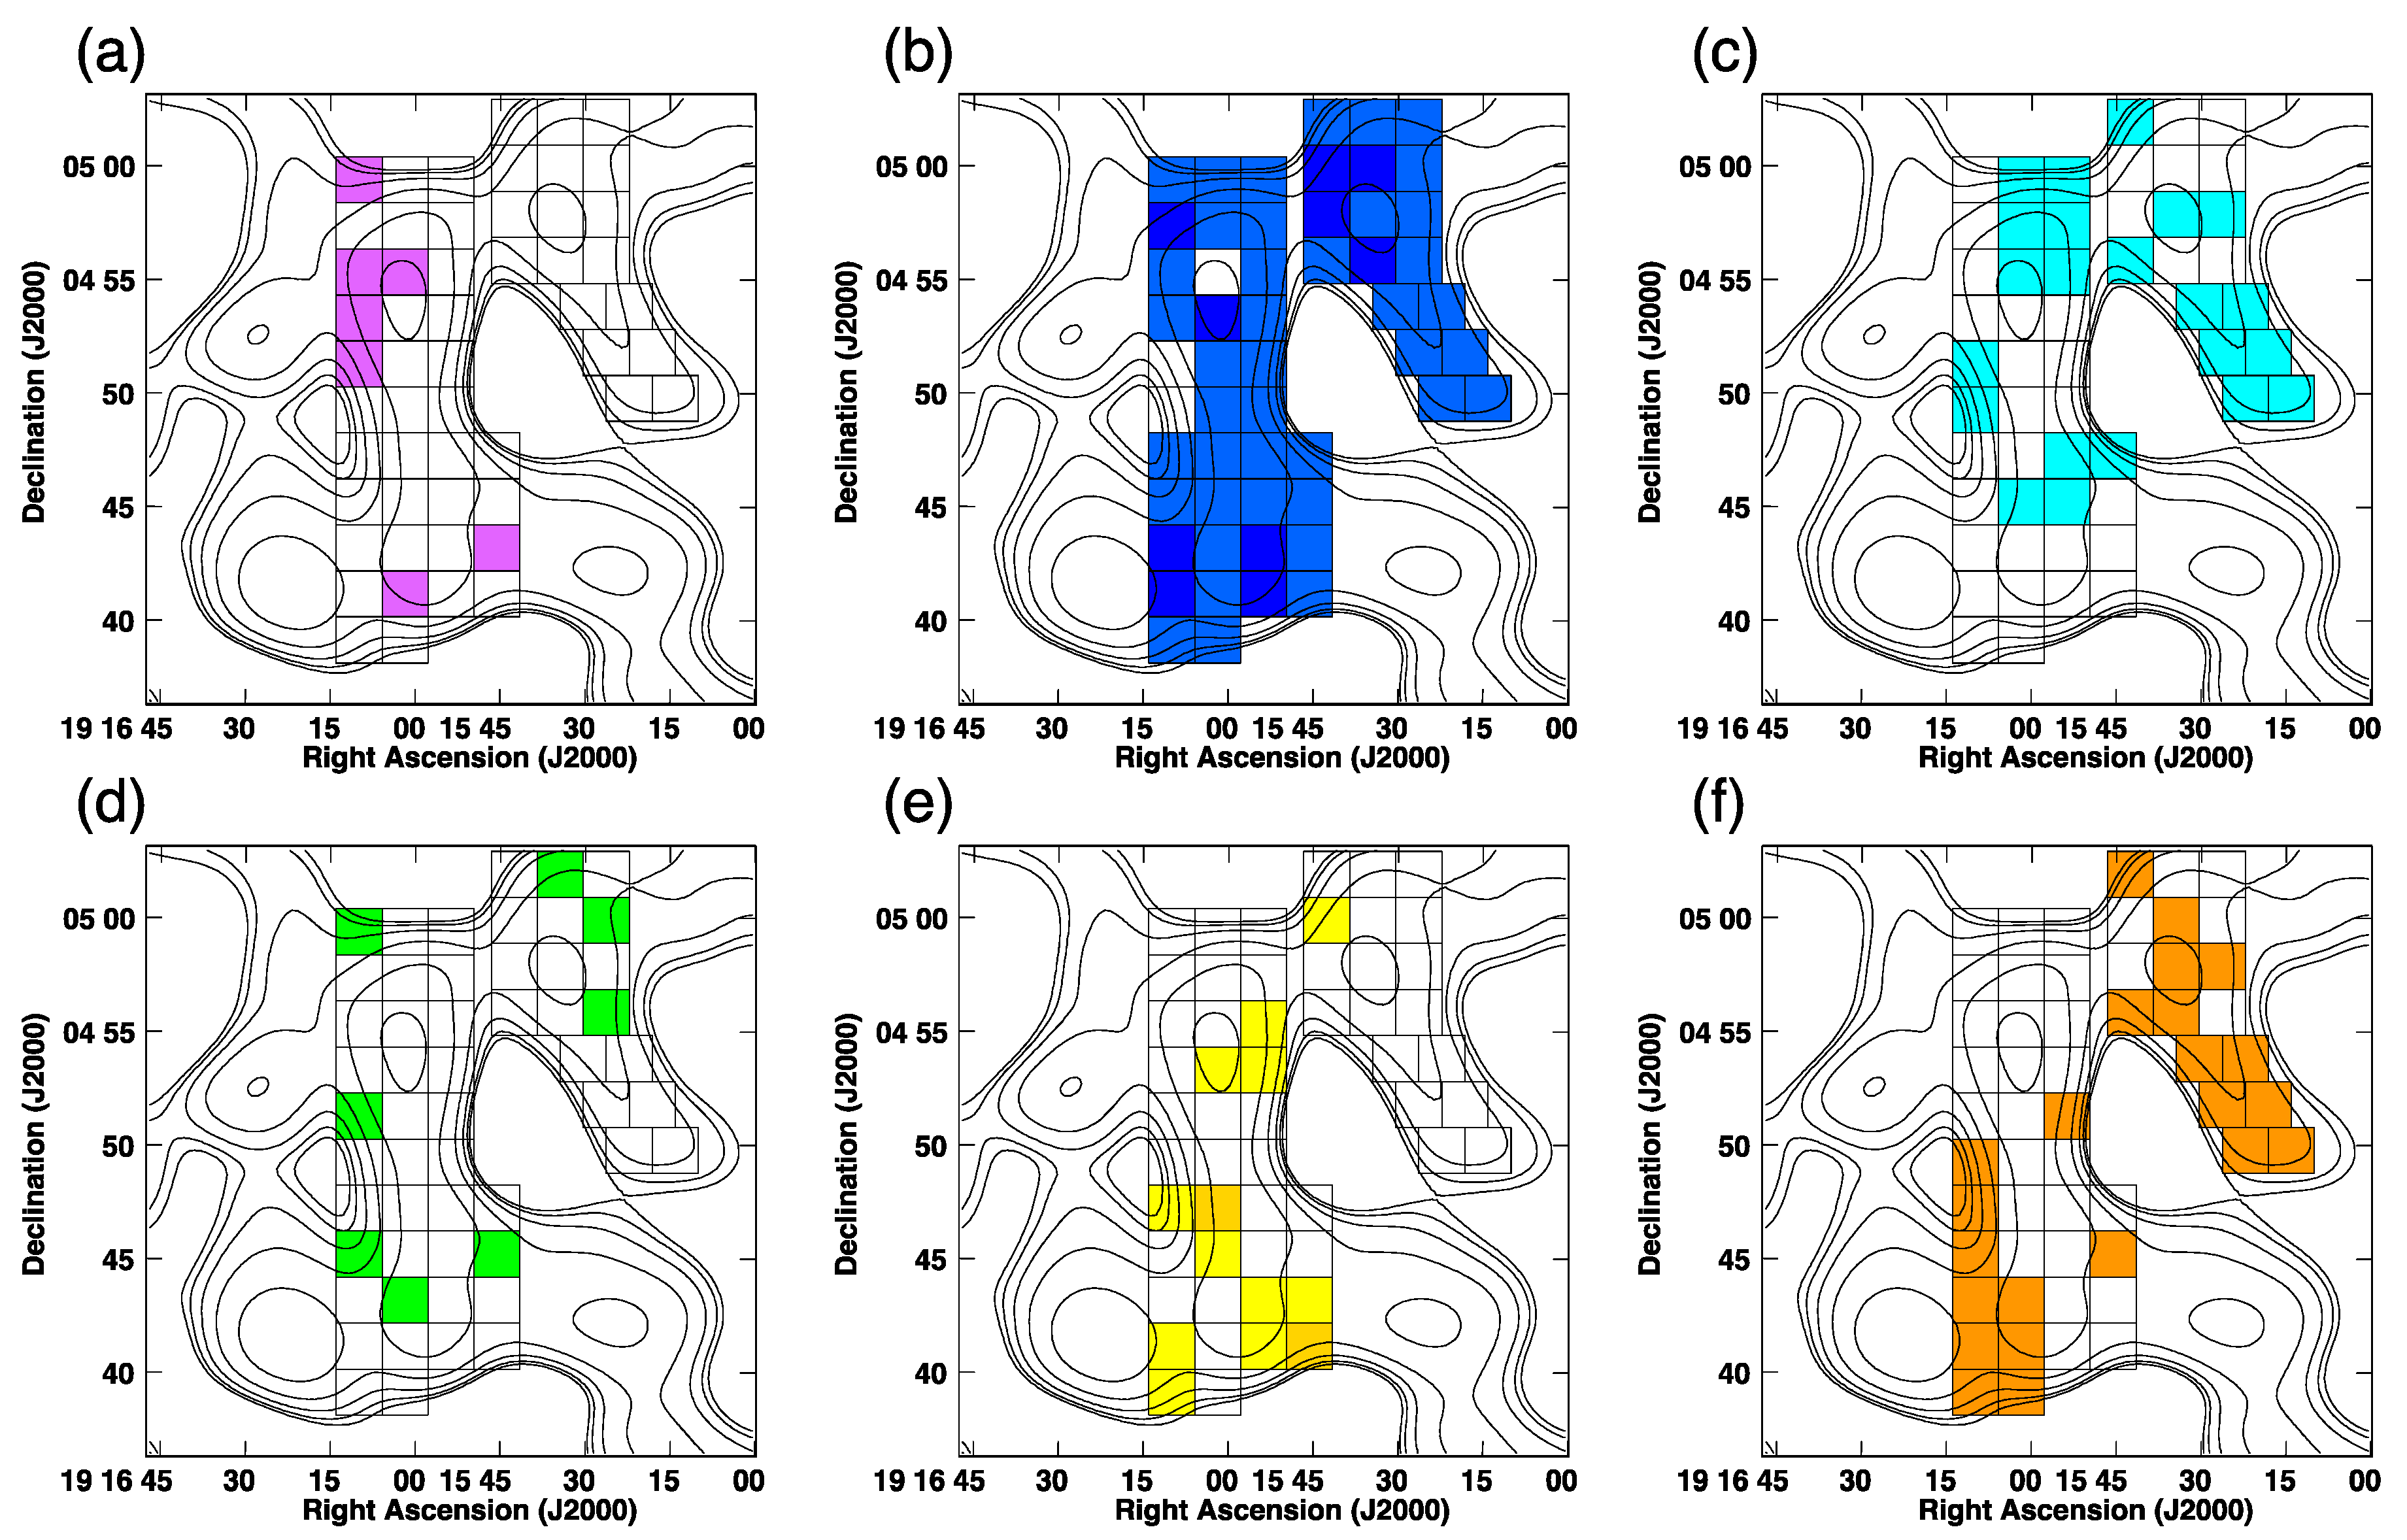
Figure 4 summarizes the spatial distribution of FDF components. It is clear from Figure 4b that almost all regions have an FDF component in the blue (φ = −26 to 58 rad m−2) range. Since W50 is located near the Galactic plane, the diffuse Galactic emission is distributed throughout the field of view. In Farnes et al. (2017), diffuse emission seems to spread over the eastern ear around φ = 0 rad m−2 [11]. We suggest that the component in the blue range corresponds to the diffuse emission. In addition, Farnes et al. (2017) suggested that the foreground RM of W50 is estimated to be 15 ± 30 rad m−2 from pulsar observations, which is consistent with 0 rad m−2. Here, we assume that a pulsar is a Faraday thin source (i.e., less dispersion of Faraday depth), and there is no other polarized source but a pulsar along the line of sight. In this assumption, the RM value of the pulsar corresponds to the Faraday depth value. The diffuse Galactic emission, therefore, has a Faraday depth value close to the foreground RM value of 0 rad m−2. Therefore, we can regard the FDF component in the blue range as foreground Galactic emission that is not directly associated with W50.
Figure 4e,f shows the spatial distribution of the FDF components in the yellow (φ = −229 to 313 rad m−2) and orange (φ = 314 to 398 rad m−2) ranges, respectively. Farnes et al. (2017) suggested that the high Faraday depth Galactic emission around φ = 230 rad m−2 up to φ = 670 rad m−2 also distributes patchily behind the eastern ear [11]. We performed QU-fitting on an off-source region, and also detected FDF components in the yellow and orange ranges. Therefore, we suggest that the high Faraday depth components in the yellow and orange ranges, i.e., around φ = 300 rad m−2, originate in background Galactic emission.
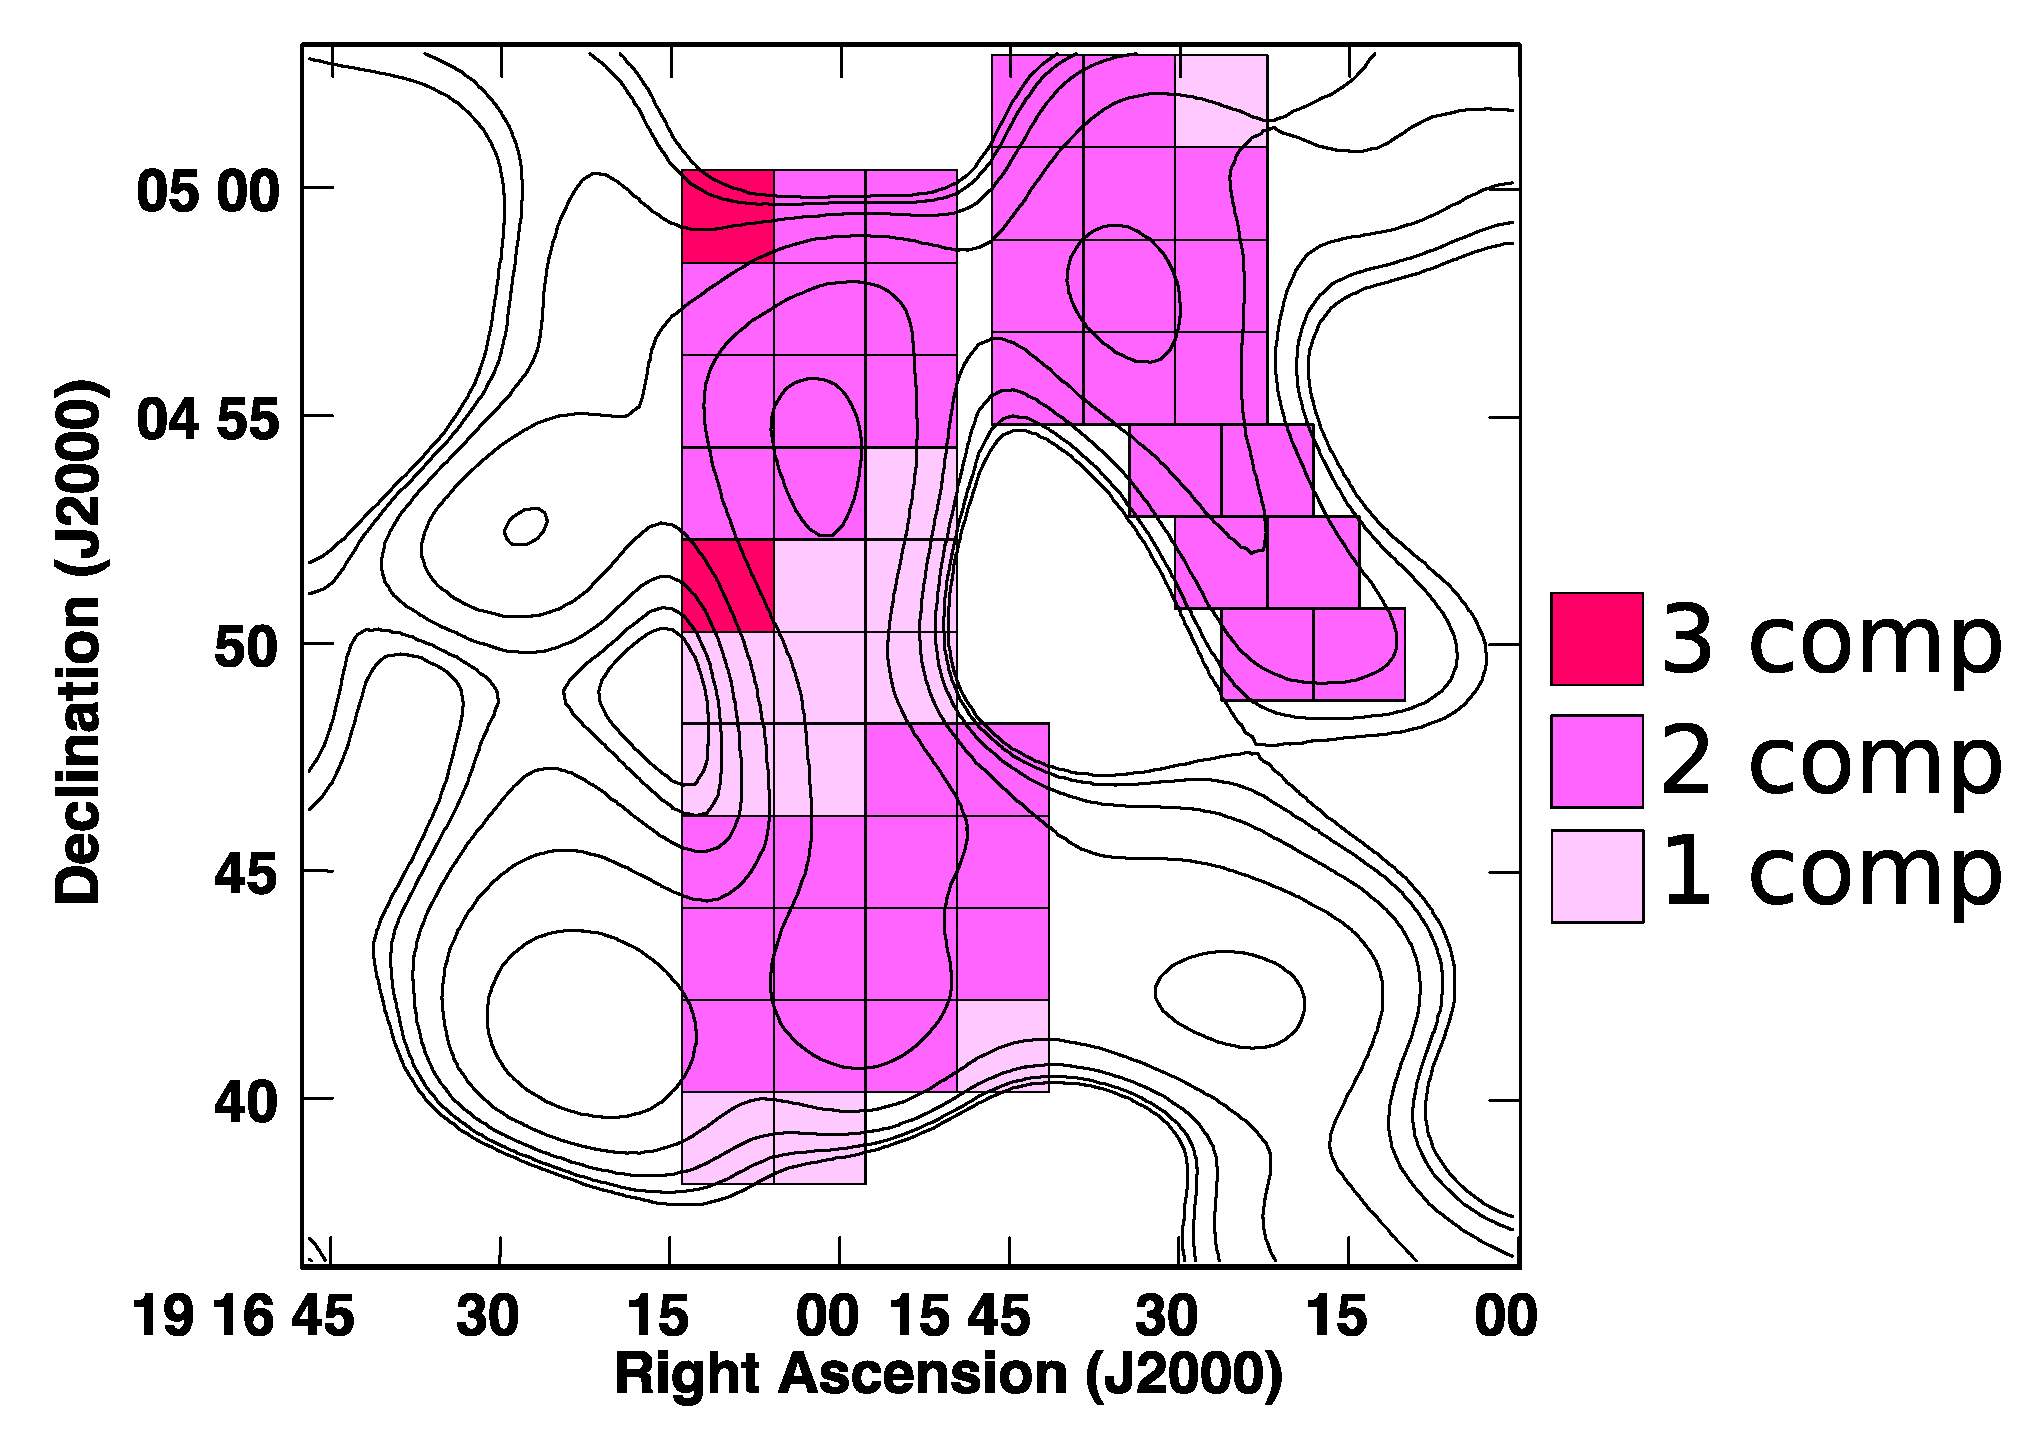
Finally, Figure 5 shows the spatial distribution of the number of FDF components within φ = −112 to 228 rad m−2 (the purple, blue, cyan, and green ranges), with the Galactic emission candidate seen in Figure 4b also being counted. In addition to the Galactic emission candidate, there is also another component in regions I, III, and IV. We consider that these components are all associated with W50. Note that there is no such additional component in region II. One interpretation would be that towards region II, this component of W50 is too faint to be detected. This might mean that this region has fewer cosmic-ray electrons and/or a weak magnetic field. Furthermore, there is a possibility that the magnetic field is more disordered in this region. Another interpretation could be that there is actually an additional component in region II, but its Faraday depth is located too close to the foreground candidate to be distinguished. This could be caused by weak magnetic fields along the line of sight and/or a low thermal electron density. To examine these possibilities, we need high-sensitivity and wide-frequency coverage data including low-frequency data to improve the resolution of Faraday depth. However, the recent Low Frequency Array (LOFAR) observations at 150 MHz detected no polarized emission from W50 [19]. We, therefore, need data at a higher frequency than 150 MHz, and the SKA’s low-frequency instrument (SKA-Low) will be able to observe across an ideal frequency range with higher sensitivity.

5. Conclusions

We carried out QU-fitting of the eastern region of W50, where a jet from SS433 seems to terminate. ATCA data at 1.3–3.0 GHz were used for the analysis. The northern terminal shock (region I) tends to be best-fitted with a two-Gaussian model. The southern terminal shock (region II) seems to have complicated features. The helical structure (region III) and the southern part of the filament (region IV) tend to be best-fitted with a three-Gaussian model. From our analysis, we identify candidate Galactic emission components located around 0 rad m−2 and 300 rad m−2. The Galactic emission around 0 rad m−2 possibly corresponds to the foreground of W50. We also identify emission from W50 within φ = −112 to 228 rad m−2. Note that we could not identify any emission from W50 in the southern terminal shock (region II). We may need higher sensitivity data with wider frequency coverage to distinguish the component in this region.

Author Contributions

Investigation, H.S.; Resources, S.I., Y.M. and J.F.; Software, S.I. and Y.M.; Supervision, M.M.; Writing—original draft, H.S.; Writing—review and editing, M.M., T.O., K.T., T.A., H.A., H.N., K.K. and J.F.

Funding

This work is financially supported in part by a Grant-in-Aid for Scientific Research (KAKENHI) from JSPS (P.I. MM:23740153, 16H03954). K.T’s work is partially supported by Grand-in-Aid from the Ministry of Education, Culture, Sports, and Science and Technology (MEXT) of Japan, No. 15H05896, 16H05999 and 17H01110, and Bilateral Joint Research Projects of JSPS. H.A acknowledges the support of NWO via a Veni grant. SRON is supported financially by NWO, The Netherlands Organization for Scientific Research.

Acknowledgments

We are grateful to M. Haverkorn, and S. P. O’Sullivan for useful discussion. We thank the Cosmic Magnetism Science Working Group of the Japan SKA Consortium for supporting our research. We also thank the SOC of “The Power of Faraday Tomography” for providing the opportunity to present our study.

Conflicts of Interest

The authors declare no conflict of interest.

References

  1. Araudo, A.T.; Bell, A.R.; Blundell, K.M. Particle Acceleration and Magnetic Field Amplification in the Jets of 4C74.26. Astrophys. J. 2015, 806, 243. [Google Scholar] [CrossRef]
  2. Abeysekara, A.U.; Albert, A.; Alfo, R.; HAWC Collaboration. Very high energy particle acceleration powered by the jets of the microquasar SS 433. Nature 2018, 562, 82–85. [Google Scholar] [CrossRef] [PubMed]
  3. Abell, G.O.; Margon, B. A kinematic model for SS433. Nature 1979, 279, 701–703. [Google Scholar] [CrossRef]
  4. Geldzahler, B.J.; Pauls, T.; Salter, C.J. Continuum observations of the supernova remnants W 50 and G 74.9+1.2 at 2695 MHz. Astron. Astrophys. 1980, 84, 237–244. [Google Scholar]
  5. Downes, A.J.B.; Pauls, T.; Salter, C.J. Further radio observations of W 50—Total intensity and linear polarization measurements at 1.7 and 2.7 GHz. Astron. Astrophys. 1981, 103, 277–287. [Google Scholar]
  6. Dubner, G.M.; Holdaway, M.; Goss, W.M.; Mirabel, I.F. A High-Resolution Radio Study of the W50-SS 433 System and the Surrounding Medium. Astron. J. 1998, 116, 1842–1855. [Google Scholar] [CrossRef]
  7. Brinkmann, W.; Pratt, G.W.; Rohr, S.; Kawai, N.; Burwitz, V. XMM-Newton observations of the eastern jet of SS 433. Astron. Astrophys. 2007, 463, 611–619. [Google Scholar] [CrossRef]
  8. Boumis, P.; Meaburn, J.; Alikakos, J.; Redman, M.P.; Akras, S.; Mavromatakis, F.; López, J.A.; Caulet, A.; Goudis, C.D. Deep optical observations of the interaction of the SS 433 microquasar jet with the W50 radio continuum shell. Mon. Not. R. Astron. Soc. 2007, 381, 308–318. [Google Scholar] [CrossRef] [Green Version]
  9. Downes, A.J.B.; Pauls, T.; Salter, C.J. The supernova remnant W50 at 5 GHz. Mon. Not. R. Astron. Soc. 1986, 218, 393–407. [Google Scholar] [CrossRef] [Green Version]
  10. Gao, X.Y.; Han, J.L.; Reich, W.; Reich, P.; Sun, X.H.; Xiao, L. A Sino-German λ6 cm polarization survey of the Galactic plane. V. Large supernova remnants. Astron. Astrophys. 2011, 529, A159. [Google Scholar] [CrossRef]
  11. Farnes, J.S.; Gaensler, B.M.; Purcell, C.; Sun, X.H.; Haverkorn, M.; Lenc, E.; O’Sullivan, S.P.; Akahori, T. Interacting large-scale magnetic fields and ionized gas in the W50/SS433 system. Mon. Not. R. Astron. Soc. 2017, 467, 4777–4801. [Google Scholar] [CrossRef] [Green Version]
  12. Sakemi, H.; Machida, M.; Akahori, T.; Nakanishi, H.; Akamatsu, H.; Kurahara, K.; Farnes, J.S. Magnetic field analysis of the bow and terminal shock of the SS433 jet. Publ. Astron. Soc. Jpn. 2018, 70, 27. [Google Scholar] [CrossRef]
  13. Wilson, W.E.; Ferris, R.H.; Axtens, P.; Brown, A.; Davis, E.; Hampson, G.; Leach, M.; Roberts, P.; Saunders, S.; Koribalski, B.S.; et al. The Australia Telescope Compact Array Broad-band Backend: Description and first results. Mon. Not. R. Astron. Soc. 2011, 416, 832–856. [Google Scholar] [CrossRef]
  14. O’Sullivan, S.P.; Brown, S.; Robishaw, T.; Schnitzeler, D.H.F.M.; McClure-Griffiths, N.M.; Feain, I.J.; Taylor, A.R.; Gaensler, B.M.; Landecker, T.L.; Harvey-Smith, L.; et al. Complex Faraday depth structure of active galactic nuclei as revealed by broad-band radio polarimetry. Mon. Not. R. Astron. Soc. 2012, 421, 3300–3315. [Google Scholar] [CrossRef] [Green Version]
  15. Ideguchi, S.; Takahashi, K.; Akahori, T.; Kumazaki, K.; Ryu, D. Fisher analysis on wide-band polarimetry for probing the intergalactic magnetic field. Publ. Astron. Soc. Jpn. 2014, 66, 5. [Google Scholar] [CrossRef]
  16. Ozawa, T.; Nakanishi, H.; Akahori, T.; Anraku, K.; Takizawa, M.; Takahashi, I.; Onodera, S.; Tsuda, Y.; Sofue, Y. JVLA S- and X-band polarimetry of the merging cluster Abell 2256. Publ. Astron. Soc. Jpn. 2015, 67, 11013. [Google Scholar] [CrossRef]
  17. Sun, X.H.; Rudnick, L.; Akahori, T.; Anderson, C.S.; Bell, M.R.; Bray, J.D.; Farnes, J.S.; Ideguchi, S.; Kumazaki, K.; O’Brien, T.; et al. Comparison of Algorithms for Determination of Rotation Measure and Faraday Structure. I. 1100-1400 MHz. Astron. J. 2015, 149, 60. [Google Scholar] [CrossRef]
  18. Brentjens, M.A.; de Bruyn, A.G. Faraday rotation measure synthesis. Astron. Astrophys. 2005, 441, 1217–1228. [Google Scholar] [CrossRef] [Green Version]
  19. Broderick, J.W.; Fender, R.P.; Miller-Jones, J.C.A.; Trushkin, S.A.; Stewart, A.J.; Anderson, G.E.; Staley, T.D.; Blundell, K.M.; Pietka, M.; Markoff, S.; et al. LOFAR 150-MHz observations of SS 433 and W 50. Mon. Not. R. Astron. Soc. 2018, 475, 5360–5377. [Google Scholar] [CrossRef] [Green Version]
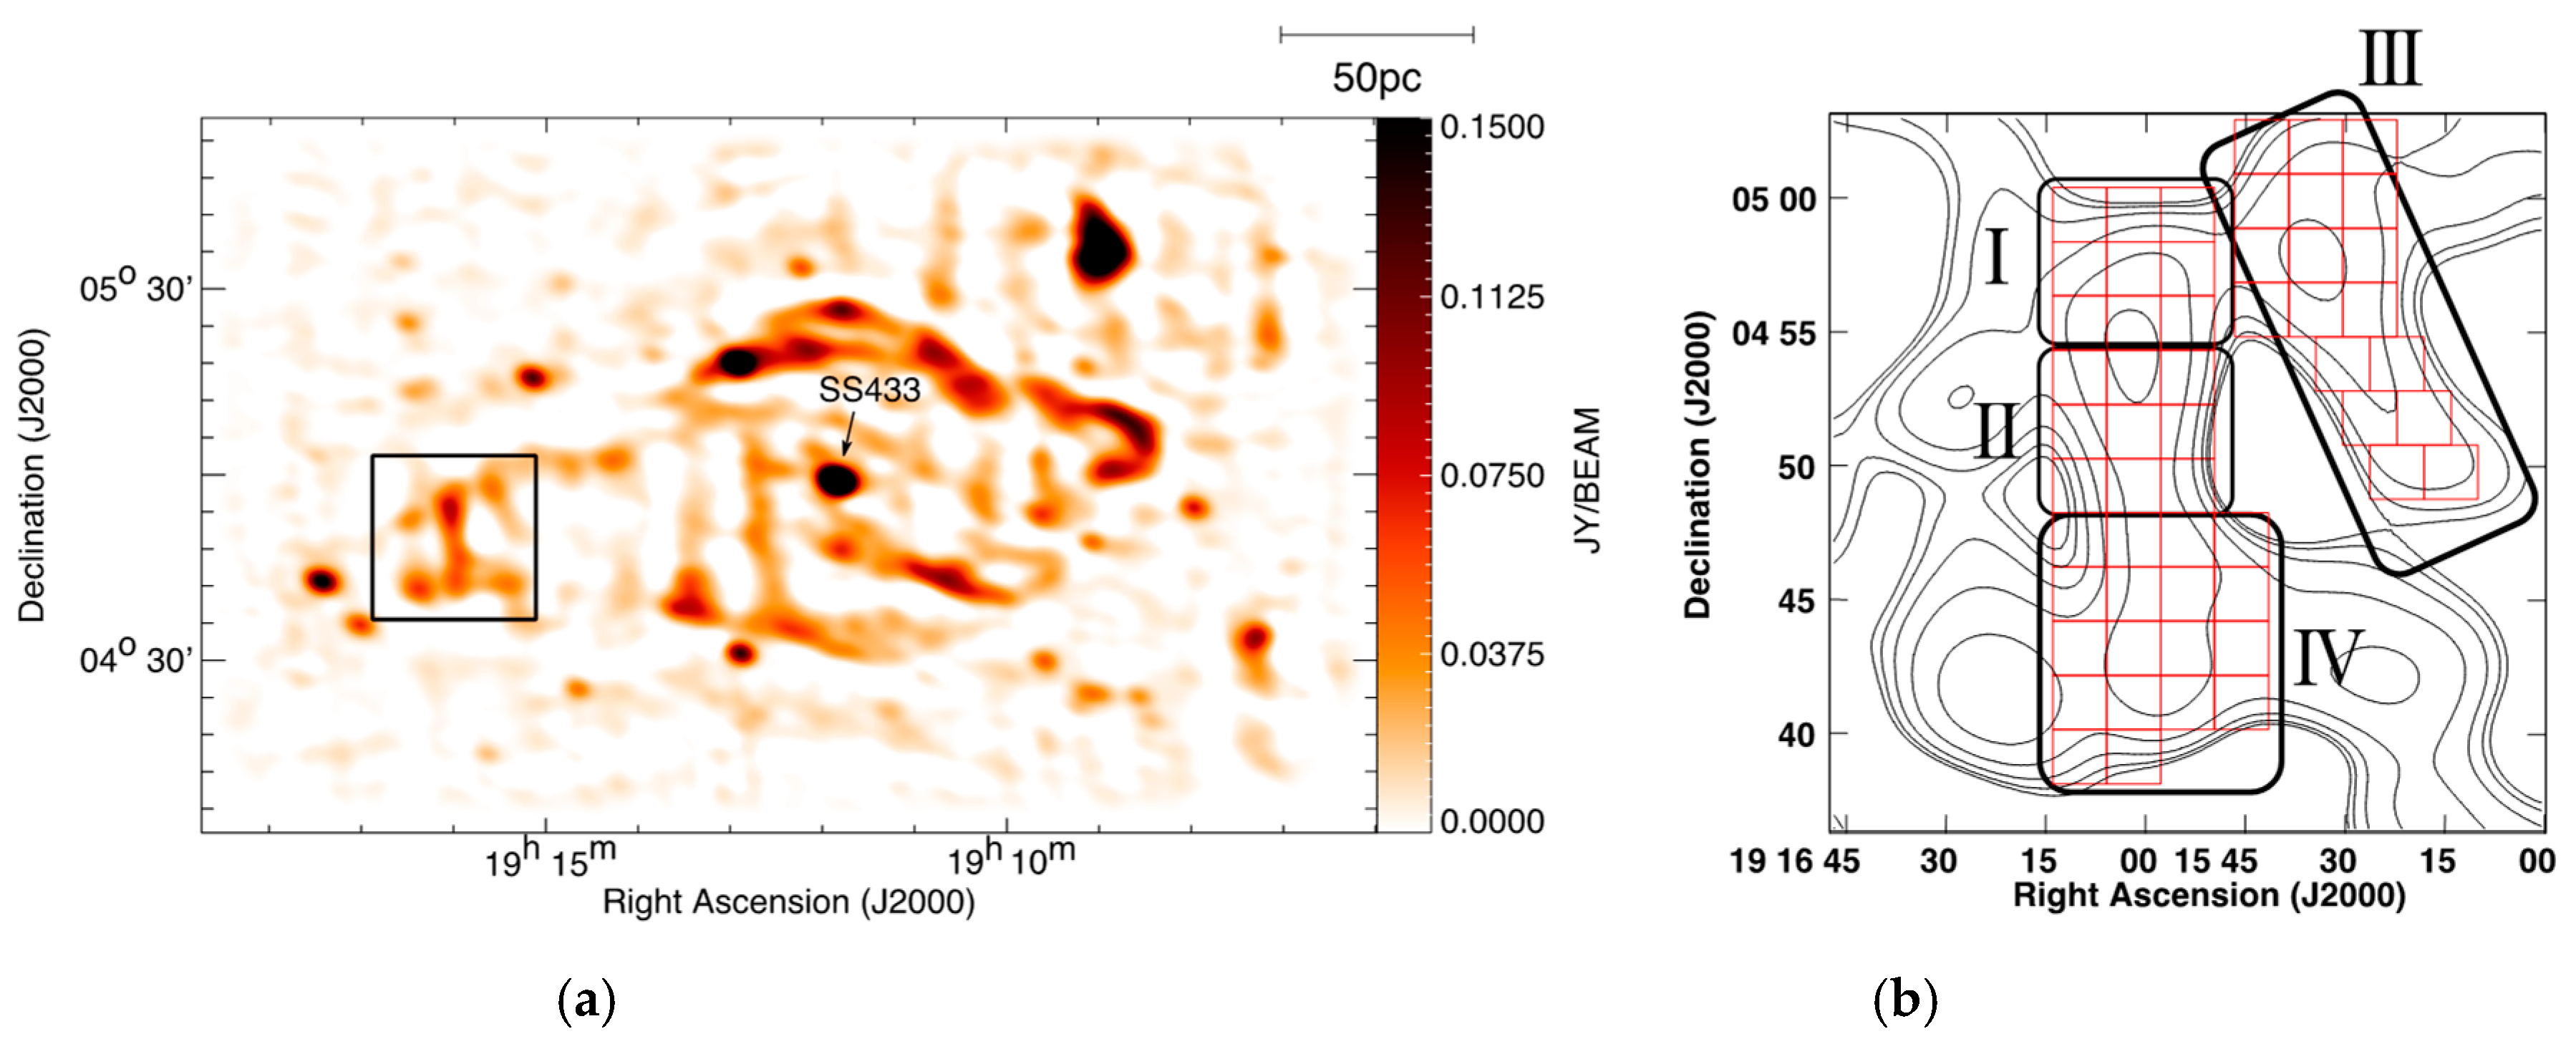
Figure 1. (a) An image of W50 observed with the ATCA at 3.0 GHz. The black box is the region shown in the right panel. (b) The eastern edge region of W50. Contours show the total intensity at 3.0 GHz. The filament consists of regions I, II, and IV. Regions I and II correspond to the northern and southern terminal shock, respectively. Region III is part of the helical structure. Region IV corresponds to the southern part of the filament. Red pixels show regions analyzed in this paper.
Galaxies 06 00137 g001
Figure 2. The example plot of the best-fit model. Black-solid lines are model functions. A red-dashed line shows the foreground RM value of 15 rad m−2 [11]. Colored bands are used to simplify our discussion. The widths are 85 rad m−2, and the center of the blue band corresponds to the foreground RM value of 15 rad m−2.
Galaxies 06 00137 g002
Figure 3. (Middle panel) The number of Gaussian components in the selected best-fit model for each pixel, as obtained using QU-fitting. Contours show the total intensity at 3.0 GHz. (Both side plots) the typical best-fit model for each of the structures (a) I, (b) II, (c) III, and (d) IV, respectively.
Galaxies 06 00137 g003
Figure 4. Spatial distribution of the Faraday Dispersion Function (FDF) components in the (a) purple (φ = −112 to −57 rad m−2), (b) blue (φ = −26 to 58 rad m−2), (c) cyan (φ = 59 to 143 rad m−2), (d) green (φ = 144 to 228 rad m−2), (e) yellow (φ = −229 to 313 rad m−2), and (f) orange (φ = 314 to 398 rad m−2) ranges of Faraday depth. In (b,e), there are deep colored pixels. There are two FDF components in these pixels.
Galaxies 06 00137 g004
Figure 5. Spatial distribution of the total number of FDF components in the purple (φ = −112 to −57 rad m−2), blue (φ = −26 to 58 rad m−2), cyan (φ = 59 to 143 rad m−2), and green (φ = 144 to 228 rad m−2) ranges of Faraday depth.
Galaxies 06 00137 g005