Article

Simulations of the Polarized Sky for the SKA: How to Constrain Intracluster Magnetic Fields

1
Dipartimento di Fisica e Astronomia, Università degli Studi di Bologna, Viale Berti Pichat 6/2, I-40127 Bologna, Italy
2
INAF—Osservatorio Astronomico di Cagliari, Via della Scienza 5, I-09047 Selargius, Italy
3
INAF—Istituto di Radioastronomia, Via Gobetti 101, I-40129 Bologna, Italy
4
Theoretical Division, Los Alamos National Laboratory, Los Alamos, NM 87544, USA
*
Author to whom correspondence should be addressed.
Galaxies 2018, 6(4), 133; https://doi.org/10.3390/galaxies6040133
Submission received: 30 October 2018 / Revised: 29 November 2018 / Accepted: 29 November 2018 / Published: 4 December 2018
(This article belongs to the Special Issue The Power of Faraday Tomography)

Abstract

:
The advent of the Square Kilometer Array (SKA) will have unprecedented impact on the study of magnetic fields in galaxy clusters. This instrument will be able to perform all-sky surveys in polarization, allowing us to build a rotation-measure (RM) grid based on an enormous number of sources. However, it is not always obvious how to extract correct information about the strength and the structure of magnetic fields from the RM grid. The simulations presented here help us to investigate this topic as they consist of full-Stokes idealized (because we did not add thermal noise) images of a pair of galaxy clusters between 950–1760 GHz, i.e., the SKA1-MID band 2. These images include not just cluster-embedded radio sources but also foreground and background discrete radio sources populating the simulated portion of the universe. To study the magnetic fields of the simulated galaxy clusters, we applied the RM synthesis technique on the simulated images and compared the “true” cluster RM values with those inferred from RM synthesis. The accuracy of our methodology is guarantee by the excellent agreement that we observed when we considered only the signal from the background radio sources. The presence of a Faraday screen, foreground, and cluster sources, introduces degeneracies and/or ambiguities that make the interpretation of the results more difficult.

1. Introduction

Cosmic magnetism is one of five scientific cases that drove the design and the construction of the Square Kilometer Array1 (SKA). Magnetic fields are enigmatically ubiquitous in the universe [1], and clear signatures of their presence have been detected even in galaxy clusters. Indeed, the observation of the Faraday rotation effect on background radio sources is indirect proof of the presence of a magnetic field embedded in the intracluster medium (ICM). This effect consists of the rotation Δ Ψ of the polarization plane of a linearly polarized signal (the one from the background radio source) as it crosses a magnetized plasma (the ICM). This rotation depends on square wavelength λ 2 and on the so-called rotation measure (RM): Δ Ψ = R M × λ 2 . By observing the signal at different wavelengths, we can evaluate the RM, which is defined as the path integral of the line-of-sight parallel component of intracluster magnetic field B times plasma density n e , where the integral is performed across the entire length L of the magnetoionic medium: R M = 0 L B · n e d l . The RM encodes the information related to the intracluster magnetic field, and its measurement is a suitable way to determine its properties (see References [2,3] for reviews on the determination of magnetic fields in clusters). We should mention that, in some cases, the polarization angle of the radio source signal does not scale with λ 2 . This is due to the so-called n π ambiguity (see Reference [4] for a more detailed discussion): the measured polarization angle can assume values between 0 and π , but we do not know a priori how many nπ rotations, with n being an integer number, the polarization angle actually performs, and this can lead to wrong estimates of the RM. To overcome this problem, it is necessary to have measurements at several frequencies.
A direct proof of the presence of magnetic fields in galaxy clusters is the detection of diffuse radio halos in some clusters [5]. These sources do not show any optical or radio discrete counterparts, they present low surface brightness values (S1.4GHx ~ 1 μJy/arcsec2), and extend across the cluster area with a typical dimension of 1 Mpc. Since the emitting radio source is mixed with the thermal plasma, we cannot observe the λ 2 scaling of the polarization angle. These sources undergo a depolarization effect: the polarized filaments emitting at different positions are rotated according to the associated Faraday depth ϕ ( l ) = 0 l B · n e d l , which, differently from the RM, is calculated by integrating only over the portion of plasma crossed by the signal. All the signals from the same line of sight are subject to different Faraday depths. Thus, they sum up incoherently inside the frequency channel, decreasing the degree of polarization. This behavior is observed also in radio sources, like star-forming galaxies, where the emitting plasma is mixed with the thermal one. A way to overcome this problem is represented by the so-called RM synthesis technique [6,7]. With this technique, one reconstructs the polarized signal from the U and Q Stokes parameters assuming different values of the Faraday depth inside a given interval. The U and Q Stokes parameters have to be derotated depending on the assumed Faraday depth value, and the polarization is reconstructed from P = Q 2 + U 2 , so that it is possible to see a spectrum of polarization as a function of the Faraday depth. If we apply this technique on background radio galaxies, we observe one polarized peak in the spectrum, and the associated Faraday depth is the cluster RM. On the other hand, the result for radio halos is a spectrum with multiple components since we have different polarized peaks emitted at different positions along the cluster. This is a powerful technique to recover the missed polarized signal of radio halos. Nevertheless, the interpretation of the Faraday spectrum is not trivial, and it is necessary to use simulation tools to extract the correct information on the cluster magnetic-field properties [8]. It is worth mentioning that another important advantage of the RM synthesis technique consists of the removal of the nπ ambiguity described previously [6].
Numerical simulations are essential, as they can be used to explore the physics of the ICM, they are helpful to provide forecasts for next-generation radio telescopes [9], and they are vital for the interpretation of current and future data.
In this proceeding, we present numerical simulations obtained with FARADAY [10], a software package developed for intracluster magnetic-field studies. This software package can be used to realize simulated images of one or more galaxy clusters observed with a given observational setup. In particular, we decided to realize simulated images in the range of 950−1760 MHz, i.e., the SKA1-MID Band 2, with a synthesized beam Full-Width-at-Half-Maximum (FWHM) of 2.5″. This represents a simplified case, where we assumed that the images were also confusion-limited in polarization (the confusion is due to the faintest unresolved radio sources of our simulation). To make the images more realistic, we have to add the thermal noise expected for the SKA. As a result, the clusters are sparsely sampled since we would only consider the emission above the noise level. In this work, our aim is to explore the potential of RM synthesis on the SKA1-MID frequency band data in constraining intracluster magnetic fields and to observe how different types of objects affect the results. The same approach presented here is the subject of a future work where we will consider simulated images including the thermal noise.
In Section 2, we explain how the simulation works; in Section 3, we show the resulting images; in Section 4, we illustrate the result of the application of RM synthesis on the data; and, finally, Section 5 is devoted to the discussion and conclusions. Throughout the paper, we adopt a ΛCDM cosmology with H0 = 71 km·s−1 Mpc−1, Ω m = 0.27 , and Ω Λ = 0.73 .

2. Method

To reproduce a realistic radio observation of a galaxy cluster, we needed to incorporate the emission related to all the radio sources populating the simulated volume of the universe.
In order to produce the emission of discrete radio sources, we needed to specify their properties and we did this according to proper assumptions. The radio-source properties are the following: type, position, redshift, luminosity, size, morphology, spectro-polarimetry properties, such as the spectral index α , defined from the relation S ν ν α between flux density S ν and frequency ν , and intrinsic polarization properties. Concerning the type, we considered star-forming galaxies (SFGs) and active galactic nuclei (AGN). To reproduce the morphology and spectro-polarimetry properties, we used high-resolution and high-frequency images of real radio sources.
We first produced the cluster-embedded radio source following these steps:
  • we specified the computational volume of the galaxy clusters;
  • we used the Navarro–Frank–White (NFW) profile of Reference [11] to describe the distribution of the cluster sources with respect to the center of the cluster;
  • the NFW profile was normalized with respect to the cluster radio luminosity function (RLF) of Reference [11];
  • we calculated the total number of cluster sources by integrating the NFW profile over the cubical box;
  • we assigned the type to each radio source depending on the fraction fixed by the AGN and SFG RLFs;
  • we extracted the source luminosity, size, and position with a Monte Carlo approach from the cumulative distribution functions of, respectively, the RLF, the size model (the same adopted in Reference [12]), and the NFW profile;
  • according to the source luminosity and type, we attributed a morphological and spectro-polarimetric model to the source;
  • the redshift of this sources corresponded to the selected cluster redshift;
The properties of the background and foreground radio sources were produced in the following way:
  • we assumed the “cosmological” of Reference [13] evolved in redshift according to Reference [14];
  • we integrated the cosmological AGN and SFG RLFs along the simulated portion of the universe to compute the number of background and foreground radio sources of each specific type;
  • we assigned the redshift from the cumulative distribution function of the redshift-evolved RLFs;
  • for the luminosity, morphology, and spectro-polarimetry properties, we proceeded in the same way as for the cluster-embedded sources.
We computed the I, U, and Q Stokes parameters from the properties of the simulated radio sources. The U and Q Stokes parameters of cluster-embedded and background sources were affected by the presence of an ICM that we know to be magnetized. In this work, the ICM is produced from a cosmological magneto-hydro-dynamical (MHD) simulation of the merging of two galaxy clusters. The intracluster magnetic field is injected by AGNs at redshift z∼3, while the pair of clusters is observed at z = 0.205. The simulated image covers an area of ∼6.4 Mpc with a resolution of 10.7 kpc.
Starting from the MHD cubes of the magnetic field, temperature and thermal plasma distribution, in conjunction with the properties of the radio source population, we could generate the associated X-ray and radio emission. Regarding the latter, we also reproduced the emission associated with the cluster radio halos as was done in Reference [9].

3. Simulated Images

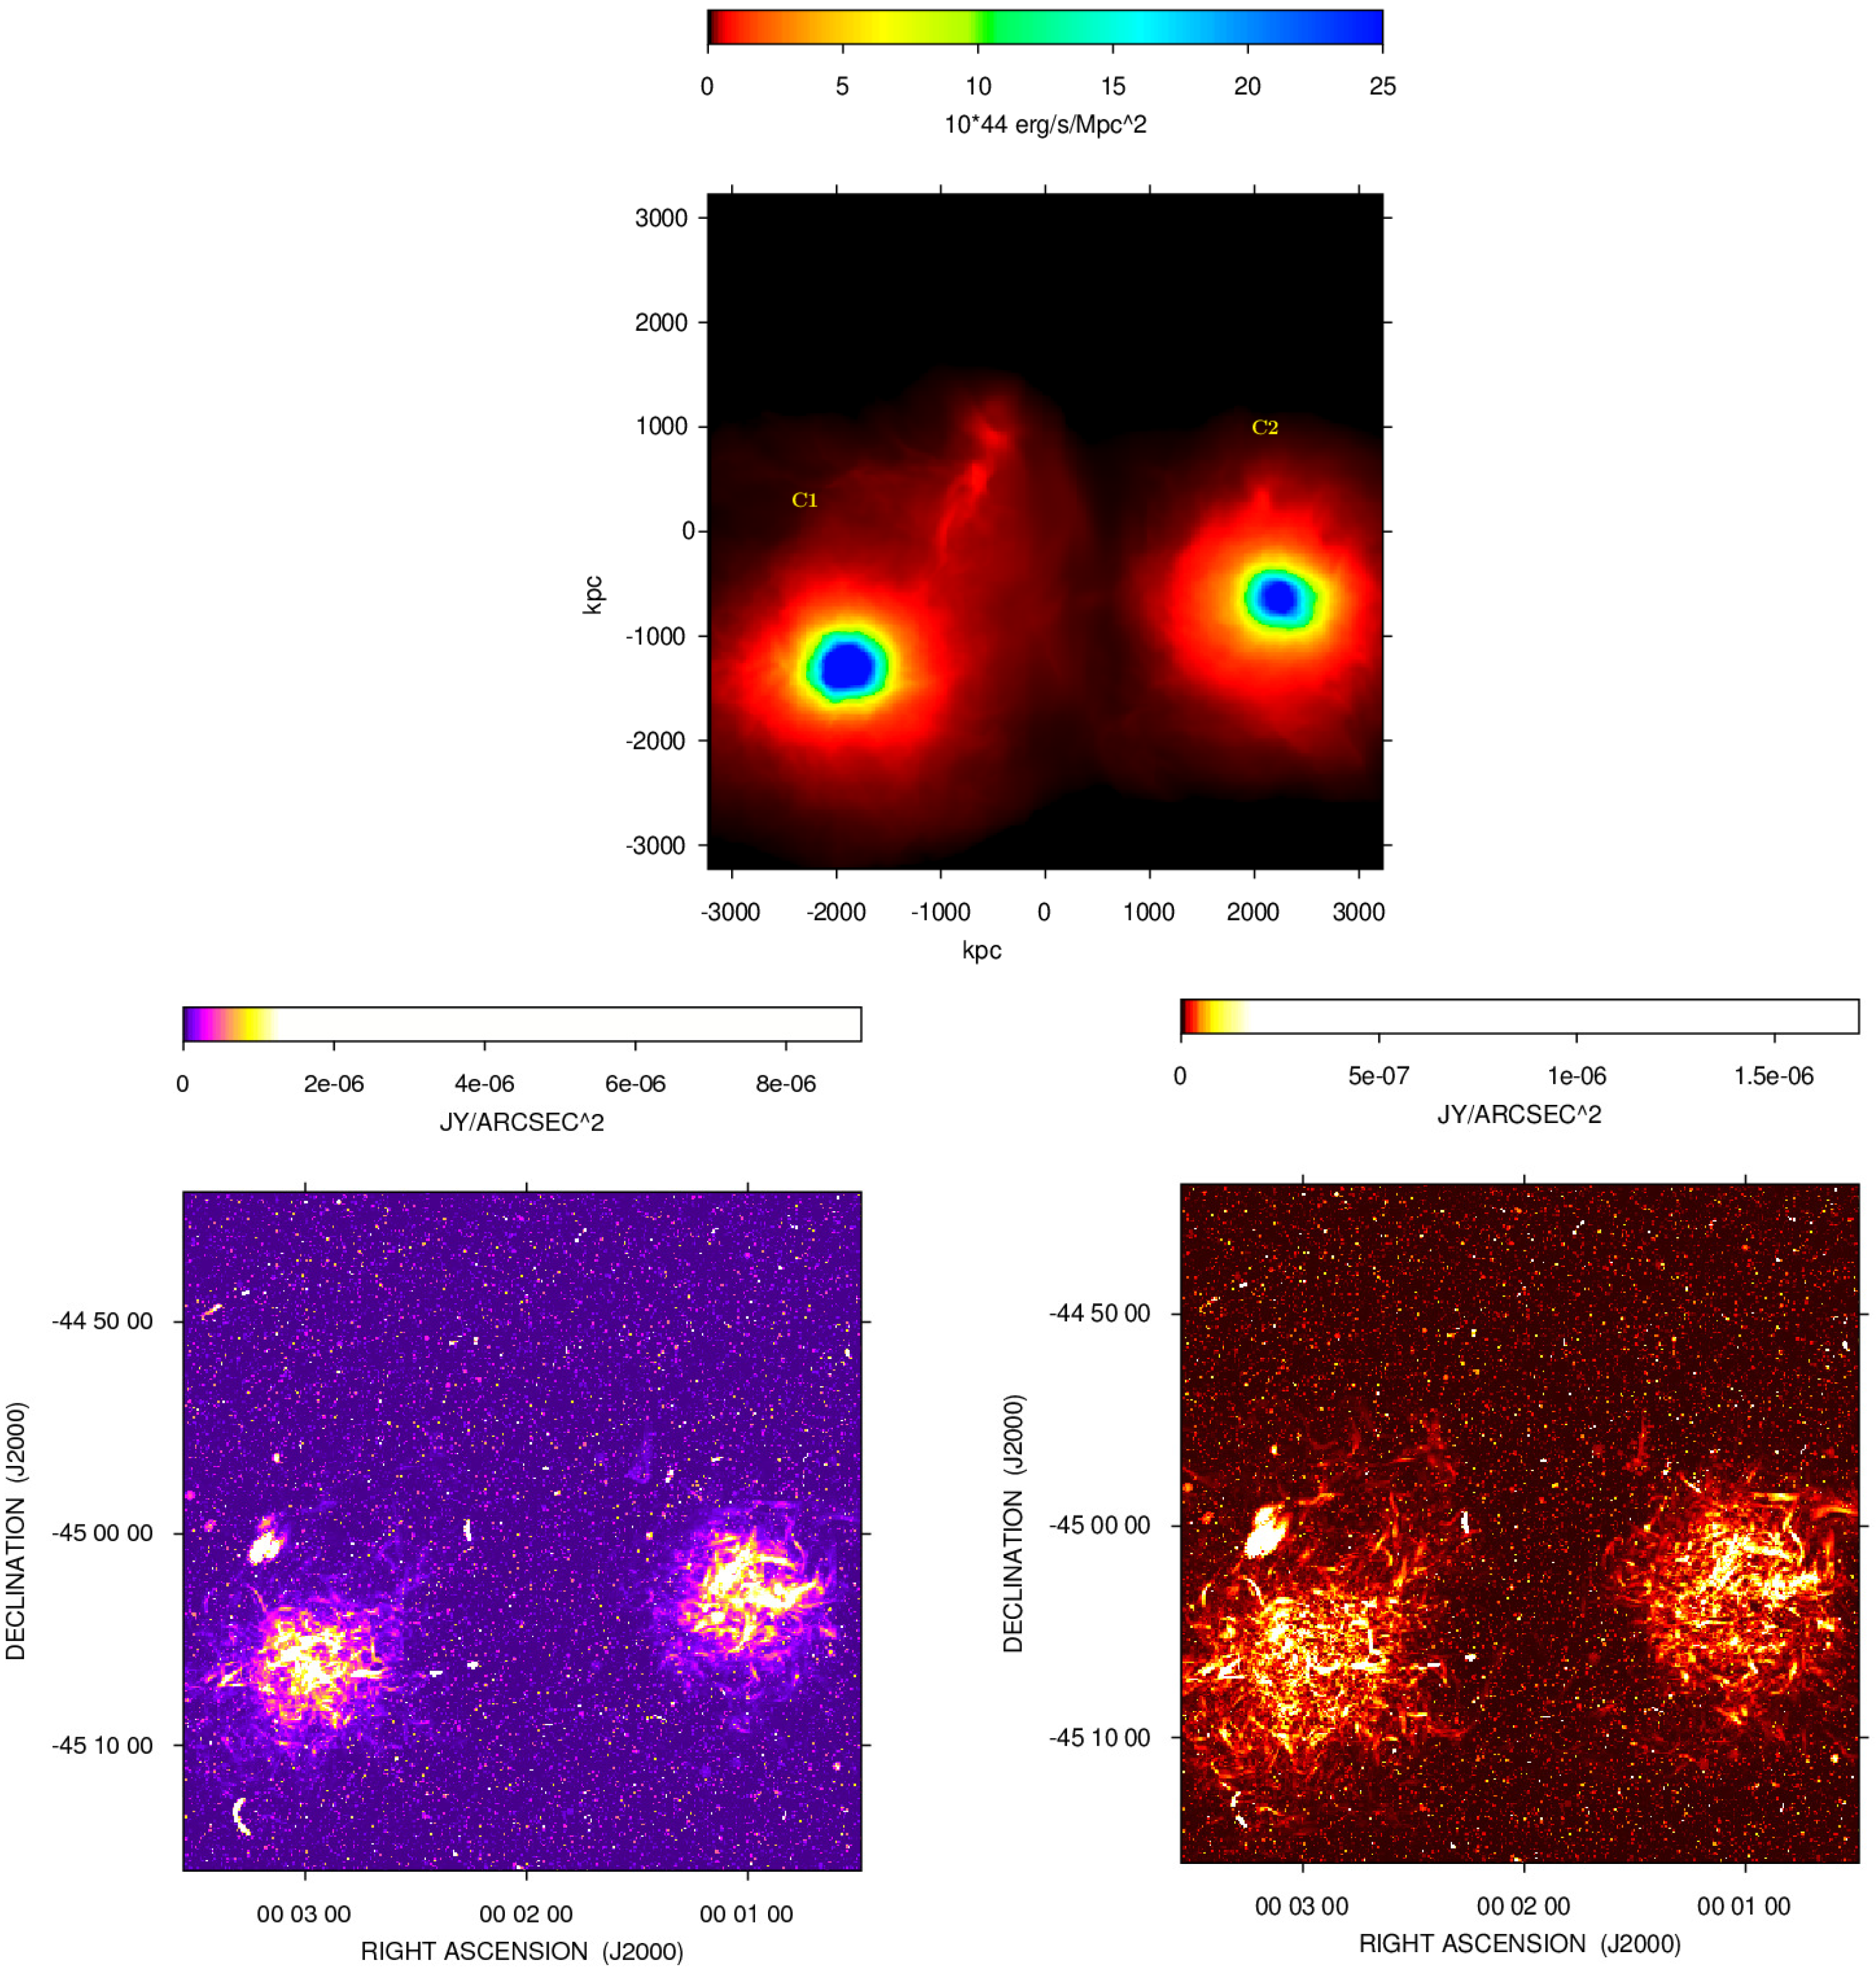
Figure 1 shows (top) the X-ray surface brightness of the thermal plasma associated with the two clusters between 0.1 and 2.4 keV.
To reproduce the total intensity and the polarized emission, we generated the signal associated to the discrete radio sources as well as the cluster radio halos. The results are shown in the bottom images of Figure 1 for what concerns the total intensity (left) and the polarized intensity (right). The signal was reproduced in the frequency band 950–1760 MHz with a channel resolution of 1.46 MHz. The beam FWHM was equal to 2.5″.
The simulated radio halos present levels of polarization larger than 10% already at few hundred kpc from the cluster centers. This is of paramount importance since it implies, differently from what typically observed so far, that radio halos could be polarized. Indeed, there are only three cases of polarized filaments detected in radio halos [15,16,17]. These kind of sources present low surface brightness; thus, the lack of polarized radio halos could be due to the sensitivity level of the current radio telescopes. Conversely, the SKA1-MID could have the potentiality to detect the polarization of radio halos.

4. Results

We explored the potential of RM synthesis in three different cases where the signal was due to:
  • background radio sources;
  • cluster radio halos;
  • all sources: background, cluster, and foreground discrete sources, plus the cluster radio halos.
For each of the three cases, we applied RM synthesis in an interval in Faraday depth going from −5000 to 5000 rad/m2 with a step interval of 10 rad/m2. The resulting transfer function has a FWHM of 40 rad/m2. By applying the RM synthesis technique on a given line of sight in the first case (background sources), the Faraday spectrum (i.e., polarization as a function of the Faraday depths) is composed by a single peak of polarization. Therefore, it is correct to assume, as cluster RM, the Faraday depth in correspondence of this peak. In the other cases, where the emission is due to a radio halo and/or discrete radio sources placed at different positions with respect to the cluster center, we obtained a spectrum in the Faraday space with multiple components: every polarized signal coming from a given source is placed at the Faraday depth crossed by the signal itself. In these cases, we decided to consider just one polarized component in the Faraday spectrum, which is the one with the maximum polarized intensity. We assumed as RM the Faraday depth of this polarization peak.
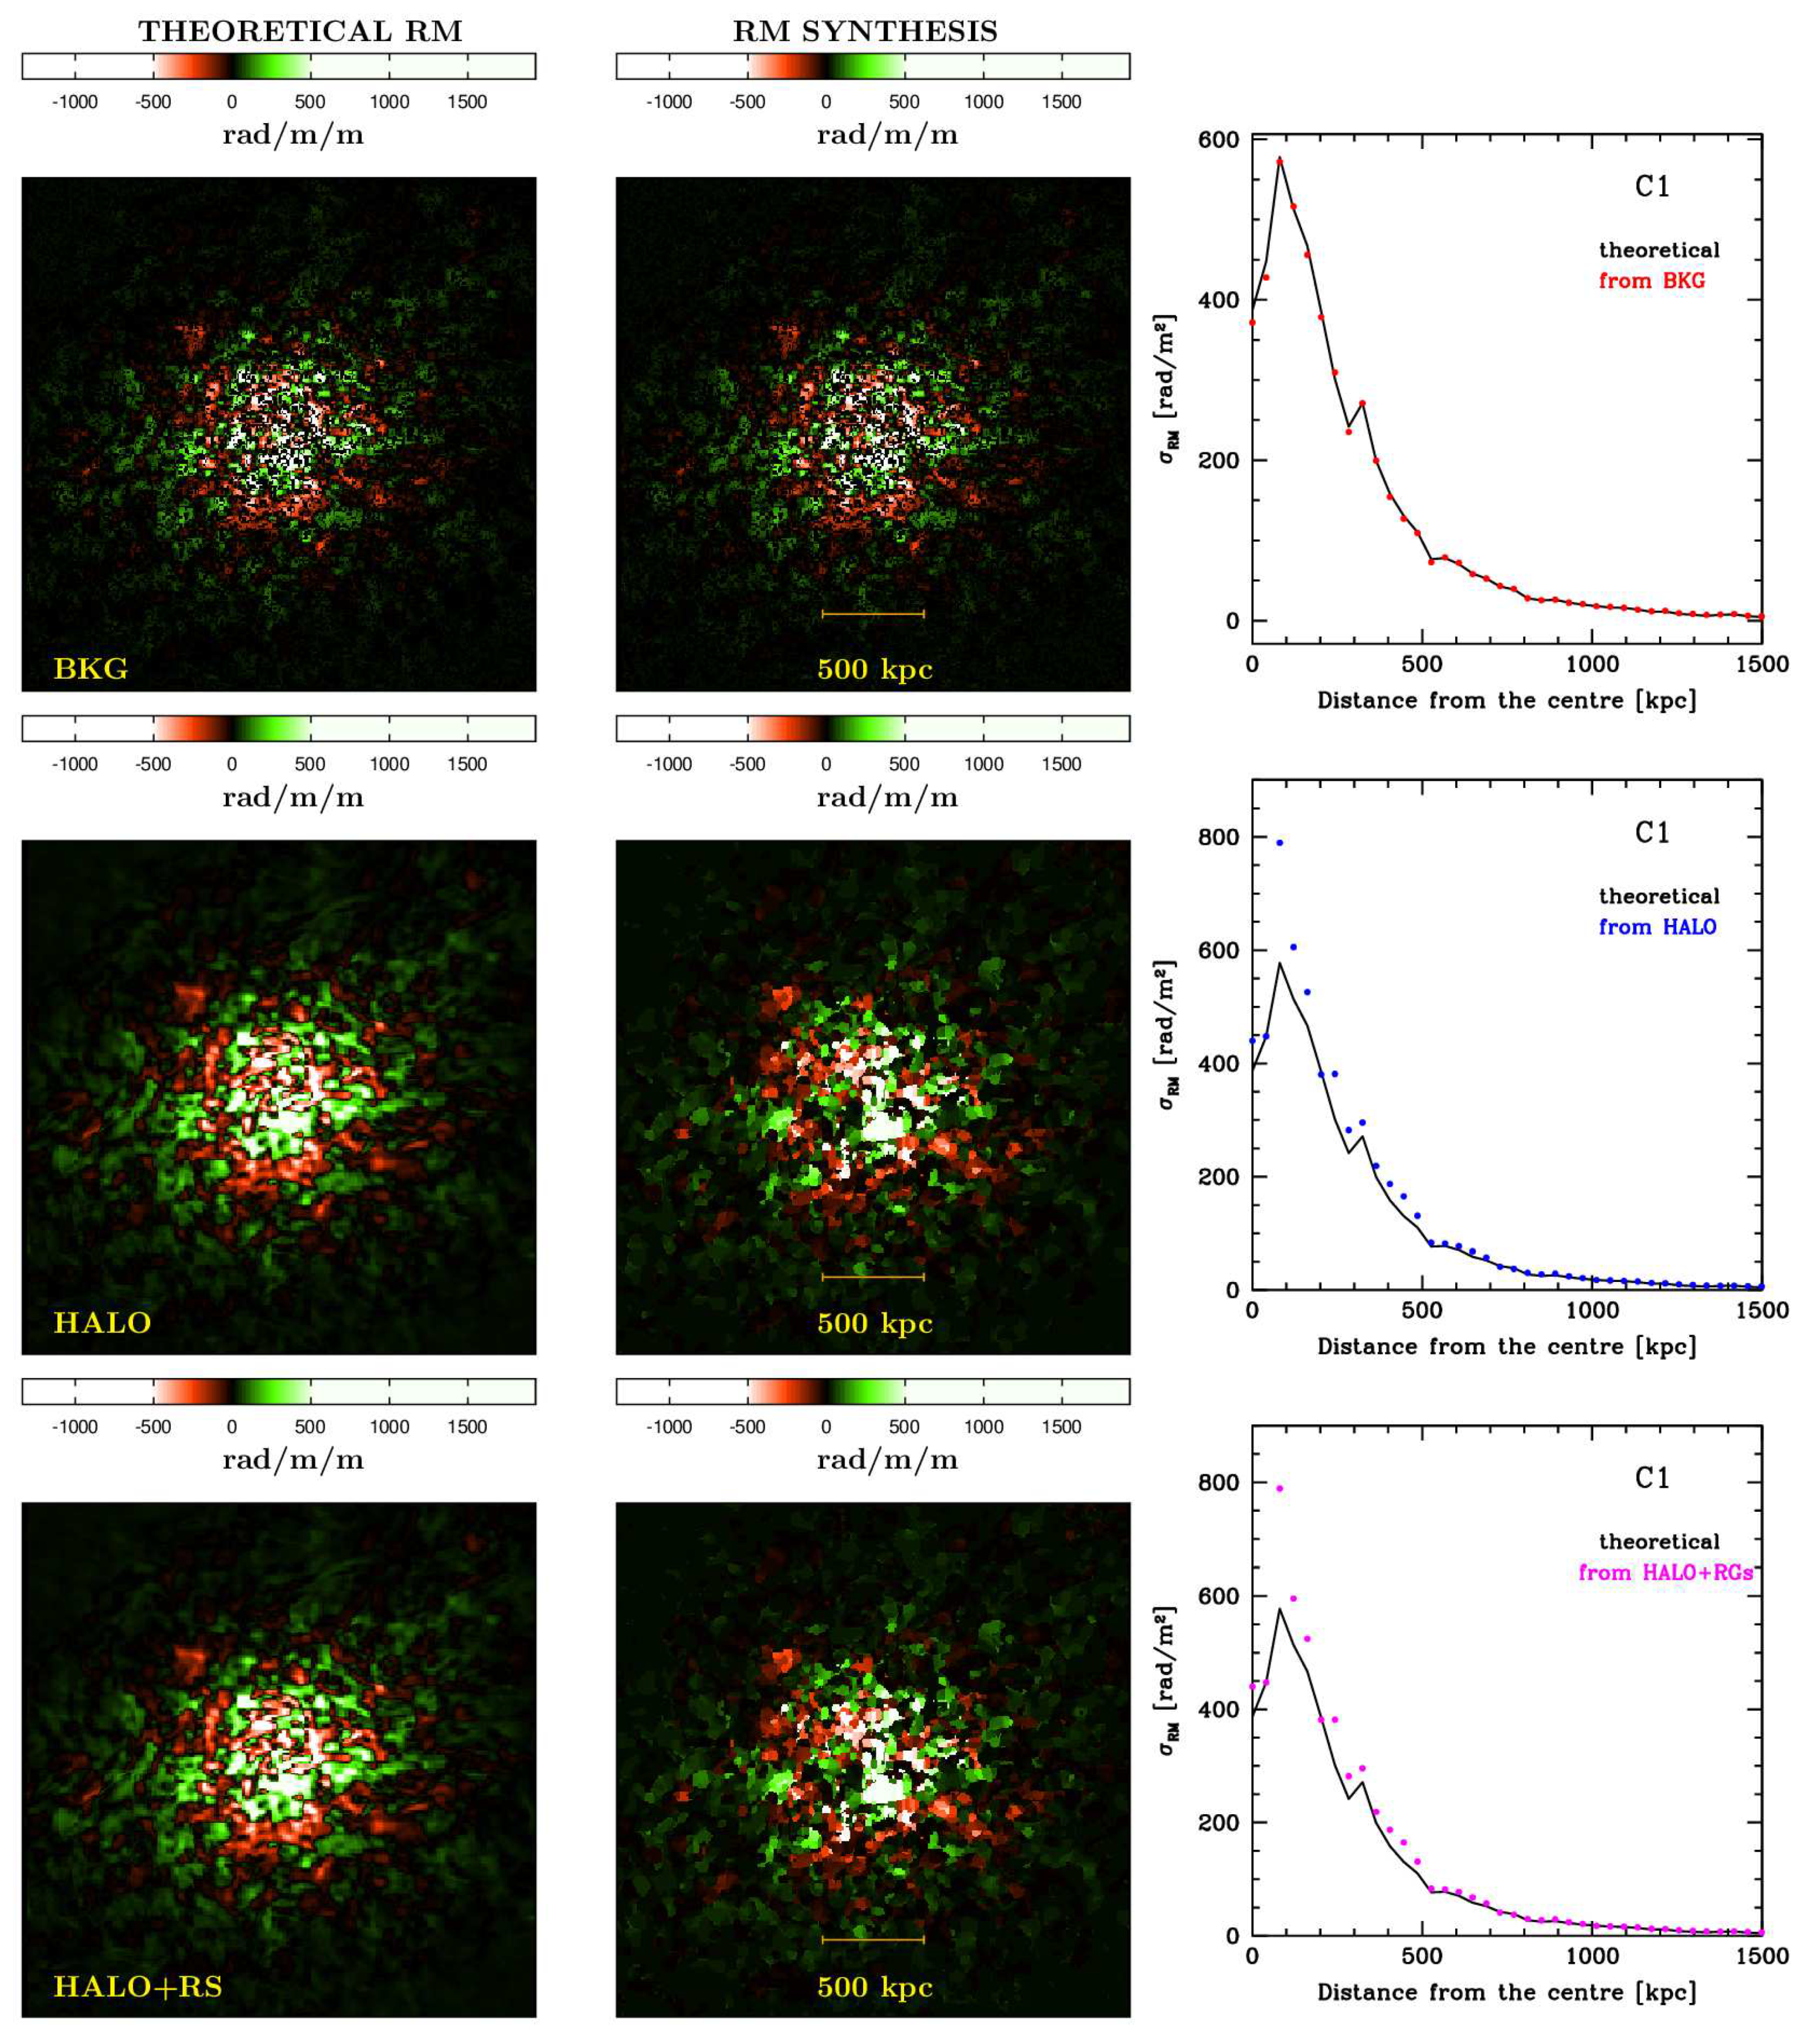
The results are shown in Figure 2, where we focus our attention on a zoom centered on the cluster shown on the left of Figure 1: the left and central panels refer to the cluster RM as computed from the MHD cubes, and to the resulting RM synthesis image, respectively, while the right panel compares the theoretical σ R M (solid line) calculated from the first image with the measurements (dots) derived from the second image. From top to bottom, we illustrate the results of the three different cases.

5. Discussion and Conclusions

We noticed that we could perfectly reconstruct the σ R M profile with RM synthesis when applied only on background radio source signal. This is important as a consistency check of the technique, especially in view of the treatment of more realistic and complex cases where, for example, we introduce thermal noise and/or remove the redshift information of the radio sources. When the same technique is applied to the case of radio halos alone, we can notice the presence of a substructure in the RM synthesis image. This is far from surprising, since the polarized peak in the Faraday spectrum of two close line of sights that share the same theoretical RM can be generated at different positions along the cluster length. Thus, they witness different Faraday depths. Moreover, we observed higher values of σ R M , especially at distances less than 500 kpc from the cluster center. Finally, we see that, in the third case, we obtained results similar to what we found in the previous case, suggesting that the presence of a cluster radio halo deeply influences the results of this technique.
The results of this work indicate that band 2 of the SKA1-MID is very well suited for intracluster magnetic-field studies. Moreover, they suggest that we need to perform accurate analysis of the results of RM synthesis in simulations of galaxy clusters to correctly interpret the outcome of current and future observations.

Author Contributions

The individual contribute of the authors on different aspects of the work is reported in the following. Conceptualization, F.L., M.M., F.G., V.V., L.F. and G.G.; Data curation, F.L., M.M., F.G. and V.V.; Formal analysis, F.L.; Investigation, F.L.; Methodology, F.L., M.M., F.G., V.V., L.F. and G.G.; Project administration, F.L.; Resources, F.L., M.M., F.G., V.V., I.P. and H.L.; Software, F.L., M.M. and F.G.; Supervision, F.L.; Validation, F.L. and I.P.; Visualization, F.L.; Writing—original draft, F.L.; Writing—review & editing, F.G., V.V., I.P., L.F. and G.G.

Funding

The simulations presented here have been produced with the trg computer cluster. The trg computer cluster was funded by the Autonomous Region of Sardinia (RAS) using resources from the Regional Law 7 August 2007 n. 7 (year 2015) “Highly qualified human capital”, in the context of research project CRP 18 “General relativity tests with the Sardinia Radio Telescope” (P.I. of the project: Marta Burgay).

Acknowledgments

We thanks a lot the LOC and the SOC of the conference “The Power of Faraday Tomography”.

Conflicts of Interest

The authors declare no conflict of interest. The founding sponsors had no role in the design of the study; in the collection, analyses, or interpretation of data; in the writing of the manuscript; or in the decision to publish the results.

References

  1. Dolag, K.; Bykov, A.M.; Diaferio, A. Non-Thermal Processes in Cosmological Simulations. Space Sci. Rev. 2008, 134, 311–335. [Google Scholar] [CrossRef] [Green Version]
  2. Carilli, C.L.; Taylor, G.B. Cluster Magnetic fields. Annu. Rev. Astron. Astrophys. 2002, 40, 319–348. [Google Scholar] [CrossRef]
  3. Govoni, F.; Feretti, L. Magnetic fields in Clusters of Galaxies. Int. J. Mod. Phys. D 2004, 13, 1549–1594. [Google Scholar] [CrossRef]
  4. Ruzmaikin, A.A.; Sokoloff, D.D. The calculation of Faraday rotation measures of cosmic radio sources. Astron. Astrophys. 1979, 78, 1–6. [Google Scholar]
  5. Feretti, L.; Giovannini, G.; Govoni, F.; Murgia, M. Clusters of galaxies: Observational properties of the diffuse radio emission. Astron. Astrophys. Rev. 2012, 20, 54. [Google Scholar] [CrossRef]
  6. Brentjens, M.A.; de Bruyn, A.G. Faraday rotation measure synthesis. Astron. Astrophys. 2005, 441, 1217–1228. [Google Scholar] [CrossRef] [Green Version]
  7. Burn, B.J. On the depolarization of discrete radio sources by Faraday dispersion. Mon. Not. R. Astron. Soc. 1966, 133, 67–83. [Google Scholar] [CrossRef]
  8. Ideguchi, S.; Tashiro, Y.; Akahori, T.; Takahashi, K.; Ryu, D. Study of the Vertical Magnetic Field in Face-on Galaxies Using Faraday Tomography. Astrophys. J. 2017, 843, 146. [Google Scholar] [CrossRef] [Green Version]
  9. Govoni, F.; Murgia, M.; Xu, H.; Li, H.; Norman, M.L.; Feretti, L.; Giovannini, G.; Vacca, V. Polarization of cluster radio halos with upcoming radio interferometers. Astron. Astrophys. 2013, 554, A102. [Google Scholar] [CrossRef] [Green Version]
  10. Murgia, M.; Govoni, F.; Feretti, L.; Giovannini, G.; Dallacasa, D.; Fanti, R.; Taylor, G.B.; Dolag, K. Magnetic fields and Faraday rotation in clusters of galaxies. Astron. Astrophys. 2004, 424, 429–446. [Google Scholar] [CrossRef] [Green Version]
  11. Lin, Y.T.; Mohr, J.J. Radio Sources in Galaxy Clusters: Radial Distribution, and 1.4 GHz and K-band Bivariate Luminosity Function. Astrophys. J. Suppl. Ser. 2007, 170, 71. [Google Scholar] [CrossRef]
  12. Wilman, R.J.; Miller, L.; Jarvis, M.J.; Mauch, T.; Levrier, F.; Abdalla, F.B.; Rawlings, S.; Klöckner, H.R.; Obreschkow, D.; Olteanu, D.; et al. A semi-empirical simulation of the extragalactic radio continuum sky for next generation radio telescopes. Mon. Not. R. Astron. Soc. 2008, 388, 1335–1348. [Google Scholar] [CrossRef]
  13. Condon, J.J. Cosmological evolution of radio sources found at 1.4 GHz. Astrophys. J. 1984, 284, 44–53. [Google Scholar] [CrossRef]
  14. Condon, J.J. The 1.4 gigahertz luminosity function and its evolution. Astrophys. J. 1989, 338, 13–23. [Google Scholar] [CrossRef]
  15. Bonafede, A.; Feretti, L.; Giovannini, G.; Govoni, F.; Murgia, M.; Taylor, G.B.; Ebeling, H.; Allen, S.; Gentile, G.; Pihlström, Y. Revealing the magnetic field in a distant galaxy cluster: Discovery of the complex radio emission from MACS J0717.5+3745. Astron. Astrophys. 2009, 503, 707–720. [Google Scholar] [CrossRef]
  16. Girardi, M.; Boschin, W.; Gastaldello, F.; Giovannini, G.; Govoni, F.; Murgia, M.; Barrena, R.; Ettori, S.; Trasatti, M.; Vacca, V. A multiwavelength view of the galaxy cluster Abell 523 and its peculiar diffuse radio source. Mon. Not. R. Astron. Soc. 2016, 456, 2829–2847. [Google Scholar] [CrossRef]
  17. Govoni, F.; Murgia, M.; Feretti, L.; Giovannini, G.; Dallacasa, D.; Taylor, G.B. A2255: The first detection of filamentary polarized emission in a radio halo. Astron. Astrophys. 2005, 430, L5–L8. [Google Scholar] [CrossRef] [Green Version]
1.
Figure 1. (a) X-ray surface brightness of a pair of galaxy clusters at redshift z = 0.205, in a field of view of ∼6.4 Mpc with a spatial resolution of ∼10.7 kpc; (b) total intensity surface brightness at 1.4 GHz of the cluster-embedded, foreground and background discrete radio sources plus the cluster radio halos; (c) polarized intensity surface brightness at 1.4 GHz of the cluster-embedded, foreground and background discrete radio sources plus the cluster radio halos. The beam Full-Width-at-Half-Maximum (FWHM) for images (b,c) is equal to 2.5″, while the field of view is ∼0.3 deg2.
Galaxies 06 00133 g001
Figure 2. From left to right: Theoretical rotation measure (RM) as computed from the magneto-hydro-dynamical (MHD) cubes, results of the RM synthesis applied on U,Q Stokes simulated cubes, profile of the theoretical RM compared to what measured in the RM synthesis image for, respectively, the background discrete radio sources (top); the radio halo (middle); and the foreground, background, cluster-embedded diffuse and discrete sources (bottom) of the galaxy cluster on the left in Figure 1.
Galaxies 06 00133 g002