Abstract
Type Ia supernovae are used as fundamental probes of the cosmological parameters, based on a tight empirical relation between their peak luminosity and the width of their light curve. However, it has been recognized that SNe Ia are not “standard” candles, since important variations in their peak luminosities are observed, as a function of the metallicity, age, environment, and morphological type of the supernova hosts. The largest correction in the standardization scheme is related to extinction. While extinction in the Milky Way (MW) Galaxy is usually known and extinction between galaxies can be assumed to be zero, the value of extinction in the SN Ia host galaxy () is determined with much more uncertainty. In this paper, we provide an estimate of the value based on statistical modeling. To do this, we generate, based on MaNGA data, a set of galaxies in the vicinity of the MW, and distribute the parameters of the galaxies and the positions of SNe Ia in them. As a result, using a simplified model for the distribution of interstellar matter, which is the same for all the sampled galaxies, we can estimate the probability that exceeds a certain value. Our estimates show, in particular, that in almost all cases, > 0.10 mag V, and in 25% of cases, > 0.25 mag V.
1. Introduction
A Type Ia supernova (SN Ia) represents one of the most powerful explosions in the Universe. These events occur when a white dwarf star—the dense, carbon-rich core left behind after a medium-sized star exhausts its nuclear fuel—reaches a critical mass threshold known as the Chandrasekhar limit, about 1.4 (strictly speaking, the explosion mechanism is more complex; for details, see, for example, [1]). In many cases, the extra material required to push the star over its critical mass threshold can be pulled from a companion star or merger with another white dwarf in a binary system. Once the white dwarf crosses this mass threshold, it triggers a nuclear fusion reaction that releases a huge amount of energy. Unlike regular Type II supernovae, which occur every fifty years in the MW, SNe Ia have been detected once every two hundred years [2,3]. The largest SN Ia release to date [4] contains several thousand spectroscopically classified SNe Ia discovered by the Zwicky Transient Facility survey.
What makes SNe Ia particularly valuable is their consistent peak brightness, allowing them to serve as “standard candles” for measuring distances across the Universe. By comparing their apparent brightness in the sky with their known luminosity, their distance can be calculated. These explosions allow astronomers to measure the distances to objects millions or billions of light-years away, and this is vital to measuring the rate at which the Universe is expanding. It should be noted, however, that important variations in SNe Ia peak luminosities are observed, as a function of the metallicity, age, environment, and morphological type of the supernovae hosts (see, e.g., discussion in [1]), which makes them a bit difficult to use as “standard candles”.
SNe Ia became the basis for the construction of a distance ladder used to compare cosmological models, and they have a rich history in revolutionizing the field [5,6]. Modern methods for standardizing SNe Ia light curves use the SALT2 fitting algorithm [7,8], as used by the Pantheon+ Type Ia Supernovae spectroscopic data set [9], and, more recently, SALT3 [10] used by the Dark Energy Survey 5-year release [11]. A new, cosmologically model-independent, statistical analysis of the Pantheon+, improving a standard methodology, was presented in [12], where it was found that the timescape cosmology is not only a viable contender to the ΛCDM framework but may also provide new insights to the astrophysics of modeling SNe Ia. Thus, the study of reasons that can influence the observed brightness of SNe is quite relevant.
SNe Ia are known to suffer from extinction along the line of sight. It is assumed that interstellar dust in the MW Galaxy and host galaxy are primarily responsible for making some objects redder than others. The problem of restoring the intrinsic color and absolute stellar magnitude is complicated by a number of circumstances. The situation is complicated by the fact that different sub-types of SNe Ia may have different intrinsic colors [13], that the low (the ratio of total-to-selective extinction) is due to the presence of a circumstellar medium around the progenitor system [14,15], or the angle from which we view the explosion [13,16]. The problem of the separation of intrinsic and extrinsic components, which both contribute to the observed variability, was recently discussed in [17,18,19].
In this paper, we investigate the possibility of statistically estimating the magnitude of interstellar extinction in the host galaxy, . We assume that the magnitude of extinction in the MW is relatively well known [20,21,22] and the extinction between galaxies (intergalactic extinction) can be neglected.
2. Description of the Model
2.1. Distribution of Interstellar Medium in A Galaxy
The classical model of a homogeneous, semi-infinite absorbing layer with a density exponentially distributed over the height provides the so-called cosecant law (Parenago formula [23]) for visual extinction :
where d is distance (kpc), b is galactic latitude, parameter (kpc) is the height scale, and () is the extinction value per unit distance in the Galactic plane.
At infinity, for , the expression (1) degenerates into a simpler form:
To estimate the extinction value, we will use Formula (1), and expression (2) within the framework of the problem can be useful for quickly estimating the scale. Note that more complete and complex models of interstellar extinction can be found in the literature [24,25,26,27,28,29,30], but for our purposes, the relatively simple Formula (1) is sufficient.
2.2. Estimating the Interstellar Extinction of Light from a Star in a Distant Galaxy
We assume that the supernova is located in the galactic disk and calculate distance d to which the absorbing material extends (let us call this the ”boundary” of the galaxy). For simplicity, we will assume that the shape of the ”boundary” of the host galaxy is a conical surface with radius R and height h. In this case, the distance d from a point located in the galactic disk at a distance r from the center of the galaxy, in the direction determined by the galactic latitude b and longitude l of the observer, to the ”boundary” of the galaxy (see Figure 1) will be determined by the expression
where the value of d is chosen as . In the degenerate case, when , the distance is found from the expression
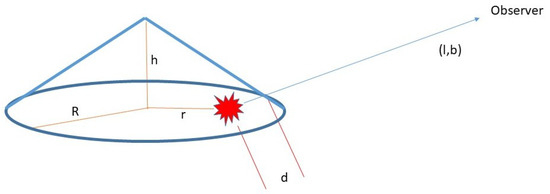
Figure 1.
Schematic for the calculation of distance d from an SN to the “boundary” of the host galaxy (see text for details).
A similar approach, but for fixed values of kpc and kpc, was used in [31] (see their Equation (5)).
To find the law of distribution of interstellar extinction, we conduct statistical modeling. Let us assume that the distance from the supernova to the center of the host galaxy r is distributed exponentially , the galactic latitude of the observer b is distributed as , and the galactic longitude of the observer l is distributed uniformly .
Using inverse transform sampling, we obtain the following expressions for r, l, and b:
where , , and are random uniformly distributed variables , , and .
2.3. The Distribution of Spiral Galaxy Radii and Heights from Observational Survey and Numerical Simulations
In this section, we describe the procedure for obtaining the values R and h needed to calculate the distance d.
The size distribution of spiral galaxies can be derived from observational surveys. The Mapping Nearby Galaxies at Apache Point Observatory [32], call the MaNGA survey, is one of the most advanced and widely used integral field spectroscopic surveys. MaNGA provides spatially resolved spectra that include the kinematics of galaxies and information on stellar populations. It can not only describe the various properties of galaxies well, but the stellar population can also help accurately calculate the stellar mass of galaxies [33]. In addition to spectroscopy, image-based morphological analysis is also important. Because the observed galaxies are two-dimensional images projected at different inclination angles, it is difficult to obtain the galaxy height in the direction of the rotation axis for face-on galaxies. In this regard, morphological analysis based on deep learning helps us select edge-on galaxies and calculate the ratio of the galaxy’s height to radius [34]. Ref. [35] provides both traditional photometry analysis and deep learning-based morphological analysis of MaNGA DR17. Here, we use the MaNGA PyMorph photometric Value Added Catalogue (MPP-VAC-DR17) and the MaNGA Deep Learning Morphological Value Added Catalogue (MDLM-VAC-DR17) from [35] to select edge-on late-type galaxies (LTGs) and calculate the distribution of the corresponding heights and radii. We selected samples with edge-on and LTG probabilities both larger than 0.95 in MaNGA DR17 and excluded dwarf galaxies with logarithmic stellar mass less than 9.5. The redshift range of our sample galaxies from the MaNGA survey is around . The corresponding distribution of galaxy radius and height is shown in Figure 2 (left panel, blue dots), and histograms of their uncertainties, which are derived from the above Value Added Catalogue and error propagation, are shown in the same figure, right panel.
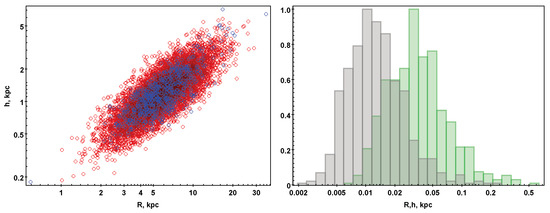
Figure 2.
Left panel: the distributions of observational (blue) and model (red) sets of galaxies by R and h. Note that both axes follow a logarithmic scale. Right panel: normalized histograms of errors in the observational set of galaxies by R (green) and h (grey). Note that the X-axis follows a logarithmic scale.
Generally, there exist some selection effects in the observational spectroscopic surveys, which may cause certain deviations in the size distribution of spiral galaxies. However, correcting the selection effects is time-consuming and beyond the scope of the research, since the goal here is to obtain an approximate size distribution of spiral galaxies.
Statistical modeling of the population of galaxies with sizes corresponding to the observed distribution was performed as follows. The size of each galaxy in the modeled ensemble is determined by the values of R and h, which are statistically independent:
where are the mean observed values, is the Cholesky decomposition of the covariance matrix corresponding to the observed values, and are normally distributed random variables .
The Cholesky decomposition of the covariance matrix for the two-dimensional case is
where denotes the components of the covariance matrix , which has the following structure:
The distributions of the observational and model sets of galaxies with R and h are shown in Figure 2, and there is good agreement between them. Both quantities, R and h, are well described by the lognormal distribution.
By substituting these values of R and h, as well as the values of r, l, and b from (5) into (3), we find the distance d. Finally, by substituting b and d into the expression (1), we find the value of the interstellar extinction . The distributions of the model set of SNe Ia in galaxies with r and d are shown in Figure 3.
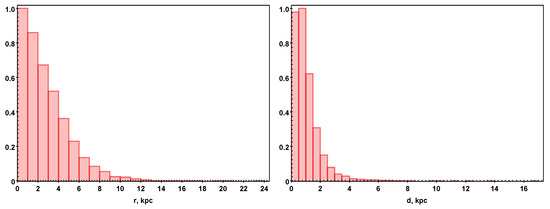
Figure 3.
Distributions of the model set of galaxies with r (left) and d (right).
3. Results
When calculating , we used the value and kpc [36]. The distribution obtained from the simulation is shown in Figure 4, left panel. The average value is mag. Uncertainty can be estimated as Poisson noise level (normalized). It seems useful to approximate the resulting distribution with a function. The left part of distribution on the interval could be approximated by the following expression:
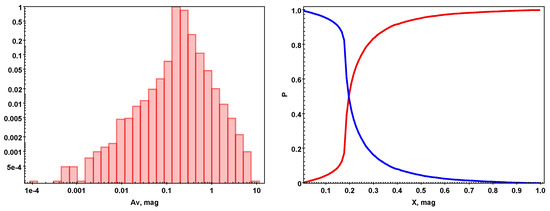
Figure 4.
Left panel: the distribution of the model set of SNe Ia with . Note that both axes follow a logarithmic scale. Right panel: the probability P that will take a value less than or equal to X (red curve) and a value larger than X (blue curve).
And the right part on the interval could be approximated with another expression:
Cumulative distribution functions are shown in Figure 4, right panel. This is the probability P that will take a value less than or equal to X (red curve) and a value larger than X (blue curve). One can see that, e.g.,
- mag) = 0.95;
- mag) = 0.90;
- mag) = 0.46;
- mag) = 0.25;
- mag) = 0.11.
Our results are in qualitative agreement with the results of [37], which obtained the distribution of the total extinction for different host galaxy inclination angles and different values of bulge-to-total luminosity ratios (see their Figure 3), as well as with the results of [38], which explored the dependence of on four observables: the inclination of the host galaxy disk, radial position of the supernova, redshift of the supernova and host, and the level of star formation in the host galaxy.
4. Conclusions
We can draw the following conclusions. Assuming that SNe Ia are located in the plane of spiral galaxies and the distribution of absorbing matter in galaxies corresponds to that in the MW, we investigated the question of the value of interstellar extinction in the host galaxy. We generated 109 spiral galaxies (their sizes correspond to the sizes of galaxies from the MaNGA set), each of which hosts SN Ia at some distance from the center. We calculated the values for them and, based on their distribution, found the probability that, when observing a random supernova, the value for it exceeds a certain value. In particular, mag with a probability of 90%, and mag with a probability of 25%. These results can be useful for calculating the distance to SN Ia. It is worth comparing our results with those of intergalactic extinction ( 0.1 mag [39]).
It should be noted that several simplifications were made in the modeling described here. The model does not include the distribution of SNe with the height above the galactic plane. It may be noted that [40] found that SNe Ia in spiral galaxies are located in thick disks, which in our galaxy has a height scale of about 0.7–0.9 kpc. In addition, SNe Ia may also be found in the bulge population of spirals. Also, a supernova can be located in a spiral arm or between arms, but in the current version of the model, we do not distinguish between these two cases.
The model does not include the difference in the extinction coefficient with the radius of the galaxy and morphological type. Also, extended dust halos are rather common in spiral galaxies, as demonstrated by edge-on galaxies (see, e.g, case NGC891). We also neglect circumstellar extinction. Last but not least, the space between the host galaxy and the MW Galaxy may not be empty at all. In particular, the model presented in [41] predicts a total of about 300 MW satellites within 300 kpc. All these considerations will be taken into account in further research.
Author Contributions
All authors contributed to the study conception and design. Material preparation, data collection, and analysis were performed by all authors. The first draft of the manuscript was written by O.M., and all authors commented on previous versions of the manuscript. All authors have read and agreed to the published version of the manuscript.
Funding
G.Z. and Z.Z. acknowledge the support of the National Natural Science Foundation of China (NSFC) under grant No. 12588202, National Key R&D Program of China No. 2024YFA1611900. Z.Z. acknowledges the support of the fellowship from the China Postdoctoral Science Foundation (Certificate Number: 2024M763214).
Data Availability Statement
Data are available on request from the authors.
Acknowledgments
The authors thanks Maria Pruzhinskaya for her valuable comments. The work was performed using computing resources of the Joint Supercomputing Center of the Russian Academy of Sciences. This research made use of the SAO/NASA Astrophysics Data System and the SIMBAD database, operated at CDS, Strasbourg, France. This research made use of TOPCAT, an interactive graphical viewer and editor for tabular data [42] The acknowledgments were compiled using the Astronomy Acknowledgement Generator.
Conflicts of Interest
The authors have no relevant financial or non-financial interests to disclose.
References
- Livio, M.; Mazzali, P. On the progenitors of Type Ia supernovae. Phys. Rep. 2018, 736, 1–23. [Google Scholar] [CrossRef]
- Li, W.; Chornock, R.; Leaman, J.; Filippenko, A.V.; Poznanski, D.; Wang, X.; Ganeshalingam, M.; Mannucci, F. Nearby supernova rates from the Lick Observatory Supernova Search—III. The rate-size relation, and the rates as a function of galaxy Hubble type and colour. Mon. Not. R. Astron. Soc. 2011, 412, 1473–1507. [Google Scholar] [CrossRef]
- Palicio, P.A.; Matteucci, F.; Della Valle, M.; Spitoni, E. Cosmic Type Ia supernova rate and constraints on supernova Ia progenitors. Astron. Astrophys. 2024, 689, A203. [Google Scholar] [CrossRef]
- Rigault, M.; Smith, M.; Goobar, A.; Maguire, K.; Dimitriadis, G.; Johansson, J.; Nordin, J.; Burgaz, U.; Dhawan, S.; Sollerman, J.; et al. ZTF SN Ia DR2: Overview. Astron. Astrophys. 2025, 694, A1. [Google Scholar] [CrossRef]
- Riess, A.G.; Filippenko, A.V.; Challis, P.; Clocchiatti, A.; Diercks, A.; Garnavich, P.M.; Gilliland, R.L.; Hogan, C.J.; Jha, S.; Kirshner, R.P.; et al. Observational Evidence from Supernovae for an Accelerating Universe and a Cosmological Constant. Astron. J. 1998, 116, 1009–1038. [Google Scholar] [CrossRef]
- Perlmutter, S.; Aldering, G.; Goldhaber, G.; Knop, R.A.; Nugent, P.; Castro, P.G.; Deustua, S.; Fabbro, S.; Goobar, A.; Groom, D.E.; et al. Measurements of Ω and Λ from 42 High-Redshift Supernovae. Astrophys. J. 1999, 517, 565–586. [Google Scholar] [CrossRef]
- Guy, J.; Astier, P.; Baumont, S.; Hardin, D.; Pain, R.; Regnault, N.; Basa, S.; Carlberg, R.G.; Conley, A.; Fabbro, S.; et al. SALT2: Using distant supernovae to improve the use of type Ia supernovae as distance indicators. Astron. Astrophys. 2007, 466, 11–21. [Google Scholar] [CrossRef]
- Taylor, G.; Lidman, C.; Tucker, B.E.; Brout, D.; Hinton, S.R.; Kessler, R. A revised SALT2 surface for fitting Type Ia supernova light curves. Mon. Not. R. Astron. Soc. 2021, 504, 4111–4122. [Google Scholar] [CrossRef]
- Scolnic, D.; Brout, D.; Carr, A.; Riess, A.G.; Davis, T.M.; Dwomoh, A.; Jones, D.O.; Ali, N.; Charvu, P.; Chen, R.; et al. The Pantheon+ Analysis: The Full Data Set and Light-curve Release. Astrophys. J. 2022, 938, 113. [Google Scholar] [CrossRef]
- Kenworthy, W.D.; Jones, D.O.; Dai, M.; Kessler, R.; Scolnic, D.; Brout, D.; Siebert, M.R.; Pierel, J.D.R.; Dettman, K.G.; Dimitriadis, G.; et al. SALT3: An Improved Type Ia Supernova Model for Measuring Cosmic Distances. Astrophys. J. 2021, 923, 265. [Google Scholar] [CrossRef]
- DES Collaboration; Abbott, T.M.C.; Acevedo, M.; Aguena, M.; Alarcon, A.; Allam, S.; Alves, O.; Amon, A.; Andrade-Oliveira, F.; Annis, J.; et al. The Dark Energy Survey: Cosmology Results with ∼1500 New High-redshift Type Ia Supernovae Using the Full 5 yr Data Set. Astrophys. J. Lett. 2024, 973, L14. [Google Scholar] [CrossRef]
- Seifert, A.; Lane, Z.G.; Galoppo, M.; Ridden-Harper, R.; Wiltshire, D.L. Supernovae evidence for foundational change to cosmological models. Mon. Not. R. Astron. Soc. 2025, 537, L55–L60. [Google Scholar] [CrossRef]
- Foley, R.J.; Kasen, D. Measuring Ejecta Velocity Improves Type Ia Supernova Distances. Astrophys. J. 2011, 729, 55. [Google Scholar] [CrossRef]
- Wang, L. Dust around Type Ia Supernovae. Astrophys. J. Lett. 2005, 635, L33–L36. [Google Scholar] [CrossRef]
- Goobar, A. Low RV from Circumstellar Dust around Supernovae. Astrophys. J. Lett. 2008, 686, L103. [Google Scholar] [CrossRef]
- Maeda, K.; Leloudas, G.; Taubenberger, S.; Stritzinger, M.; Sollerman, J.; Elias-Rosa, N.; Benetti, S.; Hamuy, M.; Folatelli, G.; Mazzali, P.A. Effects of the explosion asymmetry and viewing angle on the Type Ia supernova colour and luminosity calibration. Mon. Not. R. Astron. Soc. 2011, 413, 3075–3094. [Google Scholar] [CrossRef][Green Version]
- Chotard, N.; Gangler, E.; Aldering, G.; Antilogus, P.; Aragon, C.; Bailey, S.; Baltay, C.; Bongard, S.; Buton, C.; Canto, A.; et al. The reddening law of type Ia supernovae: Separating intrinsic variability from dust using equivalent widths. Astron. Astrophys. 2011, 529, L4. [Google Scholar] [CrossRef]
- Meldorf, C.; Palmese, A.; Brout, D.; Chen, R.; Scolnic, D.; Kelsey, L.; Galbany, L.; Hartley, W.G.; Davis, T.M.; Drlica-Wagner, A.; et al. The Dark Energy Survey Supernova Program results: Type Ia supernova brightness correlates with host galaxy dust. Mon. Not. R. Astron. Soc. 2023, 518, 1985–2004. [Google Scholar] [CrossRef]
- Smadja, G.; Copin, Y.; Hillebrandt, W.; Saunders, C.; Tao, C. Intrinsic and extinction colour components in SNe Ia and the determination of RV. Astron. Astrophys. 2024, 682, A121. [Google Scholar] [CrossRef]
- Gontcharov, G.A.; Marchuk, A.A.; Khovrichev, M.Y.; Mosenkov, A.V.; Savchenko, S.S.; Il’in, V.B.; Poliakov, D.M.; Smirnov, A.A. New Interstellar Extinction Maps Based on Gaia and Other Sky Surveys. Astron. Lett. 2023, 49, 673–696. [Google Scholar] [CrossRef]
- Malkov, O.; Avdeeva, A.; Kovaleva, D. LAMOST Spectroscopy and Gaia Photo-Astrometry for an Interstellar Extinction Study. Galaxies 2024, 12, 65. [Google Scholar] [CrossRef]
- Zhang, X.; Green, G.M. Three-dimensional maps of the interstellar dust extinction curve within the Milky Way galaxy. Science 2025, 387, 1209–1214. [Google Scholar] [CrossRef]
- Parenago, P.P. On interstellar extinction of light. Astron. Zh. 1940, 13, 3. [Google Scholar]
- Fitzgerald, M.P. The Distribution of Interstellar Reddening Material. Astron. J. 1968, 73, 983. [Google Scholar] [CrossRef]
- Neckel, T.; Klare, G. The spatial distribution of the interstellar extinction. Astronomy and Astrophysics Supplement Series 1980, 42, 251. [Google Scholar]
- Pandey, A.K.; Mahra, H.S. Interstellar extinction and Galactic structure. Mon. Not. R. Astron. Soc. 1987, 226, 635–643. [Google Scholar] [CrossRef]
- Arenou, F.; Grenon, M.; Gomez, A. 16. A tridimensional model of the galactic interstellar extinction. Astron. Astrophys. 1992, 258, 104–111. [Google Scholar]
- Sale, S.E.; Drew, J.E.; Barentsen, G.; Farnhill, H.J.; Raddi, R.; Barlow, M.J.; Eislöffel, J.; Vink, J.S.; Rodríguez-Gil, P.; Wright, N.J. A 3D extinction map of the northern Galactic plane based on IPHAS photometry. Mon. Not. R. Astron. Soc. 2014, 443, 2907–2922. [Google Scholar] [CrossRef]
- Green, G.M.; Schlafly, E.F.; Finkbeiner, D.P.; Rix, H.-W.; Martin, N.; Burgett, W.; Draper, P.W.; Flewelling, H.; Hodapp, K.; Kaiser, N. A Three-dimensional Map of Milky Way Dust. Astrophys. J. 2015, 810, 25. [Google Scholar] [CrossRef]
- Lallement, R.; Babusiaux, C.; Vergely, J.L.; Katz, D.; Arenou, F.; Valette, B.; Hottier, C.; Capitanio, L. Gaia-2MASS 3D maps of Galactic interstellar dust within 3 kpc. Astron. Astrophys. 2019, 625, A135. [Google Scholar] [CrossRef]
- Hakkila, J.; Myers, J.M.; Stidham, B.J.; Hartmann, D.H. A Computerized Model of Large-Scale Visual Interstellar Extinction. Astron. J. 1997, 114, 2043. [Google Scholar] [CrossRef]
- Bundy, K.; Bershady, M.A.; Law, D.R.; Yan, R.; Drory, N.; MacDonald, N.; Wake, D.A.; Cherinka, B.; Sánchez-Gallego, J.R.; Weijmans, A.M.; et al. Overview of the SDSS-IV MaNGA Survey: Mapping nearby Galaxies at Apache Point Observatory. Astrophys. J. 2015, 798, 7. [Google Scholar] [CrossRef]
- Sánchez, S.F.; Barrera-Ballesteros, J.K.; Lacerda, E.; Mejía-Narvaez, A.; Camps-Fariña, A.; Bruzual, G.; Espinosa-Ponce, C.; Rodríguez-Puebla, A.; Calette, A.R.; Ibarra-Medel, H.; et al. SDSS-IV MaNGA: PyPipe3D Analysis Release for 10,000 Galaxies. Astrophys. J. Suppl. Ser. 2022, 262, 36. [Google Scholar] [CrossRef]
- Fischer, J.L.; Domínguez Sánchez, H.; Bernardi, M. SDSS-IV MaNGA PyMorph Photometric and Deep Learning Morphological Catalogues and implications for bulge properties and stellar angular momentum. Mon. Not. R. Astron. Soc. 2019, 483, 2057–2077. [Google Scholar] [CrossRef]
- Domínguez Sánchez, H.; Margalef, B.; Bernardi, M.; Huertas-Company, M. SDSS-IV DR17: Final release of MaNGA PyMorph photometric and deep-learning morphological catalogues. Mon. Not. R. Astron. Soc. 2022, 509, 4024–4036. [Google Scholar] [CrossRef]
- Sharov, A.S. A Reappraisal of Interstellar Light Absorption in the Galaxy. Astron. Rep. 1963, 40, 900. [Google Scholar]
- Riello, M.; Patat, F. Extinction correction for Type Ia supernova rates - I. The model. Mon. Not. R. Astron. Soc. 2005, 362, 671–680. [Google Scholar] [CrossRef]
- Holwerda, B.W.; Reynolds, A.; Smith, M.; Kraan-Korteweg, R.C. SN Ia host galaxy properties and the dust extinction distribution. Mon. Not. R. Astron. Soc. 2015, 446, 3768–3775. [Google Scholar] [CrossRef]
- Ménard, B.; Kilbinger, M.; Scranton, R. On the impact of intergalactic dust on cosmology with Type Ia supernovae. Mon. Not. R. Astron. Soc. 2010, 406, 1815–1820. [Google Scholar] [CrossRef]
- Hakobyan, A.A.; Barkhudaryan, L.V.; Karapetyan, A.G.; Mamon, G.A.; Kunth, D.; Adibekyan, V.; Aramyan, L.S.; Petrosian, A.R.; Turatto, M. Supernovae and their host galaxies - V. The vertical distribution of supernovae in disc galaxies. Mon. Not. R. Astron. Soc. 2017, 471, 1390–1400. [Google Scholar] [CrossRef]
- Santos-Santos, I.M.E.; Frenk, C.S.; Navarro, J.F.; Cole, S.; Helly, J. The unabridged satellite luminosity function of Milky Way-like galaxies in ΛCDM: The contribution of ’orphan’ satellites. Mon. Not. R. Astron. Soc. 2025, 540, 1107–1123. [Google Scholar] [CrossRef]
- Taylor, M.B. TOPCAT & STIL: Starlink Table/VOTable Processing Software. In Proceedings of the Astronomical Data Analysis Software and Systems XIV; Astronomical Society of the Pacific Conference Series; Shopbell, P., Britton, M., Ebert, R., Eds.; Astronomical Society of the Pacific: San Francisco, CA, USA, 2005; Volume 347, p. 29. [Google Scholar]


Disclaimer/Publisher’s Note: The statements, opinions and data contained in all publications are solely those of the individual author(s) and contributor(s) and not of MDPI and/or the editor(s). MDPI and/or the editor(s) disclaim responsibility for any injury to people or property resulting from any ideas, methods, instructions or products referred to in the content. |
© 2025 by the authors. Licensee MDPI, Basel, Switzerland. This article is an open access article distributed under the terms and conditions of the Creative Commons Attribution (CC BY) license (https://creativecommons.org/licenses/by/4.0/).