Article

VERA’s 20 yr Evolution in Science and Technology

1
Mizusawa VLBI Observatory, NAOJ, Ohshu 023-0861, Japan
2
Department of Astronomical Science, SOKENDAI, Mitaka 181-8588, Japan
3
Department of Astronomy, School of Science, University of Tokyo, Mitaka 181-8588, Japan
4
Graduate School of Science and Engineering, Kagoshima University, Kagoshima 890-0065, Japan
*
Author to whom correspondence should be addressed.
Galaxies 2025, 13(6), 120; https://doi.org/10.3390/galaxies13060120
Submission received: 1 September 2025 / Revised: 7 October 2025 / Accepted: 17 October 2025 / Published: 27 October 2025
(This article belongs to the Special Issue Recent Advances in Radio Astronomy)

Abstract

We review the past 20 yr evolution of VERA (VLBI Exploration of Radio Astrometry) in both science and techinology. VERA is a VLBI array in Japan which consists of four 20 m-diameter telescopes, originally dedicated to phase-referencing VLBI astrometry. Its main observing bands are K (22 GHz) and Q (43 GHz) for conducting astrometry observations of H2O and SiO maser sources. In its 20 yr history, VERA has conducted astrometry observations of ∼100 maser sources, revealing the three-dimensional structure of the Milky Way Galaxy. Its long-term observations of Sgr A* resulted in the first parallax detection of the super-massive black hole at the Galaxy center. Observations of maser sources also revealed physical properties of star-forming regions and provided calibration of AGB stars’ distances and their Period–Luminosity relation. In parallel, several upgrades have been carried out in receivers as well as digital back-ends and correlator to extend the frequency bands and the data rate.

1. Introduction

VERA (VLBI Exploration of Radio Astrometry) is a VLBI network consisting of four 20 m-diameter radio telescopes (Mizusawa, Iriki, Ogasawara, and Ishigaki-jima) installed in Japan (see the array map in Figure 1). Its construction began in 2000, and the four stations were completed in 2002. Since then, the array have been in operation as a dedicated VLBI array in Japan. The array is operated by Mizusawa VLBI Observatory of the National Astronomical Observatory of Japan (NAOJ), in collaboration with the Faculty of Science of Kagoshima University, which substantially contributes to the operation at Iriki station. The original goal of VERA at the time of construction was to measure positions of maser sources in the Galaxy at an accuracy of 10 micro-arcsecond (μas) level to determine their distances and motions as well as to explore the three-dimensional structure of the Galaxy.
Historically, VERA was initially planned in the 1980’s at the International Latitude Observatory of Mizusawa, the predecessor of Mizusawa VLBI Observatory of NAOJ. Its initial focus was not astronomy, but it rather aimed at precise measurements of the Earth rotation as a part of service conducted at the International Latitude Observatories. In fact, in the early days, the name VERA stands for “VLBI for Earth Rotation and Astrometry”, being different from the current abbreviation, though its acronym is the same. The initial array design was also different from the currently existing one, with more focus on measuring the Earth’s rotation using a single but long baseline between Mizusawa and Ishigaki-jima [1]. Later, its design was modified to have multiple antenna clusters at the two sites so that one could improve geodetic measurement accuracy.
In the era of the reorganization of the Mizusawa Latitude Observatory to NAOJ Mizusawa, VERA’s design was also reorganized to have more focus on astronomical observation rather than geodesy, and for this reason, the array was re-designed to have antennas at four stations, resulting in the current array with four locations as shown in Figure 1. In the late 1990s, further consideration was given to the antenna design to make the telescope as much as sensitive while keeping the boundary of a budgetary limit, and the final design was completed with an idea of equipping a dual-beam observing system onto each 20 m-diameter antenna [2,3,4,5], instead of placing two small antennas at each site. In 2000, the initial budget was allocated and construction began.
VERA is the first radio telescope network in Japan dedicated to VLBI astronomy, and its most remarkable feature is that it is the only array equipped with a dual-beam receiving system for phase-referencing [3,5]. In addition, it had several unique features at the period of early 2000’s, such as high data recording rate of 1 Gbps (based on magnetic tape recorder), which was among the highest recording rate (and thus provided the widest bandwidth) at that time. Over the last 20 years, new developments have been carried out in several aspects, and its performance has been continuously improved, while conducting maser astronomy observations and research on the structure of the Galaxy.
In this paper, we summarize the scientific achievements as well as technology developments of VERA over the past 20 years. The paper is structured as follows: Section 2 summarizes the initial VERA system, Section 3, Section 4 and Section 5 summarize the highlights of scientific achievements over the past 20 years, covering the Galaxy structure mainly based on astrometry of star-forming regions, astrometry of the Galactic center black hole, Sgr A*, and observations of asymptotic giant branch (AGB) stars. Then, Section 6 summarizes the technological developments and performance improvements over the period, and Section 7 is for future prospects.

2. Initial Observing System of VERA

The VERA array consists of four 20 m-diameter radio telescopes located in Japan, with a maximum baseline length of 2300 km, as shown in Figure 1. The most unique feature of the VERA telescope is the dual-beam platforms in the receiver cabin. The platforms are mounted on a Stewart mount, and can be moved along the Cassegrain focal plane of the telescope. Its upper view is shown in Figure 2, on which several receivers are installed on the two receiver platforms. The platforms are installed on a field rotator so that it can compensate the field-of-view rotation due to the Earth rotation. These mechanisms enable one to conduct phase-referencing VLBI observations by simultaneously observing any two celestial objects with a separation angle between 0.3 and 2.2 degrees on the celestial sphere.
At the start of VERA’s operation, around 2003, the main receiver bands were K-band (22 GHz) and Q-band (43 GHz). The former is for observing water-vapor (H2O) maser, and the latter for silicon monoxide (SiO) maser. Dual-beam receivers were installed for these two bands to enable simultaneous observations of a target maser source and a reference source, the latter of which is typically a radio-emitting distant source such as AGN (Active Galactic Nuclei) or QSO (Quasi-Stellar Objects). The two pairs of K/Q-band conical horns for the dual-beam receivers are seen in Figure 2. At the early phase of operation, only left-handed circularly polarization was received in K- and Q-bands. Right-handed circularly polarization capability was later added through upgrades in 2010’s. The K-band and Q-band receivers are equipped with cooled HEMT amplifiers as LNA, which are operating at 20 K. Typical receiver temperatures are about 30 K for K-band, and about 80 K- for Q-band.
During the early stage of VERA operation, geodetic observations were conducted with a combination of S- and X-bands. For this purpose, each station was equipped with a set of S/X-band receivers capable of simultaneous observation. The S/X receivers consist of two helical array antennas (as seen on the platform B in Figure 2, the larger one for S-band and the smaller for X-band), to meet the height restrictions of VERA’s receiver cabin. Because of their structures, one can only receive right-handed circularly polarization. The S/X receivers were equipped with room-temperature amplifiers as LNA. In addition to S/X-band RX, a C-band receiver was later installed at each station for observation of methanol (CH3OH) masers at 6.7 GHz. This receiver is equipped with a room-temperature amplifier, too, with a receiver temperature of about 100 K.
The output from these receivers is converted to base-band via an intermediate frequency band of 5 to 7 GHz and digitized by an A/D (Analog/Digital) converter installed in the receiver cabin. At the initial stage of operation, each telescope produced two streams of data at a sampling rate of 1 Gsps (Giga sample per second) with a 2-bit quantization. Currently data acquisition rate has been significantly improved up to 16 Gbps (Giga bit per second) at maximum, which will described in a later section. The digitized data is transmitted to the observatory building via an optical fiber, and then recorded after being processed with a digital filter.
The recorder used at the time of initial operation was a magnetic-tape-based DIR-2000 system by Sony, Atsugi, Japan, which provided a recording rate of 1 Gbps (in total of the dual-beam data). Taking into account the 2-bit quantization and Nyquist rate sampling, the maximum bandwidth that could be recorded at one time was 256 MHz. This bandwidth is shared with the two celestial objects observed with the dual-beam system after filtering data stream from each beam. Bandwidth allocation to the two objects with dual-beam is flexible thanks to a digital filter system [6] that can adjust bandwidth as well as a number of IF channels allocated to each beam: for example, it can allocate one 16 MHz channel to a maser source, and all the rest of 16 MHz × 15 channels to a continuum source, which is optimized for a standard maser–reference pair.
VERA’s initial correlator was an FX correlator originally developed for the space VLBI project VSOP (VLBI Space Observatory Programme) [7] and was modified for VERA to accept dual-beam observations at 1 Gbps data rate. In VSOP observations, the correlator was able to accept 10 stations at 256 Mbps data rate, and the correlator was modified for VERA to accept four stations at a data rate of 1 Gbps. As was the original VSOP correlator, it was being operated at the NAOJ Mitaka correlation center. Later, a software correlator that runs on a PC cluster was developed as a next generation correlator for VERA. The software correlator is now in regular operation at Mizusawa VLBI observatory (see Section 6 for details), and the FX correlator at Mitaka terminated its operation in 2017.
As for calibration in VERA, amplitude calibration is conducted with the chopper wheel equipped in front of the receiver horns (R-Sky calibration), and system noise temperature, Tsys*, is provided during observation. Dual-beam phase calibration is conducted based on the horn-on-dish method [3,5]. In this calibration method, four noise sources are installed near the main reflector of the telescope, and broad-band radio noise is emitted from the noise source toward the sub-reflector. After being reflected by the sub-reflector, the noise enters both receivers (dual beams at K-band or Q-band), and is then transmitted to digital back-ends through exactly the same path as the signals from celestial sources. The path length difference in the two beams and its time variation is monitored by taking correlation of the noise received by the dual-beam receivers. With this phase calibration scheme, highly accurate position measurement is possible in spite of the existence of path length difference between the dual-beam receiving system (see [5] for more details).
Regular operation of the VERA array is conducted remotely from the Array Operation Center (AOC) located in Mizusawa VLBI Observatory. Operation schedules are written in the international standard VEX (VLBI Experiment) format. Although the VEX schedule used for VERA has some expressions specific to VERA’s dual-beam, it is relatively easy to modify the international standard VEX file to VERA’s VEX.

3. Astrometry Results: SFR and Galaxy Structure

3.1. Galactic Astrometry

The main science goal of the VERA project is to determine the three-dimensional velocity and spatial structures of the Milky Way Galaxy through VLBI astrometry of Galactic maser sources [8,9,10] at the highest accuracy for the annual parallax measurement of ∼10 μas at the distance of ∼10 kpc sources [11]. Until 2020, a total of 99 parallax measurements with VERA were published and the results are listed in the first VERA catalog [10]. Astrometric observations of each target source were typically conducted for 1.5–2 years with intervals of 1–2 months. Due to the time variability of maser sources, monitoring observations of about half of the original target sources (∼200) could not be continued for more than a year, making it difficult to accurately measure annual parallaxes for about half of the target sources. Almost all VERA targets are Galactic maser sources associated with the 22 GHz H2O masers. In addition, two sources are observed in the 43 GHz SiO maser emission. Among them, 68 are associated with young stellar objects (YSOs) in star-forming regions and 31 are located around evolved stars mostly in AGB phase, while some of red supergiant (RSG) stars, possible candidates of post-AGB stars and young planetary nebulae, are also included.
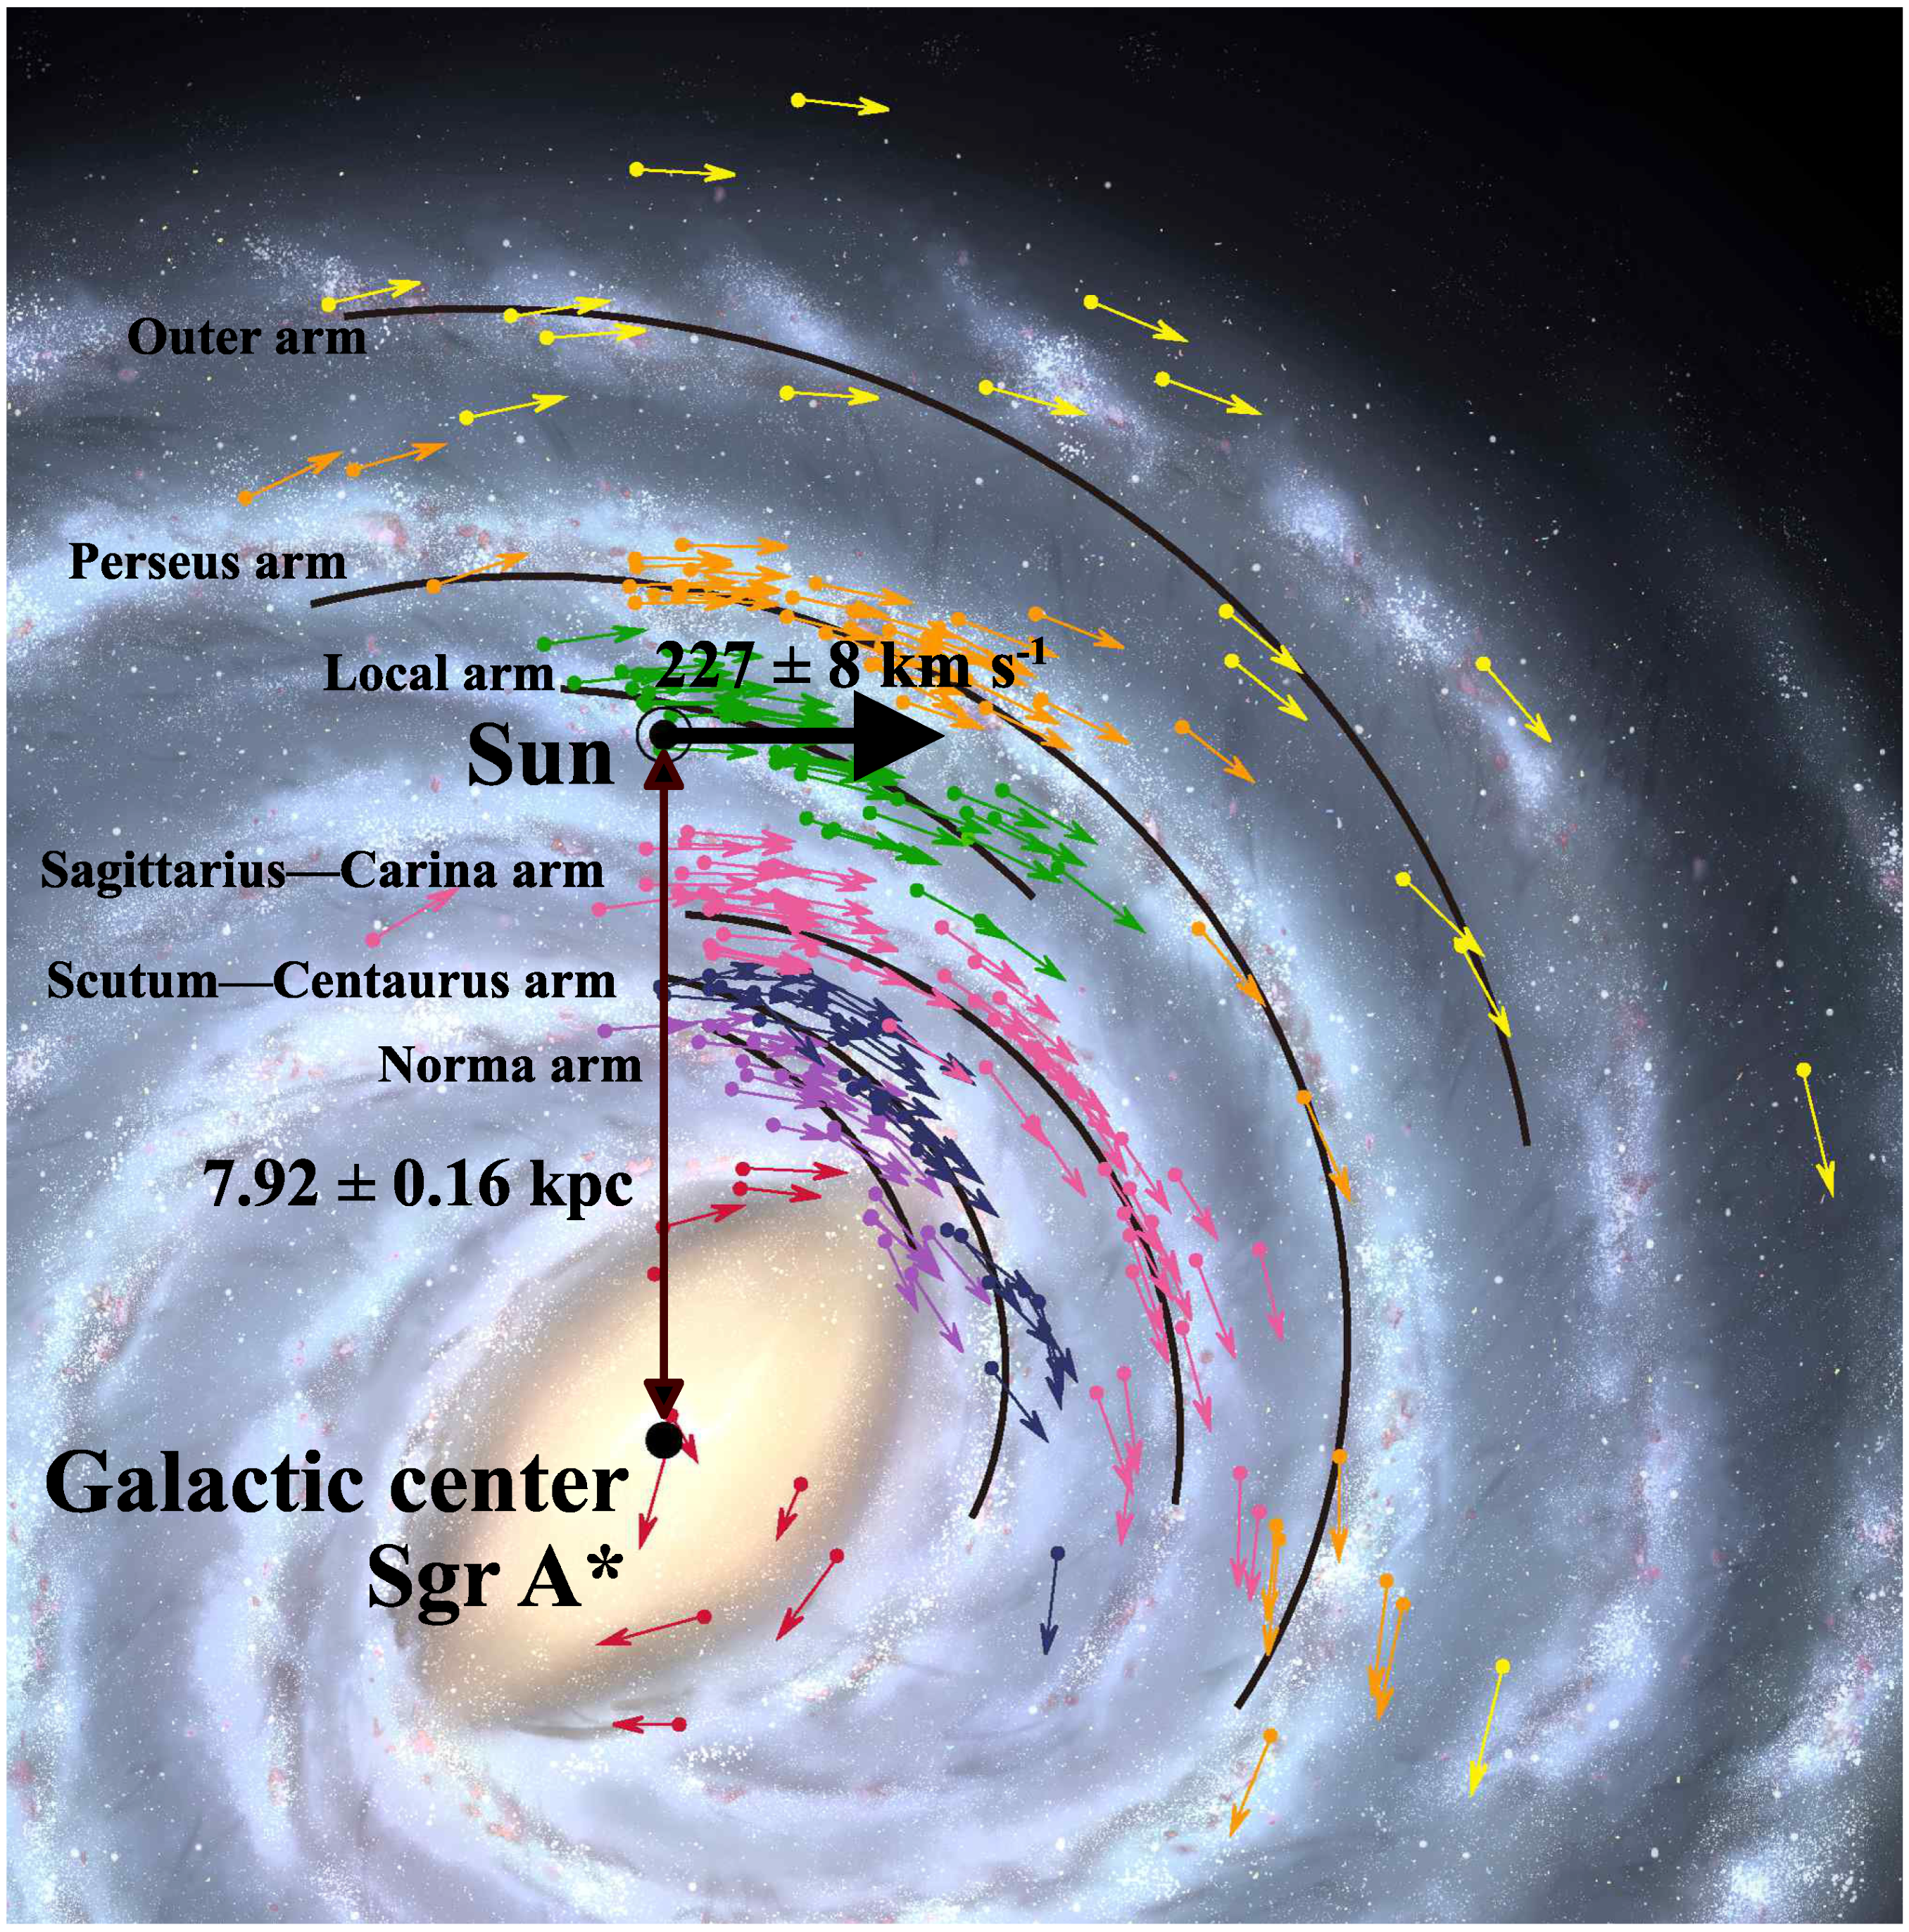
By combining the VERA catalog and other VLBI astrometric measurements such as the BeSSeL survey with VLBA, the Galactic fundamental parameters are estimated [8,9,10,12,13,14]. Figure 3 shows the distributions and proper motions of the Galactic maser sources located in high-mass star-forming regions, which trace the structure of the Galactic spiral arms and the bar as indicated by the best-fitted Galactic spiral arms [14]. A total of 224 sources are plotted mainly using VERA and BeSSel results, which are mostly concentrated in the northern hemisphere [10,14]. Proper motions of the Galactic maser sources suggest an almost constant rotation velocity as a function of the Galacto-centric distances of up to ∼15 kpc.
Table 1 briefly summarizes the history of Galactic VLBI astrometry measurements. As the number of target sources has increased by combining the results from these projects and other individual VLBI astrometry measurements, the uncertainties in the derived parameters have been improved statistically. As listed in Table 1, the latest results from the VLBI astrometry data include 224 sources, among which 99 sources were measured by VERA [10] while rest of the sources were taken from the VLBA BeSSeL project [14] and the other literature (including EVN and LBA). For the fitting to the Galactic rotation curve model, VERA [10] and BeSSeL [14] employed 189 and 147 maser sources, respectively, excluding outliers which significantly deviate from the Galactic rotation motion due to the Galactic bar (within inner <4 kpc regions) or their peculiar motions (>50 km s−1). Although these studies employed slightly different input datasets and models for the Galactic rotation curve and data analysis methods to determine R 0 and Ω as suggested by simulations [8,9], all the parameters are consistent within the mutual errors. More details of data analysis are presented in the first VERA catalog paper [10] and references therein.
The Galactic center distance R 0 based on Galactic-scale maser astrometry is consistent with those obtained from other methods. For instance, the Galactic center distance has also been determined from the infrared astrometry for stellar orbital motions around the Galactic center super-massive black hole Sgr A* [15,16,17], as listed in Table 2. These results provided R 0 = 8.275 ± 0.009 stat . ± 0.033 sys . kpc [17], or R 0 = 7.946 ± 0.050 stat . ± 0.032 sys . kpc [15] from the individual measurements, being in good agreement with VLBI astrometry results. The Galactic center distance by maser astrometry is also consistent with the distance to Sgr A* based on its parallax distance measured with VERA, being 8.5 1.1 + 1.5 kpc. (see later section for Sgr A* parallax). The consistency between the VLBI maser astrometry and other methods (stellar motion astrometry as well as Sgr A* parallax) suggests that Sgr A* is actually located at the dynamical center of the Galactic rotation. Table 2 summarizes the results for R 0 determinations discussed in the present paper.
Another key parameter of the Galaxy structure, the angular velocity of the Sun, Ω , can be measured independently from the proper motion of Sgr A* [18,19] through their long-term monitoring with VLBA for >20 years. More recently, VERA astrometry results for Sgr A* has improved the measurements by extrapolating the VLBA measurements [20]. Using the newly developed wide-band recording system, VERA could improve the sensitivity to detect continuum emission of Sgr A* (see later section for more detail). Similarly to the Galactic center, the results for Ω from both maser astrometry and that for Sgr A* are consistent with each other, as listed in Table 3.
The most important finding from the VLBI Galactic astrometry projects is to prove that the Galactic fundamental parameters are different from the previously known values recommended by the International Astronomical Union (IAU), R 0 = 8.5 kpc and Θ 0 = 220 km s−1 [21]. The latest VERA result provides R 0 = 7.92 ± 0.16 ± 0.3 kpc, which is 6% smaller than the IAU recommended value of 8.5 kpc. The value of Θ 0 ( = R 0 Ω V , where V is the Solar motion against the LSR toward the direction of the Galactic rotation) is estimated to be 227 km s−1, which is larger by 3% than that of the IAU recommended value. We note that in our analysis [10], we adopted V = 12.24 km s−1 for the Solar motion correction [22]. These Galactic fundamental parameters should be refined in the future studies on our Milky Way Galaxy.
Table 2. Comparison of Galactic center distance R 0 .
Method R 0 (kpc)Reference
VLBI astrometry of 189 maser sources 7.92 ± 0.16 stat . ± 0.3 sys . [10]
VLBI astrometry of 147 maser sources8.15 ± 0.15 [14]
VLBI astrometry of Sgr A* 8.5 1.1 + 1.5 [20]
Orbital motions of S0-2 around Sgr A* 7.946 ± 0.050 stat . ± 0.032 sys . [15]
Orbital motion of S2 around Sgr A* 8.275 ± 0.009 stat . ± 0.033 sys . [17]
Statistical error in the VERA catalog result [10] is estimated based on the Markov Chain Monte Carlo (MCMC) simulation. Systematic error is estimated as a combination of model dependency of 1% and sample dependency of 3% [9].
Table 3. Comparison of angular velocity of the Sun Ω .
Method Ω (km s−1 kpc−1)Reference
VLBI astrometry of 189 maser sources 30.17 ± 0.27 stat . ± 0.3 sys . [10]
VLBI astrometry of 147 maser sources30.32 ± 0.27 [14]
Proper motion of Sgr A* (VLBA+VERA)30.30 ± 0.02 [20]
Statistical error in the VERA catalog result [10] is estimated based on the MCMC simulation. Systematic error is dominated by sample dependency of 1%, while model dependency is relatively small and hence negligible here [8,9,14].

3.2. Comparison with Gaia

ESA’s Gaia mission, with its original mission life time of 5 yr, has been conducting massive astrometric observations of stars based on optical observations from space, revolutionizing our understanding of the Milky Way Galaxy. However, even in the era of Gaia, the VLBI astrometry still has a significance over the optical and/or infrared astrometry project in several aspects. The most important aspect is to enable distance and proper motion measurements for farther and more deeply embedded sources in the Galactic disk, molecular clouds, and circumstellar envelopes thanks to the lower extinction by interstellar dust in the radio wavelengths. Also important is that targets of VLBI astrometry is non-main-sequence stars (star-forming regions or old stars such as AGB stars). Here, we compare the VLBI and Gaia results, and briefly discuss how the VLBI astrometry project like VERA is still complementary to optical and infrared astrometry projects in the future.
The recent data, Gaia DR3, was published in 2022 [23], and provided astrometric results such as parallaxes and proper motions for ∼2 billion stars. Drimmel et al. (2023) [24] attempted to extract the spiral structure of the Milky Way using the distribution of OB stars as well as RGB (Red Giant Branch) stars (see their Figures 12 and 14). In the analyses based on the OB stars, spiral structures were traced within 4 kpc from the Sun, where three distinct arms, namely, Sagittarius Arm, Local Arm, and Perseus Arm (in order from the inside of the Milky Way), are traced in the distribution of OB stars. The locations of the spiral arms match well with those obtained from VLBI astrometry. On the other hand, it is difficult to trace more distant regions beyond 4 kpc using OB stars, because the number of OB stars is limited and also because the bluer part of the optical spectrum, in which OB stars are bright, is subject to strong interstellar absorption in the galactic plane.
RGB stars can be used to explore more distant regions than OB stars, since they are as bright as OB stars in terms of absolute luminosities but less affected by the interstellar absorption when observed in red, in which they are much brighter than OB stars. Using RGB star distributions, Drimmel et al. (2023) [24] traced the Galaxy structure up to about 10 kpc from the Sun. However, RGB stars are an old population, and the spiral arm structure is not preserved well due to increase in random motion with stellar ages. In fact, the distribution of RGB stars appears relatively smooth: while the excess of stellar density due to the Sagittarius arm has been detected, further details of the spiral structure beyond that remains unclear even with Gaia.
Comparison of Gaia and VLBI astrometry results highlights the advantages and disadvantages of the two. As VLBI observes maser sources in star-forming regions at radio frequency, it allows us to conduct astrometry of young populations through the galactic plane and to explore spiral structures on a Galactic scale. On the other hand, Gaia is far superior in the number of stars that are observed, and hence Gaia has overwhelming advantage in research topics that requires high statistical accuracy and/or investigations of detailed structures. In the meantime, we emphasize that VLBI and Gaia are not simply competing in Galaxy-scale astrometry, but they are complementary to each other. In fact, stars traced by Gaia are collisionless systems while gaseous clouds traced by VLBI are collisional. Hence, their responses to the Galactic potential are different, and in order to obtain the complete picture of Galactic dynamics, the combination of both is essential.
In addition to the Galaxy-scale structure, it is also interesting to compare astrometric results of individual objects for which measurements are available with both VLBI and Gaia (such as late-type stars as well as radio-emitting young stars). These objects provide us good opportunities to confirm their reliability and calibration (if necessary) of astrometric results through mutual comparison between Gaia and VLBI. Some example cases will be discussed in more detail in a later section, which focuses on the results for late-type stars.

3.3. Star-Formation Processes

It has been recognized that maser emission from various molecules, such as H2O, CH3OH, OH, and rarely SiO, are detected in both low- and high-mass YSOs, as recently summarized in the IAU Symposium on Cosmic Masers [25]. Thanks to extremely high spatial resolution of VLBI, one can measure three-dimensional velocity fields traced by compact maser emission (features) around newly born YSOs through their radial velocities along the line-of-sight and proper motions in the sky plane. In particular, the 22 GHz H2O maser is known to be the brightest among these known maser lines. The 22 GHz H2O masers are mostly excited in shocked regions caused by interaction between high velocity outflows and ambient dense gas. Their proper motion directions after subtracting average motions (i.e., Galactic rotation and systemic motion of the target YSOs) agree well with the outflow axis, as demonstrated in references below. Thus, the H2O masers are widely used for VLBI monitoring to reveal dynamics of molecular outflows.
Using VERA, absolute astrometry results allow us to register the maser maps with those of other tracers in different wavelengths/instruments, which is essential to identify the powering source of the masers and its basic properties. Furthermore, the parallax distances measured with VERA can constrain accurate proper motions of maser features and dynamical properties of the outflow without any uncertainties in the assumed distances. For example, the H2O maser observations in high-mass YSOs with VERA have revealed a rotation motion of the high velocity collimated jet in S235AB-MIR [26], expansion of the radio jet with precession motion in a high-mass protobinary system G35.20−0.74N [27], episodic mass ejection events in an extremely high velocity jet in G353.273+0.641 [28], and propagation of bow-shocks driven by episodic outflow ejection in S255 IR NIRS3 [29] and AFGL5142 MM1 [30].
In the last decade, time-variable maser emissions have become powerful tools to investigate episodic mass accretion and ejection events in high-mass YSOs. As central high-mass YSOs accrete their masses from surrounding circumstellar disks, their accretion luminosities suddenly increase by an order of magnitude or more [31], which is called an accretion burst event. Observationally, accretion burst events have been confirmed through millimeter continuum flare in NGC6334I-MM1 [32] and near-infrared flare in S255 IR NIRS3 [33]. Such accretion events could be recognized prior to these continuum flares through the sudden increase in the flux densities of the 6.7 GHz CH3OH masers, i.e., methanol maser flare, in high-mass YSO S255 IR NIRS3 [34] and NGC6334I-MM1 [35], which are excited by infrared photons of high-mass YSOs with increased accretion luminosities.
In addition, mass accretion burst events are sometimes followed by outflow ejection in order to extract excess angular momenta from the accreted matters. In fact, S255 IR NIRS3 shows flux increase and expansion motion of the radio jet initiated 13 months after the accretion event [36]. These outflow ejection events newly produce shocked regions and result in the flux increase in the H2O maser emission (water maser flare). With VLBI monitoring like VERA, one can trace flux variation of the maser features, identify the location of the water maser flare, and measure the outflow velocity through proper motion measurements. In the case of proto-typical accretion events in S255 IR NIRS3 [37] and NGC6334-MM1 [38], monitoring observations with VERA revealed that the 22 GHz H2O maser emissions are located in the outflow lobes and that they show flux increases ∼2 yr after the accretion events. This would suggest an excitation mechanism of the H2O masers affected by increased radiation of the central YSOs propagating through newly produced outflow cavities in the mass accretion and ejection events [39].
The variability of the H2O masers have been recognized from the beginning of its discoveries in early 1970s via single-dish monitoring observations. One of the most extreme cases is known as the super maser flare identified in the bright(est) H2O masers in Orion KL as reported in [40,41], and references therein, and W49N in [42], and references therein, and observed with VERA. Some of these flares show repeatability and possible periodicity, i.e., 13 yrs in the case of Orion KL [40,41,43]. Monitoring observations with VERA confirm that the positions of super maser flares are identified at the interacting region of the outflows and that they are located at the same positions in the multiple events [40,41,42,43]. Because the detailed mechanisms of super maser flare events are still unclear, further monitoring observations with VERA of the H2O maser sources are being continued.

4. Astrometry of SgrA*

4.1. Parallax Measurement

Direct measurement of the distance to the galactic center, Sgr A*, is one of the most important targets in the VERA project, though it is most challenging to measure its parallax due to its low elevation and weak calibrator sources. As described in Section 3, recent VLBI astrometry using maser-emitting star-forming regions and infrared astrometric observations of nearby Stars around Sgr A* have revealed the distances to the galactic center and the galactic rotation velocities that are largely consistent (see Table 2). However, when comparing all recent R 0 estimations—including three based on stellar orbits near Sgr A*—a discrepancy of about 0.4 kpc still remains, corresponding to roughly 4% uncertainty, which motivates the need for independent measurements of Sgr A* distance. Among many approaches to measure the distance, the most direct one is to measure Sgr A’s parallax.
Since it is an important object for VERA, we have been observing Sgr A* since the early phase of the operation [20]. However, the detectability of Sgr A* becomes low over long baselines because of interstellar scattering. Using a conventional digital back-end system at a rate of 1Gbps, fringe detection was only viable at baselines shorter than 1300 km. To overcome this issue, we have developed a new wide-band digital back-end and software correlator system which can handle a bandwidth of 2048 MHz. The system significantly improves performance, allowing fringes to be detected at up to 1800 km and increasing positional accuracy by 40%.
Between 2014 and 2020, a total of 26 VLBI observation sessions targeting Sgr A* were carried out using VERA. The relative position of Sgr A* is measured with respect to the background reference source J1745-2820, being seperated by 0.67 degrees. Sgr A* showed a peak brightness between 300 and 700 mJy/beam and exhibited a symmetric structure well modeled by a single Gaussian, consistent with past results. J1745-2820 was significantly fainter (20–80 mJy/beam) and could not be imaged via self-calibration, but phase-referencing using Sgr A* enabled its mapping as a compact, point-like source. The lower elevation of both sources led to phase errors that reduced the dynamic range of the phase-referenced image.
Using position measurements of J1745-2820 relative to Sgr A* from 2014 to 2020, and by fixing the parallax at 125 μas (8 kpc), proper motion was determined as (−3.136 ± 0.007, −5.555 ± 0.020) mas/year in right ascension and declination. After removing this proper motion from the original position measurements, a clear sinusoidal parallax signal was detected in RA with a one-year period, marking the first clear detection of Sgr A*’s parallax using this dataset (see Figure 4). The fitted parallax of 0.117 ± 0.017 mas translates to a Galacto-centric distance of approximately 8.5 kpc, which aligns well with recent estimates. We note, however, that a relative error of 15% is higher than that of other contemporary measurements. We expect that adding 150 more epochs over five years would reduce the parallax error to around 5.5%, since addition of 150 epochs provides a parallax error improvement by a factor of 176 / 26 under an assumption of random error.

4.2. Peculiar Motions

The proper motion of Sgr A* relative to J1745-2820 was measured using the VLBA from 1995 to 2013, and then measured again with VERA from 2014 to 2020 [18,19,20]. Both measurements are in excellent agreement, differing by only a few μas per year, which is statistically insignificant. By combining these datasets—after correcting for positional offsets between the two studies possibly due to the correlator model—a more precise estimate of the proper motion was obtained. The final values, (−3.133, −5.575) mas/y in right ascension and declination, show stable motion over multiple decades. After converting them to Galactic coordinates, the motion in Galactic longitude is found to be Ω = 30.30 km s−1 kpc−1. We note that this reflects a sum of the Galactic rotation at LSR Θ 0 and Sun’s peculiar motion toward the Galactic rotation V , and is the direct observable from Sgr A*’s proper motion. As discussed in previous section, this is consistent with the angular velocity based on Galaxy-scale astrometry (see Table 3).
When both Galactic rotation and Solar vertical motion are subtracted, the residual peculiar motion of Sgr A* is found to be less than 4 km/s, with no significant acceleration detected. Fitting a second-order model to the positional data confirms this, showing accelerations consistent with zero. Overall, the results reinforce the conclusion that Sgr A* remains extremely close to the dynamical center of the Milky Way, with no substantial motion and acceleration. Practically zero acceleration measured with VLBI can also put constraints on the mass and distance of a hypothetical IMBH (intermediate-mass black hole). With Sgr A*’s mass of 4 × 10⁶ M , IMBHs heavier than 30,000 M at distances of 0.1, and ones heavier than 3000 M at 0.01 parsecs are ruled out, respectively.

5. VLBI Astrometry of Pulsating AGB Stars

5.1. Period–Luminosity Relation of Mira Variables

The AGB phase is considered as one of the latest evolutionary stages of stars whose initial masses lie between 0.8 and 10 M (e.g., [44]). They have thick circumstellar dust layers and exhibit a wide range of pulsation periods, with the shortest periods being around 100 days and occasionally reaching 3000 days (e.g., [45]). There is a well-known relation between the pulsation period ( log P ) and the apparent magnitude in the infrared K band ( m K ) for Mira variables in the Large Magellanic Cloud (LMC), commonly referred to as the period–magnitude relation (e.g., [46,47]). Since metalicity of stars differs between the LMC and our Galaxy, it is important to study if the same relation holds for AGB stars in our Galaxy. Once its absolute magnitude (i.e., M K ) is calibrated well, this relationship ( log P M K relation) can be used for distance measurement of the AGB stars.
To establish the Period–Luminosity relation of AGB stars in our Galaxy, we have conducted phase-referencing VLBI observations of 22 GHz H2O masers toward Galactic Mira and semi-regular (SR) variables over the past decade. We have measured the annual parallaxes of more than 30 AGB stars using VERA (e.g., [10,48]), and their absolute magnitudes are shown in Figure 5 with respect to their pulsation period. Filled circles in the figure indicate Mira variables, while open circles are SR variables (SRa, SRb, and SRc). The solid line in the figure shows our fitting result of the Period–Luminosity relation, with M K = 3.52 log P + ( 1.09 ± 0.14 ) [49]. Here, we determined the absolute magnitude of the relation (i.e., y-intercept) while its slope is fixed at −3.52 as was determined by Ita et al. [47]. The two dotted-lines in the figure (with labels of C and C’) indicate relations corresponding to pulsating stars in the fundamental and first overtone modes, respectively, in Ita et al. [47]. We note that in our fitting, NML Cyg was excluded, as the source is not classified as a Mira or SRa star. See Nakagawa et al. [49] for more details.
Astrometric VLBI observations provide spatial distribution and kinematics of circumstellar masers of AGB stars, too. In Figure 6, we present distributions and kinematics of circumstellar H2O masers associated to a semi-regular (SR) variable S Crt (left) and Mira variable T Lep (right) [50,51]. The size of the H2O maser distribution in S Crt is approximately 10 au, which is about one-third of that in T Lep (∼30 au). T Lep was observed with the Very Large Telescope Interferometer (VLTI) at J-, H-, and K-bands, and the image and size of the central star with its surrounding shell were obtained [52]. The infrared image of T-Lep [52] is overlaid in the right panel at the estimated position of the central star. Both results suggest anisotropic expansions of H2O masers around the AGB stars.

5.2. Single-Dish Monitoring of AGB Stars
Using VERA stations (mainly Iriki station operated by Kagoshima University) as a single-dish radio telescope, we have conducted flux-monitor observations of the H2O and SiO masers to obtain their spectral profiles and trace their time variability. As many OH/IR stars lack reported pulsation periods in the existing literature or databases due to their heavy dust obscuration, we determine the pulsation periods by ourselves based on this single-dish maser monitoring.
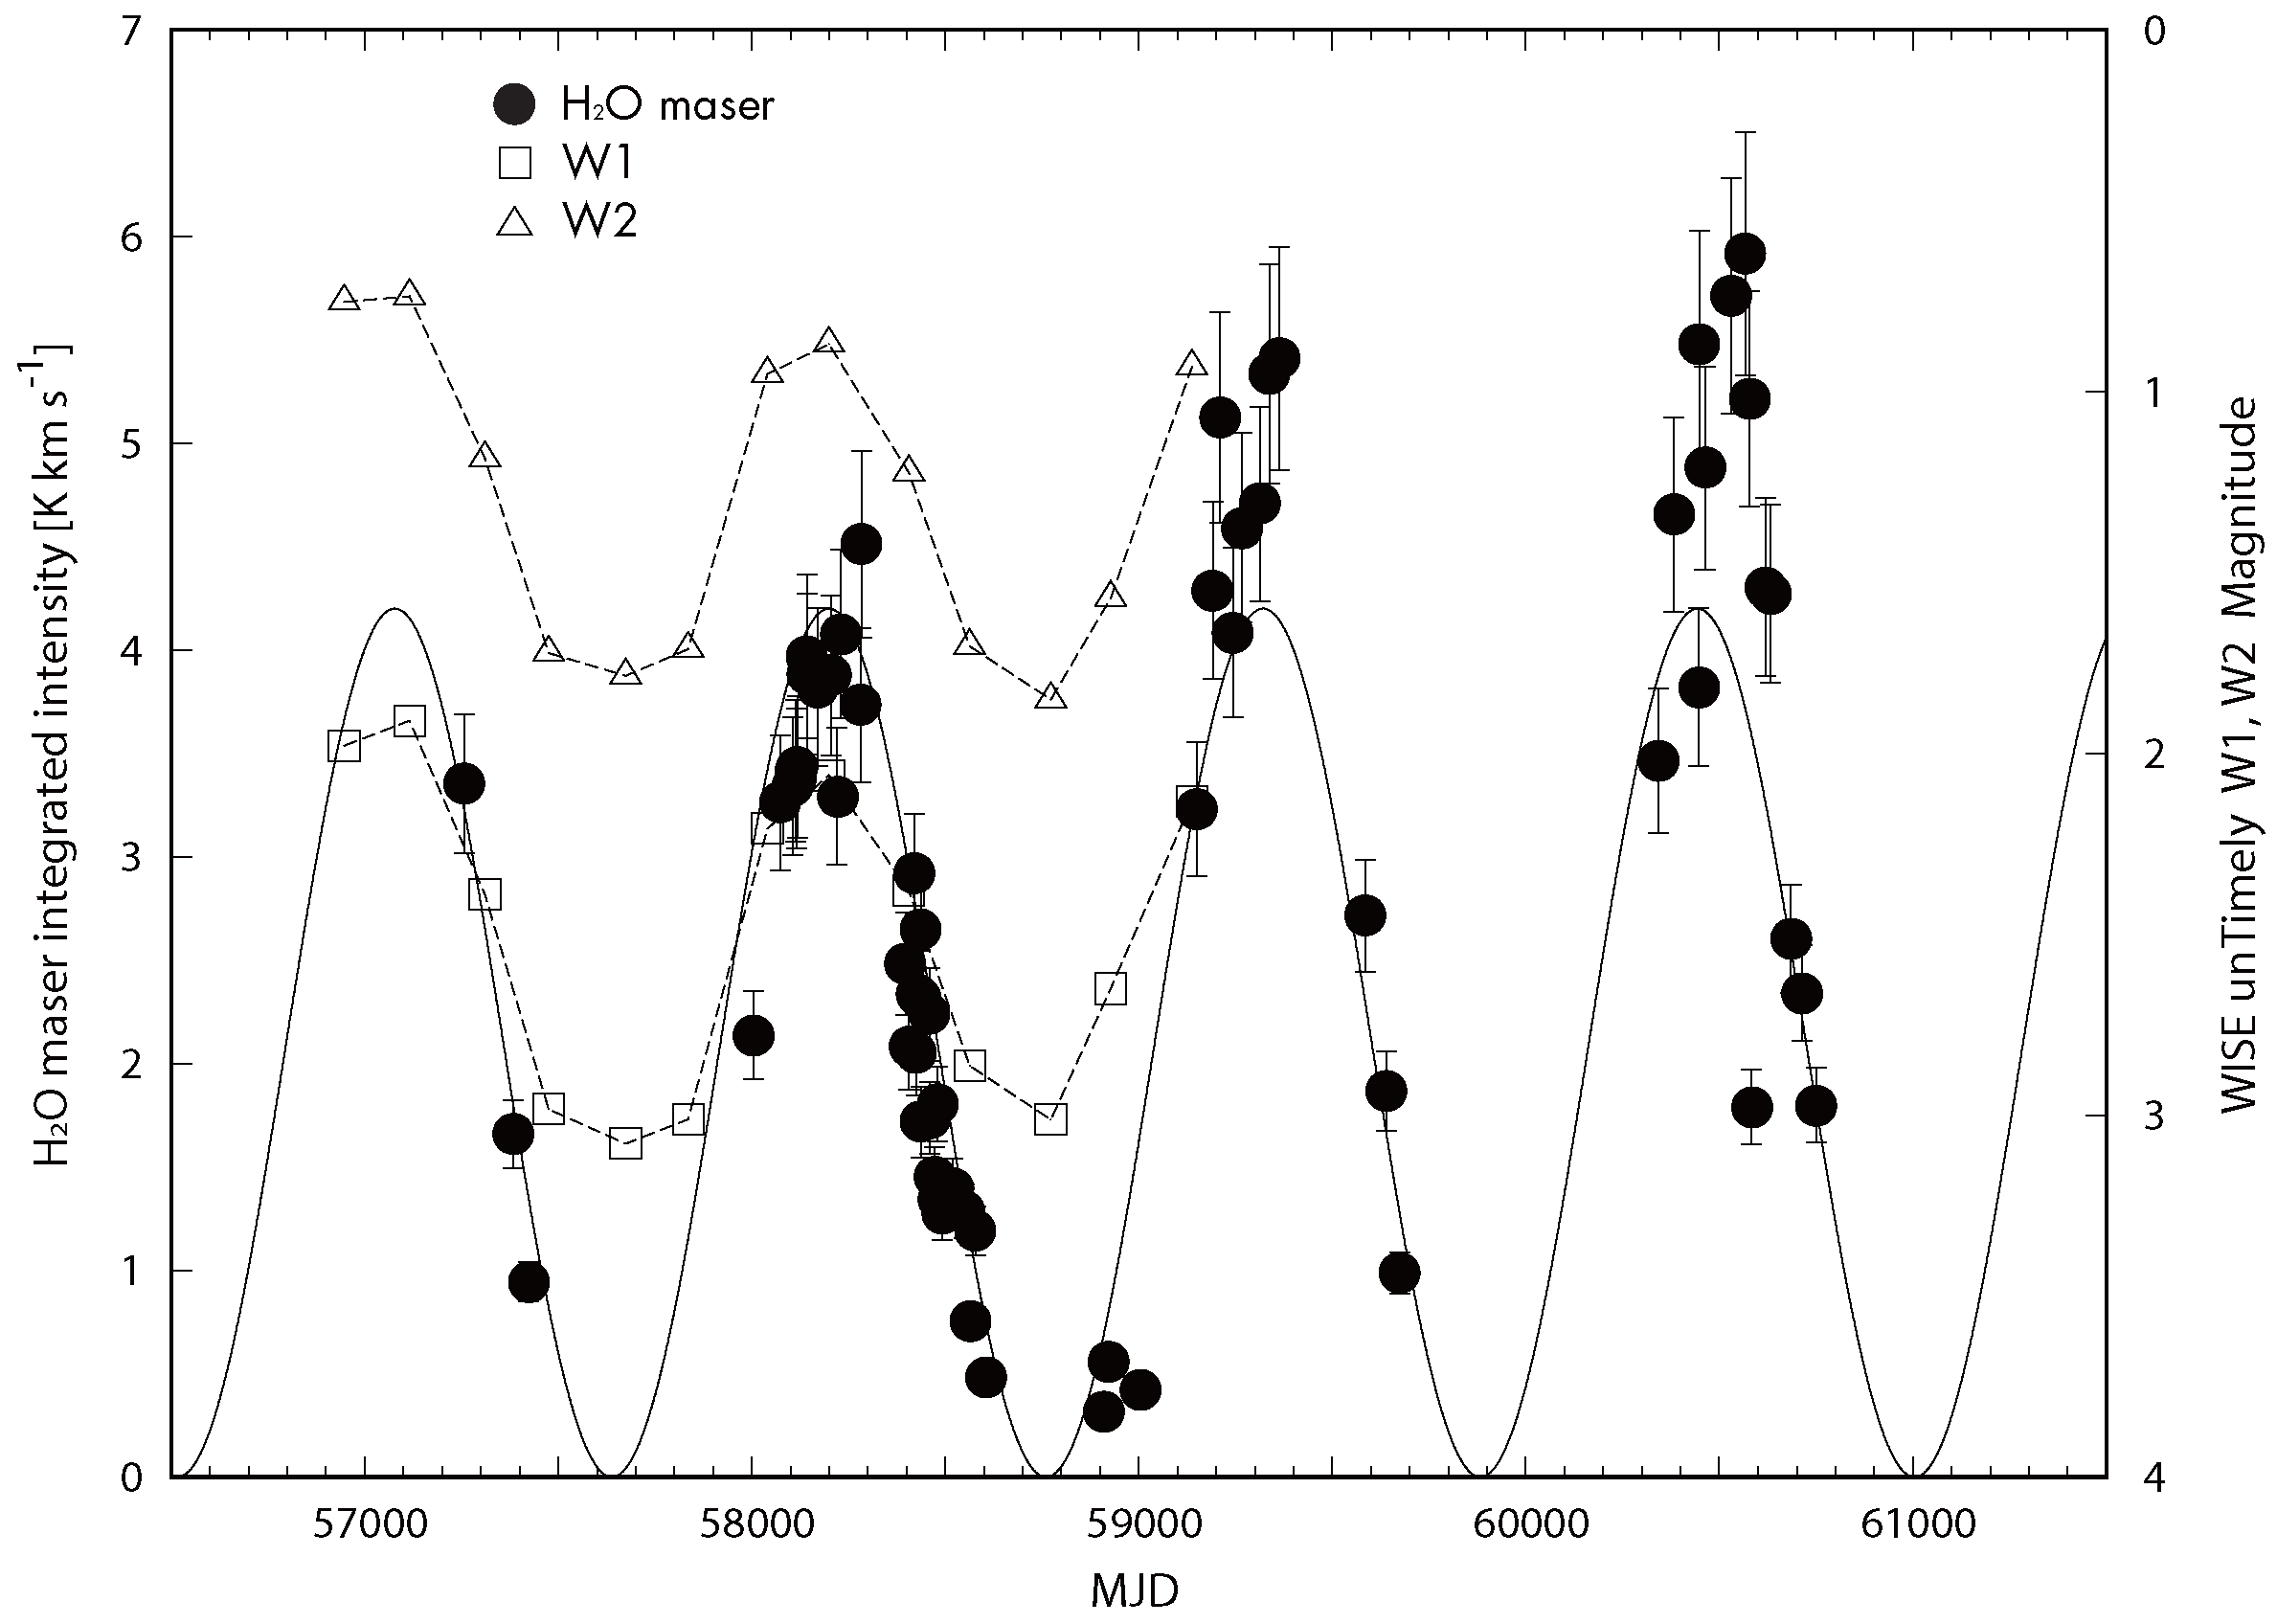
Observations are typically performed at monthly intervals, with an integration time long enough to achieve a noise level below 1 Jy. Typically, an IF bandwidth of 32 MHz is divided into 1024 channels, resulting in a frequency resolution of 31.25 kHz. This corresponds to velocity resolutions of 0.42 km s−1 at 22 GHz and 0.21 km s−1 at 43 GHz. To evaluate the activity of circumstellar masers, we calculate the integrated intensity in units of K km s−1, summing all the components of the maser in the velocity range where emission is detected. This integrated intensity is then used to estimate the stellar pulsation period. Figure 7 shows multi-band light curves of an OH/IR star NSV 17351 obtained from our monitoring observations. Filled circles indicate integrated intensities of H2O maser obtained at 22 GHz. A pulsation period of 1122 ± 24 days was obtained for this source [53], which is presented with a solid curve.
The Wide-Field Infrared Survey Explorer (WISE) performed an all-sky survey in four mid-infrared bands, W1 (3.35 μm), W2 (4.60 μm), W3 (11.56 μm), and W4 (22.09 μm) [54], and the NEOWISE mission extension (e.g., [55]) offers a time-baseline longer than 12.5 years. The release of the unTimely catalog [56] offers time series magnitudes in W1 and W2 bands. Light curves of NSV 17351 in unTimely W1 and W2 bands are also shown in Figure 7. NSV 17351 continued to show a regular periodic variation, and the unTimely W1 and W2 bands show time variations with the same phase with the maser emission. In the figure, the first and last H2O maser observations were on 23 August 2015 and 17 March 2025, spanning a period of 9.6 years. This demonstrates that the H2O-maser single-dish observations are valuable for tracing variability with a long period.
Figure 7. Multi-band light curves of NSV 17351. Filled circles represent integrated intensities of H2O maser obtained from single-dish observations at VERA Iriki station. A solid line is the best-fit model with a pulsation of 1122 ± 24 days [53]. Squares and triangles represent the W1 and W2 magnitudes from WISE unTimely catalog [56].
Galaxies 13 00120 g007

5.3. The Importance of VLBI Astrometry of AGB Stars in the Gaia Era

Gaia Data Release 3 (DR3; [23]) has provided an extensive set of astrometric data. To date, most VLBI-based parallax measurements have targeted star-forming regions, which are typically located close to the Galactic plane and heavily obscured by dust in molecular clouds. This obscuration makes it difficult to detect these sources in Gaia. In contrast, there are many AGB stars detected with Gaia, as they are bright in both optical and infrared wavelengths. The AGB stars with parallax measurements by both Gaia and VLBI serve as golden standards for cross-validating the parallaxes from these two independent measurements (note that the two observe different regions in AGB stars with different technics). For this purpose, we compiled parallaxes of 41 AGB stars determined from Gaia (DR2, DR3) and VLBI. The comparisons between VLBI and Gaia parallaxes confirm that they are broadly consistent within their error bars (see [57] for details), which makes an independent and important cross-check of the astrometric results of VLBI and Gaia.
Yet there are some populations of stars for which parallax measurement with Gaia is still a big challenge. OH/IR stars are one of such populations, as they are at very late stage of evolution and show extremely heavy dust obscuration. In this context, VLBI astrometry of dust-enshrouded OH/IR stars still serves as an effective method for determining their parallaxes, investigating the log P M K relation, and enhancing our understanding of the evolution from early to late stages of the AGB phase. As an example, we have observed an OH/IR star NSV 17351 and obtained a parallax of 0.247 ± 0.035 mas (a relative error of 14%). Our VLBI measurements are significantly more accurate than that of Gaia DR3, which is 0.088 ± 0.147 mas (a relative error of 167%). For such dust-enshrouded OH/IR stars, VLBI will remain a highly effective and indispensable method for measuring parallaxes.

6. Developments and Recent Upgrades

The VERA array has been in operation for about 20 yr since the early 2000’s, and it experienced several system upgrades, most notably in digital back-ends and the correlator. For instance, for the first 10 years, tape-based recorder DIR2000 was used for data acquisition, but now the system is outdated and replaced with HDD recorders to achieve higher sensitivity. Moreover, recent shift of observational focus from astrometry to EAVN imaging requires more flexibility in the setup of frequencies, polarizations, bandwidths, etc. To flexibly accommodate new observing modes, we have recently developed a new broad-band digital back-end system that supports four inputs (0–26 GHz) and a recording rate up to 32 Gbps, which are now in operation at all the VERA stations.

6.1. OCTAVE Digital Back-End

The new digital back-end system for VERA, referred to as OCTAVE family, consists of the following components.
  • OCTAD (OCTAve A/D Converter): High-speed RF (≤28 GHz) sampling A/D converter.
  • OCTAVIA (OCTAve VSI Adapter): VSI-H ⇔ 10 GigE (VDIF: VLBI Data Interchange Format) converter.
  • OCTADISK (OCTAve DISK drive): Disk recorder compliant with VDIF specifications.
  • VSREC (VDIF Software RECorder): software sender and receiver of VDIF packets.
  • OCTADISK2 (OCTAve DISK drive2): PC recorder using VSREC.
  • OCTACOR (OCTAve CORrelator): Gigabit real-time hardware correlator (VSI-H).
  • OCTACOR2 (OCTAve CORrelator 2): Software correlator system with the GICO3.
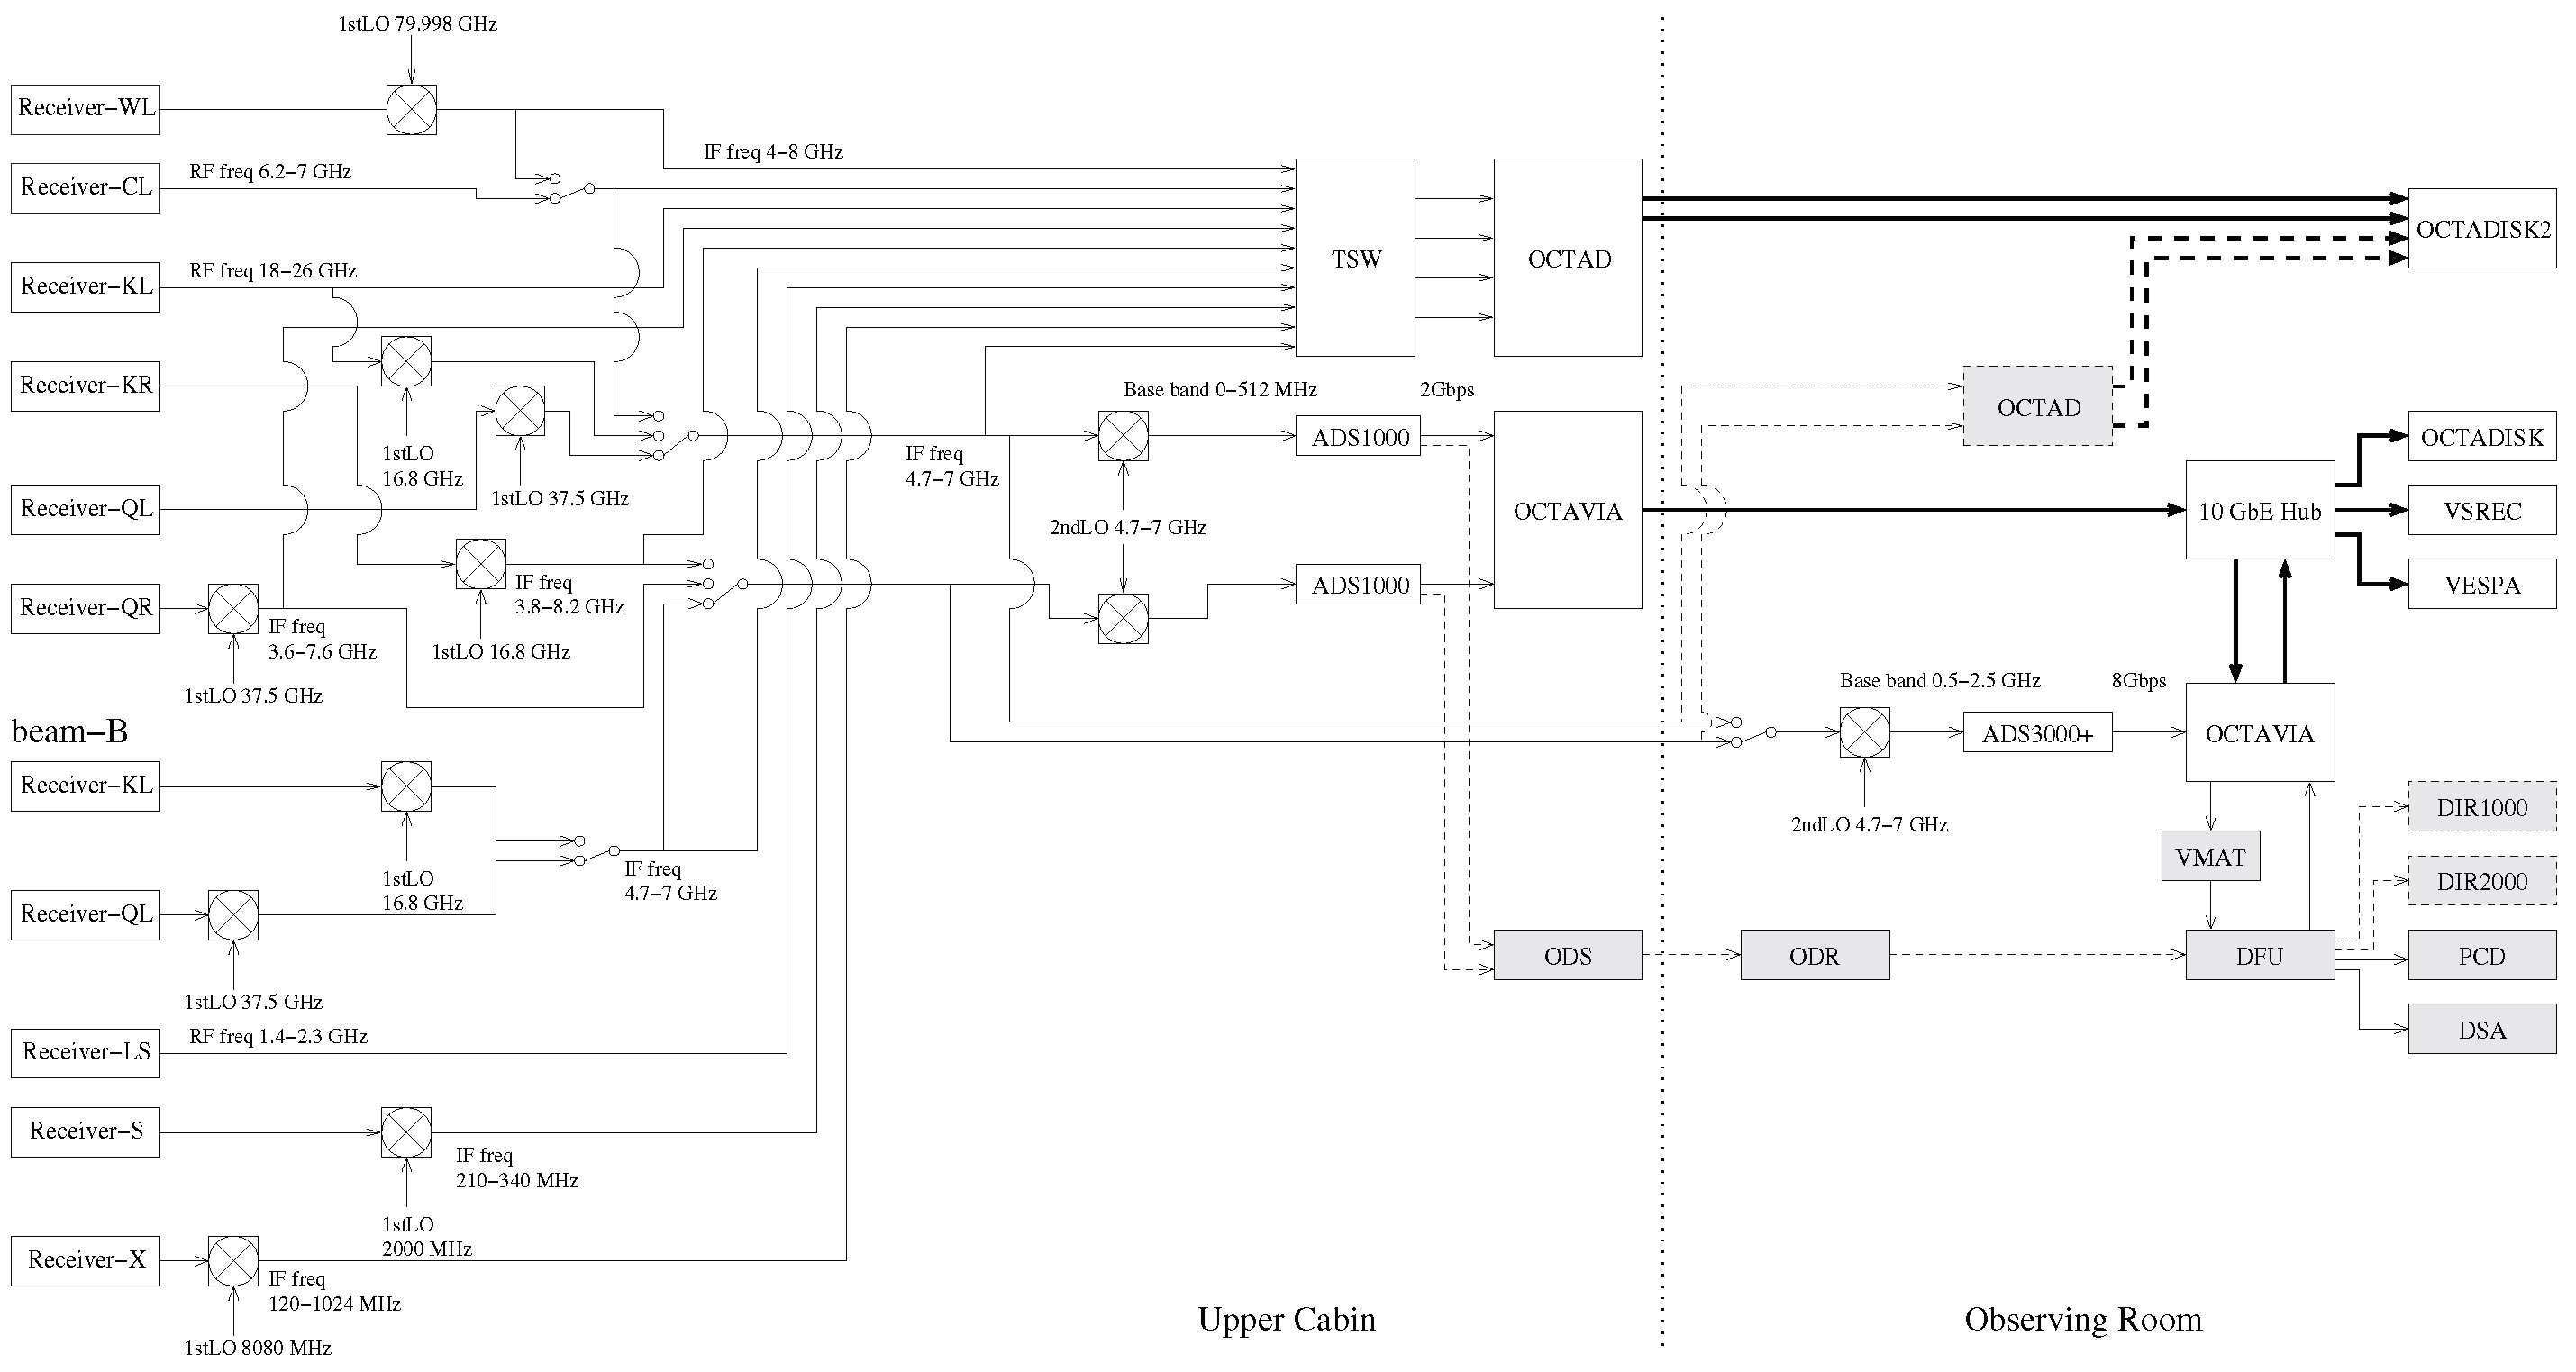
These instruments and software have been developed as a new terminal for OCTAVE (Optically ConnecTed Array for Vlbi Exploration), VERA, and JVN (Japanese VLBI Network) [58,59]. Figure 8 shows the block diagram of the VERA system from receivers to recorder including OCTAVE components, where one can see digital back-ends mostly located in the down stream of data flow (from center to right in the figure). Figure 9 shows exterior views of some OCTAVE components. Below, we provide short descriptions on each component.

6.1.1. OCTAD

OCTAD is a high-speed A/D converter capable of sampling an RF signal with a maximum bandwidth of 9216 (=8192 + 1024) MHz. It was originally designed and developed for a water-vapor radiometer to observe a frequency band covering from 18 GHz to 26 GHz. Such a wide band and direct RF digital sampling have a significant advantage of eliminating analog IF chain components including mixers, down-converters, and filters, making the system more simple and stable. For the development of OCTAD, InP HBT A/D chips fabricated by NTT Electronics, or InP DHBT A/D chips by Hittite, are adopted.

6.1.2. OCTAVIA

OCTAVIA is a converter between VSI-H and Ethernet packets based on the VDIF specifications with 10 GbE network. It was originally designed for OCTAVE array as well as data buffer for Korea–Japan Joint VLBI Correlator (KJJVC), which is in operation at KASI, with a data rate up to 8192 Mbps. In case of e-VLBI usage, it supports variable bit rate transfer control automatically.

6.1.3. OCTADISK/OCTADISK2/VSREC

OCTADISK was originally designed and developed as the data buffer with recording capability. At the initial phase of development in 2006, the maximum data rate was 4096 Mbps, and in 2009, a minor modifcation was conducted to use it as a new recorder for VERA and JVN. For VERA’s dual-beam operation, its data rate was slightly increased to 4608 Mbps covering three streams (≤ 512 + 2048 + 2048 Mbps), so that one can allocate one narrow-band IF to a maser source and two broad-band IFs to a continuum source, simultaneously.
VSREC is a software recorder with VDIF software libraries (VDIF 1.1.1). OCTADISK2 is a recording and playback system utilizing COTS-based servers, developed based on technologies such as VSREC. In addition to the standard recording and playback functions, OCTADISK2 supports RTCP (Real-time Transport Protocol) to connect and operate OCTAVIAs. It can accept data streams through four 10 GbE ports at a rate of 32,768 Mbps. The recorded data are stored in a RAID disk array on the Standard Linux File system, which can be directly accessed by any software correlators compliant with VDIF specifications.

6.1.4. OCTACOR/OCTACOR2

OCTACOR is a three-station hardware XF correlator for real-time e-VLBI. This correlator system can process three pairs of 2048 Mbps data streams with a lag length of 256 bits. This correlator was developed from 2000, and it obtained the first fringes in 2002. It was subsequently used in Japan’s e-VLBI array OCTAVE until 2015.
OCTACOR2 is a software-based FX correlator. The correlator system is built based on the “GICO3” correlation software developed by NICT [60]. This correlator can accept various file-formats (K5-VSI, Mark5B, and VDIF). Because of its software-based nature, the system is flexible, and there is no hard upper limit on the number of spectral points, antennas, or output rate. The correlation speed is about 300 Mbps in case of processing eight-station data recorded at 1024 Mbps using a 2048-point FFT (Xeon, 3.47 GHz dual processor). Note that the OCTACOR system is not in use for VERA’s regular operation, but used as a e-VLBI correlator on an experimental basis.

6.2. Broad-Band Data Streams in VERA

As shown in a block diagram of the VERA back-end system (Figure 8), VERA has two main streams of broad-band data: the one with conventional ADS1000 and/or ADS3000+ formatters developed by NICT [61,62], and the other with the newly developed OCTAD system developed by NAOJ. In the conventional data stream, the RCP and LCP RF signals received by the dual-beam receivers are converted to IF signals of 4.7–7 GHz. The receiver system was upgraded in 2019 for broad-band dual-polarized observations at K- and Q-bands, and since then, full polarization observations are available.
In the conventional data stream, the IF signals are down-converted again to base-band streams, sampled using ADS1000 and/or ADS3000+ digizers. At the initial system of VERA using ADS1000, signals were transferred via ODS (Optical Data Sender) and ODR (Optical Data Receiver) using the ATM protocol, and filtered by DFU before being recorded at a maximum recording rate of 1 Gbps. Introduction of the second-generation digitizer ADS3000+ makes the maximum data rate up to 12 Gbps. Later, the OCTAVIA system was introduced to convert VSI-H format to VDIF. The system is installed in the RX cabin on the telescopes, transferring the data via optical fibers to recorders such as OCTADISK and VSREC (see Figure 8). In the new data stream, OCTAD, installed in the RX cabin of VERA telescopes, handles K-band RF/IF signals and Q-band IF signals, sampling and converting them to data streams for 16 Gbps recording using OCTADISK2.

6.3. Correlators

VERA correlation processing was performed at Mitaka Correlation Center from April 2003 to March 2015 using the VSOP-FX Hardware Correlator, which was originally designed for VSOP mission [7]. This hardware correlator was developed to process data at 128 Mbps (32 Msps × 2 ch × 2 bit), which was the main recording speed at that time, and was capable of 10-station data inputs to process VSOP/HALCA satellite and ground station data. The correlator had been in operation since 1994.
For adapting the VSOP correlator to VERA, we developed and implemented peripheral converters (VSI-I/F, COR-I/F) to enable correlation processing of 1 Gbps data. In this modified system, we first converted the DIR2000 (a tape-based recorder) output to the VSI format, and then converted again the VSI data to the VSOP correlator’s input format. Later, around 2015, DIR2000 tape recorders were replaced with OCTADISK, a recorder based on FPGA and HDDs, and OCTAVIA, a transmission device which can handle data in the VSI-H and VDIF format. In parallel with the development of new recording devices using HDDs and COTS-based servers, the performance of digital signal processing including A/D converters has been improved and the recording rate has substantially increased up to 2–16 Gbps data. This led to the development of a new software-based correlator.
Our software correlator was based on the GICO3 system developed in collaboration with NICT. Ancillary software such as delay tracking, UVW calculation, bunching processing, and FITS conversion were imported and extended from the VSOP FX Correlator software to Linux-based software. Development of the software correlator initiated in 2006, and regular operation became possible in April 2015, with the relocation of the correlation center from Mitaka to Mizusawa (see Figure 9). Currently, the Mizusawa Correlation Center operates approximately 40 servers, including both correlation and file servers The new software correlator, which uses Core i7 processors based on Haswell and Skylake architectures, can typically handle 16 stations (depending on the number of servers), with a capability of up to four M FFT points. Correlation processing of 1–16 Gbps data takes approximately 2–10 times longer than the recording time, when 4–8 servers are used.
Software correlation processing is mainly CPU-based. However, as the VERA network has gradually developed into the EAVN network, the number of possible observation modes (i.e., dual polarization, and simultaneous K/Q reception) and the frequency bandwidths have increased, requiring better computation performance in software-based correlation. To meet such requirements of improved performance, development of a GPU-based software correlator was started in 2015, and its regular operation began in 2023. This GPU correlator, which is implemented using NVIDIA GTX 2060 or 2080 graphics cards, enables processing approximately 4–20 times faster than conventional CPU-based correlators. Currently, more than 70% of VERA observations are in wide-band mode (i.e., 8–16 Gbps including both polarizations), and/or in high-spectral-resolution mode (maser, SETI, etc.), sometimes requiring up to 1–16 M-point FFT. These observations are now regularly processed by GPU software correlators using eight servers.

7. Future Direction

While continuing its regular operations, VERA has shifted its focus from astrometric observations to international collaborative observations within the framework of EAVN (East Asian VLBI Network) [63,64,65]. The EAVN array consists of more than ten radio telescopes across Japan, South Korea, and China, and its observing time, primarily in the C-, K-, and Q-bands, is open to international community. As a part of EAVN, VERA’s four stations play a significant role because of their unique geographic location on the eastern edge of the array, being crucial for securing long East–West baselines. In addition to VERA stations, the Nobeyama 45 m radio telescope of NAOJ, and 30 m class radio telescopes operated by Yamaguchi University and Ibaraki University, actively contribute to the EAVN observations.
EAVN is still in an expansion phase. For instance, the TNRT 40-m telescope constructed by NARIT in Thailand is expected to join soon. Some more additions of new telescopes are also anticipated in China and South Korea. Astronomy research with EAVN centers on leveraging the array’s high imaging capabilities, which becomes available thanks to the relatively dense array configuration. One of the major areas of interest is imaging and monitoring Active Galactic Nuclei (AGN) and their jets. A prominent example of this is the observation of M87, an AGN source of high interest in the relevant field. One of the highlights from EAVN on this target is the detection of jet precession based on 20 year-long jet monitoring including EAVN [66]. EAVN has also made significant contributions to international multi-wavelength campaigns conducted in parallel with the Event Horizon Telescope (EHT) observations of M87 [67,68]. These studies determined its broad-band spectra [67], and detected flares in 2018 [68], demonstrating international importance of EAVN.
To ensure further advancement of VERA, continuation of development and upgrades is essential. The ongoing effort to expand its frequency bandwidth [69] should be sustained to improve sensitivity. Additionally, receiver developments for new frequency bands are on-going. An example of such developments is an 86 GHz receiver [70]. Its demonstration test already confirmed that an aperture efficiency of around 30% can be achieved with VERA telescopes. A cooled 86GHz receiver is now scheduled to be installed at Mizusawa station in late 2025, with deployment to other stations planned for subsequent years. Once VERA becomes capable of 86 GHz observations, a powerful network will be established in this band in conjunction with the Nobeyama 45 m telescope and Korea’s KVN (Korean VLBI Network). Then, EAVN, either independently or in collaboration with other array such as GMVA, is expected to produce major results in detailed observations of AGN jets. Furthermore, if an RX optics capable of simultaneous reception in the K/Q/W-bands is installed, simultaneous tri-band observations, similar to those conducted by KVN, will become possible, enhancing multi-wavelength observing capability. Other developments under consideration include bandwidth expansion in the C/X-band, and new receivers for S- and L-bands. These upgrades are expected to further enhance the performance of the VERA array and will lead to new scientific breakthroughs in next decades.

Author Contributions

M.H. contributed to Section 1, Section 2, Section 3.2 and Section 7. As the first author, M.H. is also responsible for organizing the paper and editing the draft. T.H. contributed to Section 3.1 and Section 3.3, T.O. to Section 4 and Section 6, and A.N. to Section 5. All authors have read and agreed to the published version of the manuscript.

Funding

This research was funded by the following grant: JSPS (Japan Society for the Promotion of Science) Grant-in Aid for Scientific Research (KAKENHI) 19KK0081 (M.H.).

Data Availability Statement

Astrometric data (parallaxes, proper motions etc.) used in the paper are available in the relevant references.

Conflicts of Interest

The authors declare no conflict of interest.

References

  1. Hara, T.; Okamoto, I.; Sasao, T. The Japanese VLBI project VERA (VLBI for the Earth rotation study and astrometry). In Vistas in Astronomy; Elsevier: Amsterdam, The Netherlands, 1988; Volume 31, pp. 647–652. [Google Scholar]
  2. Honma, M.; Kawaguchi, N.; Sasao, T. Science with VERA: VLBI exploration of radio astrometry. In Proceedings of the SPIE, Radio Telescopes, Munich, Germany, 27 March–1 April 2000; Volume 4015, pp. 624–631. [Google Scholar]
  3. Kawaguchi, N.; Sasao, T.; Manabe, S. Dual-beam VLBI techniques for precision astrometry of the VERA project. In Proceedings of the SPIE, Radio Telescopes, Munich, Germany, 27 March–1 April 2000; Volume 4015, pp. 544–551. [Google Scholar]
  4. Kobayashi, H.; Sasao, T.; Manabe, S.; Omodaka, T.; Kameya, O.; Shibata, K.M.; Miyaji, T.; Honma, M.; Tamura, Y.; Hirota, T.; et al. VERA: A New VLBI Instrument Free from the Atmosphere; Minh, Y.C., Ed.; Astronomical Society of the Pacific Conference Series; ASP: San Francisco, CA, USA, 2003; Volume 306, pp. 367–371. [Google Scholar]
  5. Honma, M.; Kijima, M.; Suda, H.; Kawaguchi, N.; Kobayashi, H.; Bushimata, T.; Shimizu, R.; Yoshimura, A.; Sasao, T.; Hirota, T.; et al. Dual-Beam Delay Calibration for VERA. Publ. Astron. Soc. Jpn. 2008, 60, 935. [Google Scholar] [CrossRef]
  6. Iguchi, S.; Kkurayama, T.; Kawaguchi, N.; Kawakami, K. Gigabit Digital Filter Bank: Digital Backend Subsystem in the VERA Data-Acquisition System. Publ. Astron. Soc. Jpn. 2005, 57, 259. [Google Scholar] [CrossRef]
  7. Shibata, K.M.; Kameno, S.; Inoue, M. Mitaka Correlator for the Space VLBI. In ASP Conference Series, IAU Colloquium 164; Zensus, J.A., Taylor, G.B., Wrobel, J.M., Eds.; Astronomical Society of the Pacific: San Francisco, CA, USA, 1998; Volume 144, 413p. [Google Scholar]
  8. Honma, M.; Nagayama, T.; Ando, K.; Bushimata, T.; Choi, Y.K.; Handa, T.; Hirota, T.; Imai, H.; Jike, T.; Kim, M.K.; et al. Fundamental Parameters of the Milky Way Galaxy Based on VLBI astrometry. Publ. Astron. Soc. Jpn. 2012, 64, 136. [Google Scholar] [CrossRef]
  9. Honma, M.; Nagayama, T.; Sakai, N. Determining dynamical parameters of the Milky Way Galaxy based on high-accuracy radio astrometry. Publ. Astron. Soc. Jpn. 2015, 67, 70. [Google Scholar] [CrossRef]
  10. Hirota, T. et al. [VERA Collaboration] The First VERA Astrometry Catalog. Publ. Astron. Soc. Jpn. 2020, 72, 50. [Google Scholar]
  11. Nagayama, T.; Kobayashi, H.; Hirota, T.; Honma, M.; Jike, T.; Kim, M.K.; Nakagawa, A.; Omodaka, T.; Oyama, T.; Sakai, D.; et al. Performance of VERA in 10 micro-arcsecond astrometry. Publ. Astron. Soc. Jpn. 2020, 72, 52. [Google Scholar] [CrossRef]
  12. Reid, M.J.; Menten, K.M.; Zheng, X.W.; Brunthaler, A.; Moscadelli, L.; Xu, Y.; Zhang, B.; Sato, M.; Honma, M.; Hirota, T.; et al. Trigonometric Parallaxes of Massive Star-Forming Regions. VI. Galactic Structure, Fundamental Parameters, and Noncircular Motions. Astrophys. J. 2009, 700, 137. [Google Scholar] [CrossRef]
  13. Reid, M.J.; Menten, K.M.; Brunthaler, A.; Zheng, X.W.; Dame, T.M.; Xu, Y.; Wu, Y.; Zhang, B.; Sanna, A.; Sato, M.; et al. Trigonometric Parallaxes of High Mass Star Forming Regions: The Structure and Kinematics of the Milky Way. Astrophys. J. 2014, 783, 130. [Google Scholar] [CrossRef]
  14. Reid, M.J.; Menten, K.M.; Brunthaler, A.; Zheng, X.W.; Dame, T.M.; Xu, Y.; Li, J.; Sakai, N.; Wu, Y.; Immer, K.; et al. Trigonometric Parallaxes of High-mass Star-forming Regions: Our View of the Milky Way. Astrophys. J. 2019, 885, 131. [Google Scholar] [CrossRef]
  15. Do, T.; Hees, A.; Ghez, A.; Martinez, G.D.; Chu, D.S.; Jia, S.; Sakai, S.; Lu, J.R.; Gautam, A.K.; O’Neil, K.K.; et al. Relativistic redshift of the star S0-2 orbiting the Galactic Center supermassive black hole. Science 2019, 365, 664. [Google Scholar] [CrossRef]
  16. Abuter, R. et al. [GRAVITY Collaboration] A geometric distance measurement to the Galactic center black hole with 0.3% uncertainty. Astron. Astrophys. 2019, 625, L10. [Google Scholar]
  17. Abuter, R. et al. [GRAVITY Collaboration] Improved GRAVITY astrometric accuracy from modeling optical aberrations. Astron. Astrophys. 2021, 647, A59. [Google Scholar]
  18. Reid, M.J.; Brunthaler, A. The Proper Motion of Sagittarius A*. II. The Mass of Sagittarius A*. Astrophys. J. 2004, 616, 872. [Google Scholar] [CrossRef]
  19. Reid, M.J.; Brunthaler, A. The Proper Motion of Sagittarius A*. III. The Case for a Supermassive Black Hole. Astrophys. J. 2020, 892, 39. [Google Scholar] [CrossRef]
  20. Oyama, T.; Nagayama, T.; Yamauchi, A.; Sakai, D.; Imai, H.; Honma, M.; Asakura, Y.; Hada, K.; Hagiwara, Y.; Hirota, T.; et al. Trigonometric parallax and proper motion of Sagittarius A* measured by VERA using the new broad-band back-end system OCTAVE-DAS. Publ. Astron. Soc. Jpn. 2024, 76, 163. [Google Scholar] [CrossRef]
  21. Kerr, F.J.; Lynden-Bell, D. Review of galactic constants. Mon. Not. R. Astron. Soc. 1986, 221, 1023. [Google Scholar] [CrossRef]
  22. Schönrich, R.; Binney, J.; Dehnen, W. Local kinematics and the local standard of rest. Mon. Not. R. Astron. Soc. 2010, 403, 1829. [Google Scholar] [CrossRef]
  23. Vallenari, A. et al. [Gaia Collaboration] Gaia Data Release 3. Summary of the content and survey properties. Astron. Astrophys. 2023, 674, A1. [Google Scholar]
  24. Drimmel, R. et al. [Gaia Collaboration] Gaia Data Release 3. Mapping the asymmetric disc of the Milky Way. Astron. Astrophys. 2023, 674, A37. [Google Scholar]
  25. Hirota, T.; Imai, H.; Menten, K.; Pihlström, Y. Cosmic Masers: Proper Motion Toward the Next-Generation Large Projects; Cambridge University Press: Cambridge, UK, 2024; Volume 380, pp. f1–f23. [Google Scholar]
  26. Burns, R.A.; Imai, H.; Handa, T.; Omodaka, T.; Nakagawa, A.; Nagayama, T.; Ueno, Y. A ’water spout’ maser jet in S235AB-MIR. Mon. Not. R. Astron. Soc. 2015, 453, 3163. [Google Scholar] [CrossRef]
  27. Beltrán, M.T.; Cesaroni, R.; Moscadelli, L.; Sánchez-Monge, Á.; Hirota, T.; Kumar, M.S.N. Binary system and jet precession and expansion in G35.20-0.74N. Astron. Astrophys. 2016, 593, A49. [Google Scholar] [CrossRef]
  28. Motogi, K.; Sorai, K.; Honma, M.; Hirota, T.; Hachisuka, K.; Niinuma, K.; Sugiyama, K.; Yonekua, Y.; Fujisawa, K. Accelerating a water maser face-on jet from a high mass young stellar object. Publ. Astron. Soc. Jpn. 2016, 68, 69. [Google Scholar] [CrossRef]
  29. Burns, R.A.; Handa, T.; Nagayama, T.; Sunada, K.; Omodaka, T. H2O masers in a jet-driven bow shock: Episodic ejection from a massive young stellar object. Mon. Not. R. Astron. Soc. 2016, 460, 283. [Google Scholar] [CrossRef]
  30. Burns, R.A.; Handa, T.; Imai, H.; Nagayama, T.; Omodaka, T.; Hirota, T.; Motogi, K.; van Langevelde, H.J.; Bann, W.A. Trigonometric distance and proper motions of H2O maser bowshocks in AFGL 5142. Mon. Not. R. Astron. Soc. 2017, 467, 2367. [Google Scholar]
  31. Meyer, D.M.-A.; Vorobyov, E.I.; Kuiper, R.; Kley, W. On the existence of accretion-driven bursts in massive star formation. Mon. Not. R. Astron. Soc. 2017, 464, L90. [Google Scholar] [CrossRef]
  32. Hunter, T.R.; Brogan, C.L.; MacLeod, G.; Cyganowski, C.J.; Chandler, C.J.; Chibueze, J.O.; Friesen, R.; Indebetouw, R.; Thesner, C.; Young, K.H. An Extraordinary Outburst in the Massive Protostellar System NGC6334I-MM1: Quadrupling of the Millimeter Continuum. Astrophys. J. Lett. 2017, 837, L29. [Google Scholar] [CrossRef]
  33. Caratti o Garatti, A.; Stecklum, B.; Garcia Lopez, R.; Eislöffel, J.; Ray, T.P.; Sanna, A.; Cesaroni, R.; Walmsley, C.M.; Oudmaijer, R.D.; de Wit, W.J.; et al. Disk-mediated accretion burst in a high-mass young stellar object. Nat. Phys. 2017, 13, 276. [Google Scholar] [CrossRef]
  34. Fujisawa, K.; Yonekura, Y.; Sugiyama, K.; Horiuchi, H.; Hayashi, T.; Hachisuka, K.; Matsumoto, N.; Niinuma, K. A flare of methanol maser in S255. Astron. Telegr. 2015, 8286, 1. [Google Scholar]
  35. Hunter, T.R.; Brogan, C.L.; MacLeod, G.C.; Cyganowski, C.J.; Chibueze, J.O.; Friesen, R.; Hirota, T.; Smits, D.P.; Chandler, C.J.; Indebetouw, R. The Extraordinary Outburst in the Massive Protostellar System NGC 6334I-MM1: Emergence of Strong 6.7 GHz Methanol Masers. Astrophys. J. 2018, 854, 170. [Google Scholar] [CrossRef]
  36. Cesaroni, R.; Moscadelli, L.; Caratti o Garatti, A.; Eislöffel, J.; Fedriani, R.; Neri, R.; Ray, T.; Sanna, A.; Stecklum, B. Radio outburst from a massive (proto)star. III. Unveiling the bipolarity of the radio jet from S255IR NIRS 3. Astron. Astrophys. 2024, 683, L15. [Google Scholar] [CrossRef]
  37. Hirota, T.; Cesaroni, R.; Moscadelli, L.; Sugiyama, K.; Burns, R.A.; Kim, J.; Sunada, K.; Yonekura, Y. Water maser variability in a high-mass YSO outburst. VERA and ALMA observations of S255 NIRS 3. Astron. Astrophys. 2021, 647, A23. [Google Scholar]
  38. Vorster, J.M.; Chibueze, J.O.; Hirota, T.; MacLeod, G.C.; van der Walt, D.J.; Vorobyov, E.I.; Sobolev, A.M.; Juvela, M. Identifying the mechanisms of water maser variability during the accretion burst in NGC6334I. Astron. Astrophys. 2024, 691, A157. [Google Scholar] [CrossRef]
  39. Brogan, C.L.; Hunter, T.R.; Cyganowski, C.J.; Chibueze, J.O.; Friesen, R.K.; Hirota, T.; MacLeod, G.C.; McGuire, B.A.; Sobolev, A.M. The Extraordinary Outburst in the Massive Protostellar System NGC 6334I-MM1: Flaring of the Water Masers in a North-South Bipolar Outflow Driven by MM1B. Astrophys. J. 2018, 866, 87. [Google Scholar] [CrossRef]
  40. Hirota, T.; Tsuboi, M.; Fujisawa, K.; Honma, M.; Kawaguchi, N.; Kim, M.K.; Kobayashi, H.; Imai, H.; Omodaka, T.; Shibata, K.M.; et al. Identification of Bursting Water Maser Features in Orion KL. Astrophys. J. Lett. 2011, 739, L59. [Google Scholar] [CrossRef]
  41. Hirota, T.; Tsuboi, M.; Kurono, Y.; Fujisawa, K.; Honma, M.; Kim, M.K.; Imai, H.; Yonekura, Y. VERA and ALMA observations of the H2O supermaser burst in Orion KL. Publ. Astron. Soc. Jpn. 2014, 66, 106. [Google Scholar] [CrossRef]
  42. Honma, M.; Choi, Y.K.; Bushimata, T.; Fujii, T.; Hirota, T.; Horiai, K.; Imai, H.; Inomata, N.; Ishitsuka, J.; Iwadate, K.; et al. VERA Observation of the W49N H2O Maser Outburst in 2003 October. Publ. Astron. Soc. Jpn. 2004, 56, L15. [Google Scholar]
  43. Shimoikura, T.; Kobayashi, H.; Omodaka, T.; Diamond, P.J.; Matveyenko, L.I.; Fujisawa, K. VLBA Observations of a Bursting Water Maser in Orion KL. Astrophys. J. 2005, 634, 459. [Google Scholar] [CrossRef]
  44. Karakas, A.I.; Lattanzio, J.C. The Dawes Review 2: Nucleosynthesis and Stellar Yields of Low- and Intermediate-Mass Single Stars. Publ. Astron. Soc. Aust. 2014, 31, e030. [Google Scholar] [CrossRef]
  45. Habing, H.J. Circumstellar envelopes and Asymptotic Giant Branch stars. Astron. Astrophys. Rev. 1996, 7, 97. [Google Scholar] [CrossRef]
  46. Wood, P.R.; Alcock, C.; Allsman, R.A.; Alves, D.; Axelrod, T.S.; Becker, A.C.; Bennett, D.P.; Cook, K.H.; Drake, A.J.; Freeman, K.C.; et al. MACHO observations of LMC red giants: Mira and semi-regular pulsators, and contact and semi-detached binaries. In IAU Symposium No. 191 Asymptotic Giant Branch Stars; Astronomical Society of the Pacific: San Francisco, CA, USA, 1999; Volume 191, p. 151. [Google Scholar]
  47. Ita, Y.; Tanabé, T.; Matsunaga, N.; Nakajima, Y.; Nagashima, C.; Nagayama, T.; Kato, D.; Kurita, M.; Nagata, T.; Sato, S.; et al. Variable stars in the Magellanic Clouds—II. The data and infrared properties. Mon. Not. R. Astron. Soc. 2004, 353, 705. [Google Scholar] [CrossRef]
  48. Matsuno, M.; Nakagawa, A.; Morita, A.; Kurayama, T.; Omodaka, T.; Nagayama, T.; Honma, M.; Shibata, K.M.; Ueno, Y.; Jike, T.; et al. Annual parallax measurement of the Mira variable star BX Camelopardalis with VERA. Publ. Astron. Soc. Jpn. 2020, 72, 56. [Google Scholar] [CrossRef]
  49. Nakagawa, A.; Kurayama, T.; Matsui, M.; Omodaka, T.; Honma, M.; Shibata, K.M.; Sato, K.; Jike, T. Parallax of a Mira variable R Ursae Majoris studied with astrometric VLBI. Publ. Astron. Soc. Jpn. 2016, 68, 78. [Google Scholar] [CrossRef]
  50. Nakagawa, A.; Tsushima, M.; Ando, K.; Bushimata, T.; Choi, Y.K.; Hirota, T.; Honma, M.; Imai, H.; Iwadate, K.; Jike, T.; et al. VLBI Astrometry of AGB Variables with VERA—A Semiregular Variable S Crateris. Publ. Astron. Soc. Jpn. 2008, 60, 1013. [Google Scholar] [CrossRef]
  51. Nakagawa, A.; Omodaka, T.; Handa, T.; Honma, M.; Kawaguchi, N.; Kobayashi, H.; Oyama, T.; Sato, K.; Shibata, K.M.; Shizugami, M.; et al. VLBI astrometry of AGB variables with VERA: A Mira-type variable T Lepus. Publ. Astron. Soc. Jpn. 2014, 66, 101. [Google Scholar] [CrossRef]
  52. Le Bouquin, J.-B.; Lacour, S.; Renard, S.; Thiébaut, E.; Merand, A.; Verhoelst, T. Pre-maximum spectro-imaging of the Mira star T Leporis with AMBER/VLTI. Astron. Astrophys. 2009, 496, L1. [Google Scholar] [CrossRef]
  53. Nakagawa, A.; Morita, A.; Sakai, N.; Kurayama, T.; Sudou, H.; Orosz, G.; Yuda, A.; Kaseda, D.; Matsuno, M.; Hamada, S.; et al. Astrometric VLBI observations of H2O masers in an extreme OH/IR star candidate NSV 17351. Publ. Astron. Soc. Jpn. 2023, 75, 529. [Google Scholar] [CrossRef]
  54. Wright, E.L.; Eisenhardt, P.R.M.; Mainzer, A.K.; Ressler, M.E.; Cutri, R.M.; Jarrett, T.; Kirkpatrick, J.D.; Padgett, D.; McMillan, R.S.; Skrutskie, M.; et al. The Wide-field Infrared Survey Explorer (WISE): Mission Description and Initial On-orbit Performance. Astron. J. 2010, 140, 1868. [Google Scholar] [CrossRef]
  55. Mainzer, A.; Bauer, J.; Grav, T.; Masiero, J.; Cutri, R.M.; Dailey, J.; Eisenhardt, P.; McMillan, R.S.; Wright, E.; Walker, R.; et al. Preliminary Results from NEOWISE: An Enhancement to the Wide-field Infrared Survey Explorer for Solar System Science. Astrophys. J. 2011, 731, 53. [Google Scholar] [CrossRef]
  56. Meisner, A.M.; Caselden, D.; Schlafly, E.F.; Kiwy, F. unTimely: A Full-sky, Time-domain unWISE Catalog. Astron. J. 2023, 165, 36. [Google Scholar] [CrossRef]
  57. Nakagawa, A.; Kurayama, T.; Sudou, H.; Orosz, G. Implication of the period-magnitude relation for massive AGB stars and its astronomical applications. IAU Symp. 2024, 376, 159. [Google Scholar] [CrossRef]
  58. Kawaguchi, N.; Fujisawa, K.; Nakajima, J.; Uose, H.; Iwamura, S.; Hoshino, T.; Hashimoto, T.; Takagi, H. Gigabit Data Acquisition and the Transmission Experiment. NTT R&D 2001, 50, 824. [Google Scholar]
  59. Oyama, T.; Kono, Y.; Suzuki, S.; Mizuno, S.; Bushimata, T.; Jike, T.; Kawaguchi, N.; Kobayashi, H.; Kimura, M. New VLBI Observing System ’OCTAVE-Family’ to Support VDIF Specifications with 10 GigE for VERA, JVN, and Japanese e-VLBI (OCTAVE). In Proceedings of the Seventh General Meeting (GM2012) of the International VLBI Service for Geodesy and Astrometry (IVS), Madrid, Spain, 4–9 March 2012; pp. 91–95. [Google Scholar]
  60. Kimura, M.; Nakajima, J. The implementation of the PC based Giga bit VLBI system. IVS CRL Technol. Dev. Cent. News 2002, 21, 31. [Google Scholar]
  61. Takeuchi, H.; Kimura, M.; Nakajima, J.; Kondo, T.; Koyama, Y.; Ichikawa, R.; Sekido, M.; Kawai, E. Development of a 4 Gbps Multifunctional Very Long Baseline Interferometry Data Acquisition System. Publ. Astron. Soc. Pac. 2006, 118, 1739. [Google Scholar] [CrossRef]
  62. Takefuji, K.; Takeuchi, H.; Tsutsumi, M.; Koyama, Y. Next-generation A/D Sampler ADS3000+ for VLBI2010. In Proceedings IVS 2010 General Meeting; Behrend, D., Baver, K.D., Eds.; NASA Goddard Space Flight Center: Greenbelt, MD, USA, 2010; pp. 378–382. [Google Scholar]
  63. An, T.; Sohn, B.W.; Imai, H. Capabilities and prospects of the East Asia Very Long Baseline Interferometry Network. Nat. Astron. 2018, 2, 118–125. [Google Scholar] [CrossRef]
  64. Cui, Y.; Hada, K.; Kino, M.; Sohn, B.W.; Park, J.; Ro, H.W.; Sawada-Satoh, S.; Wu, J.; Cui, L.; Honma, M.; et al. East Asian VLBI Network observations of active galactic nuclei jets: Imaging with KaVA+Tianma+Nanshan. Res. Astron. Astrophys. 2021, 21, 205. [Google Scholar] [CrossRef]
  65. Akiyama, K.; Algaba, J.C.; An, T.; Asada, K.; Asanok, K.; Byun, D.Y.; Chanapote, T.; Chen, W.; Chen, Z.; Cheng, X.; et al. Overview of the Observing System and Initial Scientific Accomplishments of the East Asian VLBI Network (EAVN). Galaxies 2022, 10, 113. [Google Scholar] [CrossRef]
  66. Cui, Y.; Hada, K.; Kawashima, T.; Kino, M.; Lin, W.; Mizuno, Y.; Ro, H.; Honma, M.; Yi, K.; Park, J.; et al. Precessing jet nozzle connecting to a spinning black hole in M87. Nature 2023, 621, 711–715. [Google Scholar] [CrossRef]
  67. Algaba, J.C.; Anczarski, J.; Asada, K.; Baloković, M.; Chandra, S.; Cui, Y.Z.; Falcone, A.D.; Giroletti, M.; Goddi, C.; Hada, K.; et al. Broadband Multi-wavelength Properties of M87 during the 2017 Event Horizon Telescope Campaign. Astrophys. J. Lett. 2021, 911, L11. [Google Scholar]
  68. Algaba, J.C.; Baloković, M.; Chandra, S.; Cheong, W.Y.; Cui, Y.Z.; D’Ammando, F.; Falcone, A.D.; Ford, N.M.; Giroletti, M.; Goddi, C.; et al. Broadband multi-wavelength properties of M87 during the 2018 EHT campaign including a very high energy flaring episode. Astron. Astrophys. 2024, 692, A140. [Google Scholar] [CrossRef]
  69. Hagiwara, Y.; Hada, K.; Takamura, M.; Oyama, T.; Yamauchi, A.; Suzuki, S. Demonstration of Ultrawideband Polarimetry Using VLBI Exploration of Radio Astrometry (VERA). Galaxies 2022, 10, 114. [Google Scholar] [CrossRef]
  70. Kameyama, A.; Kondo, S.; Dakie, S.; Okada, N.; Sawada-Satoh, S.; Ogawa, H.; Onishi, T.; Yamasaki, Y.; Masui, S.; Sunada, K.; et al. Development of 86 GHz low-noise wideband receiver. In Proceedings of the SPIE, Yokohama, Japan, 16–22 June 2024; Volume 13102, p. 1310229. [Google Scholar]
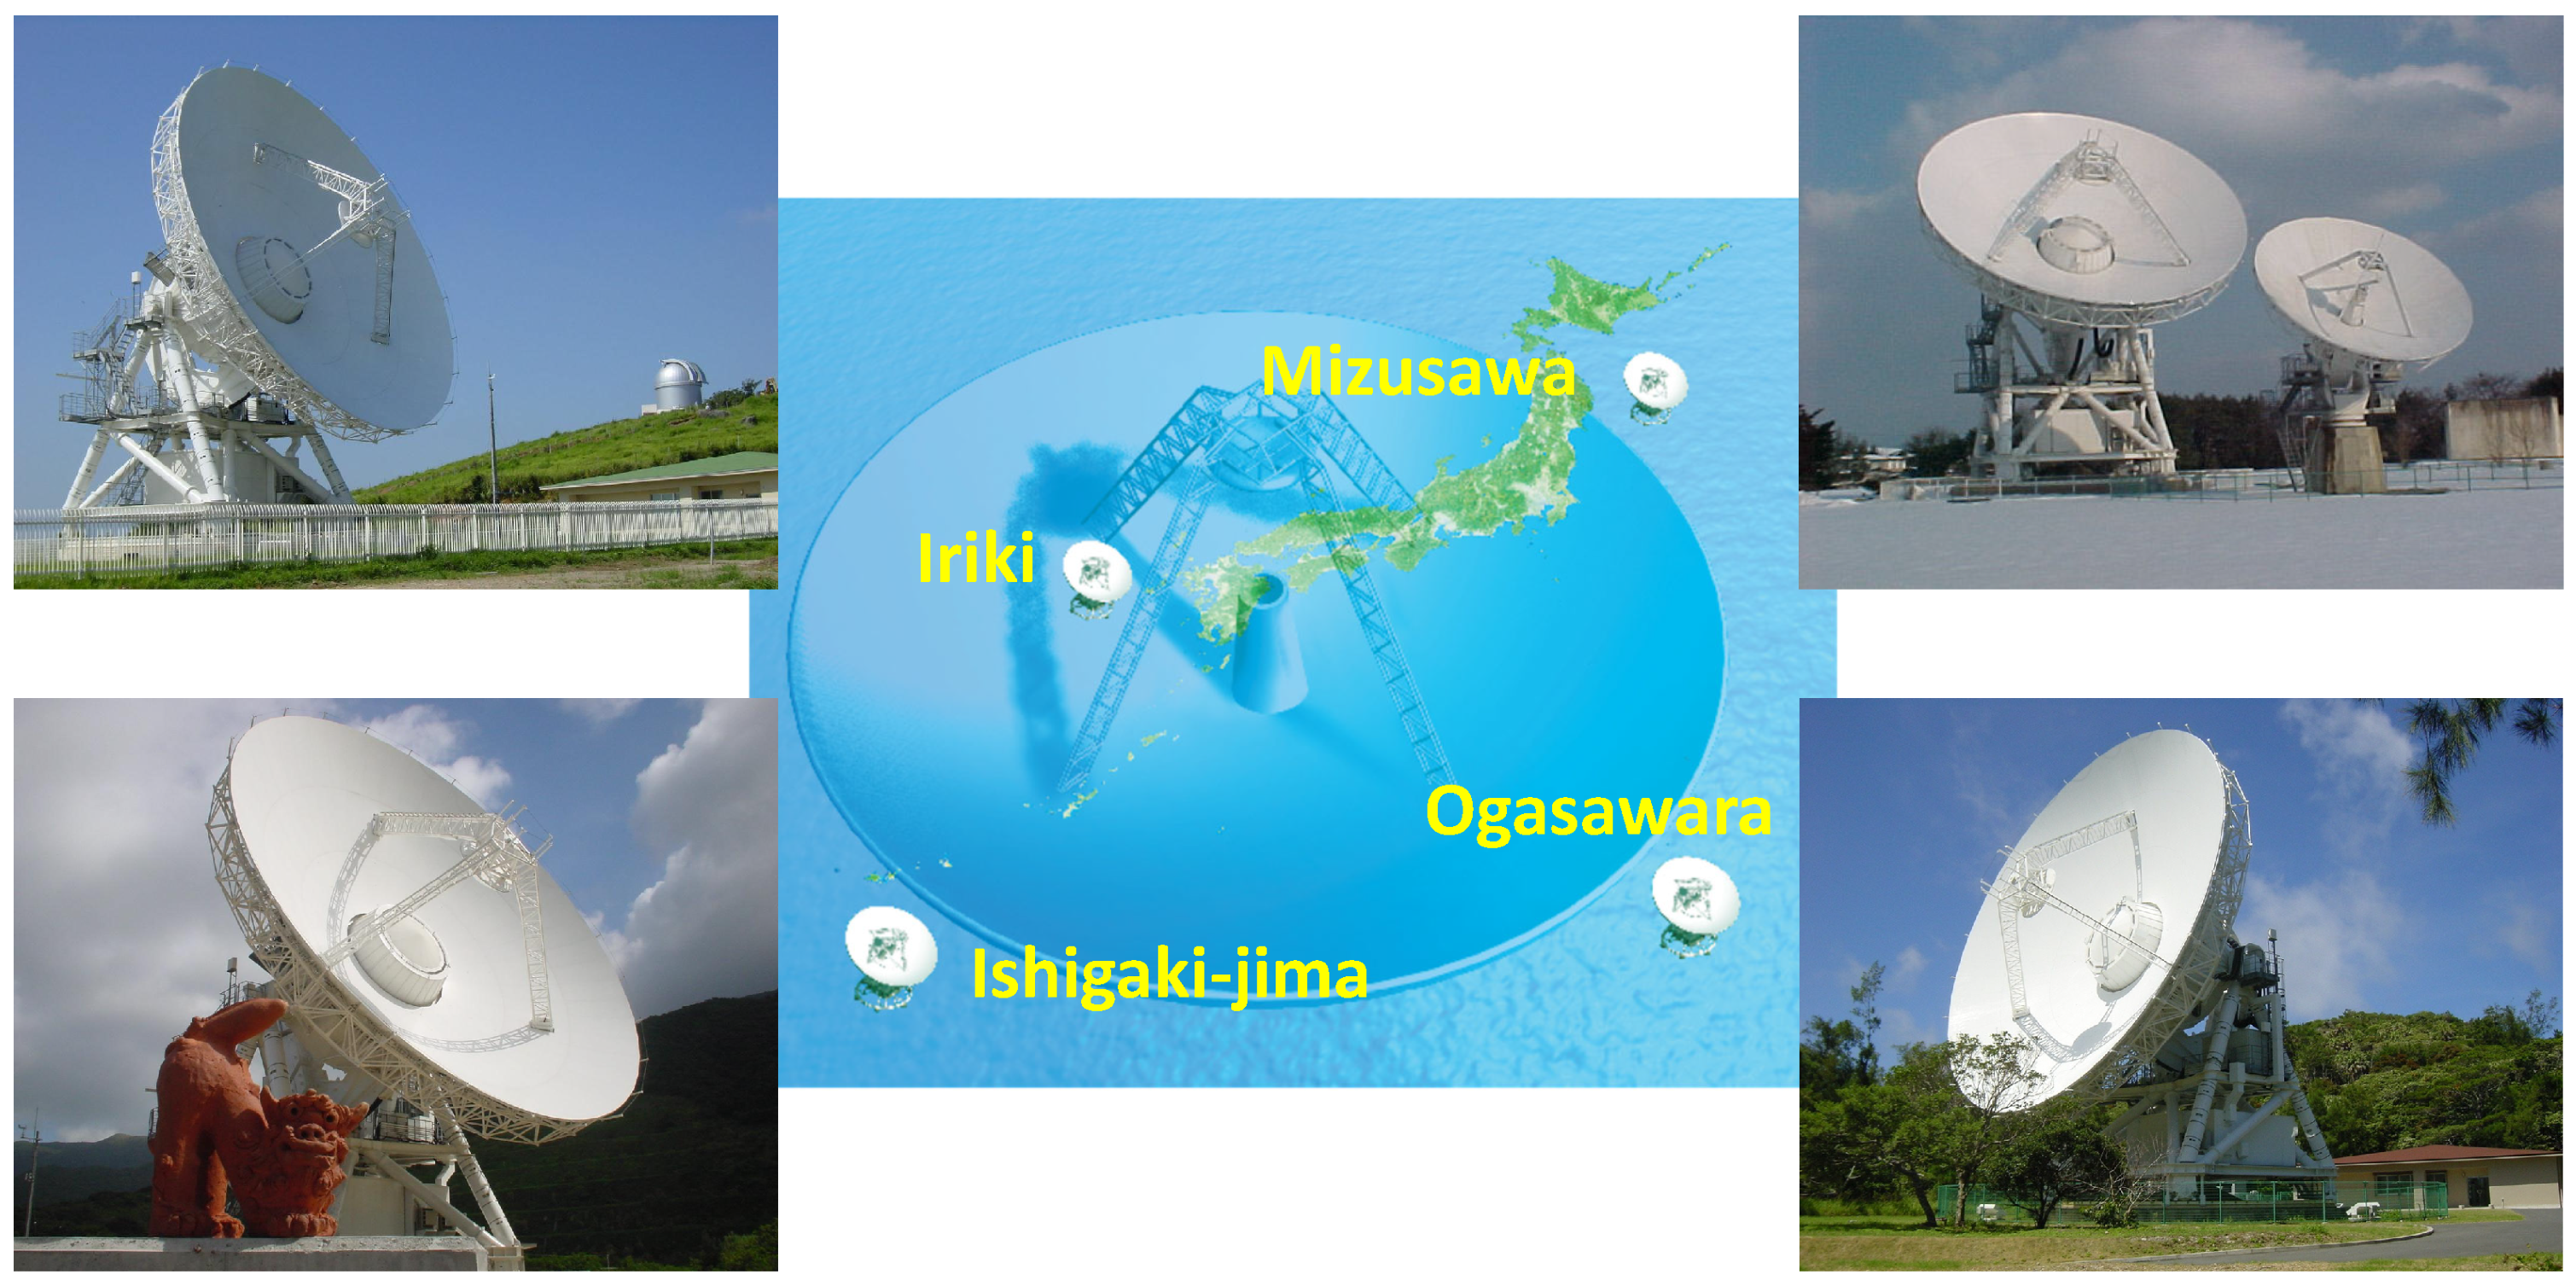
Figure 1. VERA array map and pictures of the four stations. From top right in clockwise direction, Mizusawa, Ogasawara, Ishigaki-jima, and Iriki.
Galaxies 13 00120 g001
Figure 2. Internal view of receiver cabin at VERA Mizusawa station. Two platforms are seen (A at far side and B at near side), on which several receivers are installed. Note that the two pairs of K- and Q-band horns are installed onto both platforms, enabling us to conduct dual-beam observations at these two bands.
Galaxies 13 00120 g002
Figure 3. Galactic maser astrometry results overlaid on an artistic image of the face-on view of the Milky Way Galaxy. Distributions of the maser sources measured with VLBI are plotted with the observed proper motion vectors (allows), which are the sum of Galactic rotation and (rather smaller) peculiar motions. The different colors indicate the association of different spiral arms defined by the BeSSeL project [14], with black solid curves showing the spiral arm locations. The Galactic center distance, R 0 , and rotation velocity, Θ 0 , determined by the VERA project [10] are also written in the figure.
Galaxies 13 00120 g003
Figure 4. Proper motion and trigonometric parallax of Sgr A*. Left panel shows the Sgr A* motion on the sky plane, which is dominated by the proper motion reflecting the Sun’s motion. After removing the best-fit proper motion, parallax is seen in residual plot in RA (middle), while DEC residual (right) is dominated by noise as the parallax effect is by far smaller in DEC. The solid curves show the best-fit parallax of 0.117 ± 0.017 mas, corresponding to a distance of 8.5 1.1 + 1.5 kpc.
Galaxies 13 00120 g004
Figure 5. Absolute magnitudes ( M K )– log P diagram of the Galactic pulsating AGB stars. Filled and open circles indicate Mira variables and other types of variables (SR, red supergiant, and OH/IR stars). Distances of all sources are derived from astrometric VLBI. Solid line shows a relation for the Galactic Mira variables; M K = 3.52 log P + ( 1.09 ± 0.14 ) reported in Nakagawa et al. [49]. The 12 sources with periods around 400 days are shown enlarged in the gray box at the top left. Dotted lines with labels C and C’ indicate two sequences in Ita et al. [47].
Galaxies 13 00120 g005
Figure 6. H2O maser distributions and kinematics revealed with VERA in a SR variable S Crt and a Mira variable T Lep [50,51]. The colors of the arrows and the filled circles represent their V LSR values. (Left) Circumstellar H2O masers of S Crt. The shaded circle indicates the size of the stellar photosphere estimated in Nakagawa et al. [50]. A circular fit to the maser distribution (dashed line) has a radius of 14.2 mas corresponding to 12.2 au. The cross indicates the estimated stellar position. (Right) Circumstellar H2O masers of T Lep. A VLTI infrared image of the central star [52] is overlaid on the H2O maser distribution obtained with VERA. The color of the central star is unrelated to the color coding of the masers.
Galaxies 13 00120 g006
Figure 8. Block diagram of the VERA back-end system. Instruments shown in gray rectangles are those included in the conventional system; DIR1000 and DIR2000 were in use until 2015. Thin arrows indicate the flows of electrical and digitized signals; the signal lines shown by broken lines are the initial signal streams via ODS and ODR using an Asynchronous Transfer Mode (ATM). Thick lines show the signal paths in the 10 Gbps Ethernet network.
Galaxies 13 00120 g008
Figure 9. Pictures of some of OCTAVE family components (left) as well as the correlation center at Mizusawa, where software-based correlators are in operation. From top to bottom in the left: OCTAD (A/D converter), OCTAVIA (VSI Adapter), and OCTADISK (HDD recorder).
Galaxies 13 00120 g009
Table 1. Development of the Galactic constants determination by VLBI astrometry.
VERA
ParameterReid et al.
2009 [12]
Honma et al.
2012 [8]
Reid et al.
2014 [13]
Reid et al.
2019 [14]
Collaboration
et al. 2020 [10]
N source 1852103199224 *
R 0 ( kpc ) 8.4 ± 0.68.05 ± 0.458.34 ± 0.168.15 ± 0.157.92 ± 0.16
Θ 0 ( km s 1 ) 254 ± 16238 ± 14240 ± 8236 ± 7227 ± 8
*: 99 sources from VERA.
Disclaimer/Publisher’s Note: The statements, opinions and data contained in all publications are solely those of the individual author(s) and contributor(s) and not of MDPI and/or the editor(s). MDPI and/or the editor(s) disclaim responsibility for any injury to people or property resulting from any ideas, methods, instructions or products referred to in the content.