Abstract
V1413 Aql is an anomalous classical symbiotic star that has remained in an active state almost continuously. After failing to return to quiescence following the 2020 outburst, it underwent a new flare in 2025. We present an analysis of new photometric and spectroscopic observations, which provide estimates for the binary components at different stages of activity: , ; , during minimum; , at the 2025 maximum. The significant increase in the luminosity of the hot component during the 2025 outburst deviates from the typical behavior observed in classical symbiotic stars, where outbursts are generally attributed to a redistribution of spectral energy rather than intrinsic changes in luminosity.
1. Introduction
V1413 Aql (≡AS 338) was discovered on objective-prism plates obtained by [1]. A distinctive feature of its spectrum at that time was the presence of strong H emission. In [2], it was suspected that the star could be a symbiotic star. However, it was not until 1978 that Allen obtained a detailed spectrum of V1413 Aql, revealing its symbiotic nature. This spectrum showed not only bright emission lines—including those from ions with high ionization potentials, such as He II—but also molecular absorption bands. As a result, the star was included in the first catalog of symbiotic stars [3]: interacting binary systems composed of a cool giant (or supergiant) and a hot companion, surrounded by a nebula of gas and dust.
Further spectral observations carried out between 1981 and 2025, as reported by several authors ([4] and references therein), showed that the spectrum obtained by Allen corresponded to a rare quiescent state of V1413 Aql. Spectra of a similar appearance were recorded only in 1993 [5] and 2017 [4]. Notably, each quiescent state lasted no more than six months—although never less than three months. The difference between the spectra of the quiescent and active states of V1413 Aql is striking, yet it remains typical for classical symbiotic stars (SySts). In quiescence, the SED can be fitted using the standard three-component model [6]: a hot component with a temperature of K (well visible in the UV range, though its contribution in the optical is not detectable against the general background), a cool giant, and a nebula. In classical SySts, the transition to an active state—associated with the expansion of the burning shell—leads to a significant brightening of the hot component, making it the dominant source of optical radiation. Its SED resembles that of an A-F type star [7]. There is also observational evidence suggesting that this hot component has a disk-like structure (see, for example, [8], who analyzed eclipses of the flared hot component in the classical SySt CI Cyg).
The oldest photometric observations of V1413 Aql were compiled by [9]. Notably, the smooth light curve typical of classical SySts in quiescence was revealed only after folding sparse data from 1962 to 1967. In subsequent years, narrow and sharp minima appeared in the light curve—features characteristic of classical eclipses of the hot component by the red giant (see, for example, [10]). Based on V-band photometry obtained between 1982 and 1988, four such eclipse events were detected and the orbital period of the system was determined to be 434 d [11]. Spectral observations by [12] confirmed that the object was in an active state in 1983: high-ionization emission lines had disappeared from the spectrum, while molecular absorption bands of the cool component were overwhelmed by the radiation of the flaring hot component.
It should be noted that outbursts of classical SySts generally follow a fairly consistent scenario [7]: a rapid brightening over several months, a slower decline lasting multiple orbital periods, and long quiescent intervals between successive outbursts—typically ten years or more. In this context, V1413 Aql represents an anomalous case. Throughout the period of dense photometric monitoring since 1982, the star has entered a short-lived quiescent state only twice. Moreover, new outbursts may commence before the hot component has fully returned to quiescence—as was observed in 2009 [13]. A similar pattern has emerged during the current phase of increasing activity, which is the focus of the present study.
The distance to V1413 Aql was estimated at kpc by [14]. We note that the Gaia parallax distance for the system is kpc [15]; however, the large value of the RUWE = 2.46 suggests that the distance estimate from [14] is more reliable. For both distance estimates, the map of interstellar reddening [16] yields a color excess of . This value is consistent within the error bars with the color excess derived by [14] from the He II emission-line flux ratio. In the following, we adopt a distance of 6 kpc and a color excess of . The impact of uncertainties in these values will be discussed in the conclusion.
This study presents an analysis of photometric and spectroscopic observations carried out between 2023 and 2025, covering the transition of V1413 Aql from a low-activity state—which did not fully resemble a classical quiescent phase—to its current rise in brightness, marking the onset of a new outburst.
2. Observations
Photometric observations of V1413 Aql were conducted from 2019 to 2025 using the 60 cm ASA RC600 telescope (ASA DDM160 mount, Astro Systeme Austria (ASA), Lieboch, Austria) of CMO of the Sternberg Astronomical Institute. The observations were carried out with an Andor iKon-L DZ936N-BV camera (Photonic Science Limited, East Sussex, UK). The image scale in the focal plane is ∼ per pixel. A detailed description of the telescope can be found in [17]. Brightness measurements were performed using differential aperture photometry, with TYC 1585-1513-1 selected as the primary comparison star. The following magnitudes were adopted for this star: , , , and .
Spectroscopic observations were carried out from 2020 to 2025 using the TDS [18], mounted on the 2.5 m telescope of CMO. A slit width of was used. Spectra were recorded simultaneously in the B-channel (wavelength range 360–577 nm, spectral resolving power R = 1300) and the R-channel (wavelength range 567–746 nm, spectral resolving power R = 2500). The log of observations is presented in Table 1.

Table 1.
Log of spectroscopic observations of V1413 Aql.
3. Photometric Analysis
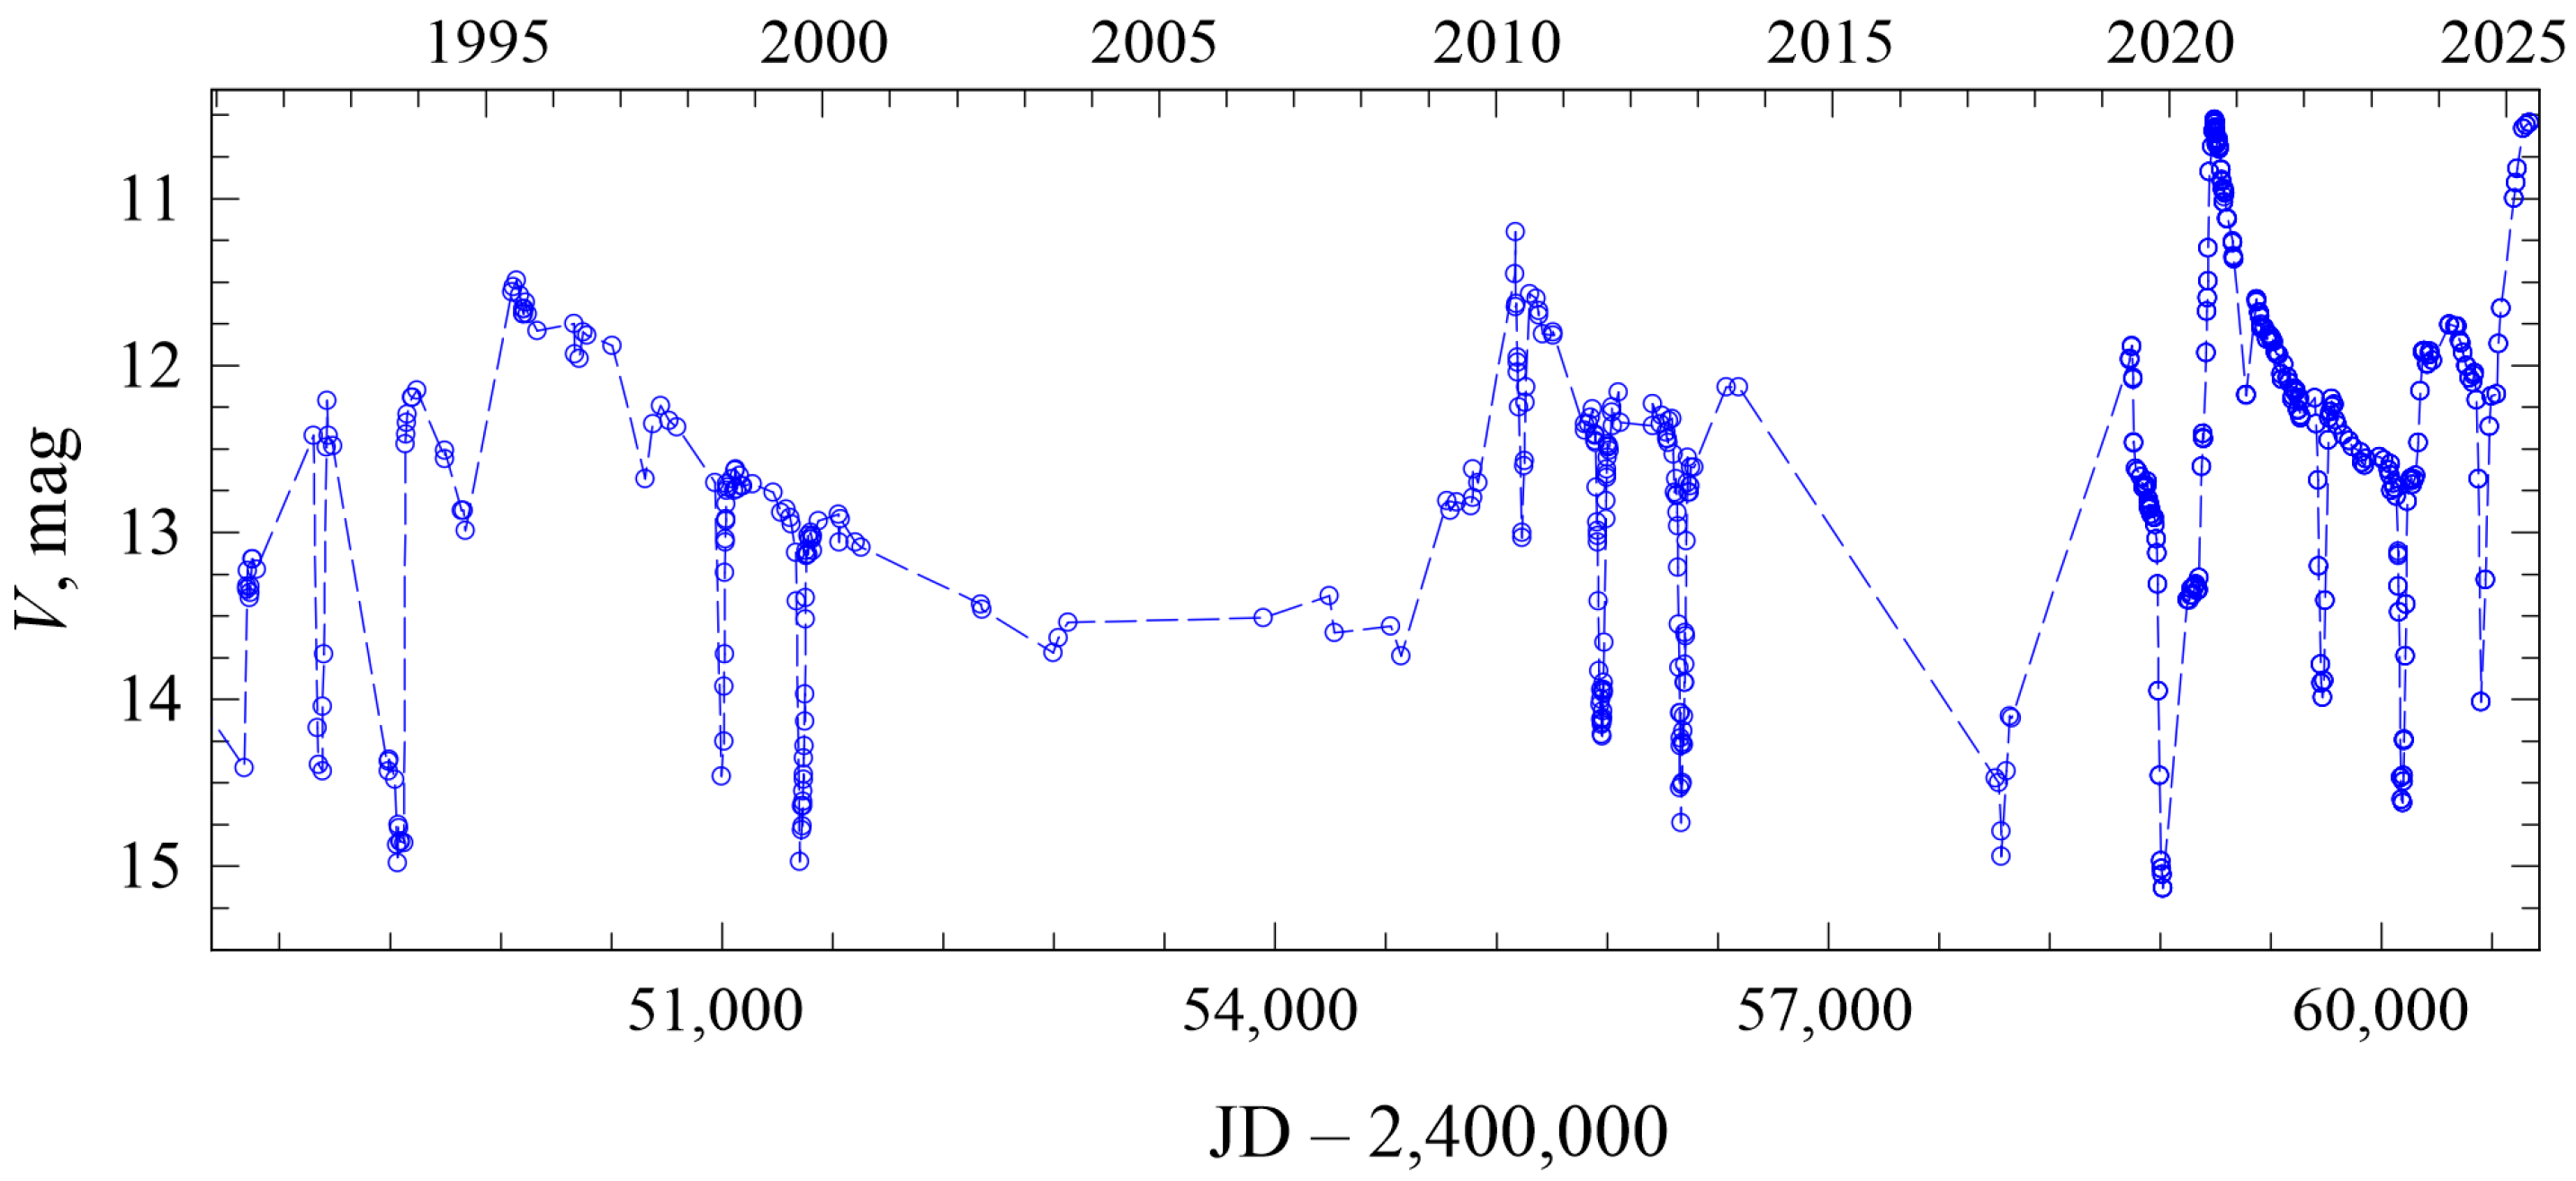
Figure 1 shows the V-band light curve of V1413 Aql, based on our new observations (Table 1) and previously published data [14,19,20,21]. During this period, we recorded four outbursts, with brightness maxima occurring in 1995, 2010, 2020, and 2025. No intermediate outbursts were detected between 1995 and 2010—a gap confirmed by photometric data from the AAVSO database.
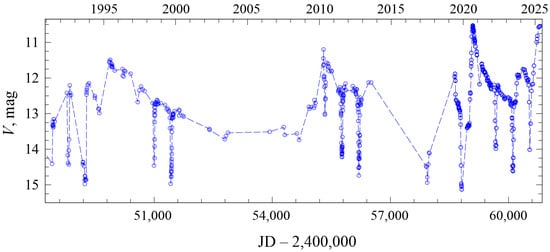
Figure 1.
The V-band light curve of V1413 Aql (1991–2025).
During the 1995 and 2010 outbursts, the star reached a maximum brightness of approximately 11.5 mag, whereas the 2020 and 2025 outbursts were about one magnitude brighter at peak. In addition to difference in amplitude, these events also exhibited distinct light curve morphologies. The rise to maximum brightness in 1995 and 2010 was smooth and gradual, while the 2020 and 2025 outbursts showed a much more rapid brightening. The decline phases likewise differed: after the 1995 outburst, the brightness decreased by ∼ 2 mag over approximately 8 years, whereas a similar 2 mag drop occurred within just 2.5 years following the 2020 outburst.
Over the 34 years of our photometric monitoring, we were able to observe 12 events in sufficient detail to reliably determine the time of minimum brightness for each. These measurements allowed us to refine the ephemeris of the binary system. For this purpose, we calculated the values for the observed times of eclipse minima. By varying the orbital period and the initial epoch, we then determined the values that minimized the sum of :
where the primary minimum at phase corresponds to the eclipse of the hot component.
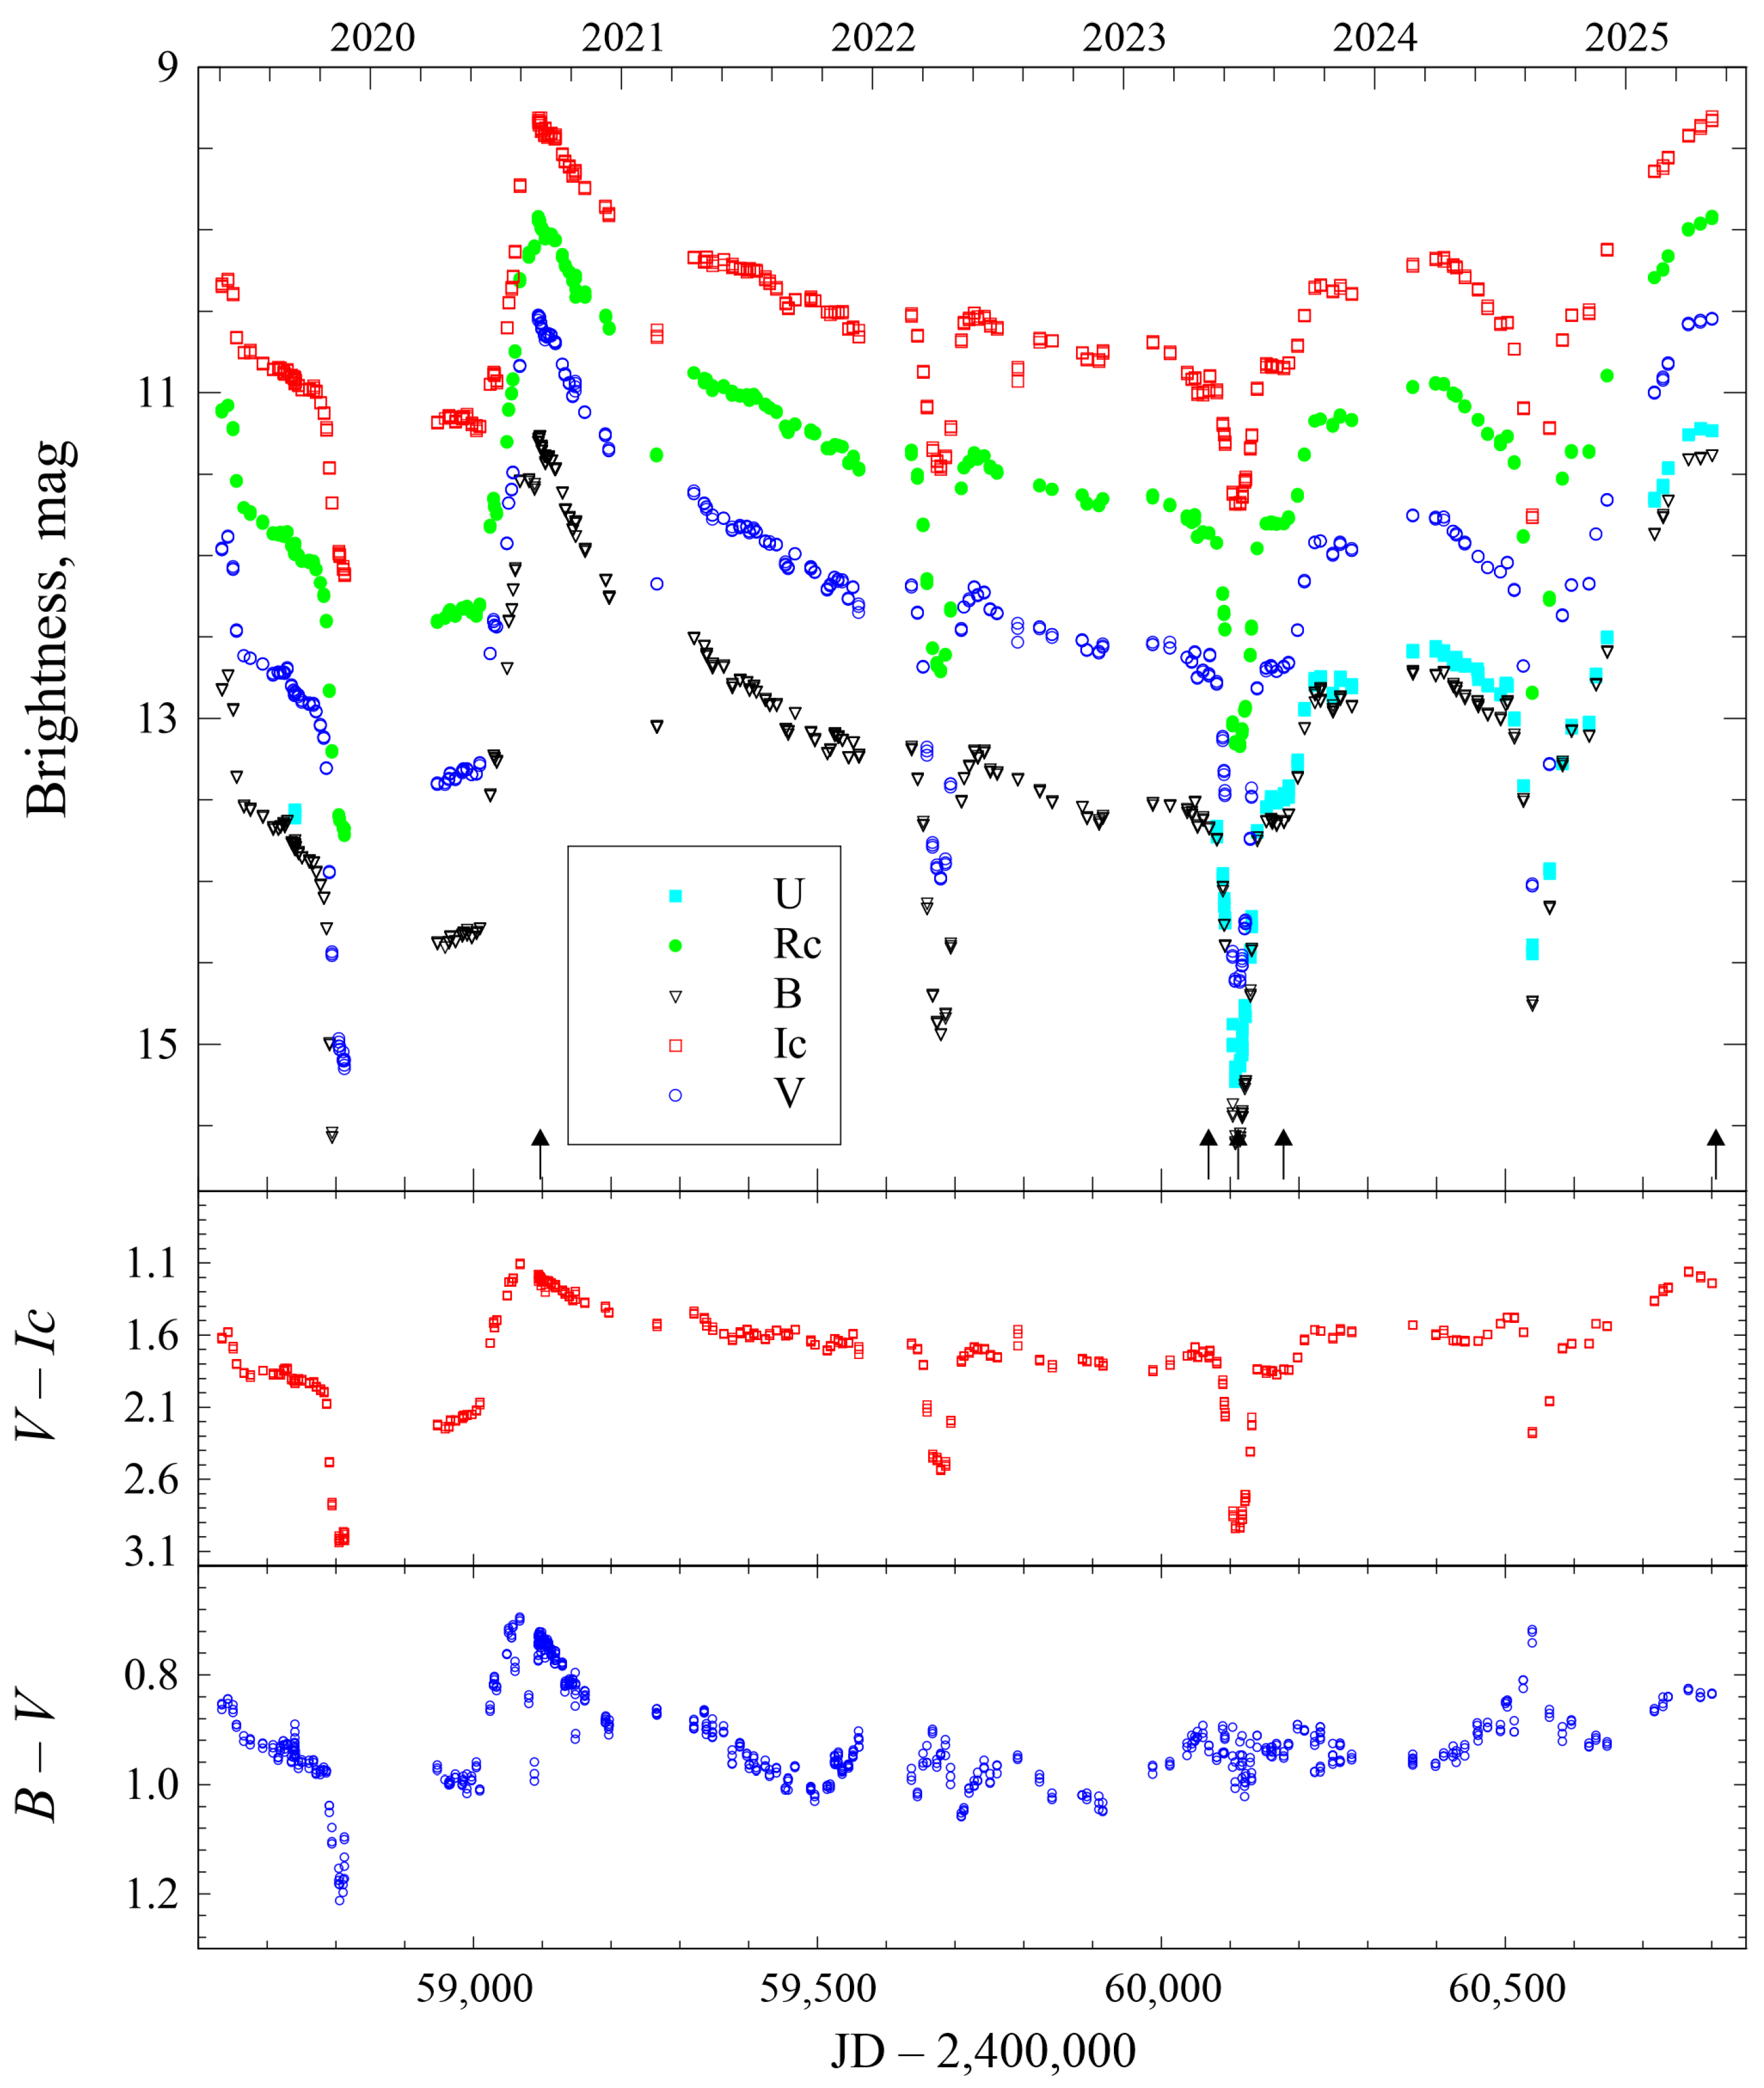
Figure 2 shows the -band light curves of V1413 Aql, together with the evolution of the and color indice over the period 2019–2025. This interval is densely covered by our multi-color photometric observations and includes two major outbursts—in 2020 and 2025. Although these outbursts were similar in peak brightness, they differ significantly in their rise rates: in 2020, the brightening rate was mag/d and mag/d, whereas in 2025, the rise was about three times slower. The variability amplitude in the band was generally smaller, which is attributed to the fact that all observed events originate from the hot component, which contributes less flux in the red spectral region than in the blue.
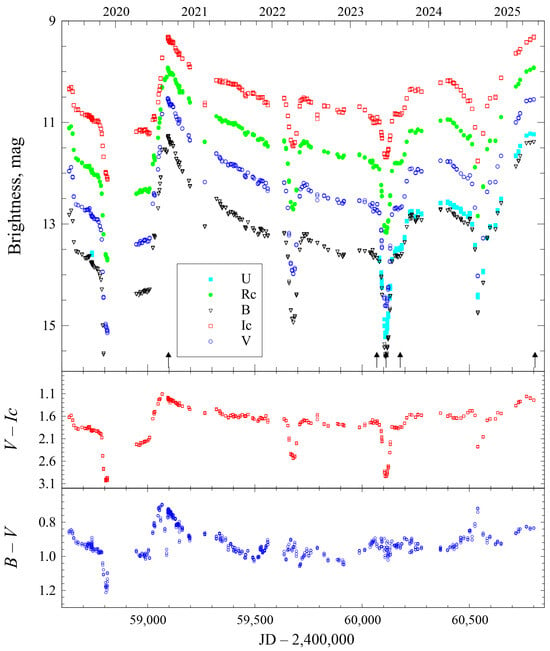
Figure 2.
The and -band light and , color curves of V1413 Aql (2019–2025). The arrows indicate the epochs of low-resolution spectra discussed in the paper.
In [21], a photometric criterion for quiescence was established based on a comparison of spectral and photometric data across different activity phases of V1413 Aql. According to this criterion, the hot component is considered to be in a quiescent state when . As shown in Figure 2, the color index approached this threshold value twice since 2019. Notably, one such episode occurred during the peak of the 2020 outburst. It is also worth noting that, despite the large brightness variations observed in the V band—with a total amplitude reaching nearly 5 mag—the color index remained relatively stable, varying only between 0.7 and 1.2. Moreover, the average value after 2021 remained at , even during the 2025 outburst. This suggests that the system did not return to a true quiescent state after the 2020 outburst but rather transitioned directly into a new active phase.
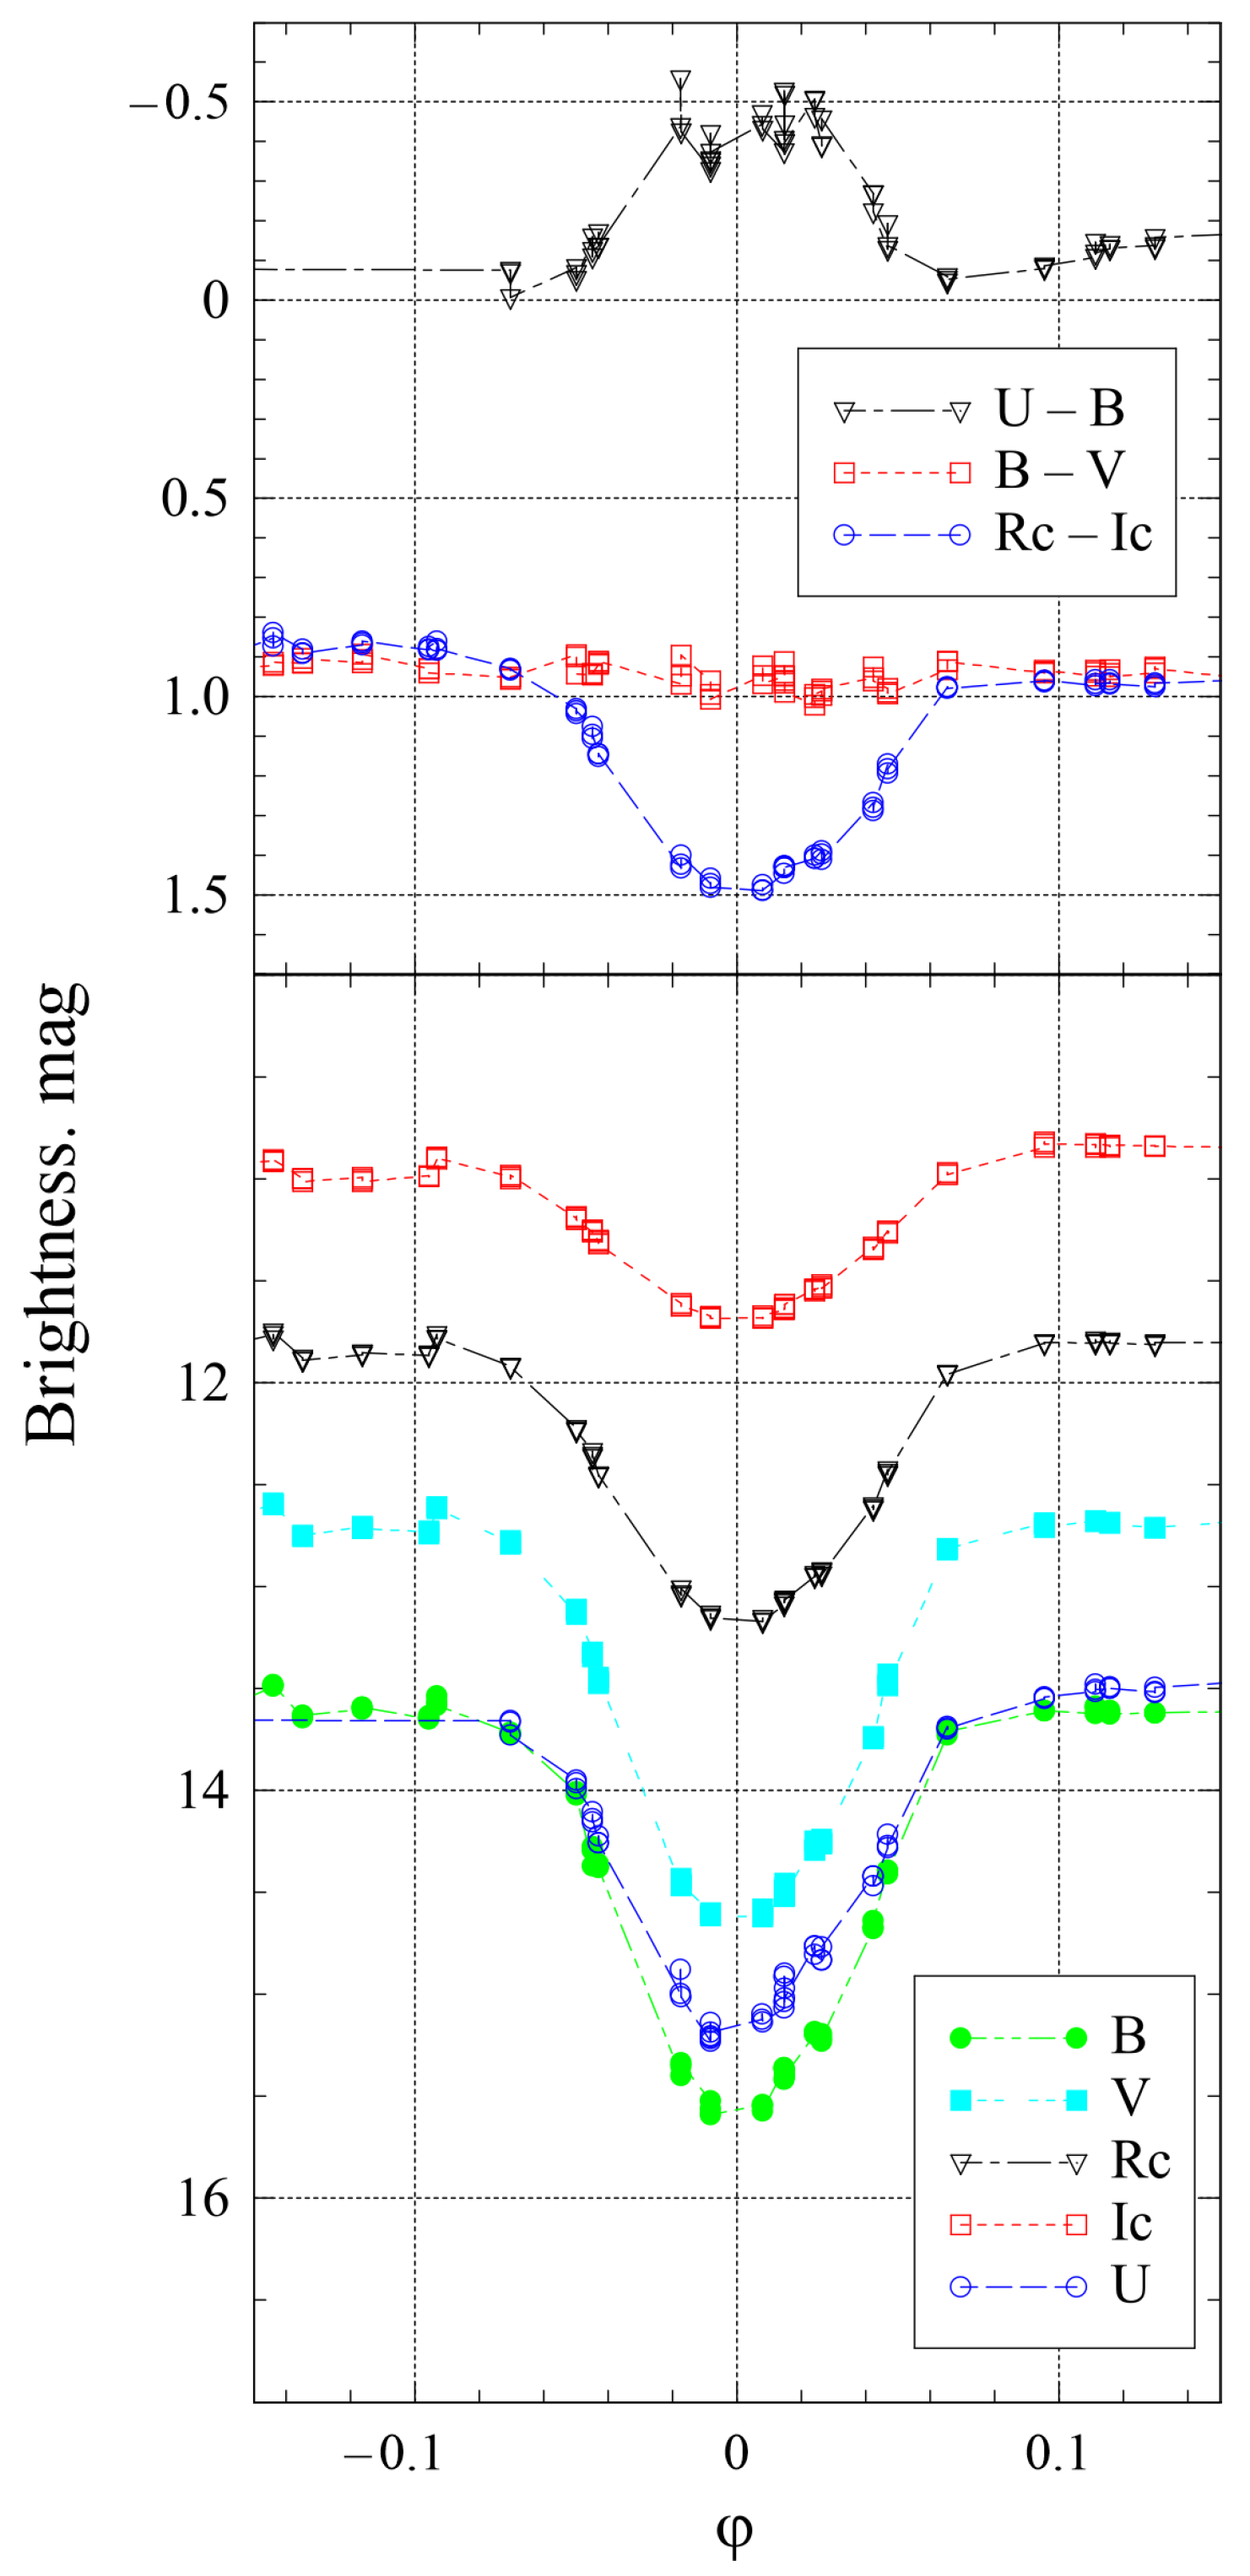
Three primary eclipses occurred during the decline of the 2020 outburst, when the hot component was occulted by the cool giant. We focus on the 2023 minimum. Figure 3 shows the light and color curves over the phase interval relative to the brightness minimum.
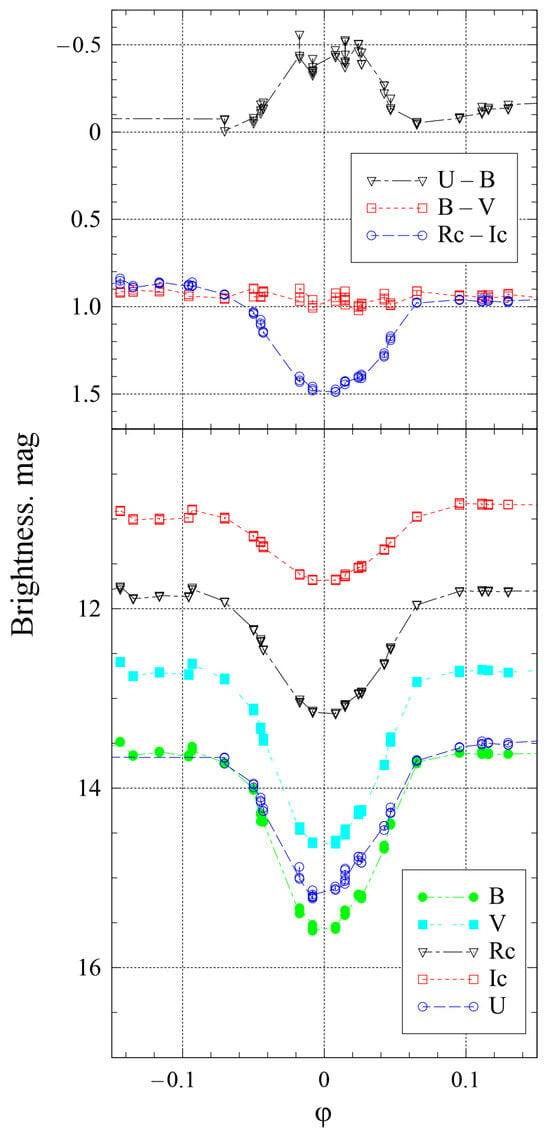
Figure 3.
Phase-folded light and color curves of V1413 Aql during the 2023 minimum.
The depth of the 2023 minimum was measured as , , , , and . Taking into account the interstellar reddening of , the dereddened magnitudes at minimum are , , , , . The observed color indices during the eclipse differ significantly from those expected for a single red giant (see also the discussion below on the SED during the eclipse). This discrepancy suggests either a significant contribution from the nebular continuum or that the eclipse was not total. Furthermore, the light curve shape near minimum does not support a full eclipse of the hot component—no flat-bottomed minimum is observed, which would indicate a constant brightness level during totality. Using the extinction-corrected brightness of the star at minimum and the eclipse amplitude, we calculated the color indices of the eclipsed component to be , , . The color index is not considered diagnostic due to strong nebular emission in the blue spectral range. These values are consistent with a spectral type of F4–F7 for the hot component. However, the actual spectral type of the eclipsed component may be later due to the unaccounted contribution of emission lines (see discussion below).
The color behavior shown in Figure 3 is typical of V1413 Aql in its active state [22]. During eclipse, the object becomes bluer in the color index. This is because the flaring, eclipsed hot component contributes relatively redder emission in this spectral range compared to the nebular continuum. The color index remains nearly unchanged relative to the out-of-eclipse level, despite a photometric amplitude of almost 2 mag in the V band. In contrast, the star reddens in , indicating that during eclipse, the red part of the spectrum is dominated by emission from the M5–M6 giant companion.
Assuming a total eclipse duration of and considering the eclipse to be central, the sum of the component radii in units of the semi-major axis a is , which is consistent with the estimate obtained by [22].
4. Spectroscopic Analysis
The epochs of the spectra discussed below are indicated in Figure 2. Two spectra were obtained at the maxima of the 2020 and 2025 outbursts; two were taken before and after the primary eclipse minimum in 2023; and one was recorded during the eclipse itself. All spectra were normalized so that their convolution with the V passband matched the photometric measurements shown in Figure 2. The spectra were then corrected for interstellar reddening using a color excess of . Unless otherwise noted, all subsequent analyses—except those presented in Table 2—are based on these calibrated data.

Table 2.
Emission-line fluxes in units of erg for V1413 Aql. A dash indicates that the line is absent from the spectrum, while the symbol “Y” denotes a weak feature for which a reliable flux measurement is not possible.
For each spectrum, we measured fluxes in the selected emission lines and blends (see Table 2). The uncertainties in the flux measurements of weak lines—such as Fe II in the spectrum obtained during the eclipse—can reach up to 30%, primarily due to uncertainties in the continuum placement. For strong lines, the measurement errors do not exceed 10%. The relative contribution of emission lines to certain blends varies with orbital phase. During eclipse, forbidden nebular lines may become detectable in some blends, whereas they are usually overwhelmed by the emission from the hot component outside of eclipse.
During the 2023 eclipse minimum, V1413 Aql exhibited a local activity minimum, although the object had not fully returned to its quiescent state. At that time, the emission-line spectrum was dominated by Balmer hydrogen lines, with relatively strong He I features, as well as forbidden lines such as [O III], [Ne III], and others (see Table 2). Notably, the He II 4686 Å line—a spectral feature indicative of the quiescent state according to [21]—was not detected in any of our spectra.
The hydrogen lines show a clear phase dependence. Their fluxes during the minimum are nearly half of those measured outside eclipse. The dereddened H/H flux ratio ranges from 3.8 (post-eclipse) to 4.4 (during eclipse). These values deviate significantly from the Case B recombination value (≈2.8 [23]), even when accounting for the small contribution of [N II] lines to the H flux—in contrast to the rest of the Balmer decrement. Assuming optically thin emission, the H flux allows us to estimate the emission measure of the corresponding region as (for the spectrum obtained on 4 May 2023 and adopting K).
The fluxes of He I lines also drop significantly during the eclipse. The HeI flux ratios are entirely inconsistent with the standard Case B recombination values. These ratios cannot be reproduced by commonly used photoionization codes such as CLOUDY under any physically reasonable assumptions. This discrepancy is not unique to V1413 Aql but is a well-known issue across the entire class of symbiotic stars (see the comprehensive review by [24]). Notably, over the course of our observations of V1413 Aql, the He I flux ratio has varied by an order of magnitude ([4] and references therein). However, the pre- and post-eclipse He I fluxes observed in 2023 formally match the model by [24], assuming nebular parameters of K, , , and hot component properties of K and . These parameters are roughly consistent with those observed for V1413 Aql in its quiescent state [4]. However, according to [24], even an order-of-magnitude change in the number of ionizing photons affects the predicted He I flux ratios by only about 15%. We also note that the He I flux ratios observed during the eclipse correspond to lower electron densities of , which appears reasonable from a geometrical perspective of the eclipse configuration.
Phase variations are also observed in the Fe II and [O I] lines, which are likely formed in the region near the hemisphere of the red giant illuminated by the hot component. However, the absence of radial velocity curves for individual emission lines in V1413 Aql hinders the development of a robust kinematic model of the nebular structure.
In contrast to the previously discussed lines, the nebular [O III] and [Ne III] lines show no phase dependence, indicating that they originate from a different region within the inhomogeneous nebula. The fluxes of these lines are consistent with the nebular parameters of = 10,000–11,000 K and [25], under the assumption of cosmic elemental abundances.
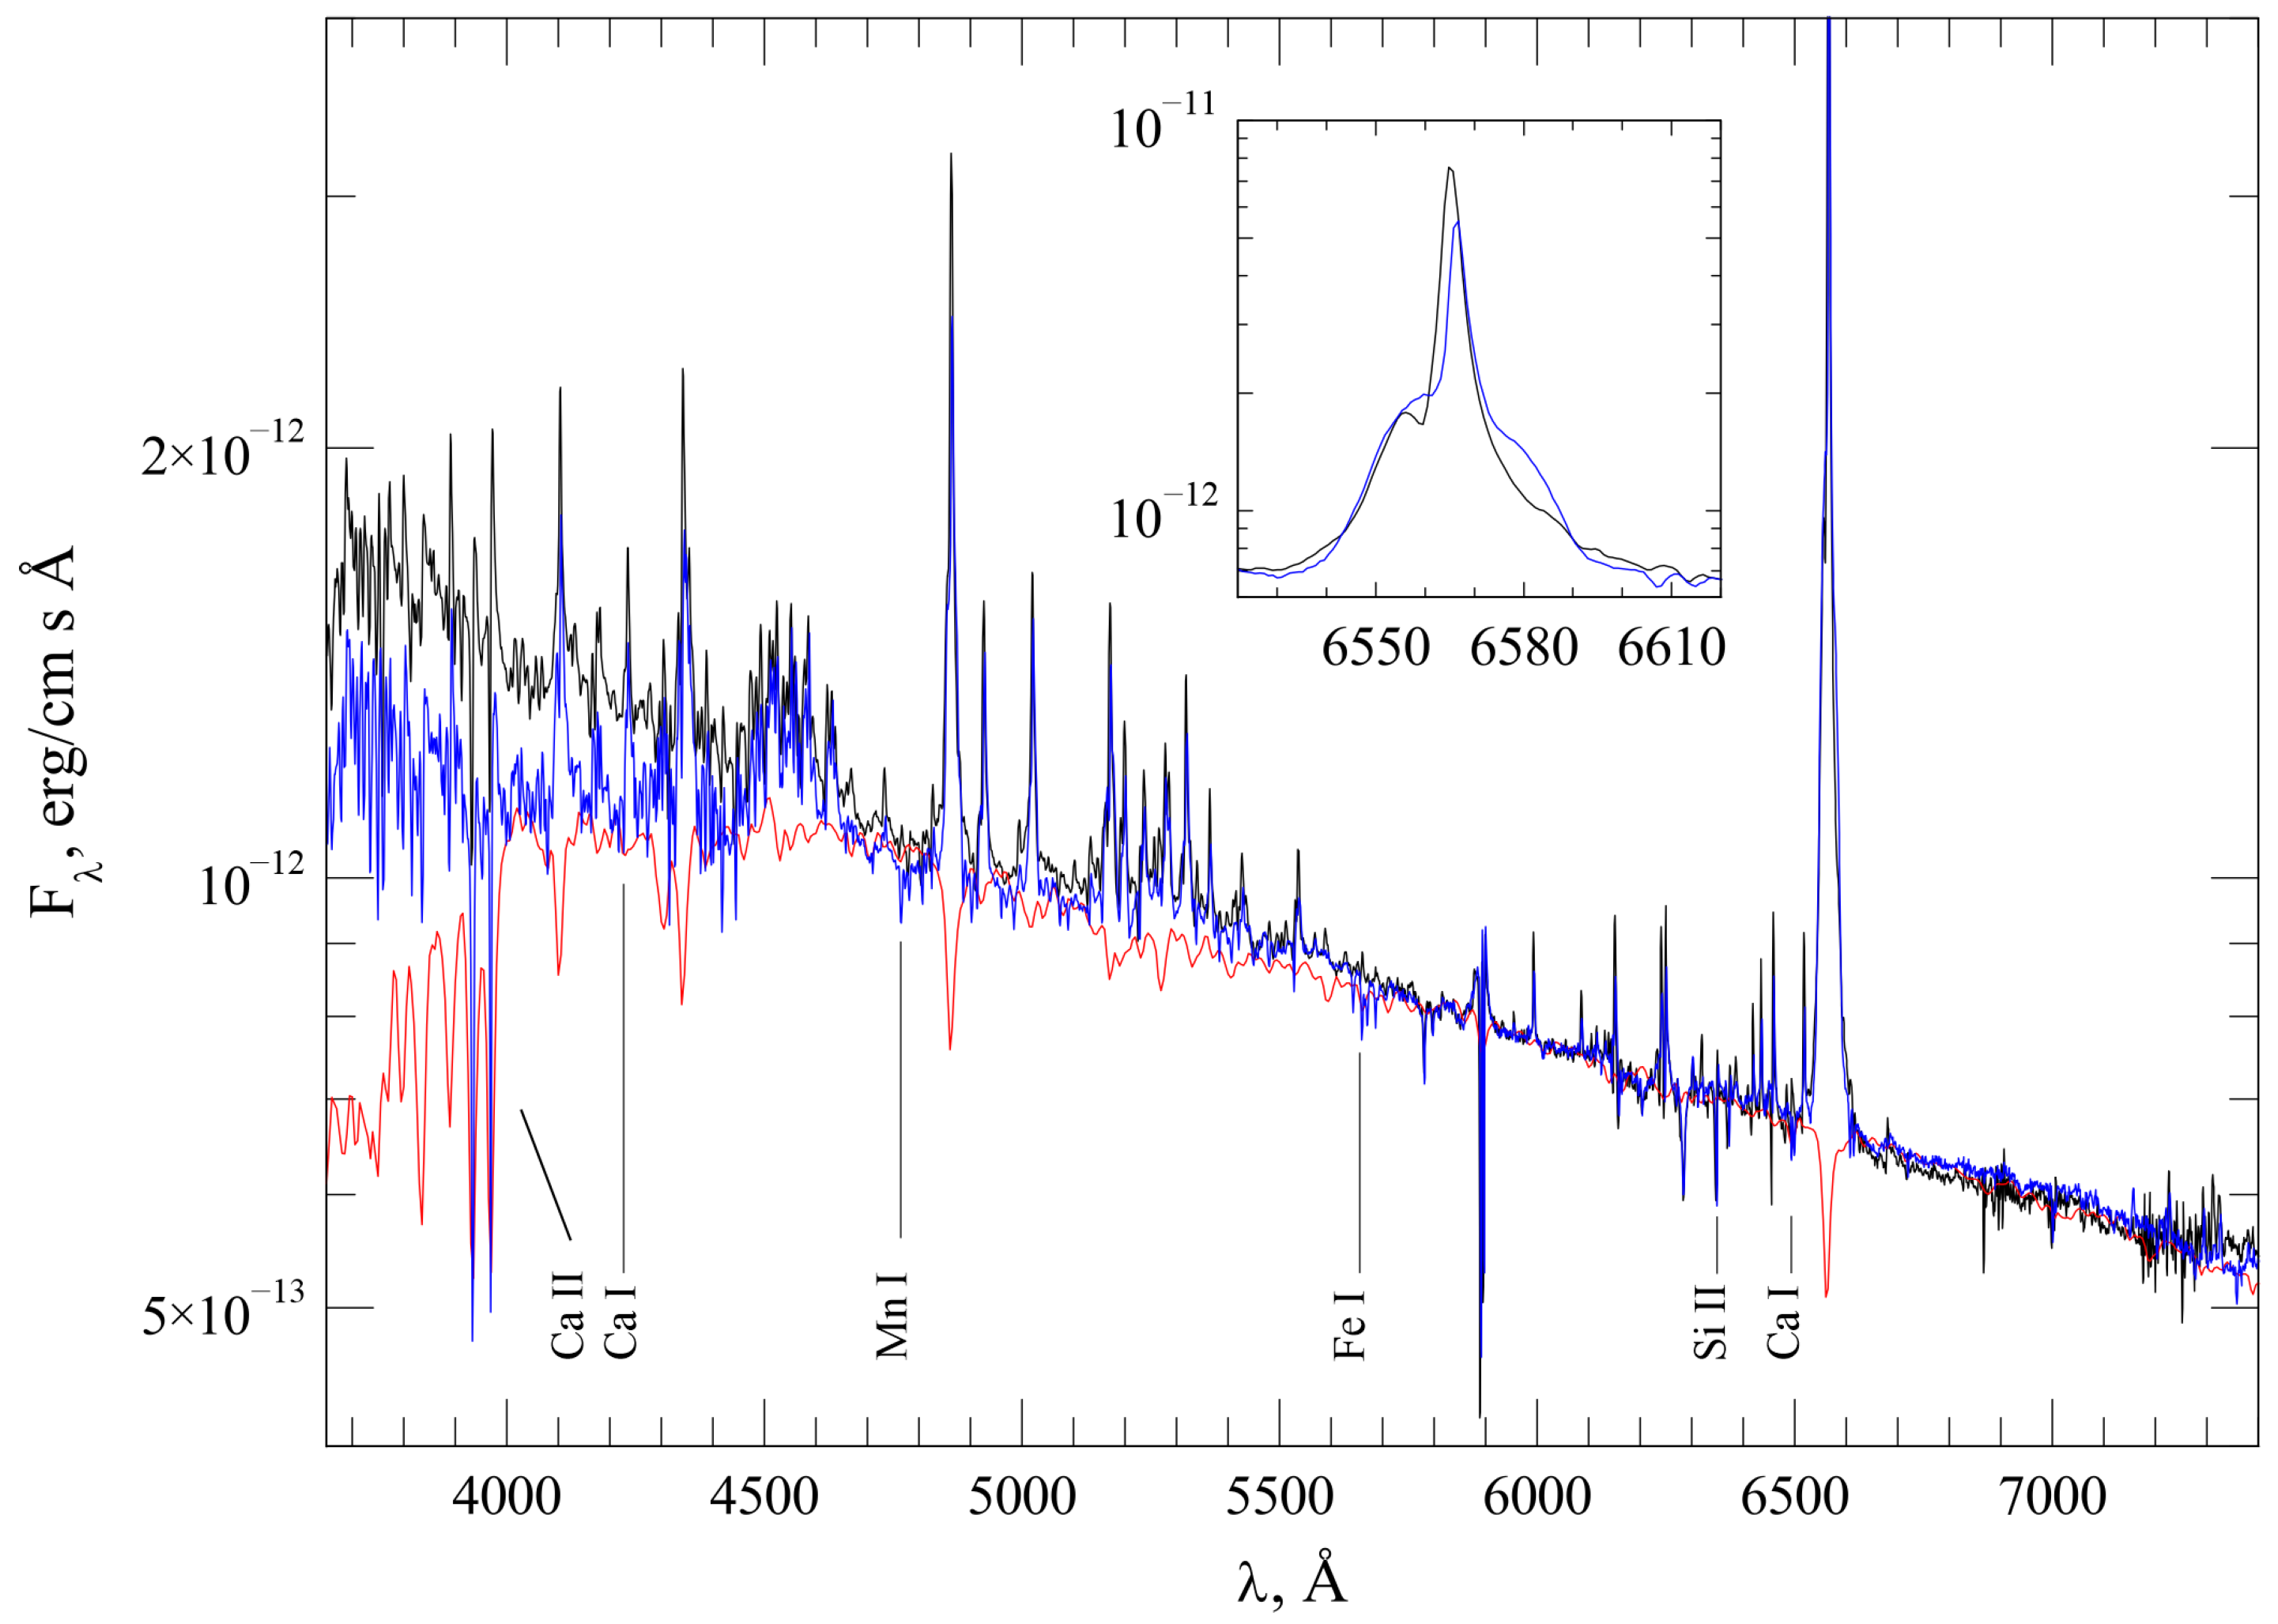
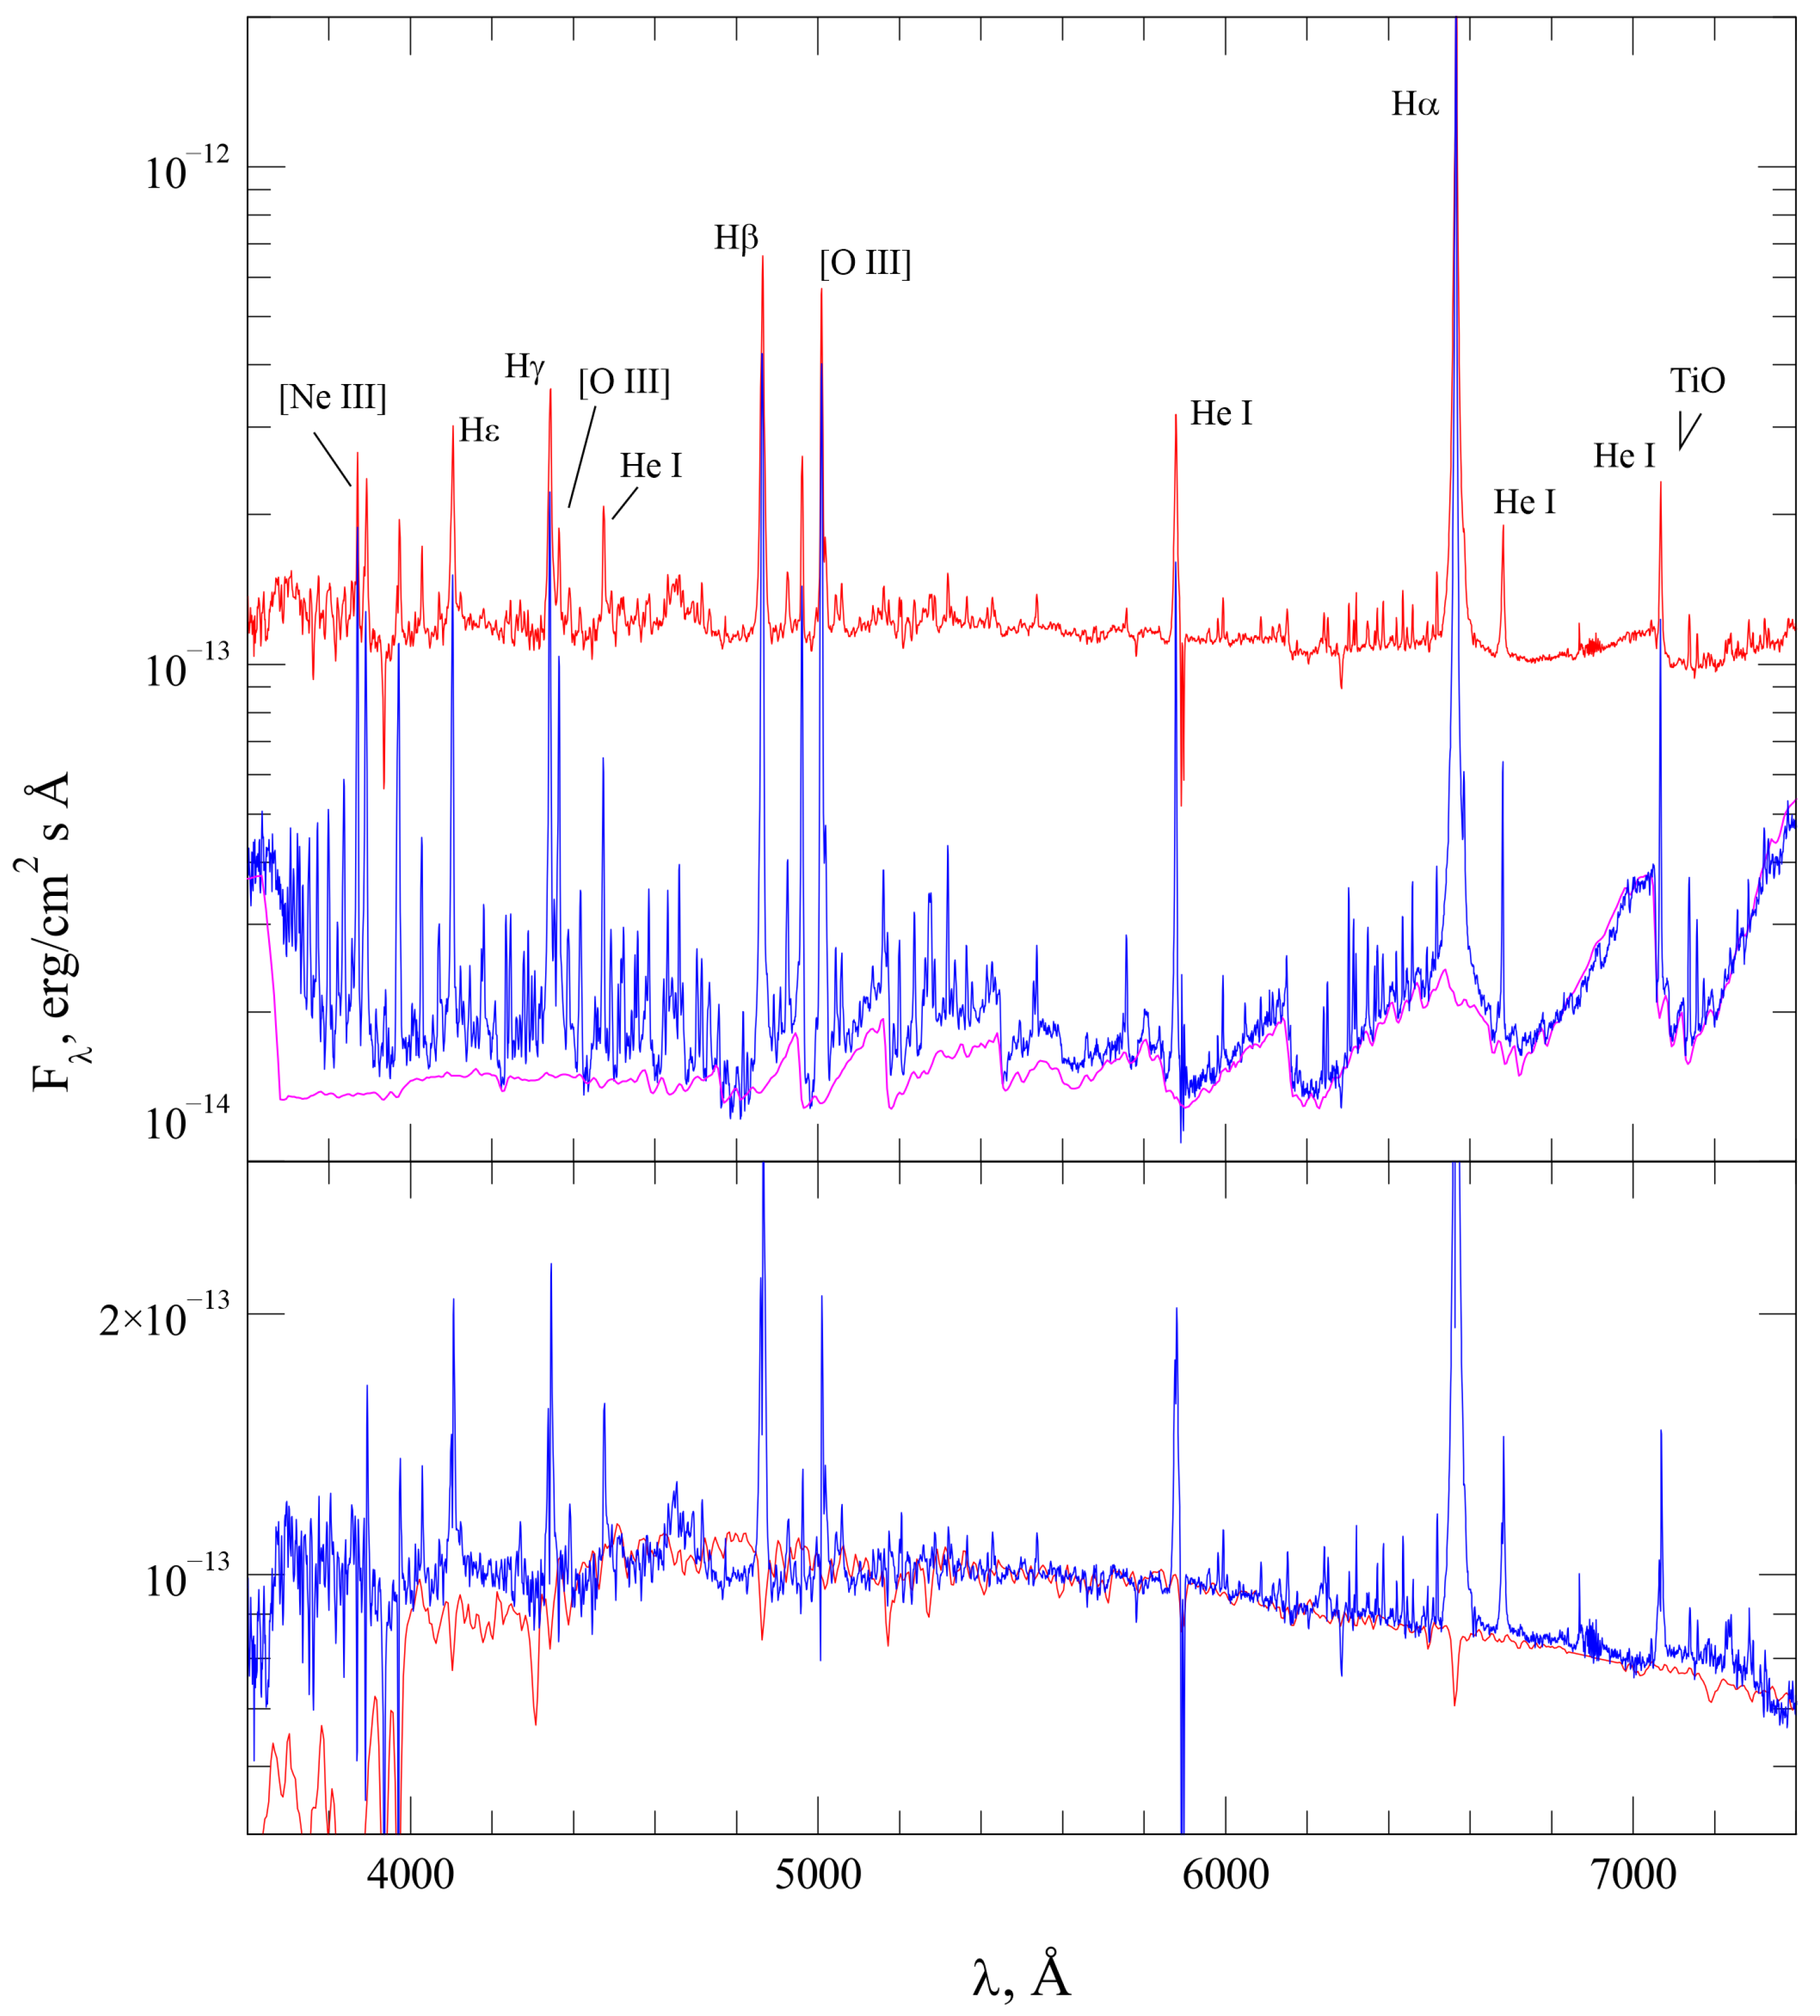
During the 2025 outburst maximum, the emission-line spectrum of V1413 Aql underwent dramatic changes compared to the relatively low-activity state observed in 2023—although that period was not fully quiescent. Not only had the forbidden [O III] and [Ne III] lines disappeared, but for the first time in our observational history, the He I lines were nearly undetectable against the continuum (except for the broad, blended He I 5876Å line, which is affected by the Na I doublet). The spectrum clearly showed hydrogen Balmer lines and a forest of Fe II features, all exhibiting complex, multi-component profiles. Figure 4 shows the H line profile, where a narrow emission component—possibly with a P Cygni-type shape—is superimposed on the broad bell-shaped base with a FWHM of approximately 1450 km/s. This narrow feature closely resembles the H line observed in 2023. Notably, a similar spectral appearance was previously reported for the symbiotic star V407 Cyg during its recurrent nova-like outburst [26], although the broad components of the lines in that case were about twice as wide as those seen in V1413 Aql. A certain resemblance in the H profile is also observed in the classical symbiotic star BF Cyg during its latest outburst [27], which the authors attribute to jet formation.
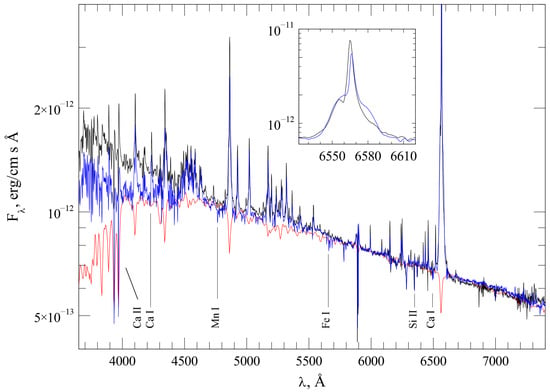
Figure 4.
Dereddened spectra of V1413 Aql obtained during the maxima of the 2020 (2 September 2020, black line) and 2025 (7 May 2025, blue line) outbursts, compared to the spectrum of an F5 III star from [28] (red line).
The absorption features observed in the spectra of V1413 Aql can be divided into three groups. The first group consists of TiO absorption bands belonging to the spectrum of the cool component—an M5-M6 red giant. These bands are most clearly seen in the spectrum obtained on 11 June 2023, during the eclipse minimum (see the bottom spectrum in Figure 5). In contrast, in the spectra taken before and after this minimum (4 May and 18 August), the contribution of the red giant is barely detectable even in the red part of the spectrum—only the longest-wavelength TiO bands remain visible. During the outburst maximum (spectrum of 7 May 2025), molecular bands are almost entirely overwhelmed by the enhanced emission from the flaring hot component (see Figure 4).
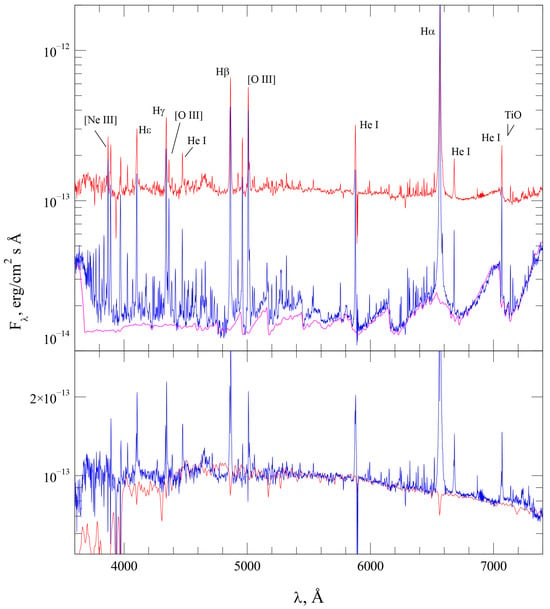
Figure 5.
Upper panel: Dereddened spectra of V1413 Aql obtained on 4 May 2023 (red line, ) and 11 June 2023 (blue line, ). The magenta line represents the model continuum, composed of emission from a nebula with K, an M6 III red giant, and a blackbody with K. Lower panel: The difference between the dereddened spectra of V1413 Aql obtained before the eclipse at and at minimum light (blue line). The red line shows the spectrum of a G0 III star from [28].
The second group consists of the absorption features associated with the interstellar medium. These features are not overwhelmed by the emission from the hot component and remain unaffected by either eclipses or changes in the activity state of the hot star. For example, the diffuse interstellar band at 6282 Å shows an equivalent width of ≥0.6 Å in all our spectra. According to [29], this result supports our adopted value of the color excess, . We note that the Na I doublet lines likely have a complex structure, composed of both interstellar components and features related to the flaring hot component. The latter are significantly weakened during eclipse and may even show weak emission components. Since the Na I D1 and D2 lines lie within the wing of the He I 5876 Å line, they reduce the observed flux in this feature (this effect is accounted for in Table 2).
The third group consists of absorption features associated with the flaring hot component. These features are significantly weakened during the eclipse of the hot star. For example, the Ca II K line was clearly visible in absorption before and after the 2023 eclipse but nearly disappeared during the eclipse itself. The Ca II H line is not seen in absorption, likely due to blending with nearby emission features such as [Ne III] 3968 Å and H I 3970 Å. During the 2025 outburst, absorption lines typical of an F-type giant became clearly visible in the spectrum. Notably, the Si II lines at 6347 and 6371 Å exhibited P Cygni-type profiles. Additional features included Ca I lines at 6494 and 6500 Å, among others (Figure 4). The hydrogen and Fe II absorption lines, which are typically prominent in the spectra of F-type stars, are veiled in our case by the nebular emission lines.
The spectra obtained at the maxima of the 2020 and 2025 outbursts are shown in Figure 4. They are nearly identical at wavelengths longer than 4500 Å. The SED in this range is well represented by the spectrum of an F5 III star [28]. Assuming that the hot component retains a similar spectral shape into the infrared, its luminosity can be estimated as ∼7000 , with a characteristic radius .
The spectra of V1413 Aql obtained between outbursts show significant differences from those presented above. The red line in Figure 5 corresponds to the spectrum taken during the decline of activity prior to the 2023 eclipse (the post-eclipse spectrum from August 2023 is nearly identical and is not considered separately). Unfortunately, we lack coverage in the ultraviolet and infrared ranges, which limits our ability to estimate the luminosities of the system’s components during this phase.
The spectrum obtained during the eclipse minimum at phase clearly shows the contribution of the cool component in the red part of the spectrum and nebular emission in the blue region. However, spectral modeling reveals that an additional source of continuum radiation is required to achieve a good match with the observed spectrum. In Figure 5, the blue line represents the observed spectrum during eclipse, while the magenta line shows its model approximation. The continuum emission of the model, which includes three components—an M6 III-type giant, a nebula with =10,000–12,000 K, and an additional blackbody-like component with = 8000–10,000 K—differs from the observed SED corrected for interstellar extinction by no more than 20%. The luminosity of the cool component is , with a radius . The blackbody component has a luminosity of . It is worth noting that during the subsequent eclipse in 2024, discussed in detail by [30], a similar blackbody component was also detected but with a lower effective temperature of K.
The difference between the spectra shown in Figure 5 allows us to isolate the spectrum of the eclipsed hot component and, thus, estimate its parameters. The lower panel of Figure 5 presents this spectral difference together with the G0 III star template from [28]. The discrepancies between the spectra do not exceed 10% for all wavelengths longer than 4000 Å. Assuming that in the redder part of the spectrum the hot component resembles a G0 III star, we integrate the template spectrum to derive its bolometric flux. For a distance of 6 kpc, the luminosity of the hot component is estimated to be , with a radius of . The derived spectral class of the hot component differs from the above estimate based on photometric data. This discrepancy is due to the significant contribution of nebular emission to the observed spectra.
5. Conclusions
The long duration of our homogeneous observations and the large number of well-defined eclipse minima (see Figure 1) allow us to refine the ephemeris for the eclipses of the hot component in V1413 Aql: . Despite the significant depth of the 2023 minimum (∼2 mag in the V band), the eclipse appears to be partial. This is indicated by the absence of a plateau in the light curve at minimum and by the presence of an additional hot source in the SED.
According to the photometric criterion introduced by [21], V1413 Aql remained in an active state throughout our entire observational period. That is, between the two major outbursts in 2020 and 2025, the hot component of the system did not return to quiescence. This conclusion is further supported by the absence of He II lines in the spectrum. It is worth noting that other classical SySts have also been observed to remain in an active state for extended periods following outbursts. For example, BF Cyg has been in a permanent active phase since 2006 [31].
We determined the parameters of the system components during the 2023 activity minimum. The system consists of an M6 III red giant ( , ), a ‘hot’ component of spectral type G0 III ( , ), and a nebula with an electron temperature of K. Assuming reasonable mass ratios, the red giant appears to fill its Roche lobe. A secondary minimum detected in the infrared light curves by [21] was attributed to ellipsoidal variations caused by the distorted shape of the cool component.
It is worth noting that G0 III is not the latest spectral type assigned to the hot component of V1413 Aql during its active phases. In 2012, during an outburst, the hot component was classified as K2 III [13]. Note that a relatively cool ‘hot’ component has also been observed in the well-known classical SySt CI Cyg, where its temperature was estimated at 4000 K [8]. This is also a high-inclination system, and it is possible that in both CI Cyg and V1413 Aql, the disk is viewed nearly edge-on, with the observed emission originating from its outer, cooler layers. Such a ‘hot’ component does not emit sufficient Lyman-continuum photons to sustain the observed level of nebular emission. A possible explanation for this discrepancy lies in the assumption of a non-spherical geometry of the active ‘hot’ component. In this scenario, the actual ionizing source is a hot subdwarf-type star with K, embedded within a disk-like envelope. Its direct radiation was detected only in an IUE spectrum obtained during quiescence on 10 June 1993 [14]. The similarity in H fluxes observed in June 1993 and in 2023 implies a nearly constant emission measure of the nebula throughout this period.
The nature of the ‘hot’ component in V1413 Aql is most likely associated with an accretion disk. This hypothesis is further supported by the fact that the cool component fills its Roche lobe. The detection of flickering—a characteristic feature of accretion disks—could serve as a decisive argument in determining the nature of the ‘hot’ component. However, repeated attempts by the authors to detect such variability in V1413 Aql were unsuccessful. This may be due to the high orbital inclination of the system, which could obscure such phenomena from view.
The nature of the additional radiation component observed during minimum light—a blackbody with K—remains unclear. The significant difference in size between the eclipsed component (28) and the cool giant (≈130 ), combined with the absence of a plateau in the light curve at minimum, suggests that the eclipse is not central. As a result, part of the ’hot’ component may remain visible during eclipse. In the case of a disk-like geometry, this exposed region could be hotter than the star. An orbital inclination angle of to the line of sight would be consistent with these observations. This value is in good agreement with the result reported by [30].
As noted in the Introduction, there is some uncertainty regarding the value of the color excess for V1413 Aql. All component parameters presented in this study were derived using . If we adopt the higher reddening estimate of , based on the 3D dust maps of [16], this would result in changes to the color indices (e.g., would decrease by 0.06,mag) and fluxes (by 10–25% in the bands). The luminosity of the hot component at the 2025 outburst maximum would increase by approximately 20%, and its spectral type would shift to F3–F4. The color indices of the eclipsed component would also change, leading to a revised spectral type estimate—from F5–F7 to F3–F6. Other parameters are similarly affected: the emission measure derived from the spectrum obtained on 6 June 2023 would increase by about 40%, the luminosity of the additional continuum source observed during the 2023 minimum would rise by ≈20%, and the luminosity of the cool component would increase by approximately 4%.
In classical SySts, ordinary outbursts are typically events involving a redistribution of energy, with little or no change in the intrinsic luminosity of the hot component. However, the last two outbursts of V1413 Aql deviate from this behavior. The luminosity of the flaring hot component reached 7000 , nearly four times higher than its quiescent-state luminosity [14]. It is worth noting that similar luminosity increases—up to a factor of ten—have been observed in other symbiotic systems such as AG Dra [32], AG Peg [33], Gaia18aen [34], and V4141 Sgr [35]. However, in the first two systems, the outbursts did not involve the A-F supergiant stage.
Author Contributions
Conceptualization, A.T. (Anna Tatarnikova); investigation, N.I., M.B., A.B. and G.N.; software, A.D. and N.M.; formal analysis, A.T. (Andrey Tatarnikov) and M.B.; data curation, N.M., N.I., M.B. and A.B.; writing—original draft preparation, A.T. (Anna Tatarnikova) and A.T. (Andrey Tatarnikov); writing—review and editing, A.T. (Andrey Tatarnikov) and M.B. All authors have read and agreed to the published version of the manuscript.
Funding
The work of A.D. (preliminary processing and calibration of low-resolution spectra) and N.M. (catalog data handling, spectral data reduction, and result analysis) was supported by the Russian Science Foundation (grant 23-12-00092).
Data Availability Statement
Photometric data and original spectra reported in this study are available on request to the Andrey T. via email at andrew@sai.msu.ru.
Acknowledgments
This work was carried out using equipment purchased with support from the Development Program of the Lomonosov Moscow State University. The research makes use of the SIMBAD database (CDS, Strasbourg, France) and NASA’s Astrophysics Data System (ADS). N. Maslennikova acknowledges support from Theoretical Physics and Mathematics Advancement Foundation ”BASIS” (grant 22-2-10-21-1).
Conflicts of Interest
The authors declare no conflicts of interest.
Abbreviations
The following abbreviations are used in this manuscript:
| CMO | Caucasian Mountain Observatory |
| SySt | Symbiotic Star |
| TDS | Transient Double-beam Spectrograph |
| SED | Spectral Energy Distribution |
References
- Merrill, P.W.; Burwell, C.G. Additional Stars whose Spectra have a Bright H α Line. Astrophys. J. 1950, 112, 72. [Google Scholar] [CrossRef]
- Allen, D.A. Infrared observations of northern emission-line stars. Mon. Not. R. Astron. Soc. 1974, 168, 1. [Google Scholar] [CrossRef]
- Allen, D.A. A catalogue of symbiotic stars. Publ. Astron. Soc. Aust. 1984, 5, 369–421. [Google Scholar] [CrossRef]
- Tatarnikova, A.A.; Tatarnikov, A.M.; Tarasova, T.N. Determining the Physical Parameters of the System V1413 Aql in Its Quiescent and Active States in 2012–2017. Astron. Lett. 2020, 46, 24–37. [Google Scholar] [CrossRef]
- Munari, U.; Yudin, B.F.; Sostero, G.; Lepardo, A. V1413 Aquilae. IAU Circ. 1993, 5884, 2. [Google Scholar]
- Boyarchuk, A.A. The Binary Nature of Z Andromedae. Sov. Astron. 1968, 11, 818. [Google Scholar]
- Kenyon, S.J.; Webbink, R.F. The nature of symbiotic stars. Astrophys. J. 1984, 279, 252–283. [Google Scholar] [CrossRef]
- Mikolajewska, J.; Mikolajewski, M. A spectrophotometric study of CI Cygni during the 1980 eclipse. Acta Astroomica 1983, 33, 403–429. [Google Scholar]
- Munari, U. Studies of symbiotic stars. VI. The eclipsing symbiotic nova AS 338. Astron. Astrophys. 1992, 257, 163–176. [Google Scholar]
- Siviero, A.; Munari, U.; Moretti, S.; Graziani, M.; Tomaselli, S.; Gualdoni, C. Absolute Dimensions of the Outbursting WD in the Symbiotic Nova as 338 from Mapping of the 2005 Eclipse. Balt. Astron. 2007, 16, 55–58. [Google Scholar]
- Wakuda, M. Photographic observations of eclipsing of AS 338. Var. Star Bull. 1988, 5, 17–18. [Google Scholar]
- Schulte-Ladbeck, R. AS 338 in Outburst, or how i Found my “PET Symbiotic”. Messenger 1985, 39, 3. [Google Scholar]
- Esipov, V.F.; Tarasova, T.N.; Tatarnikov, A.M.; Tatarnikova, A.A. Spectral evolution of the classical symbiotic star V1413 Aql during a new activity cycle. Astron. Lett. 2013, 39, 458–473. [Google Scholar] [CrossRef]
- Esipov, V.F.; Kolotilov, E.A.; Mikolajewska, J.; Munari, U.; Tatarnikova, A.A.; Tatarnikov, A.M.; Tomov, T.; Yudin, B.F. Evolution of the Symbiotic Star AS338 after Its Strong Outburst in 1983. Astron. Lett. 2000, 26, 162–176. [Google Scholar] [CrossRef]
- Bailer-Jones, C.A.L.; Rybizki, J.; Fouesneau, M.; Demleitner, M.; Andrae, R. Estimating Distances from Parallaxes. V. Geometric and Photogeometric Distances to 1.47 Billion Stars in Gaia Early Data Release 3. Astron. J. 2021, 161, 147. [Google Scholar] [CrossRef]
- Green, G.M. A 3D Dust Map Based on Gaia, Pan-STARRS 1, and 2MASS. Astrophys. J. 2019, 887, 27. [Google Scholar] [CrossRef]
- Berdnikov, L.N.; Belinskii, A.A.; Shatskii, N.I.; Burlak, M.A.; Ikonnikova, N.P.; Mishin, E.O.; Cheryasov, D.V.; Zhuiko, S.V. BVIc Observations and Search for Evolutionary Variations in the Cepheid V811 Oph Period. Astron. Rep. 2020, 64, 310–318. [Google Scholar] [CrossRef]
- Potanin, S.A.; Belinski, A.A.; Dodin, A.V.; Zheltoukhov, S.G.; Lander, V.Y.; Postnov, K.A.; Savvin, A.D.; Tatarnikov, A.M.; Cherepashchuk, A.M.; Cheryasov, D.V.; et al. Transient Double-Beam Spectrograph for the 2.5-m Telescope of the Caucasus Mountain Observatory of SAI MSU. Astron. Lett. 2020, 46, 836–854. [Google Scholar] [CrossRef]
- Kolotilov, E.A.; Mikolajewska, J.; Marrese, P.M.; Munari, U.; Shugarov, S.Y.; Yudin, B.F. Minimum on the Light Curve of the Classical Symbiotic Star AS 338 in 1999. Astron. Lett. 2001, 27, 51–57. [Google Scholar] [CrossRef]
- Kolotilov, E.A.; Komissarova, G.V.; Tatarnikova, A.A.; Tatarnikov, A.M.; Shenavrin, V.I. New activity cycle of the classical symbiotic star V1413 Aql. Astron. Lett. 2012, 38, 468–473. [Google Scholar] [CrossRef]
- Tatarnikova, A.A.; Tatarnikov, A.M.; Kolotilov, E.A.; Shenavrin, V.I.; Komissarova, G.V. Quiescent and Active States of V1413 Aql I: Photometric Activity Criterion and the Detection of a Secondary Minimum. Astron. Lett. 2018, 44, 803–810. [Google Scholar] [CrossRef]
- Esipov, V.F.; Kolotilov, E.A.; Komissarova, G.V.; Shenavrin, V.I.; Shugarov, S.Y.; Tarasova, T.N.; Tatarnikov, A.M.; Tatarnikova, A.A. Spectral and photometric monitoring of the classical symbiotic star V1413 Aql in 2008–2013. Contrib. Astron. Obs. Skaln. Pleso 2014, 43, 485–486. [Google Scholar]
- Baker, J.G.; Menzel, D.H. Physical Processes in Gaseous Nebulae. III. The Balmer Decrement. Astrophys. J. 1938, 88, 52. [Google Scholar] [CrossRef]
- Proga, D.; Mikolajewska, J.; Kenyon, S.J. Hei Emission Lines in Symbiotic Stars. Mon. Not. R. Astron. Soc. 1994, 268, 213. [Google Scholar] [CrossRef]
- Mikolajewska, J.; Kenyon, S.J.; Mikolajewski, M. On the Nature of the Symbiotic Star BF Cygni. Astron. J. 1989, 98, 1427. [Google Scholar] [CrossRef]
- Munari, U.; Joshi, V.H.; Ashok, N.M.; Banerjee, D.P.K.; Valisa, P.; Milani, A.; Siviero, A.; Dallaporta, S.; Castellani, F. The 2010 nova outburst of the symbiotic Mira V407 Cyg. Mon. Not. R. Astron. Soc. 2011, 410, L52–L56. [Google Scholar] [CrossRef]
- Skopal, A.; Tomov, N.A.; Tomova, M.T. Discovery of collimated ejection from the symbiotic binary BF Cygni. Astron. Astrophys. 2013, 551, L10. [Google Scholar] [CrossRef]
- Pickles, A.J. A Stellar Spectral Flux Library: 1150–25000 Å. Publ. Astron. Soc. Pacific 1998, 110, 863–878. [Google Scholar] [CrossRef]
- Friedman, S.D.; York, D.G.; McCall, B.J.; Dahlstrom, J.; Sonnentrucker, P.; Welty, D.E.; Drosback, M.M.; Hobbs, L.M.; Rachford, B.L.; Snow, T.P. Studies of Diffuse Interstellar Bands V. Pairwise Correlations of Eight Strong DIBs and Neutral Hydrogen, Molecular Hydrogen, and Color Excess. Astrophys. J. 2011, 727, 33. [Google Scholar] [CrossRef]
- Boyd, D.; Cejudo, D.; Foster, J.; Sims, F.; Walker, G. Photometry and Spectroscopy of the Symbiotic Binary V1413 Aquilae during the 2024 Eclipse. arXiv 2025, arXiv:2504.01465. [Google Scholar]
- Tomova, M. A look into the behaviour of BF Cygni after 2009. Contrib. Astron. Obs. Skaln. Pleso 2025, 55, 112–116. [Google Scholar] [CrossRef]
- Mikolajewska, J.; Kenyon, S.J.; Mikolajewski, M.; Garcia, M.R.; Polidan, R.S. Evolution of the Symbiotic Binary System AG Draconis. Astron. J. 1995, 109, 1289. [Google Scholar] [CrossRef]
- Skopal, A.; Shugarov, S.Y.; Sekeráš, M.; Wolf, M.; Tarasova, T.N.; Teyssier, F.; Fujii, M.; Guarro, J.; Garde, O.; Graham, K.; et al. New outburst of the symbiotic nova AG Pegasi after 165 yr. Astron. Astrophys. 2017, 604, A48. [Google Scholar] [CrossRef]
- Merc, J.; Mikołajewska, J.; Gromadzki, M.; Gałan, C.; Iłkiewicz, K.; Skowron, J.; Wyrzykowski, Ł.; Hodgkin, S.T.; Rybicki, K.A.; Zieliński, P.; et al. Gaia18aen: First symbiotic star discovered by Gaia. Astron. Astrophys. 2020, 644, A49. [Google Scholar] [CrossRef]
- Merc, J.; Mikołajewska, J.; Petit, T.; Monard, B.; Charbonnel, S.; Garde, O.; Le Dû, P.; Mulato, L.; Kojima, T. V4141 Sgr: Outflows and repeated outbursts. Astron. Astrophys. 2025, 698, L4. [Google Scholar] [CrossRef]
Disclaimer/Publisher’s Note: The statements, opinions and data contained in all publications are solely those of the individual author(s) and contributor(s) and not of MDPI and/or the editor(s). MDPI and/or the editor(s) disclaim responsibility for any injury to people or property resulting from any ideas, methods, instructions or products referred to in the content. |
© 2025 by the authors. Licensee MDPI, Basel, Switzerland. This article is an open access article distributed under the terms and conditions of the Creative Commons Attribution (CC BY) license (https://creativecommons.org/licenses/by/4.0/).

