Article

Looking for Signs of Unresolved Binarity in the Continuum of LAMOST Stellar Spectra

by
Mikhail Prokhorov
1,*,
Kefeng Tan
2,
Nikolay Samus
1,3,
Ali Luo
2,
Dana Kovaleva
3,
Jingkun Zhao
2,
Yujuan Liu
2,
Pavel Kaygorodov
3,
Oleg Malkov
3,
Yihan Song
2,
Sergey Sichevskij
3,
Lev Yungelson
3 and
Gang Zhao
2
1
Sternberg Astronomical Institute, Moscow State University, 13 Universitetsky pr., Moscow 119991, Russia
2
National Astronomical Observatories, Chinese Academy of Sciences, Beijing 100101, China
3
Institute of Astronomy, Russian Academy of Sciences, Pyatnitskaya 48, Moscow 119017, Russia
*
Author to whom correspondence should be addressed.
Galaxies 2025, 13(4), 83; https://doi.org/10.3390/galaxies13040083
Submission received: 1 May 2025 / Revised: 5 July 2025 / Accepted: 25 July 2025 / Published: 30 July 2025
(This article belongs to the Special Issue Stellar Spectroscopy, Molecular Astronomy and Atomic Astronomy)

Abstract

We describe an attempt to derive the binarity rate of samples of 166 A-, F-, G-, and K-type stars from LAMOST DR5 and 1000 randomly selected presumably single stars from Gaia DR3 catalogs. To this end, we compared continua of the observed spectra with the continua of synthetic spectra from within 3700 < λ < 9097 Å. The latter spectra were reduced to the LAMOST set of wavelengths, while the former ones were smoothed. Next, we searched for every observed star of the nearest synthetic spectrum using a four-parameter representation— T eff , log g , [ Fe / H ] , and a range of interstellar absorption values. However, rms deviations of observed spectra from synthetic ones appeared to be not sufficient to claim that any of the stars is a binary. We conclude that comparison of the intensity of pairs of spectral lines remains the best way to detect binarity.

1. Introduction

Binary stars are very numerous, and binarity rate estimates increase from ≃(20–30)% for M-dwarfs to ≃(60–70)% for A-type ones, while extreme ones for O stars reach (94 ± 14)% 1 [1,2,3,4]. The importance of correct estimation of binarity rate is due to the role of binaries in formation of many extreme astrophysical objects, e.g., Supernovae, X-ray sources, gravitational wave sources, as well as formation of populations of stars of certain types, for instance, cataclysmic variables. No less important is the significance of the estimates of binarity rate for understanding star formation, dynamics of stellar aggregates, etc. (see, e.g., [5,6,7,8,9,10]).
Extensive sets of observational data for the stellar population of the Galaxy became available recently, as a result of several surveys. Among the most notable ones are the astrometric survey Gaia [11,12], multi-band survey SDSS [13], and spectroscopic surveys (see below). One may expect that a large proportion of the objects in these surveys are unresolved binary stars.
There are a number of approaches for resolving hidden binaries and assessing their characteristics, which employ different samples of observable characteristics and differ in the scope of physical and observable parameters of unresolved binaries that they may recover.
For the Gaia sources, the methods of detecting probable unresolved binaries based on Gaia supplementary information about astrometric solutions are proposed [14,15]. The methods based solely on photometric information [16,17] require a combined multicolor photometry. A variety of methods use a combination of photometric information and trigonometric parallaxes [18,19,20]. A combination of the data from several surveys may also be helpful for finding unresolved binaries. Each of these methods is able to reveal a certain fraction of the population of unresolved binary stars using the multidimensional space of observational parameters. Unfortunately, no one of them is universal, so they may be considered as intercomplementary.
Along with astrometric and photometric surveys, spectroscopic surveys, such as LAMOST [21], RAVE [22], GALAH [23], APOGEE [24,25], and GES [26,27], are an invaluable provider of information about unresolved binary systems. Spectroscopic binaries are, on the one hand, a fairly representative observational class of objects, and on the other hand, the parameters obtained from solving the spectroscopic orbit include almost all the orbital elements and the astrophysical parameters of the components. Compared with visual binaries, spectroscopic binaries have relatively short orbital periods. With this property, it is easier to construct their full orbital solutions by observing two stars orbiting each other multiple times. Spectroscopic searches make it possible to apprehend how unresolved binarity affects spectra of the sources [8,28,29].
Spectroscopic surveys have greatly enlarged the number of spectroscopic binaries by providing millions of spectra. For instance, Birko et al. [30] identified 3838 SB1 candidates using RAVE and Gaia DR2 data and estimated the most probable orbital parameters of main-sequence dwarf candidates. Price-Whelan et al. [31] discovered 19,635 APOGEE-SB1s and gave multiple possible orbital solutions for each system. Traven et al. [32] presented 12,760 binaries detected as SB2s in GALAH. Merle et al. [33] found 641 FGK SB1 candidates at the 5 σ level in GES.
LAMOST is a special quasi-meridian reflecting Schmidt telescope with an effective aperture of 4 m and a field of view of 20 deg2. The unique design of LAMOST enables it to acquire 4000 spectra in a single exposure [34,35]. Up until now it has obtained more than 11 million low-resolution ( R = 1800 ) spectra and more than 13 million medium-resolution ( R = 7500 ) spectra.
LAMOST is an invaluable provider of data on new spectral binary systems. Numerous and consistently successful attempts have been made to detect unresolved binaries in the LAMOST medium-resolution spectroscopic survey. Ref. [19] presented a data-driven method to estimate absolute magnitudes for O- and B-type stars from the LAMOST spectra. The inferred spectroscopic K s -band magnitudes M K s were compared with the geometric M K s magnitudes derived from Gaia parallaxes to identify binaries. Ref. [19] identified 1597 of the 16,002 LAMOST OB stars as binaries. Li et al. [36] examined radial velocities of over 1.3 million LAMOST DR7 medium-resolution blue-arm spectra and found 3133 spectroscopic binaries (SB) and 132 spectroscopic candidate triples (ST). An overwhelming majority of these stars are new discoveries. Ref. [37] investigated the binarity of 9382 stars measuring the equivalent widths of several spectral lines in the LAMOST medium-resolution spectra. The binary fraction found by them ranges from 68 ± 8% for O- to B4-type stars to 44 ± 6% for B8 to A stars. At the same time, the results of searches for unresolved binaries in the low-resolution LAMOST survey are rather scarce [38,39].
Thus, LAMOST is the largest spectroscopic survey in terms of the volume of data obtained and the widest in terms of coverage of the sky. The low-resolution LAMOST spectra collection is no less representative than the medium-resolution one. There are not enough large spectroscopic surveys now to ignore this set of spectra. Additionally, LAMOST low-resolution spectroscopy has accumulated data for nearly nine years; thus, there are multiple observations for a significant number of sources. Examination of these sources may increase the number of known binary systems and give us additional information about the ensemble of binary stars in the Galaxy. In the present study we aim to investigate the options to discover the population of unresolved binaries using low-resolution spectra from LAMOST using synthetic spectra.
If the stellar spectrum is the main information about the star, then, in order to infer that the star is a binary, one needs to find the deviation of its spectrum from that of a single star—an excess due to the light from the second, fainter component.
The methods of obtaining stellar parameters from low-resolution stellar spectra were developed and widely applied to a substantial number of spectra in recent wide-scale spectroscopic surveys [40,41,42].
In parallel to these methods, other ones, based on multi-color photometric data, were developed and widely used. The reason for the popularity of the latter, despite their accuracy in determining the physical parameters of stars not being high, is that photometry, as accurate as spectrophotometry, can be obtained with much smaller telescopes.
The main trend in the development of stellar spectra analysis is improvement in the accuracy of determination of stellar physical parameters (for example, it is possible to derive the effective temperature of a star, T eff , with an uncertainty of several Kelvins). Therefore, the methods based on the analysis of the continuum are now out of use: they do not provide stellar parameters with adequate precision. However, in this paper we will test the effectiveness of the method for detecting unresolved binary stars by comparing their observed continuum (in the LAMOST project) with synthetic spectra of single stars.
In Section 2 and Section 3, we discuss cross-identification of data of Gaia DR3 and LAMOST with selected lists of close binaries and presumably single stars. Section 4 describes modeling of spectra of unresolved binaries. Section 5 discusses results of testing approaches for distinguishing between single and unresolved binaries, comparing LAMOST spectra with sets of synthetic theoretical spectra of single stars, prepared in advance. Section 6 presents our conclusions.

2. Data: LAMOST Spectra

We use the LAMOST DR5 [43] catalog of A-, F-, G- and K-type stars, which contains stellar parameters ( T eff , log g , and [ Fe / H ] ) for more than 5 million low-resolution ( R = 1800 at 5500 Å) stellar spectra. The wavelength range of the spectra is about 3690–9100 Å. The signal-to-noise ratio (SNR) is larger than 6 (in the g-band) for the spectra obtained during dark nights, and it is larger than 15 for the spectra obtained during bright nights. The acquisition of spectra and processing of LAMOST data are described in detail in a number of papers (see [44] and references therein). We will not repeat them in this paper.
Currently, the most frequently used methods for determining the parameters of stars are those based on the analysis of the ratios of the depth of spectral line pairs (see, e.g., [45,46,47]). The lines of the pair should have sufficiently close wavelengths in order to eliminate the effects of interstellar extinction to the greatest possible extent. Different line pairs are used for different spectral types. The “classical” line set is presented in [48] (Table 15.3).
Line pairs analysis requires high-resolution spectra, but this is not the case for LAMOST spectra. Luo et al. [21] developed a different method for them. It is based on minimizing the squared difference between the observational and model spectra. This method is used both for the spectral classification of stars in the catalog and for the determination of the values of T eff , log g , and [ Fe / H ] .
It should be noted that while determining physical parameters from stellar spectra we attempted to achieve the best accuracy, but we can be satisfied with a rather rough parameter determination, only to be able to detect excess radiation from the binary’s second star. Thus, in principle, all of the above methods are suitable for us.
The quality of calibration of LAMOST spectra is important for solving our problem. For the LAMOST flux calibration, the LAMOST 2D pipeline picks out several high-S/N standards in the temperature range of 5750–7250 K and then obtains the spectrograph response curve (SRC) by comparing the observed spectra with synthetic spectra (using the corresponding parameters from the Castelli–Kurucz spectral library [49]). As a result, the dereddening uncertainties of standards have an impact on the SRC derivation. This introduces uncertainties to all spectra of the spectrograph for one plate. For a few spectra (∼2%), flux calibrations are completed using the average response curve of each spectrograph (ASPSRC) method [50]. This method has some uncertainties caused by variations in the shape of individual SRCs, which introduces uncertainties to the calibrated spectra. The statistical analysis presented in Du et al. [50] revealed that the total uncertainties caused by the LAMOST flux calibration in the spectra are less than 10%.
The rest of the present paper deals with the method of detecting unresolved binary stars in the LAMOST catalog by the analysis of the spectral continuum.

3. Data: Known Single and Binary Stars

To investigate the possibility of distinguishing between single and unresolved binary stars from LAMOST spectra, we need to know what might be systematic differences between actual LAMOST spectra of single and binary stars. For this purpose, we compiled two data sets of LAMOST spectra. The first one contains sources identified with known close binary stars, which cannot be resolved by LAMOST (the fiber diameter of LAMOST is about 3.3 arcsec). Another set contains presumably single stars identified by cross-matching the LAMOST DR5 source catalog with selected catalogs, as described below.

3.1. Reliable Unresolved Binary Stars

For the stars to be included in the test list of binaries for modeling, we required them to be definitely binary and to have known spectral types of components. No multiple systems were accepted. These requirements are met by the objects from the ninth catalog of Spectroscopic Binary Orbits, SB9 2. This catalog continues the series of compilations of spectroscopic orbits carried out over 35 years by A. Batten and his collaborators and is continuously updated. As of 2023, the catalog contains about 5000 orbits for about 4000 systems. Note that SB9 binary stars usually contain two similar components, i.e., with mass ratio m 2 / m 1 1 . There are 10 stars common to the LAMOST DR5 catalog. Two observations were found in the catalog for one of these stars; thus, in total, we possess 11 spectra.

3.2. Reliable Single Stars

We selected from several catalogs single stars that were highly reliably not binary or multiple. These catalogs are listed below with brief comments:
  • Compilation of spectra of single stars, mostly Praesepe and M67 spectral standards [52]. There is N o v = 1 star overlapping with the LAMOST DR5 catalog.
  • ELODIE.3.1—an updated release of the library published in Prugniel et al. [53]. N o v = 15.
  • The Indo-US Library of Coudé Feed Stellar Spectra [54] containing spectra of 1273 stars obtained using the 0.9 m Coudé feed telescope at Kitt Peak National Observatory. N o v = 30.
  • LCO-SL, the Las Campanas Observatory Stellar Library 3, which is the most comprehensive near-infrared spectral library with 1300+ spectra obtained between 2013 and 2017 using the Folded-port InfraRed Echellette (FIRE) spectrograph operated using the 6.5 m Magellan Baade telescope. N o v = 12.
  • MILES—the library of spectra obtained by the 2.5 m Isaac Newton Telescope used, in particular, for stellar population synthesis [55]. N o v = 25.
  • Hubble’s Next-Generation Spectral Library (NGSL) containing ∼1000 spectra of 380 stars of assorted temperature, gravity, and metallicity. Each spectrum covers the wavelength range 0.18–1.03 μ [56] 4. N o v = 6.
  • The Tian Shan (Alma-Ata) Sternberg Astronomical Institute photometric W B V R catalog of 13,586 bright northern-sky stars [57]. The catalog contains both single stars and double (multiple) systems. For single stars, N o v = 102 .
  • The latest issue of the astrometric fundamental star catalog, FK6 [58], a combination of results from ground-based observations and from the Hipparcos project of space astrometry. N o v = 1 .
After exclusion of overlapping objects, the list contains 166 stars. For these stars, we find 278 observations (spectra) in the LAMOST DR5 catalog. Hereafter, we will refer to this sample as the main list of single stars, Main_Single.

3.3. Presumably Single and Unresolved Binary Stars

The number of reliable single stars identified with LAMOST DR5 objects was too low to provide a representative sample, so we added a number of stars that we presumed to be single and to be unresolved binaries, employing the data from Gaia DR3.

3.3.1. Presumably Single Stars

For this purpose, we cross-matched the LAMOST DR5 A-, F-, G-, and K-type star catalog [43] with Gaia DR3, using a standard X-Match CDS procedure with a radius of matching 1 , under the condition that there was no other Gaia source within the radius of 4 from the LAMOST star, to avoid doubtful matches. We selected only Gaia DR3 sources with five-parametric solutions without “duplicate source” and “variable source” flags, which, by Gaia DR3 classification, have zero probability of being a galaxy or a quasar ( c l a s s p r o b _ d s c _ c o m b m o d _ q u a s a r = 0 and c l a s s p r o b _ d s c _ c o m b m o d _ g a l a x y = 0 ) and are most probably single stars ( c l a s s p r o b _ d s c _ c o m b m o d _ s t a r > 0.99 ) [59]. Further, we used photometry data to filter out probable mismatches based on comparison of photometric magnitude measurements. This filter is tentative, as the data on LAMOST sources after automatic processing of their spectra may contain several photometric magnitudes in different bands and not all of them are obligatorily presented. So, we filtered out stars with one of the LAMOST stellar magnitudes differing from Gaia G-magnitude by more than 3 rms in the entire sample of matched LAMOST–Gaia stars.
Next, we have filtered out the stars matching with Gaia sources with any indication of being non-single, astrometrically, photometrically, or spectroscopically. We have selected stars in close vicinity of the Sun (having parallax ϖ 5 , e.g., approximately within 200 pc) to make possibly unresolved components discoverable. It was required that the matched sources in Gaia had Renormalized Unit Weight Error r u w e < 1.4 [60] and corrected flux excess factors indicating no inconsistency between BP, RP, and G fluxes [61], since it was demonstrated that these factors may indicate duplicity of the source (see, e.g., [62]). Finally, we have checked that the remaining dataset did not contain stars marked as Gaia unresolved non-single sources [63].
The resulting list of presumably single Gaia sources cross-identified with LAMOST contains 6220 stars. Hereafter, we will name this sample Gaia list of single stars Gaia_Single.

3.4. Gaia Non-Single Stars

To increase the number of unresolved binary stars identified with LAMOST DR5 objects, we added a number of stars that are marked as presumably unresolved binary stars in the Gaia DR3 non-single star (NSS) catalogs [63]. These catalogs include sources revealing signs of periodical changes in astrometric, photometric, and/or spectroscopic Gaia data, which are interpreted as their binarity or multiplicity.
For this purpose, we cross-matched the LAMOST DR5 A-, F-, G-, and K-type star catalog [43] with Gaia DR3 NSS sources, using a standard X-Match CDS procedure with a radius of matching of 1 on the condition that there was no other Gaia source within a radius of 4 from the LAMOST star, to avoid doubtful matches. Further, we used photometry data to filter out probable mismatches based on comparison of photometric magnitude measurements. This filter is tentative, as the data on LAMOST sources after automatic processing of their spectra may contain several photometric magnitudes in different bands and not all of them are obligatorily presented. So, we filtered out stars with some of the LAMOST stellar magnitudes differing from Gaia G-magnitudes by more than 3 rms in the entire sample of matched LAMOST–Gaia stars. Next, we selected the stars matching with Gaia sources in close vicinity of the Sun (having parallax ϖ 5 , e.g., approximately within 200 pc).
The resulting list of presumably unresolved Gaia sources cross-identified with LAMOST contains 2278 stars.

4. The Method for Comparing Model Spectra with the LAMOST Spectrum in the Terms of Their Continua

4.1. Description of the Method in General

Among the astronomical software, there are a number of well-established programs for working with spectra, such as ULySS [64,65], SME [66,67,68], FERRE [69], The Payne [70], and RVSpecFit [71]. It might be possible to solve our problem using the FERRE package, which is unnecessary for our purposes. So, we applied our own code in Python v. 3.11.
LAMOST spectra and synthetic spectra are defined for different wavelength sets and normalized differently. In order to compare spectra, the former should be recomputed for the same set of wavelengths and presented with the same normalization. At this stage, the defects that are sometimes present at the edges of the LAMOST spectra can be detected and removed.
The criterion for two spectra to be considered similar is their mutual rms deviation. Among the synthetic spectra, we search for the one closest to the studied LAMOST spectrum according to the above criterion, with an account of interstellar reddening, within the limits acceptable for the star under study. We call such a reddened synthetic spectrum “optimal”.
If divergence of the observed LAMOST spectrum and the optimal one is not large, the star under study is either a single star or a binary with a faint component that cannot be distinguished at the background of the companion. This category also includes the case of double stars with almost identical components whose spectra differ only slightly. Such a star will have a luminosity exceeding that of the more massive component of the binary, but the luminosity increase will not be recognized by us. If the spectra differ strongly, the LAMOST star can be peculiar (single or binary). A similar effect can be also caused by a strong defect in the LAMOST spectrum.
For an unresolved binary, the variance of the observed spectrum and the closest synthetic spectrum can look different in the following two cases. If one of the components is considerably brighter than the second one, the synthetic spectrum will be close to that of the bright component. An increase in the brightness difference of components hampers the discovery of unresolved binarity.
The second case corresponds to the occurrence when the radiation fluxes from components of an unresolved binary in the LAMOST working range are approximately the same, while the spectral types of them differ considerably. The synthetic spectrum consists of a component with one maximum, while the binary spectrum is the sum of two such components. The difference of observed and synthetic spectra will have a “wave-like” shape. This case is much more favorable for the detection of binarity.
Let us check if the suggested method is productive in the clearly expressed latter case. Simultaneously, we will be able to evaluate the upper limit for the mutual deviations of spectra between the binary and optimal single synthetic stars. For this purpose, we selected real A1V- and M6-type stars from the LAMOST DR5 catalog. Such stars are the most different in the catalog. For more information on them, see Table 1. The maximum of the continuum in the spectrum of the A1V star is located in the short-wavelength region, while in the spectrum of the M6 star it is at long wavelengths (see Figure 1). The sum of the spectra of such a pair will differ from the spectrum of a star of any spectral type. However, the latter difference will be not large, if the radiation flux of one of the stars is much lower than that from the companion. The difference is at the maximum, if the fluxes are equal. In order to illuminate the latter case, the fluxes were “equalized” by multiplication of one of the spectra by an appropriate factor. The spectra of both stars and the combined spectrum of the artificial binary are shown in the upper panel of Figure 1. The combined spectrum has two maxima situated at the edges of the LAMOST spectrograph’s working range.
We searched for the optimal synthetic spectrum for all possible combinations of the parameters T eff , log g , and [ Fe / H ] available in the New Grids library of ATLAS9 Model Atmospheres [49] (hereafter the Castelli–Kurucz library (CKL); see Section 4.2 below). Interstellar extinction was incrementally increased by Δ A v = 0.1 from 0 to 1. The spectrum with the following parameters was found optimal:
T eff = 5500   K ,   log g = 2.5 ,   [ Fe / H ] = 1.5 ,   A v = 1.0 .
It is also shown in the upper panel of Figure 1. Naturally, this spectrum has a single maximum located between the maxima of the “binary’s” combined spectrum, near the middle of the working range of the LAMOST survey.
The difference between the combined spectrum of the “binary” and the optimal synthetic spectrum (lower panel of Figure 1) has a “wave-like” shape with a rather large amplitude: the rms deviation for a point of the synthetic spectrum is as large as 37% of the mean signal level. This value, close to rms, may be accepted as an estimate of the upper limit for the possible deviation between the spectra in our approach. Figure 1 suggests that, in principle, the applied method may be used to search for stellar duplicity.
To establish a threshold between low and high levels of deviations between spectra, a statistical analysis is needed. For this purpose, we selected two special star samples from the LAMOST catalog, so it was known for the first of them from a priori information that the stars were single and for the second of them that the stars were binary.

4.2. The Library of Synthetic Spectra

The spectra in the CKL were computed for 1221 wavelengths between 9.09 nm and 160 μm. The main parameters of stellar atmospheres in the library vary within the following limits:
  • T eff takes 76 values from 3500 K to 50,000 K. The increment in T eff is not uniform: it increases from Δ T = 250 K for low temperatures to Δ T = 1000 K for high temperatures;
  • log g takes 11 values, from 0 to 5, with the uniform increment Δ log g = 0.5 ;
  • Not every combination of these two parameters is possible; the allowed combinations form a triangle in the T eff log g plane. See Castelli and Kurucz [49] for details;
  • [ Fe / H ] takes values from 1.5 to + 0.5 , with a uniform increment Δ [ Fe / H ] = 0.5 .
We use only a part of a particular synthetic spectrum within the LAMOST sensitivity range 3700 Å < λ < 9097 Å. This interval contains 270 points of the synthetic spectra from the CKL library with wavelengths 3710 Å <  λ  < 9090 Å .

4.3. Removal of the Outliers at the Edges of LAMOST Spectra

Each LAMOST spectrum contains 3908 data points in the 3699.9863 Å < λ < 9097.04 Å range. We use complete spectra.
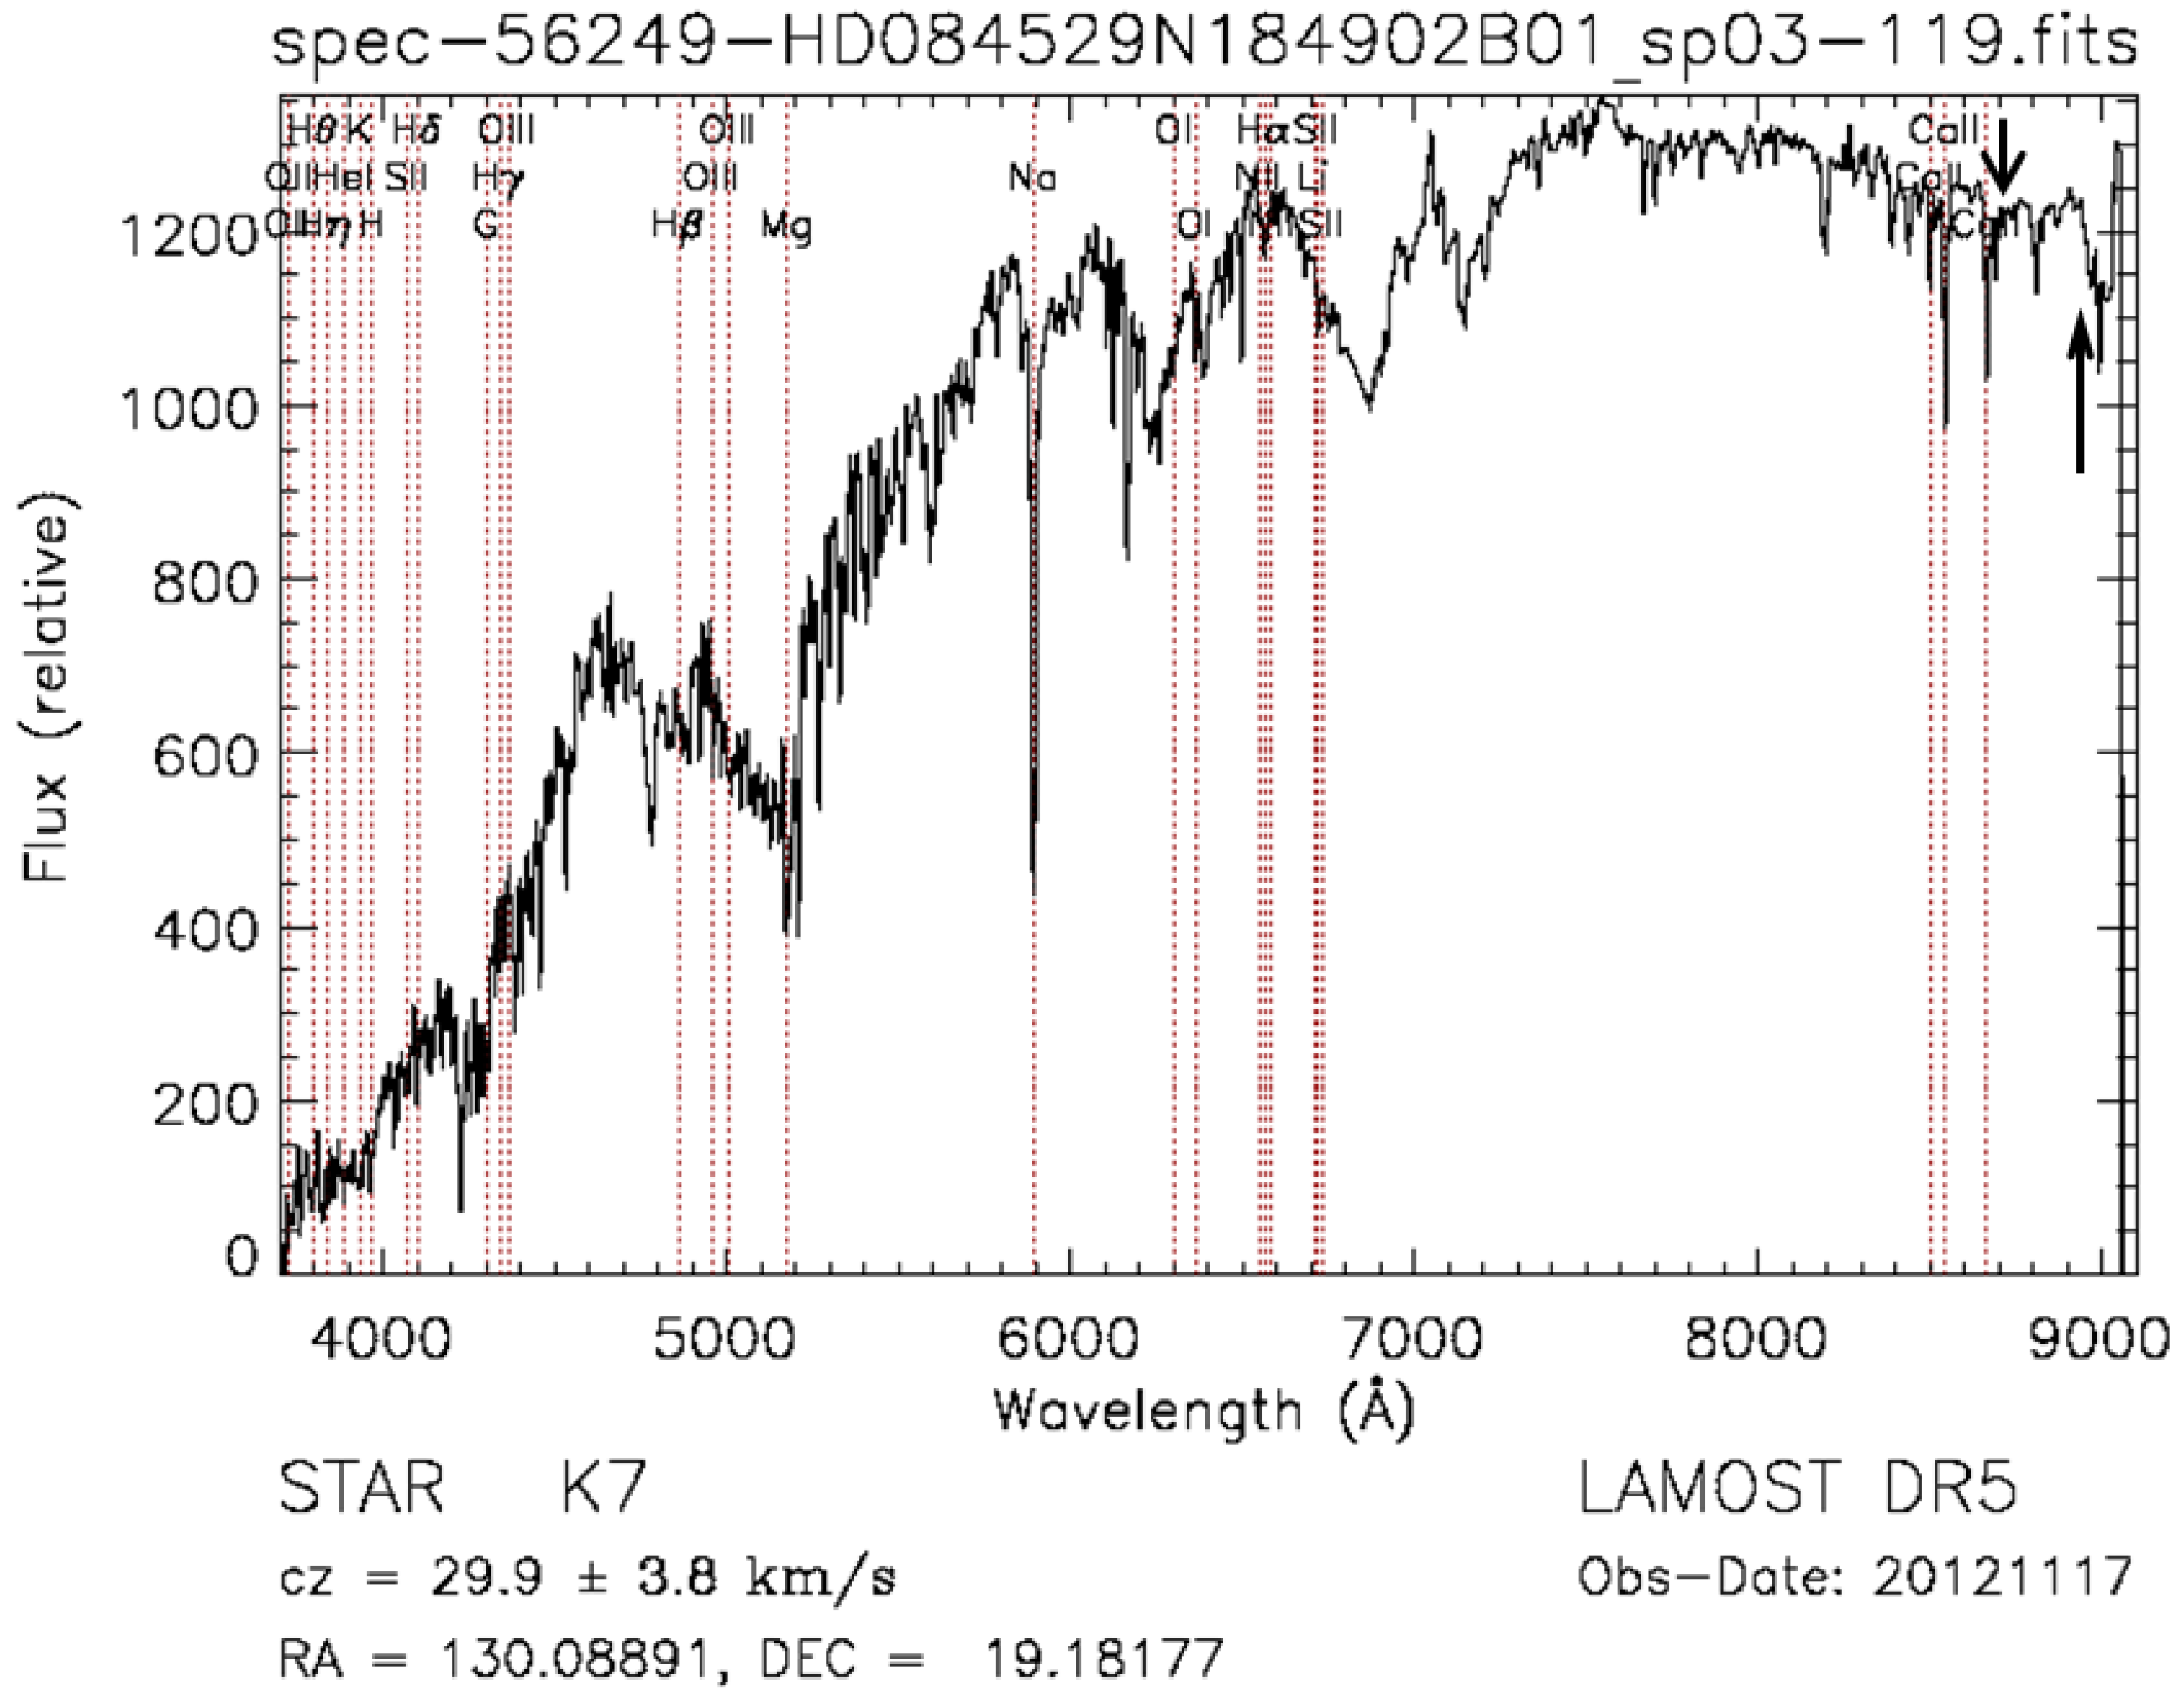
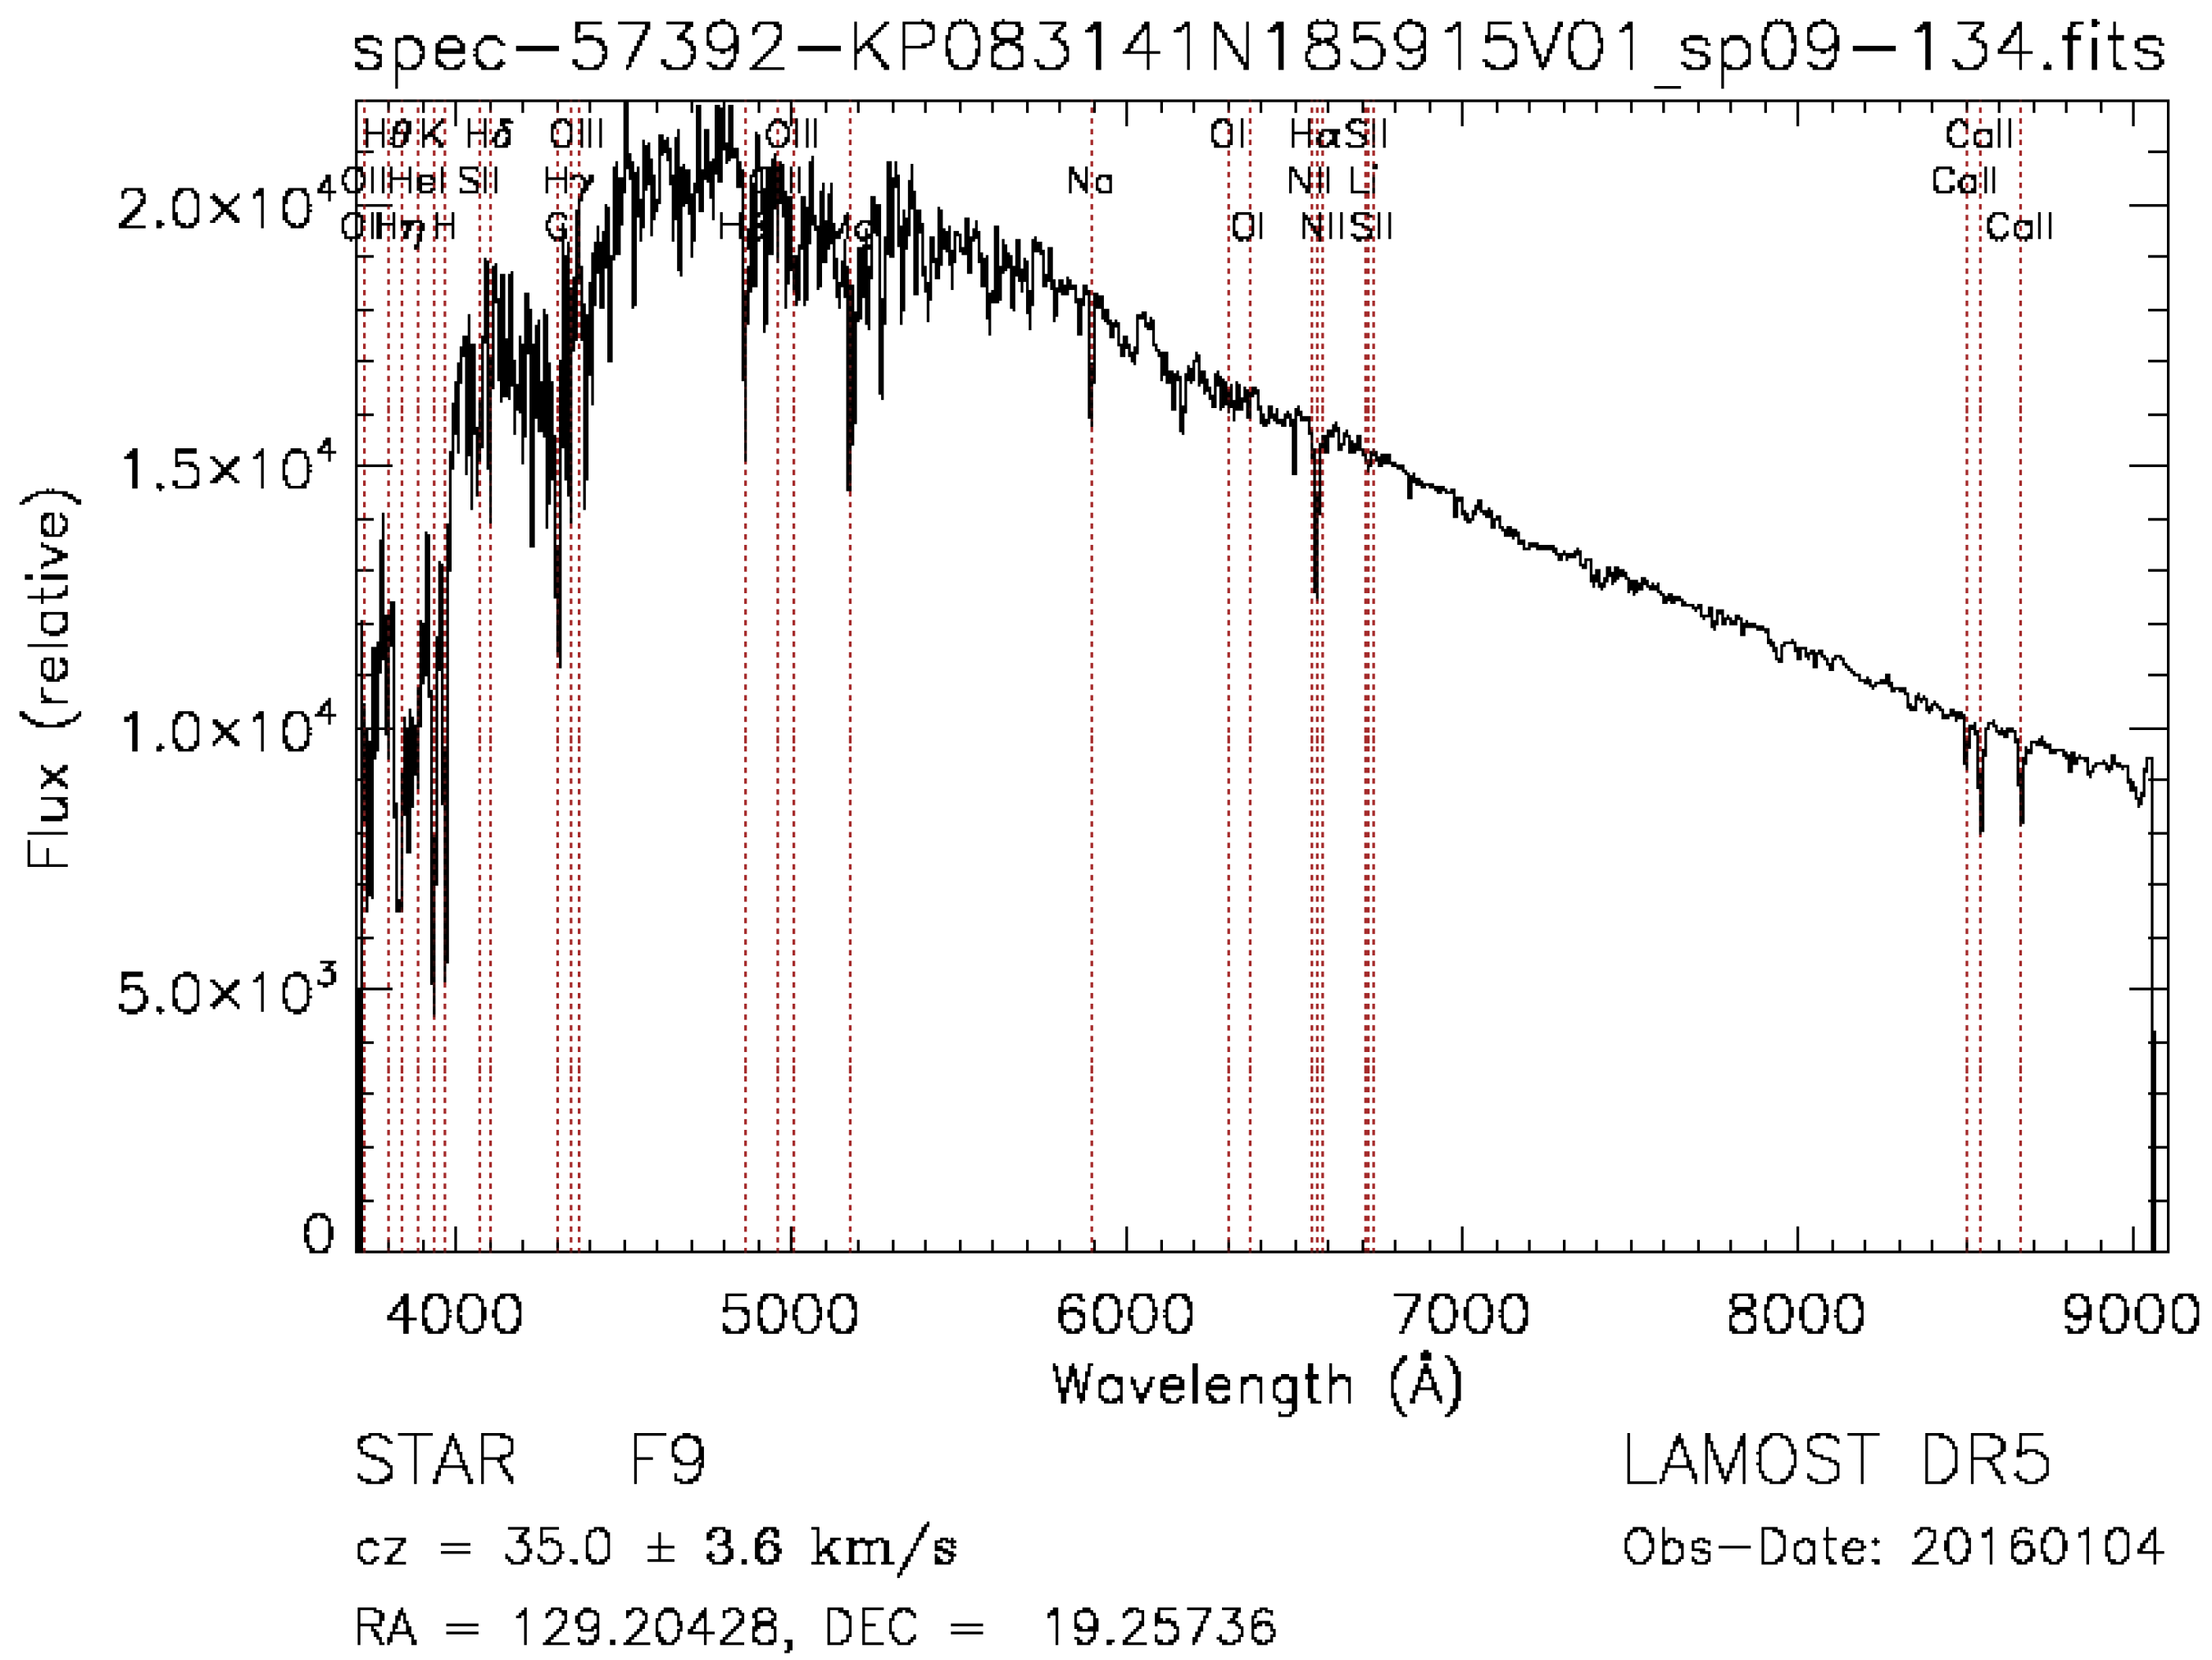
Rather frequent defects of the LAMOST spectra are outliers at the long-wavelength edge of the spectrum. Among several hundred randomly selected spectra from the LAMOST archive that we viewed, outliers were present in ∼25–30% of the images. Synthetic spectra of stars with similar parameters in this region do not show any peculiarities in the behavior of the continuum. These outliers can be positive or negative and vary in width. An example of a spectrum with outliers is displayed in Figure 2, while one without outliers is shown in Figure 3 5. The reason for the occurrence of these emissions is unknown.
We detect the presence of an outlier in the following way:
  • We check whether there is an outlier in the λ > λ right = 8700 Å range. This value is chosen based on the results of visual analysis of the spectra.
  • We search a data point λ R in the spectrum, closest to λ right at longer λ . For most LAMOST spectra, the corresponding wavelength is λ R = 8701.62 Å. The flux at this λ is F R = F ( λ R ) .
  • If at any point of the LAMOST spectrum with λ i > λ R , the deviation of the flux from F R exceeds the pre-selected value, ε , i.e., mod ( F ( λ i ) / F R 1 ) ) > ε , we assume that an outlier is present. In this study, we accept ε = 0.2 .
If an outlier is detected, we reject the part of the spectrum with λ > λ R , since there are no strong stellar lines in the 8700 Å < λ < 9100 Å range of stellar spectra.

4.4. Interpolation and Normalization of the Spectra

LAMOST spectra and synthetic spectra in the CKL are defined for different wavelength sets. In addition, the set of λ s in the LAMOST spectra is more than ten times larger than in the CKL synthetic spectra. Therefore, we interpolate the latter to the LAMOST set of wavelengths. Next, we smooth the LAMOST spectra in order to reduce the discrepancies in spectral comparisons. We use smoothing because the LAMOST spectra are quite noisy (see Figure 2 and Figure 3). We apply a moving average using a triangular profile of weights according to the formula
F i = j = i s i + s 1 | i j | s F j 2 s + 1 .
Here, i, j are the numbers of data points in the spectrum; s is the smoothing width, taken as a parameter. We compute the smoothed spectrum for the same wavelengths as those in the initial LAMOST spectrum. A side effect of this procedure is removal of narrow and not very intense lines from the LAMOST spectra.
At the edges of the LAMOST spectra, at i < i min ( LAMOST ) + s or i > i max ( LAMOST ) s , no smoothing was applied.
We tried the smoothing parameters s = 0 (no smoothing), s = 3 , and s = 10 and found that without smoothing the discrepancy in the comparison of spectra is noticeably larger, while with s = 3 and s = 10 the results are comparable. Further calculations were carried out with s = 3 .
At the next stage, we interpolated the smoothed spectra to the set of wavelengths of the synthetic spectra within the LAMOST sensitivity range. Piecewise linear interpolation was used. We designate fluxes in the interpolated spectrum as F ˜ i ( CKL ) .
When comparing the spectra, we had to not only reduce them to a common set of wavelengths but also perform their normalization. We left the fluxes in the interpolated LAMOST spectra F i ( CKL ) without changes. The values of fluxes in the synthetic spectrum were multiplied by the coefficient:
C = j = i min ( CKL ) i max ( CKL ) 1 F j ( CKL ) j = i min ( CKL ) i max ( CKL ) 1 F ˜ j ( CKL ) .

4.5. Four-Parameter Representation of Stellar Synthetic Spectra Taking into Account Interstellar Reddening

We did not vary additional parameters that influenced appearance of the spectra less than T e f f , log g , and [Fe/H]. The ranges and increments of these parameters in the CKL library are described in Section 4.2. For the value of turbulent velocity in the photosphere, we assumed v turb = 2.0 km/s. Stellar axial rotation was not taken into account.
The observed spectrum of a star can differ from the synthetic one because of interstellar extinction; its amount, described by the parameter A V , is the fourth parameter in the total representation of stellar spectra.
To take into account interstellar reddening, we used the law suggested by Cardelli et al. [72]. In the LAMOST sensitivity range, it is described by the following relations:
x = 1 / λ μ , y = 1.82 , a ( x ) = 1 + 0.17699 y 0.50447 y 2 0.02427 y 3 + 0.72085 y 4 + 0.01979 y 5 0.77530 y 6 + 0.32999 y 7 , b ( x ) = 1.41338 y + 2.28305 y 2 + 1.07233 y 3 5.38434 y 4 0.62251 y 5 + 5.30260 y 6 2.09002 y 7 , A ( λ ) A V = a ( x ) + b ( x ) R V , R V A V E B V .
We applied the standard assumption that the ratio R V was constant, namely, R V = 3.1 . For the wavelength corresponding to the V band, we assumed λ V = 550 nm. The four-parameter (4D) set of spectra was computed for all spectra of the CKL library in the following way:
  • For every star, we subdivided the range of possible values of interstellar absorption [ A V , min , A V , max ] into n ( A V ) = 20 intervals, and for every input synthetic spectrum from the CKL library we computed 21 spectra with different values of A V .
  • Next, we formed the relative absorption line, i.e., for all 270 wavelengths of CKL spectra that were within the LAMOST range (see Section 4.2) we computed A ( λ ) using Equation (3) with A V = 1 .
  • For a particular star, we found the acceptable range of interstellar absorption, [ A V , min , A V , max ] . The edges of this interval depended on stellar coordinates α , δ , which were well known and presented in the LAMOST catalog, and on the distance to the star d absent in the catalog.
    To determine the distance d, we used several approaches:
    (a)
    The majority of stars from the LAMOST catalog could be identified with the stars from the Gaia DR3 catalog [12,73] that currently contains the most accurate stellar parallaxes ϖ ( G ) and their uncertainties σ ϖ ( G ) . Using them, we computed possible limits for the distance to the star:
    d min = 1 ϖ ( G ) + 3 σ ϖ ( G ) , d max = 1 ϖ ( G ) 3 σ ϖ ( G ) .
    If the computed d min turned out to be negative, we set d min = 0 .
    (b)
    If a LAMOST star had no identification in the Gaia DR3 catalog, then, for some single stars, we took information on the distance or interstellar absorption directly from the original catalogs (see Section 3.2).
    (c)
    If identification of a LAMOST star with the Gaia DR3 catalog and any information on the distance to it were lacking, we assumed d min = 0 ,   d max = 5 Kpc .
  • The values of d min and d max together with the stellar coordinates α and δ were uploaded to the site http://stilism.obspm.fr (accessed on 5 December 2024), where an interactive procedure permitting us to determine the interstellar reddening E B V from a 3D map of interstellar absorption described in Lallement et al. [74], Capitanio et al. [75], Lallement et al. [76] is possible. This procedure returns the limits of interstellar reddening, E B V , min , E B V , max , possible for the star, with corresponding distances d min and d max and the limiting distance d s t i l covered by the interactive interstellar absorption map on the site. When d max > d s t i l , we assumed d max = 2 × d s t i l , having in mind that factor 2 results in the maximum possible absorption for barometric dependence of the latter on the z-coordinate.
  • We recomputed the derived limits of the interstellar reddening E B V into the limits of the interstellar absorption A V , min = R V E B V , min and A V , max = R V E B V , max .
  • For every spectrum from the CKL library defined by the parameters T eff , log g , and [ Fe / H ] , and for all wavelengths in the sensitivity range of the LAMOST survey, we computed reddened spectra for the following values of interstellar absorption:
    A V , i = A V , min + i A V , max A V , min n ( A V ) ,
    where the index i takes the values i = 0 n ( A V ) and where n ( A V ) = 20 is the number of intervals into which the range of interstellar absorption is split. To compute the intensity of light for the reddened synthetic spectrum, we used the Pogson [77] formula I ( A V , i , λ ) = 10 0.4 A ( λ ) A V , i i C K L ( λ ) , where i C K L ( λ ) are intensities of stellar light given in the CKL library without account of the interstellar absorption.
Above, we described the part of the procedure we developed where we estimated the limits of interstellar absorption for a particular star using data not contained in the LAMOST catalog itself.
Certainly, uncertainties and systematic trends in the LAMOST flux calibration may also affect the results we obtain. Taking them into account is very important. However, we do not have the necessary initial data to study this influence. We assumed that the standard calibrations of the spectra in the LAMOST project were carried out with the highest quality.

4.6. The Search for Optimal Synthetic Spectrum in the Four-Parameter Set of the Reddened Synthetic Spectra

The procedure of the search for the optimal synthetic spectrum in the 4-parameter set of the reddened synthetic spectra has two steps.
First, in the synthetic set generated for a particular LAMOST star (see Section 4.5), we search for the spectrum with minimum deviation from the observed spectrum. Second, we attempt to improve parameters of the synthetic spectrum by interpolation among the spectra of the 4-parameter set with the most similar parameters. Let us consider these steps one by one.

4.6.1. The Search for a Spectrum with the Lowest Rms Deviations in the 4-Parameter Set of Synthetic Spectra

We searched for the spectrum with lowest rms deviations from the observed LAMOST spectrum in the 4-parameter set of reddened synthetic spectra using two different techniques described below, along with their advantages and drawbacks.
First, we applied the discrete descent method. Implementation of this method has several steps:
  • For a selected LAMOST spectrum, we found in the CKL library a spectrum with the parameters T eff , 0 , log g 0 , and [ Fe / H ] 0 , closest to the catalog parameters T eff ( LAMOST ) , log g ( LAMOST ) , and [ Fe / H ] ( LAMOST ) . For the initial value of interstellar absorption A V , 0 , we selected the value from the sequence of acceptable values provided by Formula (5) that was either the closest to the interstellar absorption corresponding to the star’s mean parallax ϖ (if the star was identified with the Gaia catalog) or the closest to the mean interstellar absorption known from the other sources (see Section 4.5).
  • The so-called “current spectrum”, containing intermediate optimization results, is introduced. We designate parameters of the current spectrum as T eff , i , log g i , [ Fe / H ] i , and A V , i for the spectrum used at the first step of the optimization procedure i = 0 .
  • The deviation σ C is computed for the current spectrum: σ C = σ ( T eff , i , log g i , [ Fe / H ] i , A V , i ) .
  • We compute deviations for eight adjacent spectra, σ n e a r 8 , that differ from the current spectrum by their value of one of the parameters in the 4-parameter set of synthetic spectra. For example, σ T + = σ ( T eff , i + 1 , log g i , [ Fe / H ] i , A V , i ) is the deviation for the spectrum with log g i , [ Fe / H ] i , and A V , i similar to those of the current spectrum, but T eff is the closest one, exceeding T eff , i . If the parameters of the current spectrum are at the edge of the 4D set, i.e., are at the maximum or minimum possible level, then the current spectrum will have only one neighbor in this direction.
  • If the deviation for one of these neighbor spectra is lower than that for the current spectrum, min ( σ n e a r 8 ) < σ C , then the spectrum with the lowest deviation is chosen as the current spectrum, and the minimization procedure returns to step 3.
  • If σ C min ( σ n e a r 8 ) , we additionally calculate deviations for 72 adjacent spectra, σ n e a r 72 , so that these spectra simultaneously have from 2 to 4 parameters differing from the current spectrum by one step. Similarly to calculating deviations σ n e a r 8 , if the current point is at the edge of the 4D distribution of the parameters, it will have less than 72 additional neighbors. If the deviation for one of adjacent spectra of the additional set is lower than that for the current spectrum, min ( σ n e a r 72 ) < σ C , then we select the spectrum with the lowest deviation as the current spectrum. The minimization procedure returns to step 3.
  • If σ C min ( σ n e a r 72 ) , the procedure of the search for the spectrum with the minimum rms deviation in the 4-parameter set is completed, and the desired spectrum F ( o p t ) is contained in the current spectrum.
Second, we applied the method of exhaustive search, by which we computed deviations for all reddened spectra of the 4-parameter set and selected the one with the lowest deviation.

4.6.2. Comparison of the Methods

The discrete descent method is faster than the method of exhaustive search by almost three orders of magnitude. Performing the exhaustive search is, from a computational point of view, the most effort-consuming part of the technique we applied.
The exhaustive search is guaranteed to find the global extremum of the multi-dimensional deviation function σ ( T eff , log g , [ Fe / H ] , A V ) at a discreet and limited parameter grid, no matter how many local extrema there are.
The discrete descent method is able to find the global extremum in two cases. First, if the deviation function is monotonous, i.e., if it possesses a single extremum in its domain, the result of optimization will not depend on the choice of the initial spectrum. Second, if the deviation function possesses several local minima and one of them, namely, the deepest one, is the global minimum, we will find the global extremum only if the parameters of the starting spectrum happen to be on the slopes of the global extremum.
It turns out that the methods of discrete descent and exhaustive search give different results in approximately 10 to 15% of all cases, when the deviation function has several extrema and the starting spectra are different. Unfortunately, we had to reject the discrete descent method and apply the much more effort-taking, but guaranteed successful, exhaustive search.

4.7. Improving the Optimal Spectrum by Interpolation Between Adjacent Spectra

At the previous stage, we used the optimization procedure to find in the 4-parameter set of reddened synthetic spectra the spectrum with the lowest deviation from that of the program star in the LAMOST catalog. However, we can try to improve this “optimal” spectrum by means of interpolation between the selected spectrum and its neighbors with the closest parameters.
We used an iteration procedure for finding the optimal combination of two adjacent reddened synthetic spectra by one of their four parameters, to obtain the minimum deviation. The interpolation was performed using the piecewise linear technique:
F ( α , i , λ , P ) = ( 1 α ) F ( P i ( o p t ) ± 1 ) α F ( P i ( o p t ) ) P i ( o p t ) ± 1 P i ( o p t ) ,
where α is the interpolation parameter ( 0 α 1 ) ; P are the four parameters describing reddened synthetic spectra; i is the number of the parameter used to perform interpolation (1— T eff , 2— log g , 3— [ Fe / H ] , 4— A V ), and ( o p t ) ± 1 means that the interpolation can be performed toward the larger optimal parameter, “+”, as well as toward the smaller parameter, “−”.
However, our modeling shows that linear interpolation of this kind does not give any considerable reduction in the deviation. Probably, this is the result of rather large fluctuations of real stellar spectra compared to their computed synthetic analogs.
In this work, the refinement of the optimal spectrum by interpolation between adjacent spectra was not used.

5. Presentation of Results of Comparison Between Synthetic and LAMOST Spectra for Single and Binary Stars

For a quantitative evaluation of results of comparison between observed and optimized synthetic spectra, we applied the following proximity criterion:
σ = 1 N i = 1 N F ( λ i ) ( o p t ) F ( λ i ) ( L A M O S T ) 2 1 N i = 1 N F ( λ i ) ( L A M O S T ) .
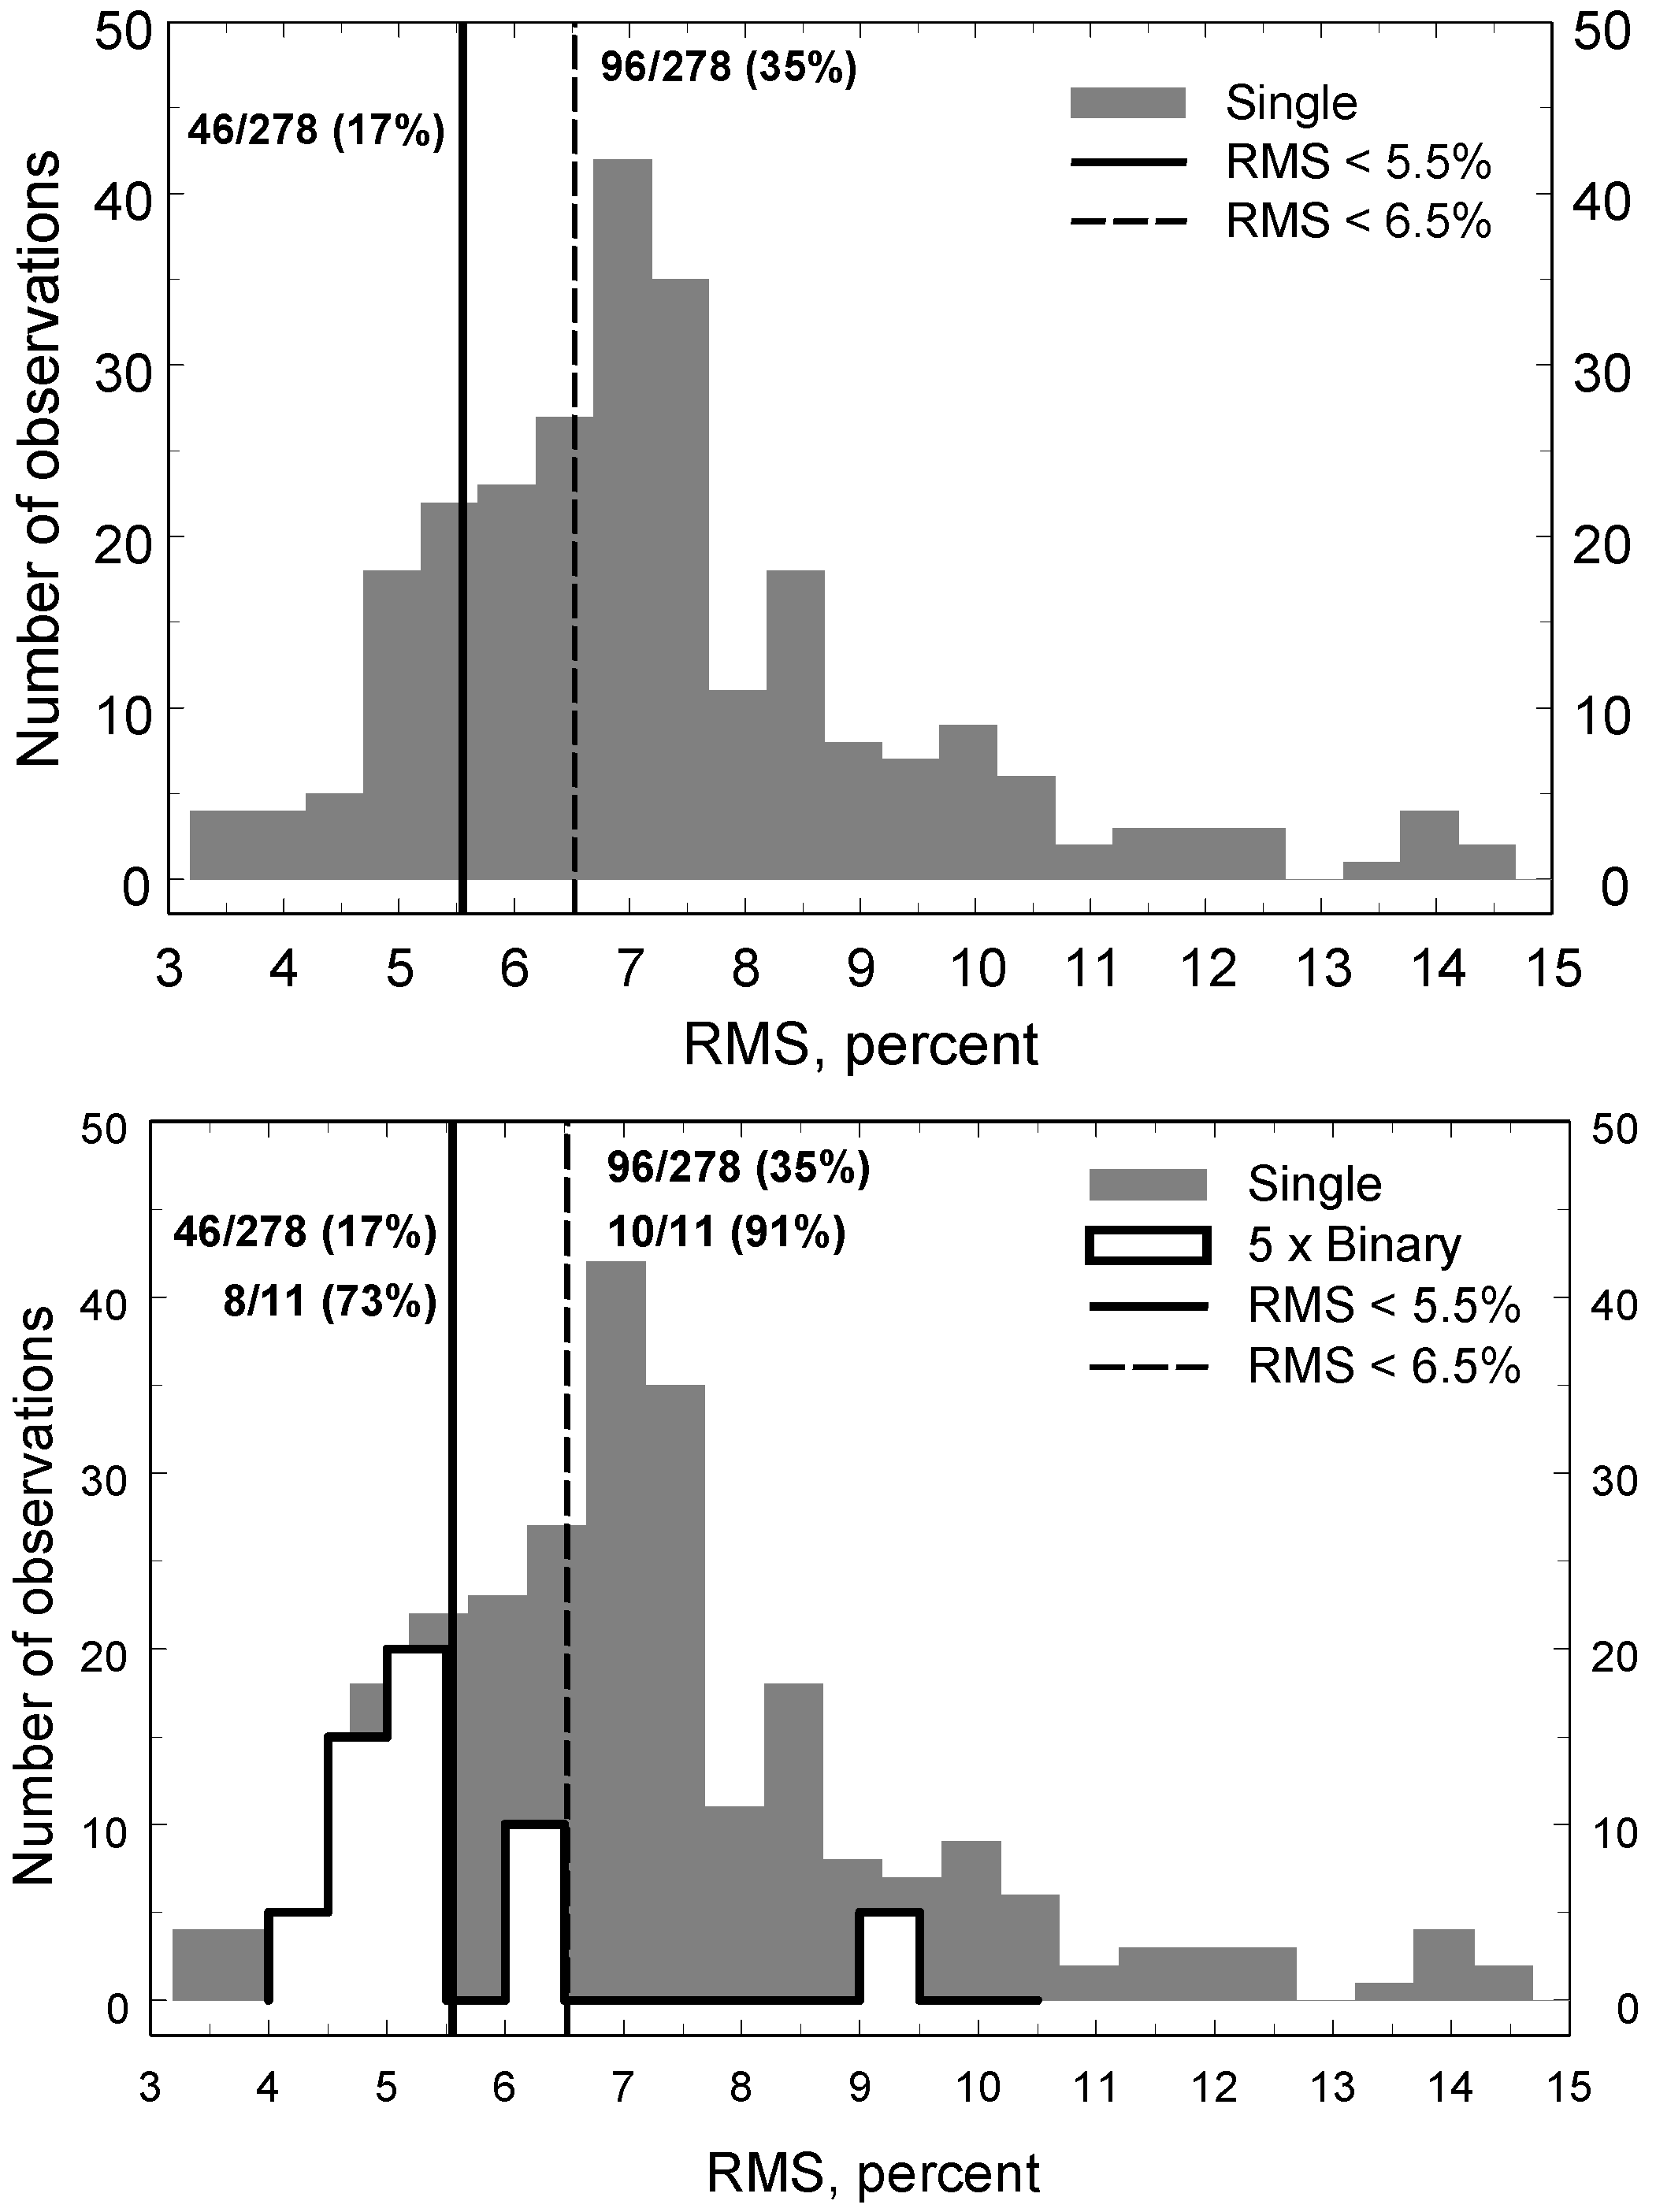
The value of σ is the dimensionless ratio of the rms deviation and its mean value. To make the discussion more transparent, we express σ in percent. The algorithm we developed was applied to the compiled test lists of stars. The upper panel of Figure 4 shows the histogram of the distribution of 278 spectra of 166 single stars from the Main_Single list (see Section 3.2) over rms deviations between the observed LAMOST spectrum and the corresponding optimal synthetic spectrum.
The interval of rms < 15%, displayed in Figure 4, contains 255 spectra of single stars. In addition, there are 23 spectra with rms > 15% not shown in the figure. Partially, large deviations are due to the technical flaws of these spectra (lacking observations for a part of the recorded LAMOST wavelength range, outliers, etc.), and partially, they are due to the individual peculiarities of stellar spectra. The right edge of the diagram (rms = 15%) was selected for clear demonstration of the distribution.
Since, according to the method we developed, binary stars should have significantly larger rms deviations compared to single stars, we marked in the histogram two characteristic levels of rms deviations: rms = 5.5% and 6.5%. In the main list of single stars, 46 spectra out of 278 (17%) have rms < 5.5%; 96 spectra of 278 (35%) have rms < 6.5%.
The middle panel of Figure 4 displays the histogram for the same single stars as in the upper panel and the histogram for bona fide binary stars from the SB9 catalog. The latter were processed in the same way as the LAMOST stars. For a more clear presentation, we artificially increased the actual height of the histogram columns for binaries by a factor of five.
For all binaries, rms < 15 %, so, they are visible in the diagram. The distribution of binary stars over the rms deviations is more compact than for single stars. In the list of binary stars from the SB9 catalog, rms < 5.5% have 8 spectra out of 11 (73%), and rms < 6.5% have 10 spectra out of 11 (91%). Thus, the rms deviations for binary stars from the SB9 catalog do not stand out by their rms deviations compared to the single stars from the main list of objects from the LAMOST catalog.
We additionally process the LAMOST spectra for two lists of stars identified in the Gaia DR3 catalog. The first list, Gaia_Single, contains stars that have no indications of unresolved binarity in their astrometric and photometric characteristics in Gaia DR3 according to [60], and they are most likely single stars. The procedure for obtaining this list of stars is presented in Section 3.3.1. The Gaia_Single list contains 6220 stars.
The second list, Gaia_Binary, contains stars that do not have significant indications of unresolved binarity according to the Gaia DR3 catalog. The procedure for obtaining this list of stars is given in Section 3.4 above. The Gaia_Binary list contains 2278 stars. The stars in this list are most likely unresolved binaries.
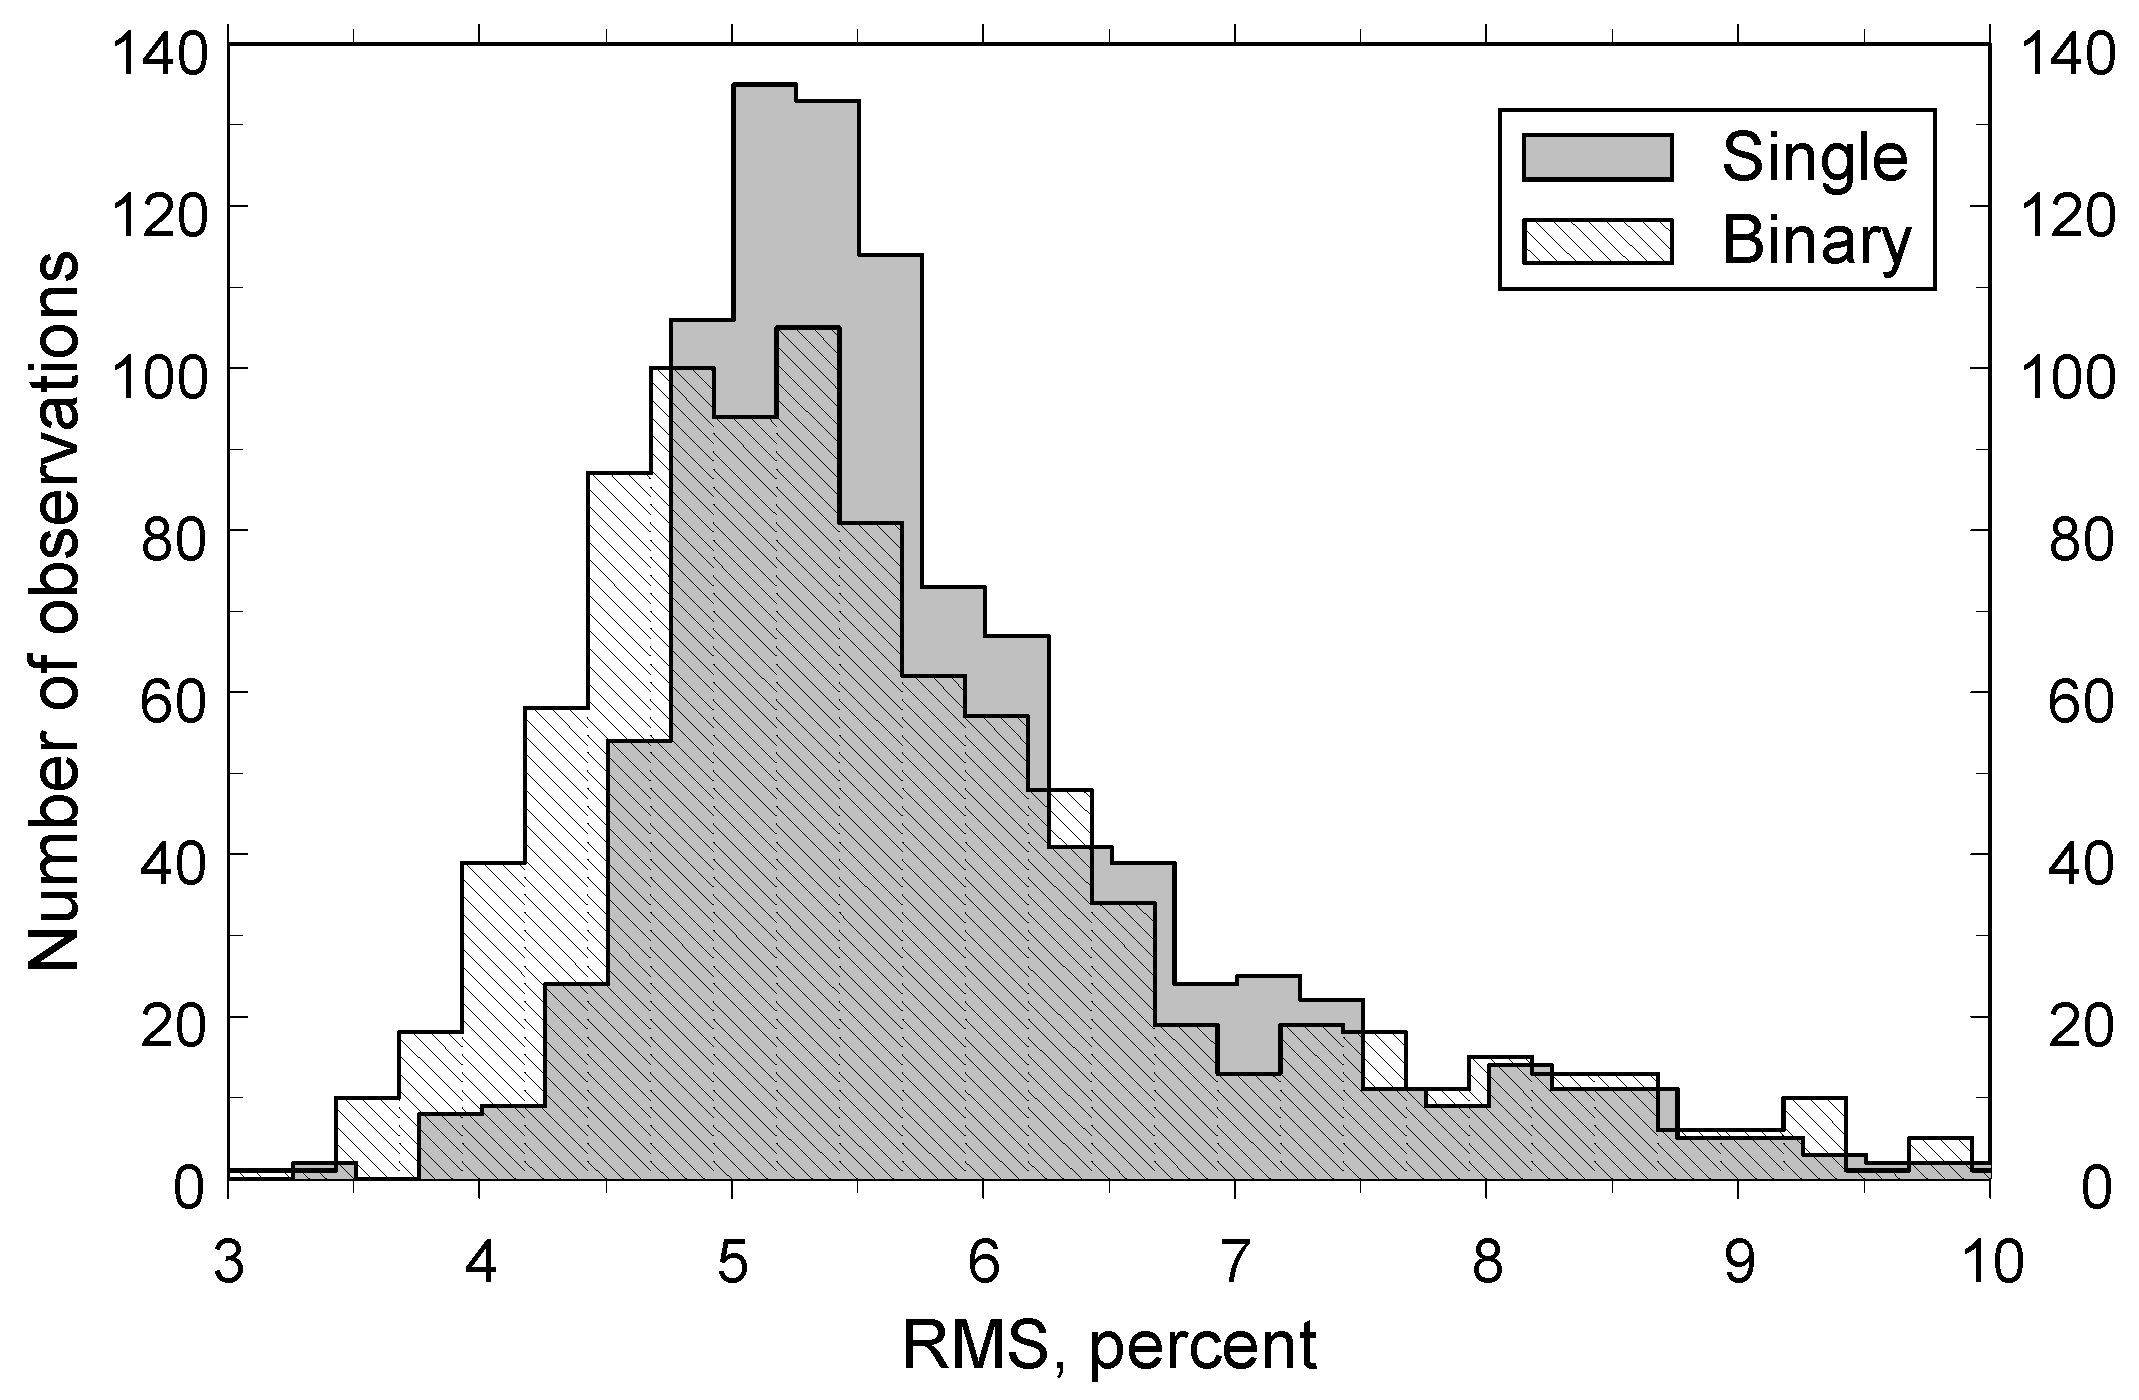
Figure 5 shows histograms of rms distributions of stars from the Gaia_Single and Gaia_Binary lists. For each histogram, 1000 stars from each list were randomly selected. The histogram bin width is 0.25. The distributions are almost identical: the average values are r m s S i n g l = 6.3 and r m s B i n = 6.2 . The distribution of unresolved binary stars is slightly wider: standard deviations are σ S i n g l = 3.4 and σ B i n = 4.2 . Beyond the right edge of the figure ( r m s > 10.0 ) there are 60 single and 63 unresolved binary stars out of 1000.
Thus, the binary and single stars from the Gaia DR3 catalog differ only slightly and do not stand out in their rms against the background of the Main_Single stars considered above.

6. Conclusions

We have suggested a method to find binary stars among LAMOST sources, based on the comparison between the continuum of the stellar spectrum of the LAMOST catalog and a synthetic spectrum, with interstellar reddening taken into account. It has been demonstrated that this method is not effective enough in its version described above and is apparently not able to distinguish between single and binary stars in the LAMOST catalog.
The possible directions of further studies are as follows:
  • Compilation of a special version of the CKL synthetic spectra library, with wavelengths exactly coinciding with those in the LAMOST spectra. Using such spectra would eliminate procedures of smoothing and interpolation, leading to lower rms deviations between the observed and synthetic spectra and to better sensitivity of the method. However, computation of stellar spectra library is a stand-alone problem.
  • Switching to a method based on a comparison of intensities for pairs of spectral lines or intensities for individual lines. The first of these methods is currently the most widely used approach for high-accuracy spectral classification of stars. The second approach is used for spectral classification of stars in the LAMOST project proper. However, the LAMOST survey provides low-resolution stellar spectra, and such methods can also turn out to be not sensitive to stellar binarity.

Author Contributions

Conceptualization, N.S., K.T., O.M. and G.Z.; methodology, K.T., S.S., A.L., D.K. and G.Z.; software, P.K. and S.S.; validation, M.P.; investigation, L.Y.; resources, A.L., J.Z., Y.L., Y.S. and G.Z.; data curation, K.T., A.L., J.Z., Y.L., Y.S. and G.Z.; writing-original draft preparation, N.S.; writing—review and editing, M.P., K.T., N.S., A.L., D.K., J.Z., Y.L., P.K., O.M., Y.S., S.S., L.Y. and G.Z.; visualization, S.S., P.K. and K.T.; supervision, M.P. and K.T.; project administration, M.P. All authors have read and agreed to the published version of the manuscript.

Funding

G.Z. is supported by the National Natural Science Foundation of China (NSFC) under grant No. 11988101 and by the National Key R&D Program of China No. 2024YFA1611900. K.T. is supported by the NSFC under grant Nos. 12261141689, 12090044, and 12090040. Y.L. is supported by the NSFC under grant No. 12073044. O.M. thanks the CAS President’s International Fellowship Initiative (PIFI). Guoshoujing Telescope (the Large Sky Area Multi-Object Fiber Spectroscopic Telescope LAMOST) is a National Major Scientific Project built by the Chinese Academy of Sciences. Funding for the project has been provided by the National Development and Reform Commission. LAMOST is operated and managed by the National Astronomical Observatories, Chinese Academy of Sciences. The study was conducted under the state assignment of Lomonosov Moscow State University.

Data Availability Statement

No new data were created or analyzed in this study. Data sharing is not applicable to this article.

Acknowledgments

This research has made use of the VizieR catalog access tool, CDS, Strasbourg, France. This work has made use of data from the European Space Agency (ESA) mission Gaia (https://www.cosmos.esa.int/gaia, accessed on 24 July 2025), processed by the Gaia Data Processing and Analysis Consortium (DPAC, https://www.cosmos.esa.int/web/gaia/dpac/consortium, accessed on 24 July 2025). Funding for the DPAC has been provided by national institutions, in particular the institutions participating in the Gaia Multilateral Agreement. The use of TOPCAT, an interactive graphical viewer and editor for tabular data [78], is acknowledged. We are grateful to our anonymous reviewers whose constructive comments greatly helped us to improve the paper.

Conflicts of Interest

The authors declare no conflicts of interest.

Notes

1
An estimate exceeding 100% means that binaries are components of triples.
2
Ref. [51] (http://sb9.astro.ulb.ac.be, accessed on 24 July 2025).
3
https://sl.voxastro.org/ (accessed on 24 July 2025)
4
http://archive.stsci.edu/prepds/stisngsl/ (accessed on 24 July 2025).
5
Both spectra are taken from the LAMOST DR5 site.

References

  1. Duchêne, G.; Kraus, A. Stellar Multiplicity. Annu. Rev. Astron. Astrophys. 2013, 51, 269–310. [Google Scholar] [CrossRef]
  2. Moe, M.; Di Stefano, R. Mind Your Ps and Qs: The Interrelation between Period (P) and Mass-ratio (Q) Distributions of Binary Stars. Astrophys. J. Suppl. Ser. 2017, 230, 15. [Google Scholar] [CrossRef]
  3. Merle, T. Dancing with the Stars: A Review on Stellar Multiplicity. Bull. Soc. R. Sci. Liege 2024, 93, 170–214. [Google Scholar] [CrossRef]
  4. Cifuentes, C.; Caballero, J.A.; González-Payo, J.; Amado, P.J.; Béjar, V.J.S.; Burgasser, A.J.; Cortés-Contreras, M.; Lodieu, N.; Montes, D.; Quirrenbach, A.; et al. CARMENES input catalogue of M dwarfs: IX. Multiplicity from close spectroscopic binaries to ultra-wide systems. Astron. Astrophys. 2025, 693, A228. [Google Scholar] [CrossRef]
  5. Tutukov, A.V.; Yungelson, L.R. Evolutionary Scenario for Close Binary Systems of Low and Moderate Masses. Nauchnye Informatsii 1981, 49, 3. [Google Scholar]
  6. Kroupa, P.; Tout, C.A.; Gilmore, G. The effects of unresolved binary stars on the determination of the stellar mass function. Mon. Not. RAS 1991, 251, 293–302. [Google Scholar] [CrossRef]
  7. Kroupa, P. On the variation of the initial mass function. Mon. Not. RAS 2001, 322, 231–246. [Google Scholar] [CrossRef]
  8. El-Badry, K.; Rix, H.W.; Ting, Y.S.; Weisz, D.R.; Bergemann, M.; Cargile, P.; Conroy, C.; Eilers, A.C. Signatures of unresolved binaries in stellar spectra: Implications for spectral fitting. Mon. Not. RAS 2018, 473, 5043–5049. [Google Scholar] [CrossRef]
  9. Borodina, O.I.; Seleznev, A.F.; Carraro, G.; Danilov, V.M. Unresolved Binaries and Galactic Clusters’ Mass Estimates. Astrophys. J. 2019, 874, 127. [Google Scholar] [CrossRef]
  10. Sullivan, K.; Kraus, A.L. Undetected Binary Stars Cause an Observed Mass-dependent Age Gradient in Upper Scorpius. Astrophys. J. 2021, 912, 137. [Google Scholar] [CrossRef]
  11. Prusti, T. et al. [Gaia Collaboration] The Gaia mission. Astron. Astrophys. 2016, 595, A1. [Google Scholar] [CrossRef]
  12. Vallenari, A. et al. [Gaia Collaboration] Gaia Data Release 3. Summary of the content and survey properties. Astron. Astrophys. 2023, 674, A1. [Google Scholar] [CrossRef]
  13. Almeida, A.; Anderson, S.F.; Argudo-Fernández, M.; Badenes, C.; Barger, K.; Barrera-Ballesteros, J.K.; Bender, C.F.; Benitez, E.; Besser, F.; Bird, J.C.; et al. The Eighteenth Data Release of the Sloan Digital Sky Surveys: Targeting and First Spectra from SDSS-V. Astrophys. J. Suppl. Ser. 2023, 267, 44. [Google Scholar] [CrossRef]
  14. Castro-Ginard, A.; Penoyre, Z.; Casey, A.R.; Brown, A.G.A.; Belokurov, V.; Cantat-Gaudin, T.; Drimmel, R.; Fouesneau, M.; Khanna, S.; Kurbatov, E.P.; et al. Gaia DR3 detectability of unresolved binary systems. arXiv 2024. [Google Scholar] [CrossRef]
  15. Penoyre, Z.; Belokurov, V.; Evans, N.W. Astrometric identification of nearby binary stars—II. Astrometric binaries in the Gaia Catalogue of Nearby Stars. Mon. Not. RAS 2022, 513, 5270–5289. [Google Scholar] [CrossRef]
  16. Malofeeva, A.A.; Mikhnevich, V.O.; Carraro, G.; Seleznev, A.F. Unresolved Binaries and Multiples in the Intermediate Mass Range in Open Clusters: Pleiades, Alpha Per, Praesepe, and NGC 1039. Astron. J. 2023, 165, 45. [Google Scholar] [CrossRef]
  17. Chulkov, D.; Prokhorov, M.; Malkov, O.; Sichevskij, S.; Krussanova, N.; Mironov, A.; Zakharov, A.; Kniazev, A. Detection of unresolved binaries with multicolor photometry. Balt. Astron. 2015, 24, 137–143. [Google Scholar] [CrossRef]
  18. Wallace, A.L. Photometric determination of main-sequence binaries with Gaia. Mon. Not. RAS 2024, 527, 8718–8726. [Google Scholar] [CrossRef]
  19. Xiang, M.; Rix, H.W.; Ting, Y.S.; Zari, E.; El-Badry, K.; Yuan, H.B.; Cui, W.Y. Data-driven Spectroscopic Estimates of Absolute Magnitude, Distance, and Binarity: Method and Catalog of 16,002 O- and B-type Stars from LAMOST. Astrophys. J. Suppl. Ser. 2021, 253, 22. [Google Scholar] [CrossRef]
  20. Kovaleva, D.A.; Malkov, O.Y. On the possible multiplicity of the components of some low-mass systems. Astron. Rep. 1999, 43, 80–88. [Google Scholar]
  21. Luo, A.L.; Zhao, Y.H.; Zhao, G.; Deng, L.C.; Liu, X.W.; Jing, Y.P.; Wang, G.; Zhang, H.T.; Shi, J.R.; Cui, X.Q.; et al. The first data release (DR1) of the LAMOST regular survey. Res. Astron. Astrophys. 2015, 15, 1095. [Google Scholar] [CrossRef]
  22. McMillan, P. BDASP Catalogue. 2020. Available online: https://doi.org/10.17876/RAVE/DR.6/008 (accessed on 24 July 2025).
  23. Buder, S.; Sharma, S.; Kos, J.; Amarsi, A.M.; Nordlander, T.; Lind, K.; Martell, S.L.; Asplund, M.; Bland-Hawthorn, J.; Casey, A.R.; et al. The GALAH+ survey: Third data release. Mon. Not. RAS 2021, 506, 150–201. [Google Scholar] [CrossRef]
  24. Jönsson, H.; Holtzman, J.A.; Prieto, C.A.; Cunha, K.; García-Hernández, D.A.; Hasselquist, S.; Masseron, T.; Osorio, Y.; Shetrone, M.; Smith, V.; et al. APOGEE Data and Spectral Analysis from SDSS Data Release 16: Seven Years of Observations Including First Results from APOGEE-South. Astron. J. 2020, 160, 120. [Google Scholar] [CrossRef]
  25. Abdurro’uf; Accetta, K.; Aerts, C.; Silva Aguirre, V.; Ahumada, R.; Ajgaonkar, N.; Filiz Ak, N.; Alam, S.; Allende Prieto, C.; Almeida, A.; et al. The Seventeenth Data Release of the Sloan Digital Sky Surveys: Complete Release of MaNGA, MaStar, and APOGEE-2 Data. Astrophys. J. Suppl. Ser. 2022, 259, 35. [Google Scholar] [CrossRef]
  26. Gilmore, G.; Randich, S.; Asplund, M.; Binney, J.; Bonifacio, P.; Drew, J.; Feltzing, S.; Ferguson, A.; Jeffries, R.; Micela, G.; et al. The Gaia-ESO Public Spectroscopic Survey. Messenger 2012, 147, 25–31. [Google Scholar]
  27. Randich, S.; Gilmore, G.; Gaia-ESO Consortium. The Gaia-ESO Large Public Spectroscopic Survey. Messenger 2013, 154, 47–49. [Google Scholar]
  28. Li, J.; Ting, Y.S.; Rix, H.W.; Green, G.M.; Hogg, D.W.; Ren, J.J.; Müller-Horn, J.; Seeburger, R. Identification of 30,000 White Dwarf-Main Sequence binaries candidates from Gaia DR3 BP/RP(XP) low-resolution spectra. arXiv 2025. [Google Scholar] [CrossRef]
  29. Seeburger, R.; Rix, H.W.; El-Badry, K.; Xiang, M.; Fouesneau, M. Autonomous disentangling for spectroscopic surveys. Mon. Not. RAS 2024, 530, 1935–1955. [Google Scholar] [CrossRef]
  30. Birko, D.; Zwitter, T.; Grebel, E.K.; Parker, Q.A.; Kordopatis, G.; Bland-Hawthorn, J.; Freeman, K.; Guiglion, G.; Gibson, B.K.; Navarro, J.; et al. Single-lined Spectroscopic Binary Star Candidates from a Combination of the RAVE and Gaia DR2 Surveys. Astron. J. 2019, 158, 155. [Google Scholar] [CrossRef]
  31. Price-Whelan, A.M.; Hogg, D.W.; Rix, H.W.; Beaton, R.L.; Lewis, H.M.; Nidever, D.L.; Almeida, A.; Badenes, C.; Barba, R.; Beers, T.C.; et al. Close Binary Companions to APOGEE DR16 Stars: 20,000 Binary-star Systems Across the Color-Magnitude Diagram. Astrophys. J. 2020, 895, 2. [Google Scholar] [CrossRef]
  32. Traven, G.; Feltzing, S.; Merle, T.; Van der Swaelmen, M.; Čotar, K.; Church, R.; Zwitter, T.; Ting, Y.S.; Sahlholdt, C.; Asplund, M.; et al. The GALAH survey: Multiple stars and our Galaxy. I. A comprehensive method for deriving properties of FGK binary stars. Astron. Astrophys. 2020, 638, A145. [Google Scholar] [CrossRef]
  33. Merle, T.; Van der Swaelmen, M.; Van Eck, S.; Jorissen, A.; Jackson, R.J.; Traven, G.; Zwitter, T.; Pourbaix, D.; Klutsch, A.; Sacco, G.; et al. The Gaia-ESO Survey: Detection and characterisation of single-line spectroscopic binaries. Astron. Astrophys. 2020, 635, A155. [Google Scholar] [CrossRef]
  34. Cui, X.Q.; Zhao, Y.H.; Chu, Y.Q.; Li, G.P.; Li, Q.; Zhang, L.P.; Su, H.J.; Yao, Z.Q.; Wang, Y.N.; Xing, X.Z.; et al. The Large Sky Area Multi-Object Fiber Spectroscopic Telescope (LAMOST). Res. Astron. Astrophys. 2012, 12, 1197–1242. [Google Scholar] [CrossRef]
  35. Zhao, G.; Zhao, Y.H.; Chu, Y.Q.; Jing, Y.P.; Deng, L.C. LAMOST spectral survey—An overview. Res. Astron. Astrophys. 2012, 12, 723–734. [Google Scholar] [CrossRef]
  36. Li, C.q.; Shi, J.r.; Yan, H.l.; Fu, J.N.; Li, J.d.; Hou, Y.H. Double- and Triple-line Spectroscopic Candidates in the LAMOST Medium-Resolution Spectroscopic Survey. Astrophys. J. Suppl. Ser. 2021, 256, 31. [Google Scholar] [CrossRef]
  37. Guo, Y.; Li, J.; Xiong, J.; Li, J.; Wang, L.; Xiong, H.; Luo, F.; Hou, Y.; Liu, C.; Han, Z.; et al. The Binarity of Early-type Stars from LAMOST medium-resolution Spectroscopic Survey. Res. Astron. Astrophys. 2022, 22, 025009. [Google Scholar] [CrossRef]
  38. Qian, S.B.; Shi, X.D.; Zhu, L.Y.; Li, L.J.; Zhang, J.; Zhao, E.G.; Han, Z.T.; Zhou, X.; Fang, X.H.; Liao, W.P. More than two hundred and fifty thousand spectroscopic binary or variable star candidates discovered by LAMOST. Res. Astron. Astrophys. 2019, 19, 064. [Google Scholar] [CrossRef]
  39. Chen, Y.; Xia, F.; Wang, X.; Fu, Y.; Yuan, Y. New SB1s with Spectroscopic Orbits from LAMOST-LRS. Astrophys. J. Suppl. Ser. 2023, 269, 41. [Google Scholar] [CrossRef]
  40. Liu, C.; Bailer-Jones, C.A.L.; Sordo, R.; Vallenari, A.; Borrachero, R.; Luri, X.; Sartoretti, P. The expected performance of stellar parametrization with Gaia spectrophotometry. Mon. Not. RAS 2012, 426, 2463–2482. [Google Scholar] [CrossRef]
  41. Ting, Y.S.; Conroy, C.; Rix, H.W.; Cargile, P. Prospects for Measuring Abundances of >20 Elements with Low-resolution Stellar Spectra. Astrophys. J. 2017, 843, 32. [Google Scholar] [CrossRef]
  42. Li, J.; Wong, K.W.K.; Hogg, D.W.; Rix, H.W.; Chandra, V. AspGap: Augmented Stellar Parameters and Abundances for 37 Million Red Giant Branch Stars from Gaia XP Low-resolution Spectra. Astrophys. J. Suppl. Ser. 2024, 272, 2. [Google Scholar] [CrossRef]
  43. Luo, A.L.; Zhao, Y.H.; Zhao, G.; Deng, L.-C.; Liu, X.-W.; Jing, Y.-P.; Wang, G.; Zhang, H.-T.; Shi, J.-R.; Cui, X.-Q.; et al. VizieR Online Data Catalog: LAMOST DR5 catalogs (Luo+, 2019). VizieR Online Data Catalog 2019, V/164. [Google Scholar]
  44. Bai, Z.R.; Zhang, H.T.; Yuan, H.L.; Fan, D.W.; He, B.L.; Lei, Y.J.; Dong, Y.Q.; Yu, S.C.; Zhao, Y.H.; Zhang, Y.; et al. The first data release of LAMOST low-resolution single-epoch spectra. Res. Astron. Astrophys. 2021, 21, 249. [Google Scholar] [CrossRef]
  45. Pavlovski, K.; Hensberge, H. Reconstruction and Analysis of Component Spectra of Binary and Multiple Stars. In Proceedings of the Binaries—Key to Comprehension of the Universe, Brno, Czech Republic, 8–12 June 2009; Prša, A., Zejda, M., Eds.; Astronomical Society of the Pacific Conference Series; Astronomical Society of the Pacific: San Francisco, CA, USA, 2010; Volume 435, p. 207. [Google Scholar] [CrossRef]
  46. Hełminiak, K.G.; Tokovinin, A.; Niemczura, E.; Pawłaszek, R.; Yanagisawa, K.; Brahm, R.; Espinoza, N.; Ukita, N.; Kambe, E.; Ratajczak, M.; et al. Orbital and physical parameters of eclipsing binaries from the All-Sky Automated Survey catalogue. X. Three high-contrast systems with secondaries detected with IR spectroscopy. Astron. Astrophys. 2019, 622, A114. [Google Scholar] [CrossRef]
  47. Furlan, E.; Howell, S.B. Unresolved Binary Exoplanet Host Stars Fit as Single Stars: Effects on the Stellar Parameters. Astrophys. J. 2020, 898, 47. [Google Scholar] [CrossRef]
  48. Cox, A.N. Allen’s Astrophysical Quantities; Springer: New York, NY, USA, 2000. [Google Scholar]
  49. Castelli, F.; Kurucz, R.L. New Grids of ATLAS9 Model Atmospheres. In Modelling of Stellar Atmospheres; Piskunov, N., Weiss, W.W., Gray, D.F., Eds.; Uppsala University: Uppsala, Sweden, 2003; Volume 210, p. A20. [Google Scholar] [CrossRef]
  50. Du, B.; Luo, A.L.; Kong, X.; Zhang, J.N.; Guo, Y.X.; Cook, N.J.; Hou, W.; Yang, H.F.; Li, Y.B.; Song, Y.H.; et al. LAMOST Spectrograph Response Curves: Stability and Application to Flux Calibration. Astrophys. J. Suppl. Ser. 2016, 227, 27. [Google Scholar] [CrossRef]
  51. Pourbaix, D.; Tokovinin, A.A.; Batten, A.H.; Fekel, F.C.; Hartkopf, W.I.; Levato, H.; Morrell, N.I.; Torres, G.; Udry, S. SB9: The ninth catalogue of spectroscopic binary orbits. Astron. Astrophys. 2004, 424, 727–732. [Google Scholar] [CrossRef]
  52. Allen, L.E.; Strom, K.M. Moderate-Resolution Spectral Standards From lambda5600 to lambda9000 angstrom. Astron. J. 1995, 109, 1379. [Google Scholar] [CrossRef]
  53. Prugniel, P.; Soubiran, C.; Koleva, M.; Le Borgne, D. New release of the ELODIE library: Version 3.1. arXiv 2007. [Google Scholar] [CrossRef]
  54. Valdes, F.; Gupta, R.; Rose, J.A.; Singh, H.P.; Bell, D.J. The Indo-US Library of Coudé Feed Stellar Spectra. Astrophys. J. Suppl. Ser. 2004, 152, 251–259. [Google Scholar] [CrossRef]
  55. Falcón-Barroso, J.; Sánchez-Blázquez, P.; Vazdekis, A.; Ricciardelli, E.; Cardiel, N.; Cenarro, A.J.; Gorgas, J.; Peletier, R.F. An updated MILES stellar library and stellar population models. Astron. Astrophys. 2011, 532, A95. [Google Scholar] [CrossRef]
  56. Heap, S.R.; Lindler, D.J. Hubble’s Next Generation Spectral Library (NGSL). In From Stars to Galaxies: Building the Pieces to Build Up the Universe; Vallenari, A., Tantalo, R., Portinari, L., Moretti, A., Eds.; Astronomical Society of the Pacific Conference Series; Astronomical Society of the Pacific: San Francisco, CA, USA, 2007; Volume 374, p. 409. [Google Scholar]
  57. Kornilov, V.; Mironov, A.; Zakharov, A. The WBVR Photometry of Bright Northern Stars. Balt. Astron. 1996, 5, 379–390. [Google Scholar] [CrossRef]
  58. Wielen, R.; Schwan, H.; Dettbarn, C.; Lenhardt, H.; Jahreiß, H.; Jährling, R. Sixth Catalogue of Fundamental Stars (FK6). Part I. Basic fundamental stars with direct solutions. Veroeffentlichungen Astron. Rechen-Instituts Heidelb. 1999, 35, 1. [Google Scholar]
  59. Fouesneau, M.; Frémat, Y.; Andrae, R.; Korn, A.J.; Soubiran, C.; Kordopatis, G.; Vallenari, A.; Heiter, U.; Creevey, O.L.; Sarro, L.M.; et al. Gaia Data Release 3. Apsis. II. Stellar parameters. Astron. Astrophys. 2023, 674, A28. [Google Scholar] [CrossRef]
  60. Lindegren, L.; Klioner, S.A.; Hernández, J.; Bombrun, A.; Ramos-Lerate, M.; Steidelmüller, H.; Bastian, U.; Biermann, M.; de Torres, A.; Gerlach, E.; et al. Gaia Early Data Release 3. The astrometric solution. Astron. Astrophys. 2021, 649, A2. [Google Scholar] [CrossRef]
  61. Riello, M.; De Angeli, F.; Evans, D.W.; Montegriffo, P.; Carrasco, J.M.; Busso, G.; Palaversa, L.; Burgess, P.W.; Diener, C.; Davidson, M.; et al. Gaia Early Data Release 3. Photometric content and validation. Astron. Astrophys. 2021, 649, A3. [Google Scholar] [CrossRef]
  62. Belokurov, V.; Penoyre, Z.; Oh, S.; Iorio, G.; Hodgkin, S.; Evans, N.W.; Everall, A.; Koposov, S.E.; Tout, C.A.; Izzard, R.; et al. Unresolved stellar companions with Gaia DR2 astrometry. Mon. Not. RAS 2020, 496, 1922–1940. [Google Scholar] [CrossRef]
  63. Gaia Collaboration; Arenou, F.; Babusiaux, C.; Barstow, M.A.; Faigler, S.; Jorissen, A.; Kervella, P.; Mazeh, T.; Mowlavi, N.; Panuzzo, P.; et al. Gaia Data Release 3. Stellar multiplicity, a teaser for the hidden treasure. Astron. Astrophys. 2023, 674, A34. [Google Scholar] [CrossRef]
  64. Koleva, M.; Prugniel, P.; Bouchard, A.; Wu, Y. ULySS: A full spectrum fitting package. Astron. Astrophys. 2009, 501, 1269–1279. [Google Scholar] [CrossRef]
  65. Sharma, K.; Prugniel, P.; Singh, H.P.; Koleva, M. Analysis of stellar spectra using ULySS. In Astronomical Society of India Conference Series; Prugniel, P., Singh, H.P., Eds.; Astronomical Society of India: Hyderabad, India, 2012; Volume 6, p. 257. [Google Scholar]
  66. Hebb, L.; Cargile, P. SME@XSEDE: An automated spectral synthesis tool for stellar characterization. In American Astronomical Society Meeting Abstracts #225; American Astronomical Society: Washington, DC, USA, 2015; Volume 225, p. 138.13. [Google Scholar]
  67. Rosario Franco, M.; Cargile, P.; Hebb, L.; Johnson, J.A. vis.SME—Building a Visualization Tool to Analyze and Share Spectral Synthesis Stellar Characterization. In American Astronomical Society Meeting Abstracts #223; American Astronomical Society: Washington, DC, USA, 2014; Volume 223, p. 347.36. [Google Scholar]
  68. Piskunov, N. Deriving stellar parameters with the SME software package. In Proceedings of the Second BRITE-Constellation Science Conference: Small Satellites—Big Science, Innsbruck, Austria, 22–26 August 2016; Zwintz, K., Poretti, E., Eds.; Polish Astronomical Society: Warsaw, Poland, 2017; Volume 5, pp. 209–213. [Google Scholar]
  69. Allende-Prieto, C.; Apogee Team. FERRE: A Code for Spectroscopic Analysis. In American Astronomical Society Meeting Abstracts #225; American Astronomical Society: Washington, DC, USA, 2015; Volume 225, p. 422.07. [Google Scholar]
  70. Ting, Y.S.; Conroy, C.; Rix, H.W.; Cargile, P. The Payne: Self-consistent ab initio Fitting of Stellar Spectra. Astrophys. J. 2019, 879, 69. [Google Scholar] [CrossRef]
  71. Koposov, S.E. RVSpecFit: Radial velocity and stellar atmospheric parameter fitting. In Astrophysics Source Code Library, Record ascl:1907.013; 2019; Available online: https://ascl.net/1907.013 (accessed on 24 July 2025).
  72. Cardelli, J.A.; Clayton, G.C.; Mathis, J.S. The Relationship between Infrared, Optical, and Ultraviolet Extinction. Astrophys. J. 1989, 345, 245. [Google Scholar] [CrossRef]
  73. Gaia Collaboration; Brown, A.G.A.; Vallenari, A.; Prusti, T.; de Bruijne, J.H.J.; Babusiaux, C.; Biermann, M.; Creevey, O.L.; Evans, D.W.; Eyer, L.; et al. Gaia Early Data Release 3. Summary of the contents and survey properties. Astron. Astrophys. 2021, 649, A1. [Google Scholar] [CrossRef]
  74. Lallement, R.; Vergely, J.L.; Valette, B.; Puspitarini, L.; Eyer, L.; Casagrande, L. 3D maps of the local ISM from inversion of individual color excess measurements. Astron. Astrophys. 2014, 561, A91. [Google Scholar] [CrossRef]
  75. Capitanio, L.; Lallement, R.; Vergely, J.L.; Elyajouri, M.; Monreal-Ibero, A. Three-dimensional mapping of the local interstellar medium with composite data. Astron. Astrophys. 2017, 606, A65. [Google Scholar] [CrossRef]
  76. Lallement, R.; Capitanio, L.; Ruiz-Dern, L.; Danielski, C.; Babusiaux, C.; Vergely, L.; Elyajouri, M.; Arenou, F.; Leclerc, N. Three-dimensional maps of interstellar dust in the Local Arm: Using Gaia, 2MASS, and APOGEE-DR14. Astron. Astrophys. 2018, 616, A132. [Google Scholar] [CrossRef]
  77. Pogson, N. Magnitudes of Thirty-six of the Minor Planets for the first day of each month of the year 1857. Mon. Not. RAS 1856, 17, 12–15. [Google Scholar] [CrossRef]
  78. Taylor, M.B. TOPCAT & STIL: Starlink Table/VOTable Processing Software. In Astronomical Data Analysis Software and Systems XIV; Astronomical Society of the Pacific Conference Series; Shopbell, P., Britton, M., Ebert, R., Eds.; Astronomical Society of the Pacific: San Francisco, CA, USA, 2005; Volume 347, p. 29. [Google Scholar]
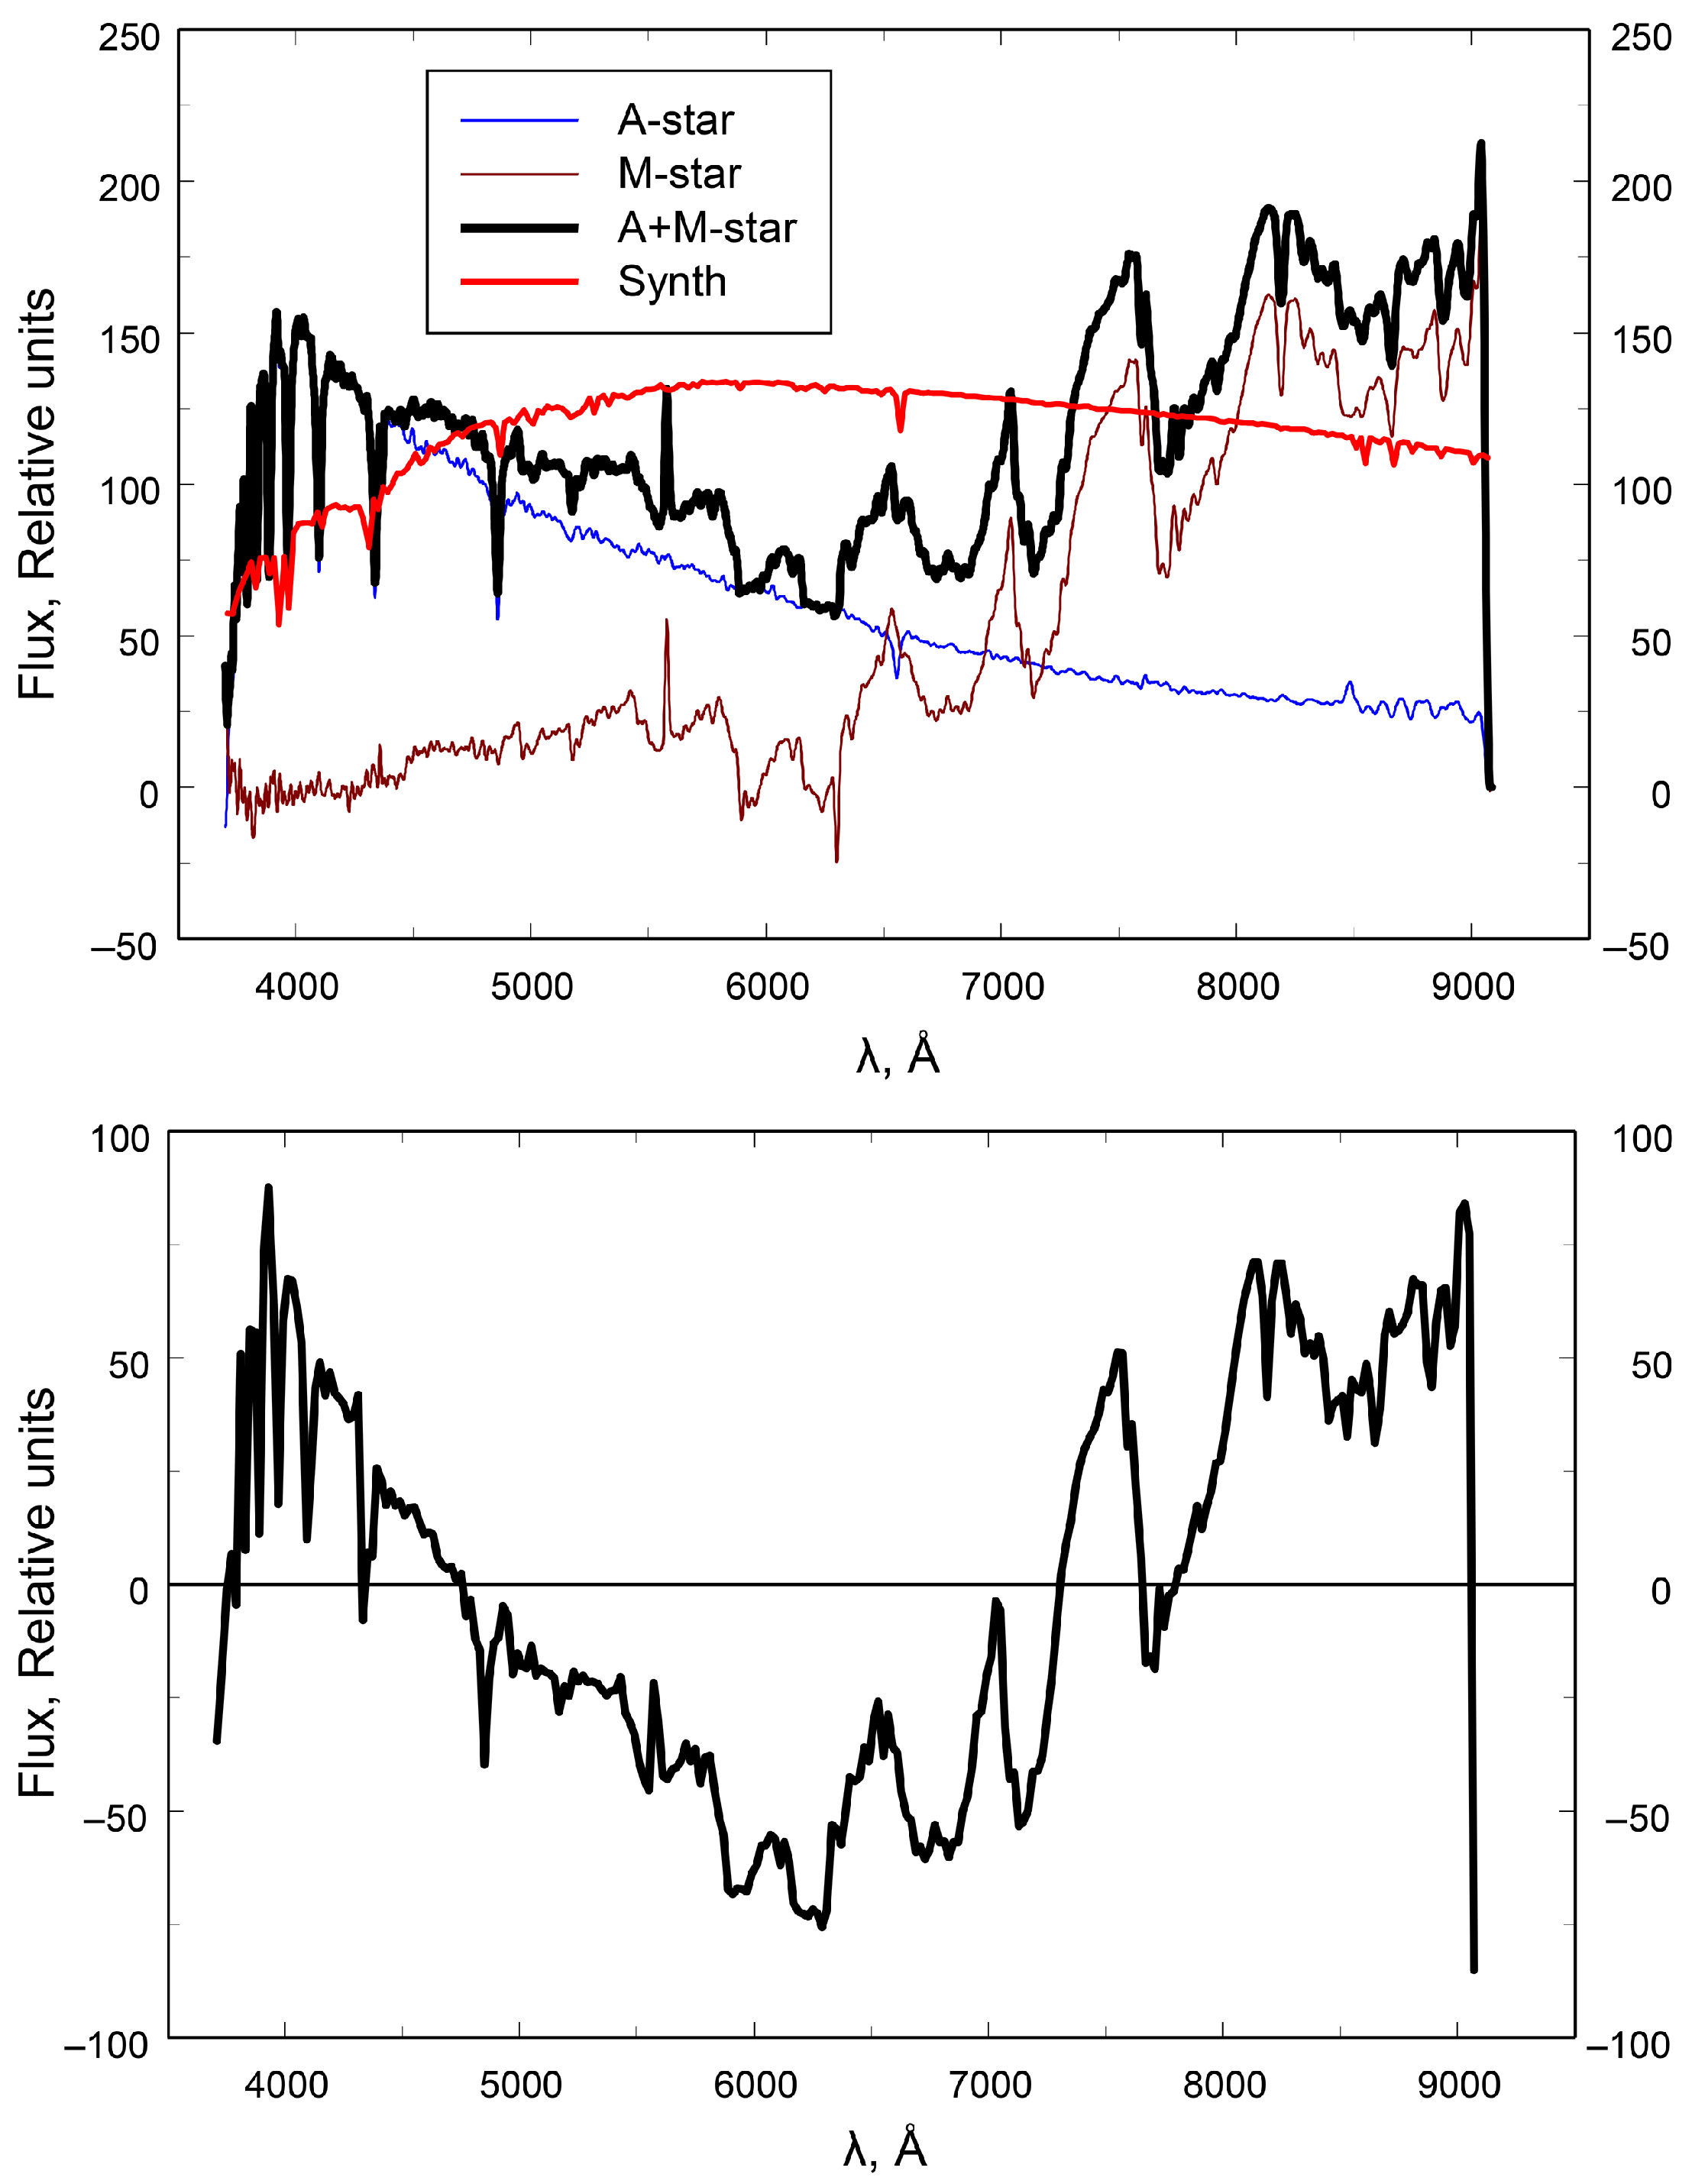
Figure 1. Upper panel—the combination of spectra of stars belonging to A1V and M6 spectral types from the LAMOST catalog as a spectrum of an unresolved binary with equal radiation fluxes from both components and the closest synthetic spectrum from the Castelli–Kurucz library (CKL). Lower panel—the difference between the spectrum of the unresolved binary with A1V and M6 components shown in the upper panel and the closest synthetic spectrum from CKL.
Galaxies 13 00083 g001
Figure 2. A LAMOST spectrum with outliers. Vertical dotted lines in this and the next figure mark the wavelengths of several spectral lines. The down arrow indicates the short-wave boundary of the region at the edge of the spectrum in which outliers are sought. The up arrow is the short-wave edge of the outlier in the presented spectrum.
Galaxies 13 00083 g002
Figure 3. A LAMOST spectrum without outliers.
Galaxies 13 00083 g003
Figure 4. Upper panel—distribution of 278 observations of 166 single stars from the Main_Single list over rms residual deviations. Vertical lines indicate characteristic levels of rms = 5.5% and 6.5%.
Galaxies 13 00083 g004
Figure 5. Distribution of 1000 putative single stars (gray histogram) and 1000 putative unresolved binaries (shaded histogram) from the Gaia DR3 catalog. Bin width 0.25.
Galaxies 13 00083 g005
Table 1. Stars from the LAMOST DR5 catalog.
Obs_IDDesignation α δ Sp.
404058J004541.11 + 405100.111.42140.850A1V
113226J221422.57 + 005400.8333.5940.900M6
Disclaimer/Publisher’s Note: The statements, opinions and data contained in all publications are solely those of the individual author(s) and contributor(s) and not of MDPI and/or the editor(s). MDPI and/or the editor(s) disclaim responsibility for any injury to people or property resulting from any ideas, methods, instructions or products referred to in the content.