Abstract
We report new medium-resolution spectroscopy covering the wavelength range from 0.6 to 2.4 m, as well as multi-epoch, multi-wavelength photometry, of the Class I high-mass embedded young stellar object Mol 12 (IRAS 05373+2349). It is embedded () in the centre of a dense core at a distance of 1.59 kpc from the Sun and has a total luminosity of . The spectra show a large number of permitted atomic emission lines, mostly for Fe, H, C, N, and Ca, that originate in the inner zones of a very active protoplanetary disc and no photospheric absorption lines. Conspicuously, the He I line at 1.0830 m displays a complex P-Cygni profile. Also, the first overtone CO emission band-heads at 2.3 m are seen in emission. From the strengths of the principal emission lines, we determined the accretion rate and luminosity to be y−1 and , respectively. Decade-long light curves show a series of irregular brightness dips of more than four magnitudes in r, becoming shallower as the wavelength increases and disappearing at m. The colour–magnitude diagrams suggest the occurrence of a series of eclipses caused by the passage of small dust cloudlets in front of the star, producing more than 10 magnitudes of extra extinction.
1. Introduction
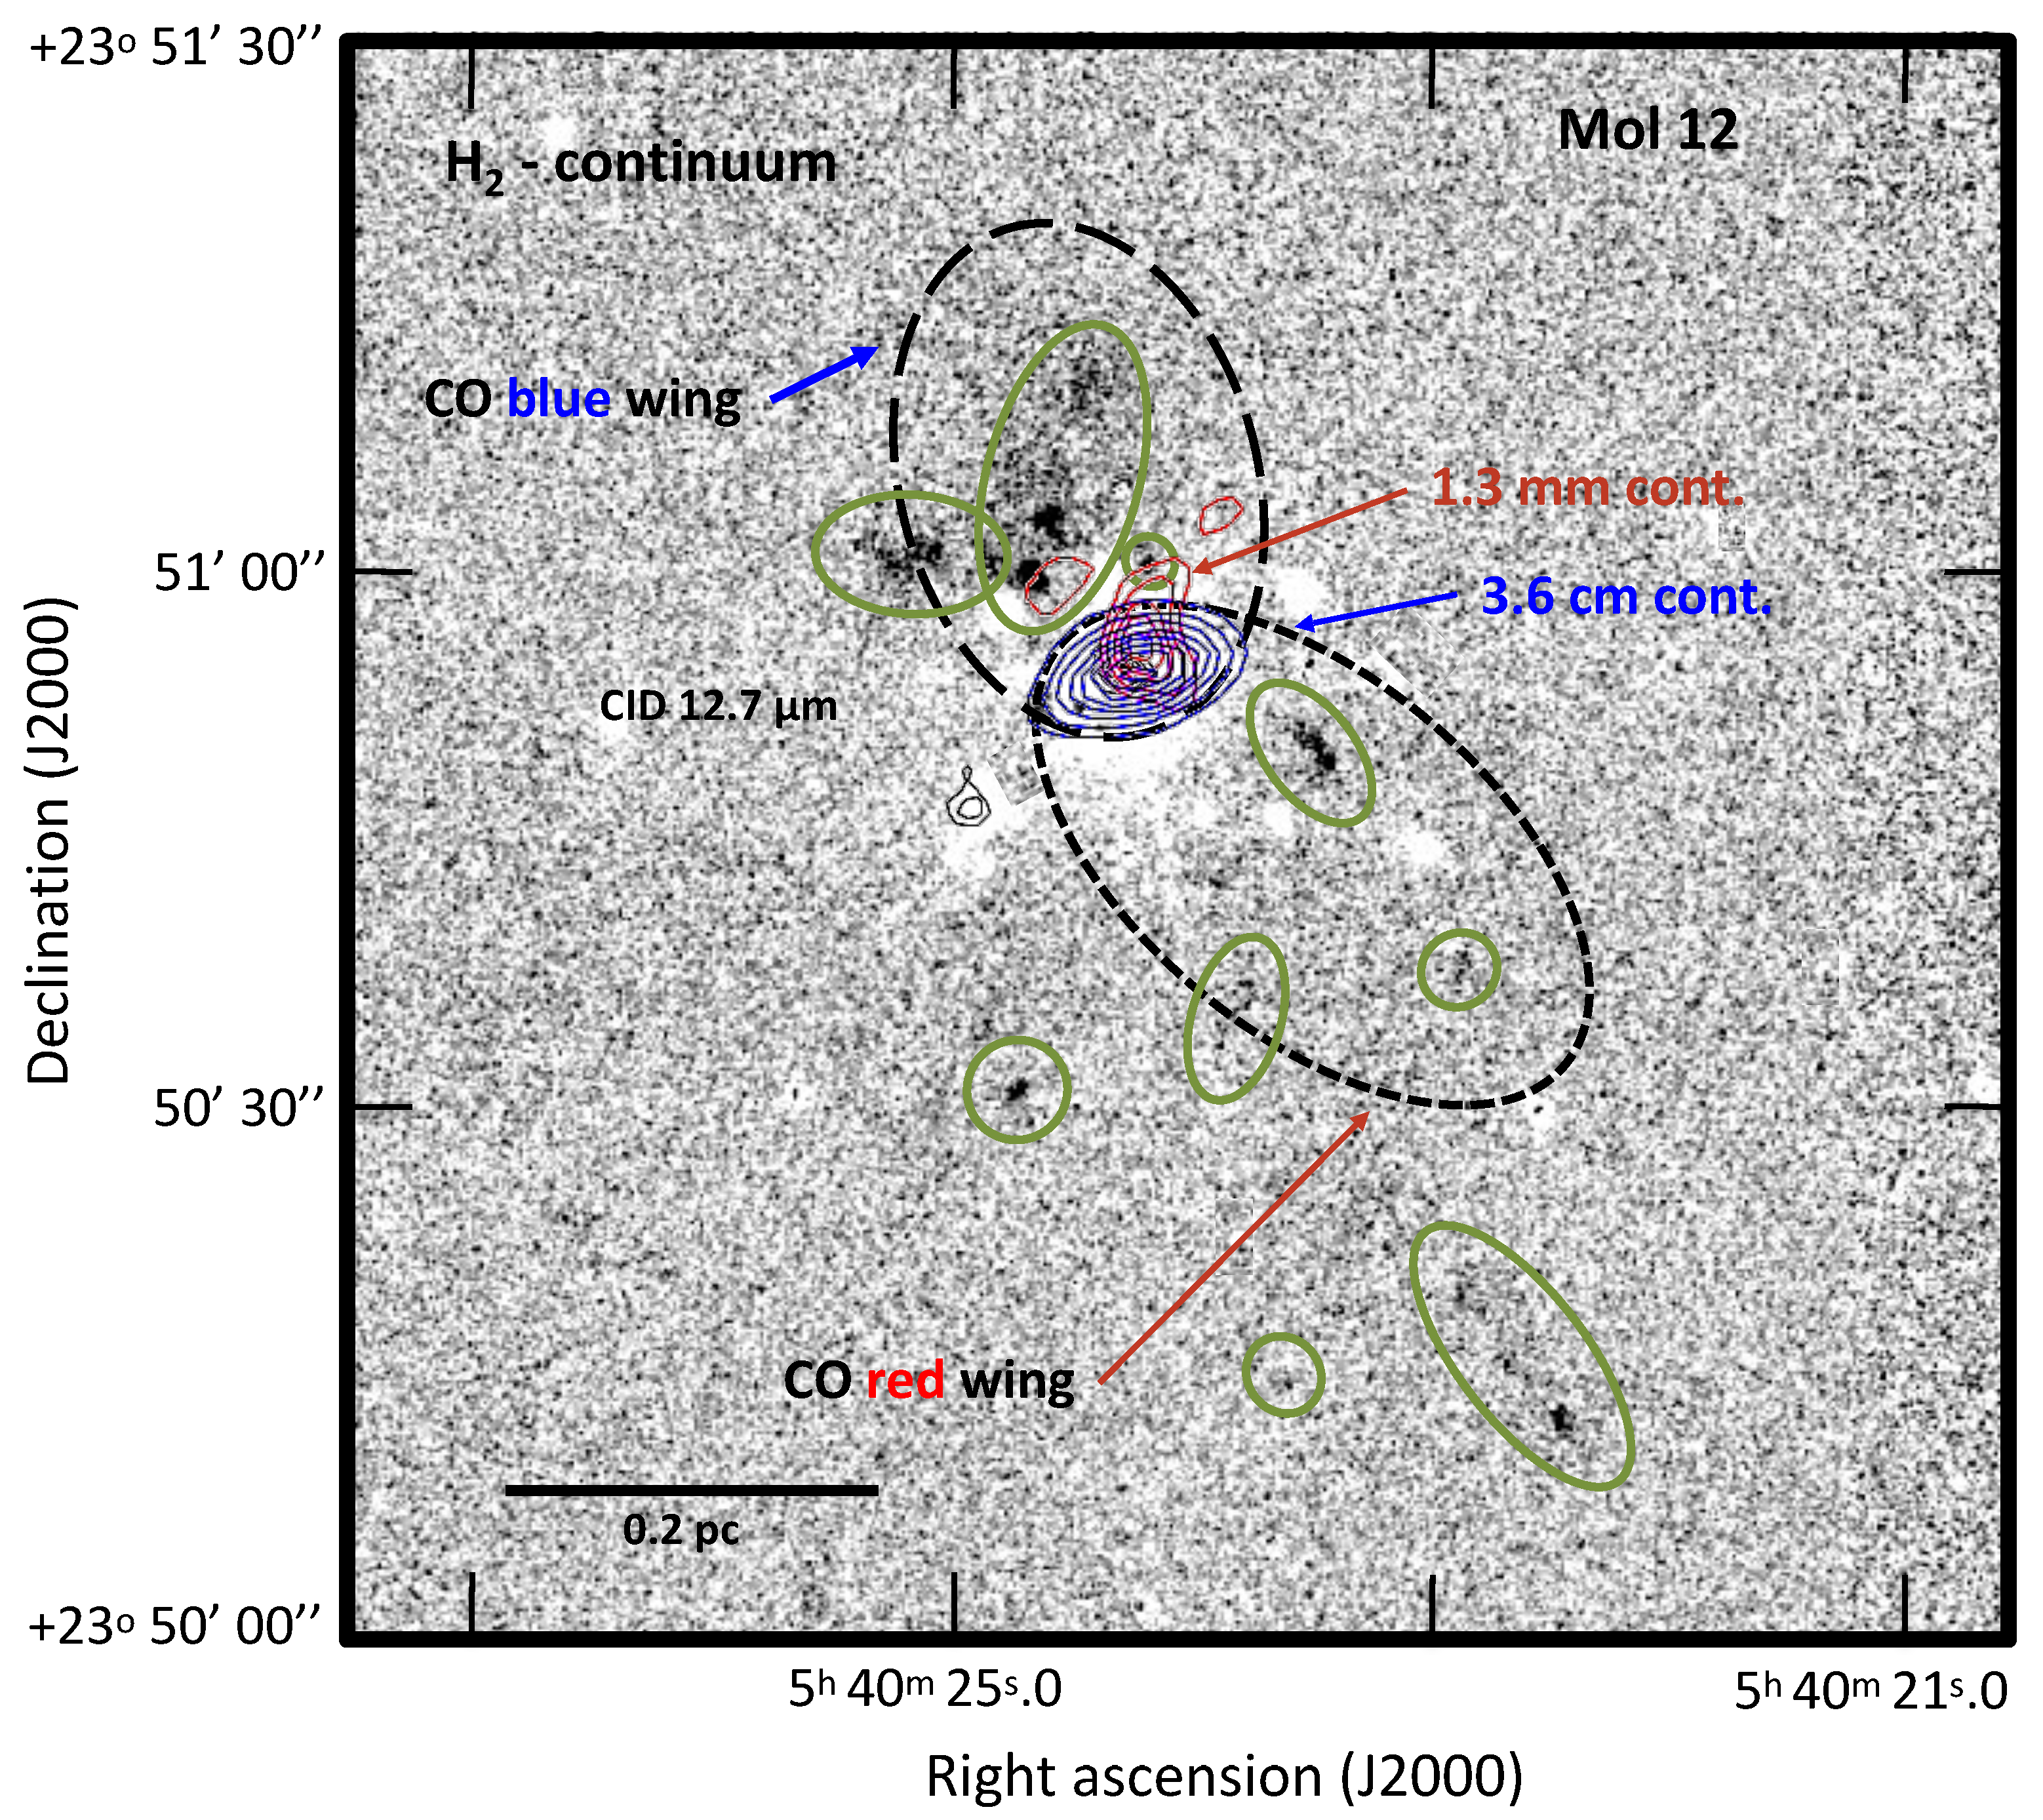
As part of a long-term programme aimed at determining the physical properties of a collection of massive and intermediate-mass very young stellar objects (YSOs), Persi and Tapia [1] reported for the first time the infrared properties of the massive young stellar object (YSO) IRAS 05373+2349, also named Mol 12 [2]. They discovered a cluster of young stars deeply embedded in a dense molecular core. Ample radio studies have described the characteristics of this dense molecular core and its environment. Among its important features is the association with a compact HII region and a system of H2O masers, as well as with a well-developed bipolar CO flow. Several small shocked H2 emission nebulosities have been detected in its vicinity (see Persi and Tapia [1] and the references therein). Figure 1 presents a continuum-subtracted H2 (2.12 m) image of the region (adapted from [1]) illustrating such structures. The distance from the Sun to Mol 12 is kpc [3], as determined by the radio VLBI astrometry of the maser sources. The brightest stellar component of the system, named Mol 12A, was reported to suffer large variations in brightness in optical and near-IR light. Even with very limited photometric data available, Persi and Tapia [1] were able to suggest that these variations might be caused by an eclipse of the young star by a dense dust structure. For the spectral energy distribution from the optical to millimetre wavelengths, a total luminosity of of Mol 12A was determined, suffering at least 12 magnitudes of extinction in the V band [1].
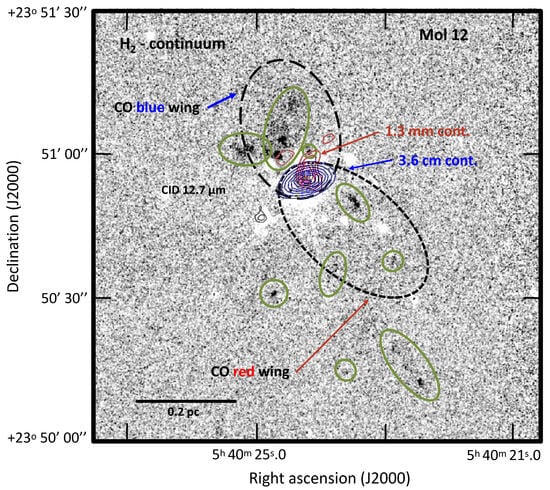
Figure 1.
An image of the continuum-subtracted molecular hydrogen (H2) line at 2.12 m in the square arcminute area surrounding Mol 12. The blue contours represent the compact HII region’s 3.6 cm continuum emission [4], with Mol 12A at its centre. The 1.3 mm thermal dust emission [4] is shown with red contours. The black long- and short-dashed ellipses delineate the main contours of the blue- and red-shifted high-velocity wings of the bipolar 12CO emission lobes [5]. The green ellipses mark the positions of the shocked H2 emission knots [1] surrounding Mol 12. Adapted from [1].
2. Observations and Results
The new spectroscopic study of Mol 12A consisted of optical (6200 to 9000 Å) and near-infrared (0.80 to 2.4 m) spectra. The former were obtained with the spectrograph DOLORES in its low-resolution (R = 710) grism mode attached to the Telescopio Nazionale Galileo at the Roque de los Muchachos Observatory in La Palma, Spain, on 22 December 2019 (MJD 588439.2). The latter were obtained with the spectrograph FIRE in its medium-resolution (R = 6000) Echelle mode attached to the Baade/Magellan Telescope at Las Campanas Observatory in Chile on 13 February 2023 (MJD 59988.1). The reduction and analysis of the spectra were performed using the IRAF package ONEDSPEC, though in the case of FIRE, the reduction to the absolute flux calibration was performed with its own pipeline package, FIREHOSE. Because of the poor atmospheric conditions at the time of observation, the optical spectrum was not calibrated in absolute flux.
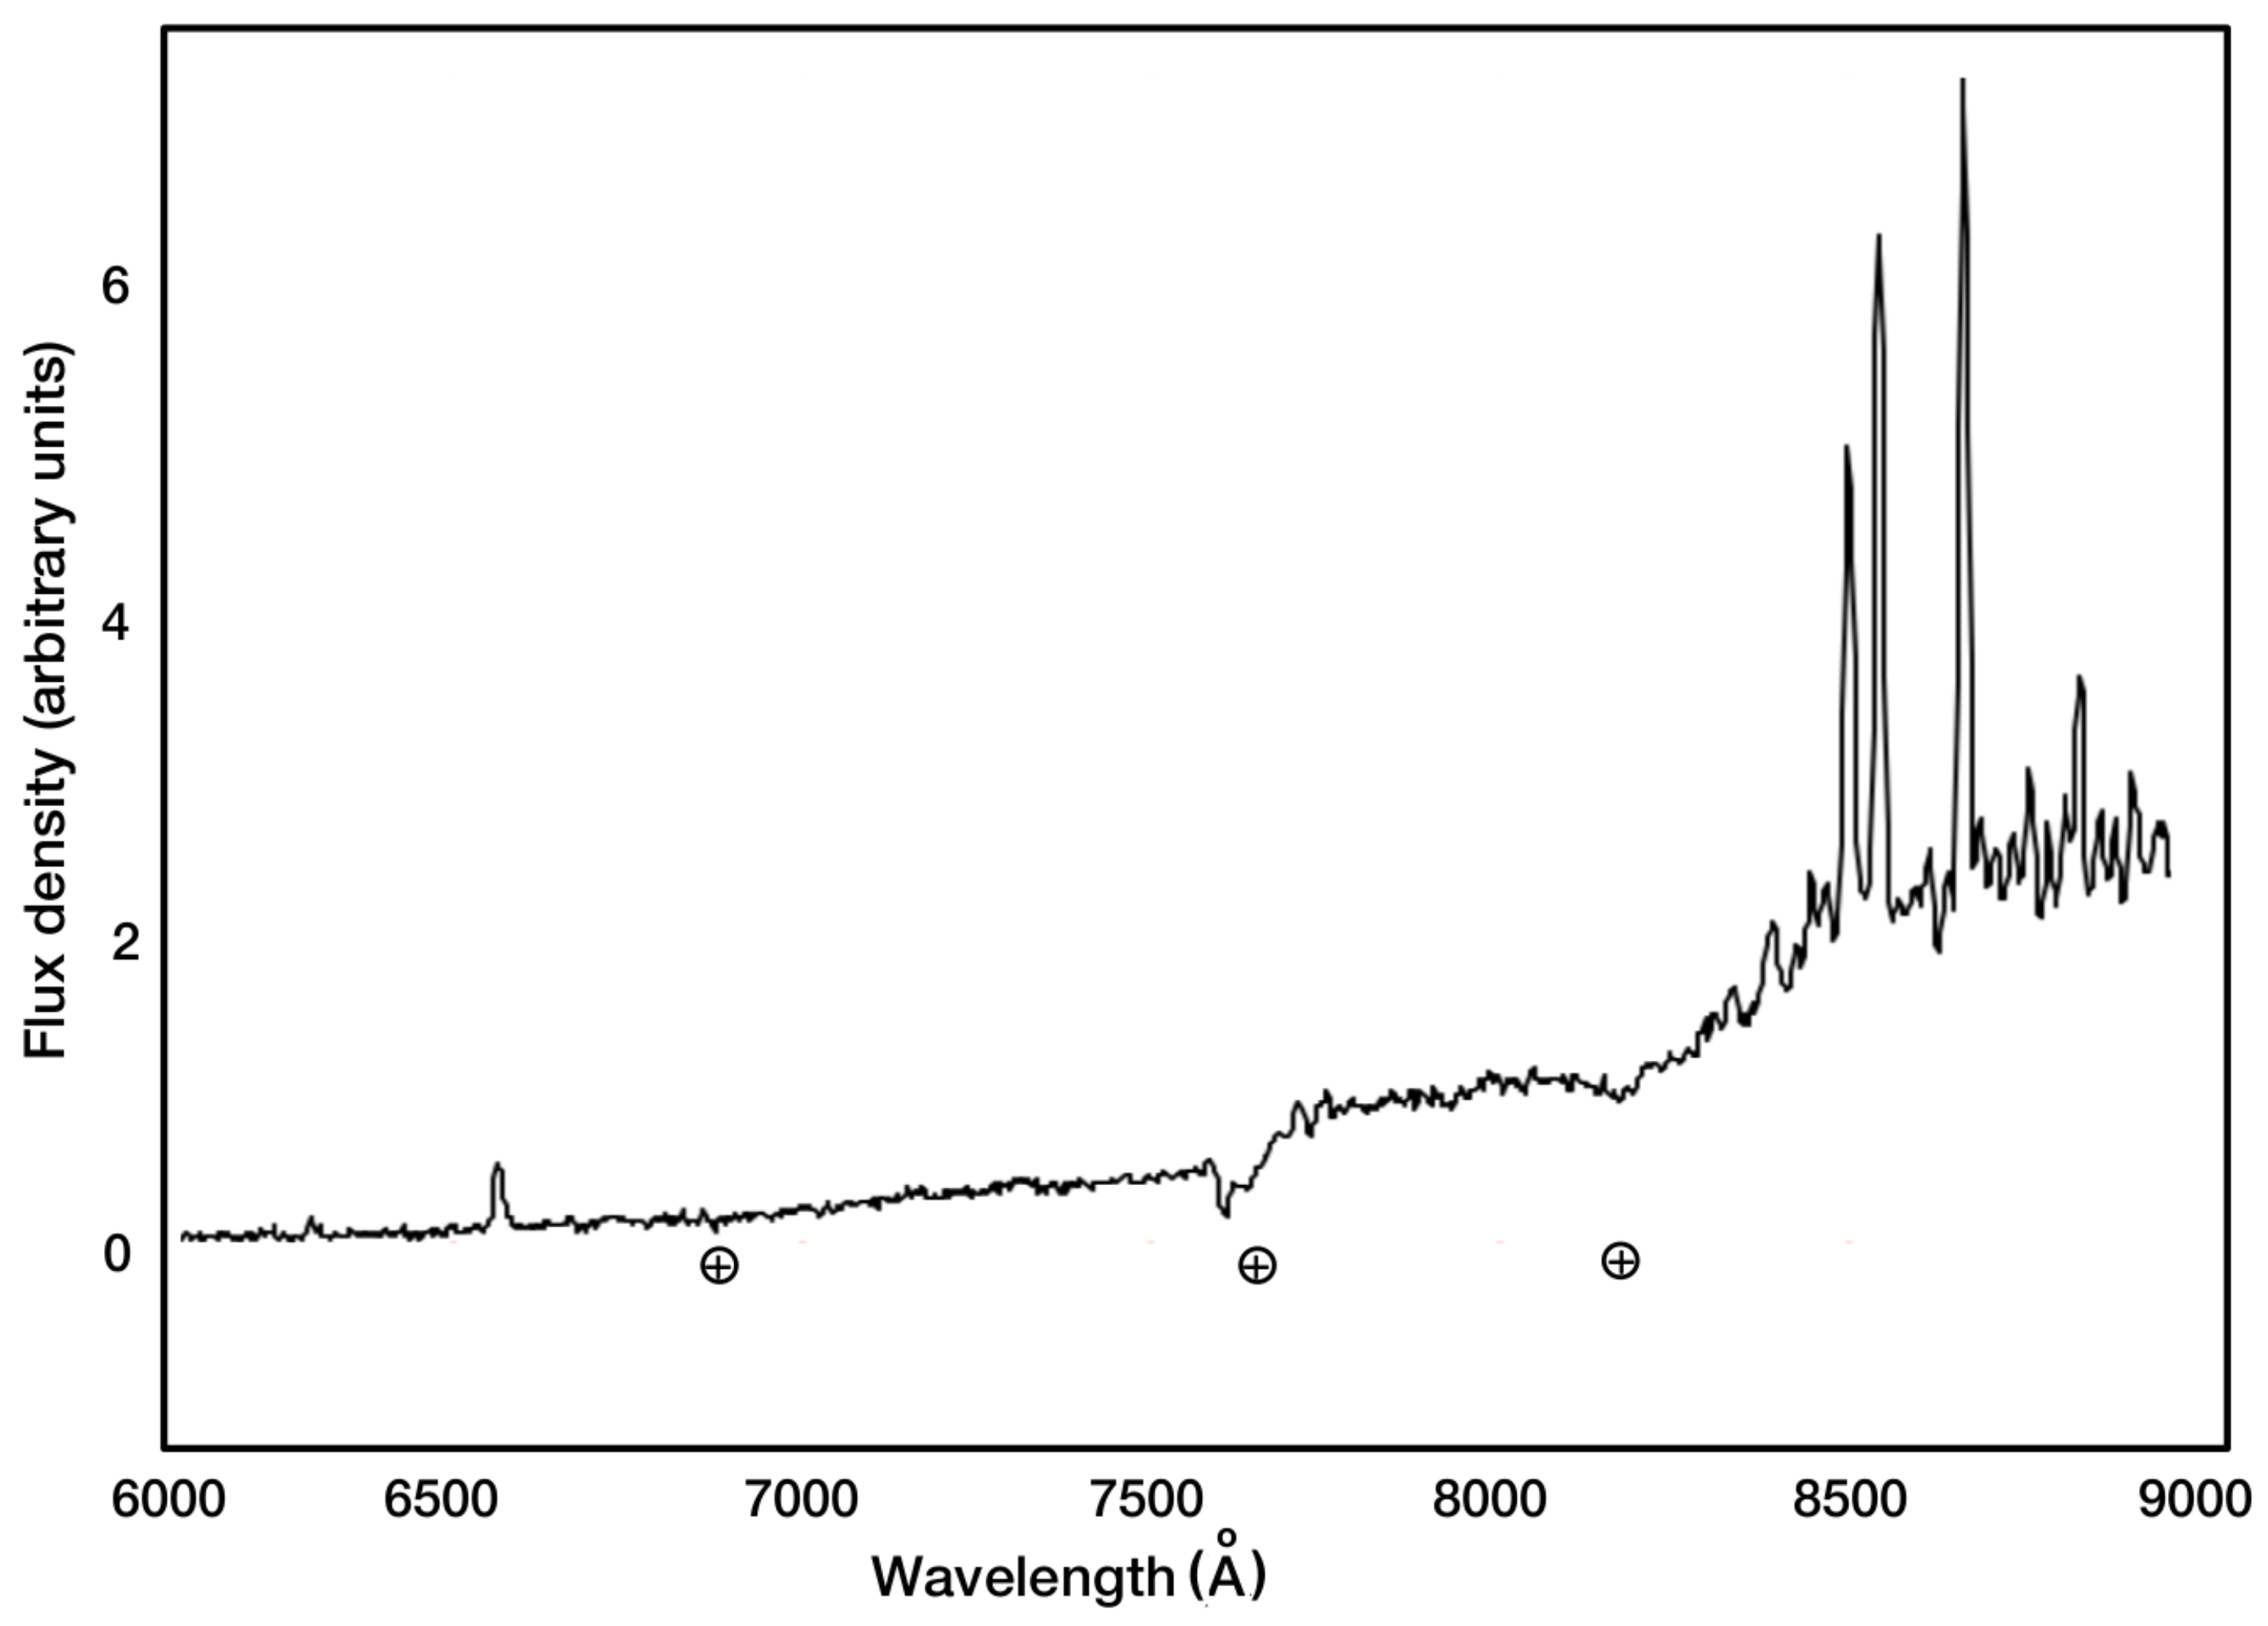
Figure 2 shows the reduced RNG/DOLORES low-resolution spectrum of Mol 12A without absolute flux calibration or correction for the 14 magnitudes of extinction in V, as determined photometrically. The spectrum is dominated by bright emission lines, mainly from the Ca II triplet, H, and [OI]. The spectrum is absent of photospheric absorption lines.
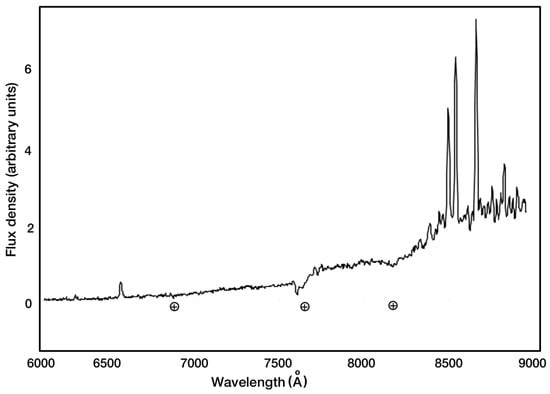
Figure 2.
TNG/DOLORES reduced low-resolution spectrum of Mol 12A in the range of 5900 to 9100 Å. The brightest emission lines, increasing in wavelength, are those of [OI], H, Ca II, and Paschen 12. Note that the spectrum shown is not absolute flux-calibrated or extinction-corrected.
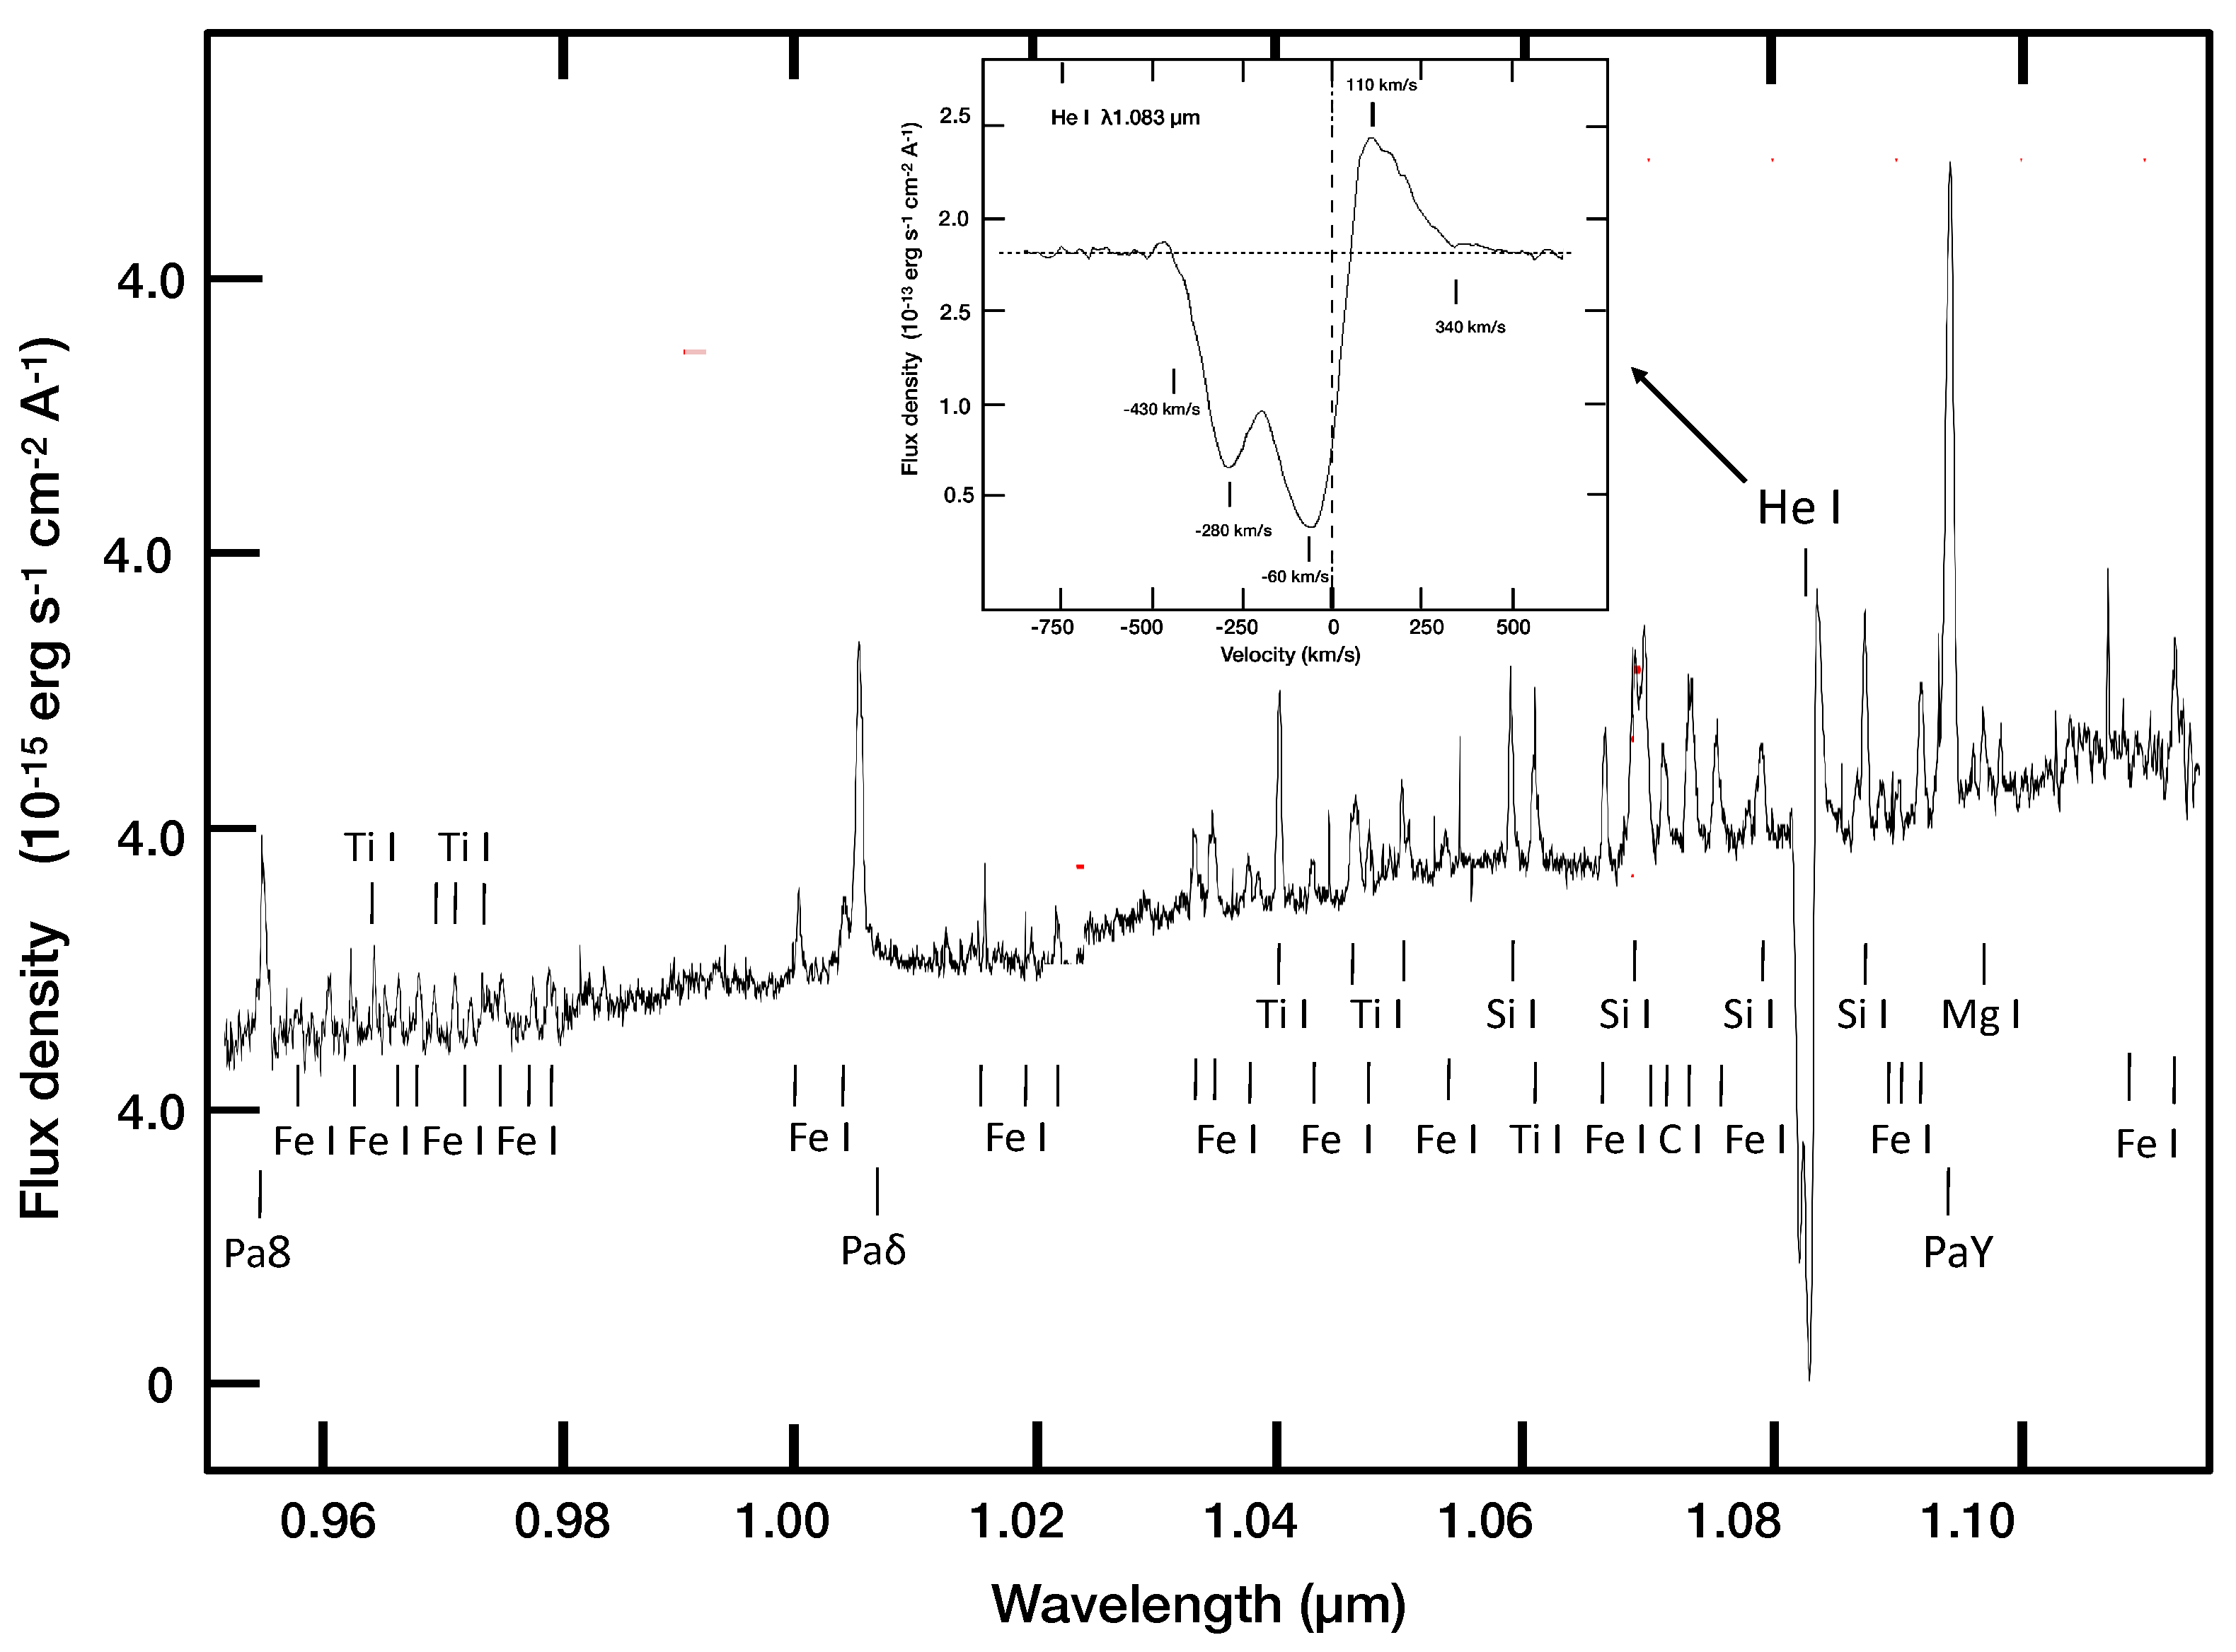
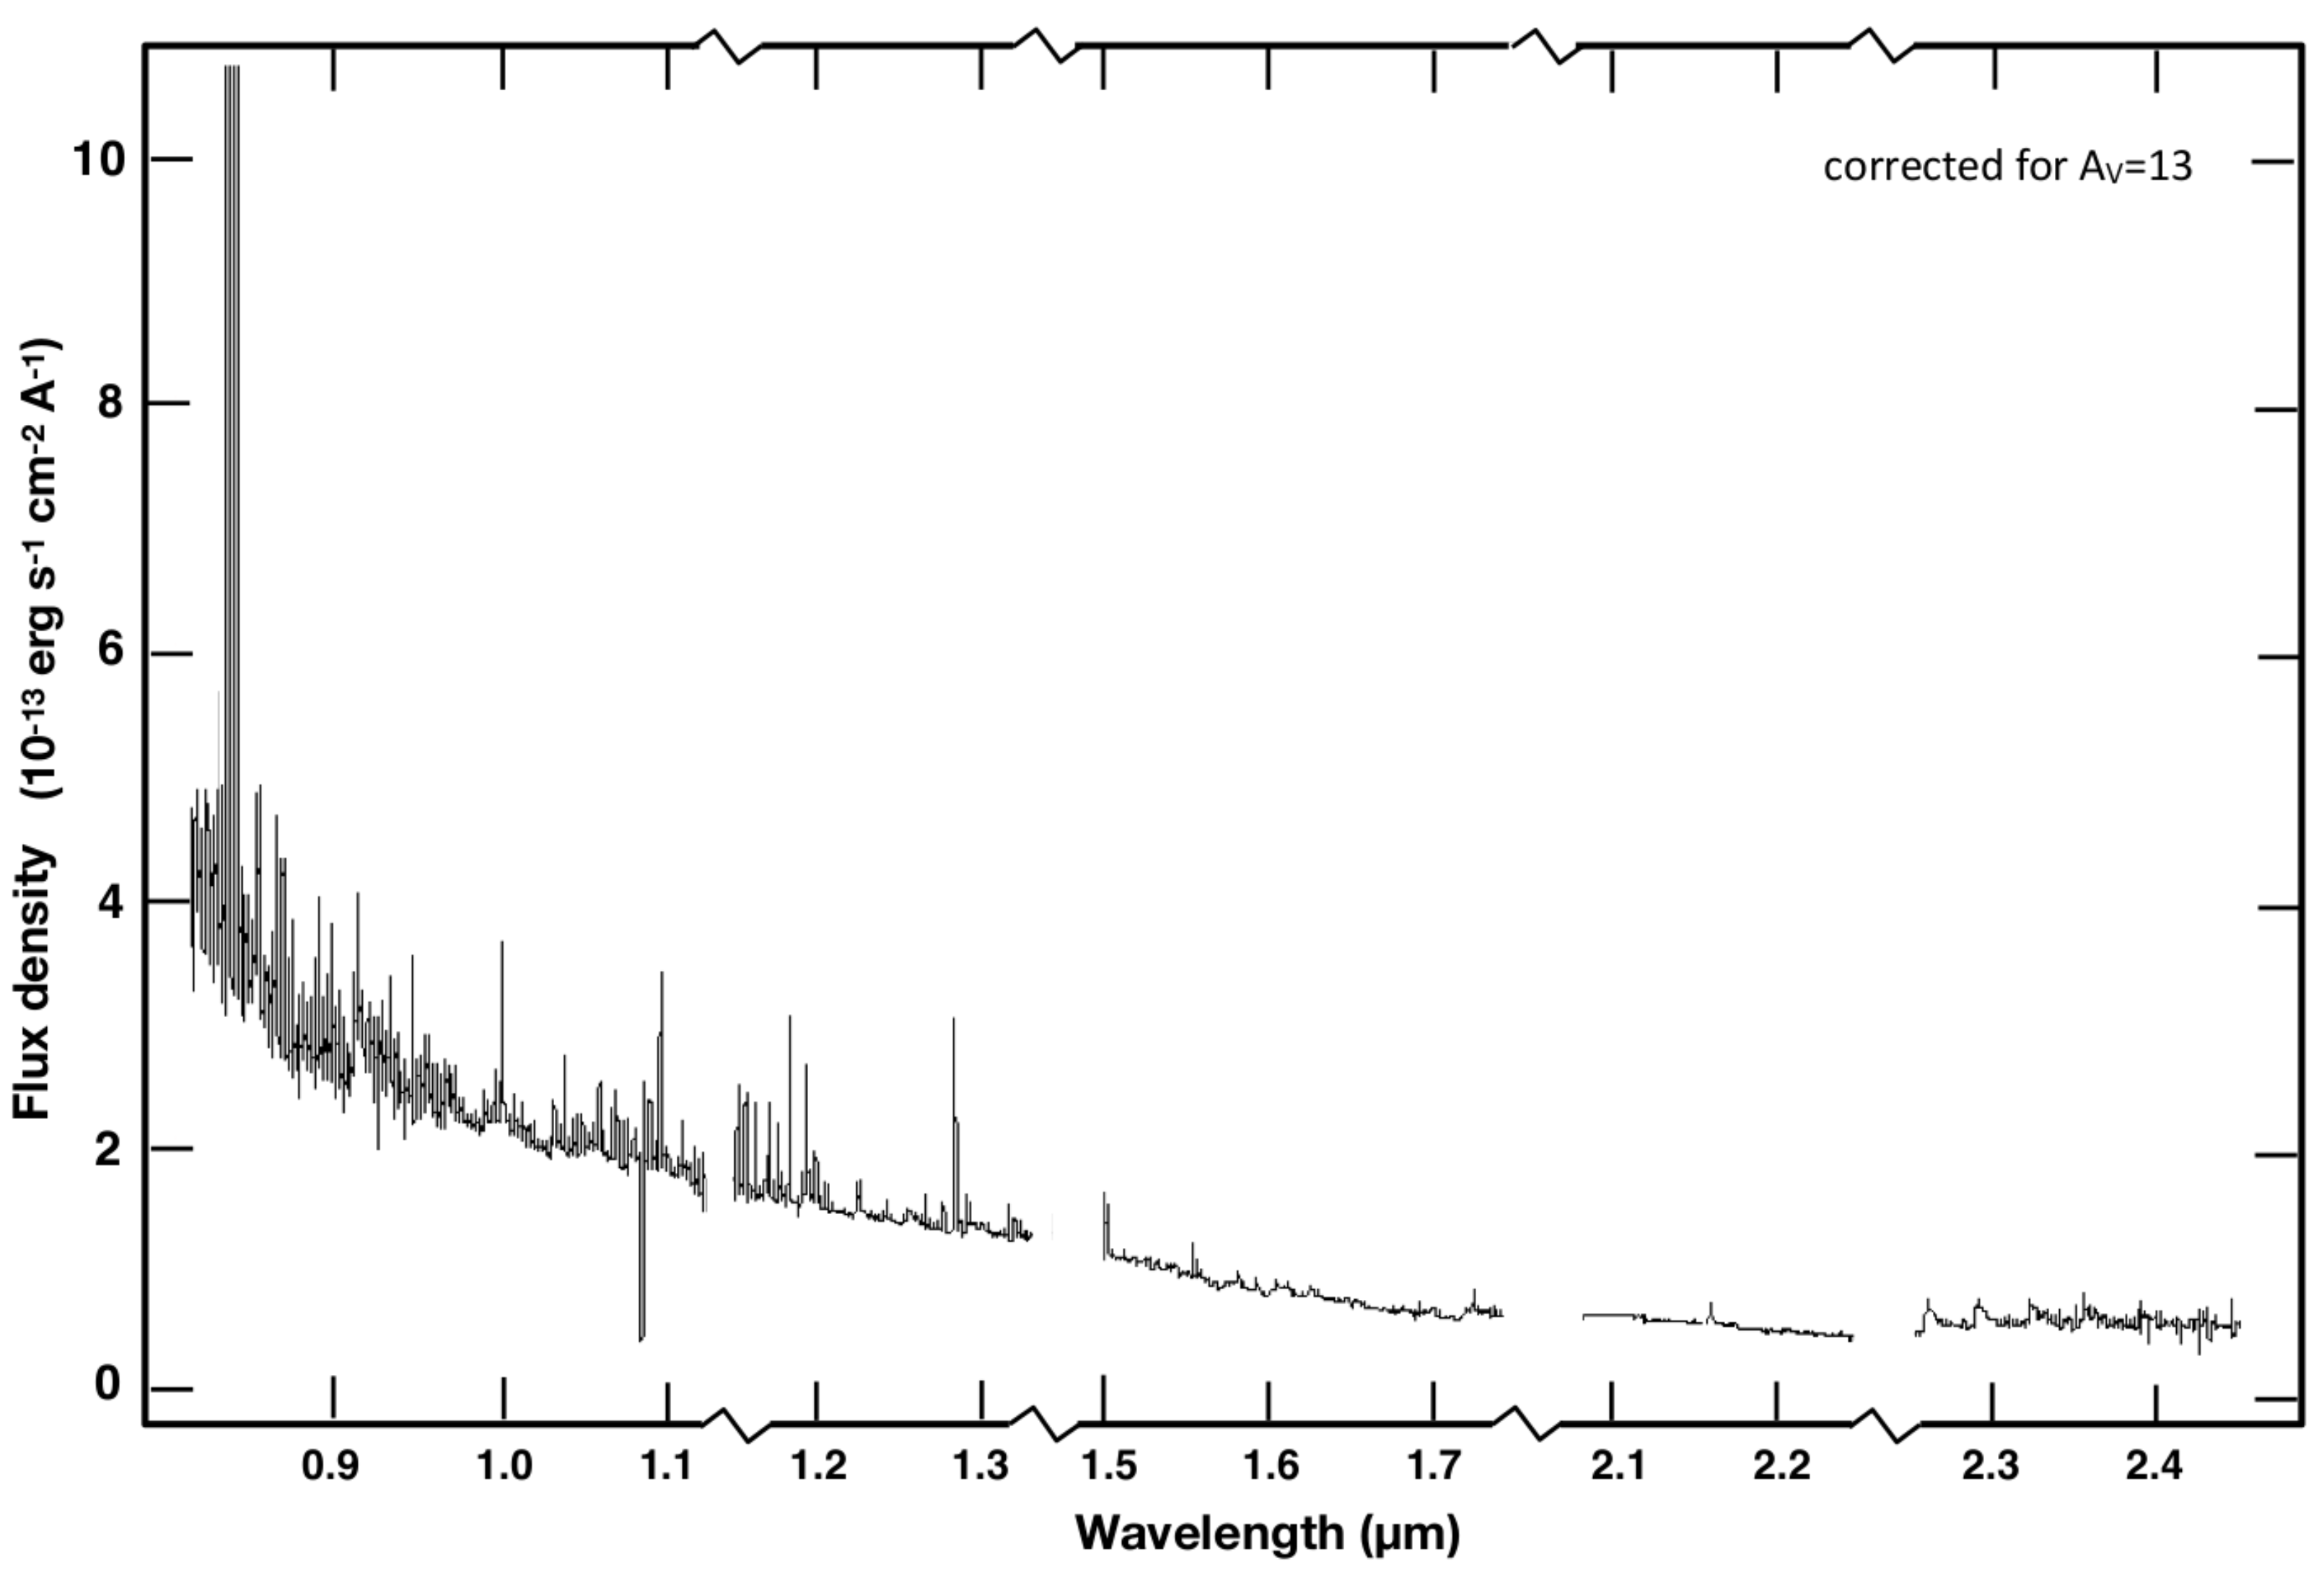
Figure 3 shows the entire absolute flux-calibrated near-IR FIRE spectrum, once it was corrected for , as estimated photometrically for the time of the observations from the light curves. This plot combines the 22 individual sections of the spectrum, each corresponding to one Echelle order. The large number of emission lines, more than one hundred, is evident. All of these have been identified and measured. The great majority are permitted emission lines. namely for He I, Ca I, Ca II, C I, N I, Mg I, Si I, Al I, Ar I, Ti I, and Fe II, and particularly numerous (68) are the Fe I lines. These are in addition to the H line and several H lines of the Paschen and Bracket series. Again, not a single photospheric absorption line was detected above the noise. As an illustration, Figure 4 shows a portion of the spectrum, not extinction-corrected, covering the wavelength range from 0.95 to 1.2 m. The emission lines are identified. The conspicuous He I line at 1.08 m is displayed in more detail in the inset in order to illustrate its complex P-Cygni profile, which implies wind velocities of up to several hundred km s−1. Also important to note is the presence in the emission of the overtone 12CO bands at 2.3–3.4 m, seen in Figure 3.

Figure 3.
The FIRE medium-resolution spectrum of Mol 12, corrected for a standard extinction of , as estimated for the time of observation from the light curves. It covers the range from 0.85 to 2.30 m in the near-IR atmospheric windows. It shows the absolute flux−calibrated Echelle orders of the spectrum.
All these spectral features strongly indicate the presence of a very active protoplanetary disc surrounding Mol 12A, with very high accretion activity and also strong stellar winds. From the luminosity of the principal emission lines (H and Ca II) and using empirical relations determined by Fairlamb et al. [6] and Micolta et al. [7], the following accretion luminosities and mass accretion rates were derived: log– and log–, respectively.

Figure 4.
A section of the absolute flux-calibrated FIRE spectrum of Mol 12A, uncorrected for reddening. It covers the wavelength range from 0.95 to 1.2 m, which corresponds to the Echelle orders 24 to 28. All evident emission lines are identified. The inset shows a blown-up section illustrating the complex P-Cygni profile of the He I 1.08 m line. Adapted from Tapia et al. [8].
Following the suggestion by Persi and Tapia [1] of the occurrence of at least one event of the young, embedded stellar object Mol 12A being eclipsed by dust, we performed the methodic multi- wavelength photometric monitoring of the target. The data were composed mostly of the public archived photometric results from the Zwicky Transien Facility survey (ZTF) in the r and i bands. Other databases consulted were ALLWISE, Gaia, and Pan-STARRS in addition to our own targeted observations. The latter were performed robotically with a simultaneous multi-filter Reionization and Transients InfraRed camera (RATIR, [9,10]) installed on the 1.5 m Harold Johnson telescope of the Observatorio Astronómico Nacional in San Pedro Mártir, Mexico (OAN-SPM). Most of these photometric data were in the i, z, y, J, and H bands, though in a few cases, the r filter was used.
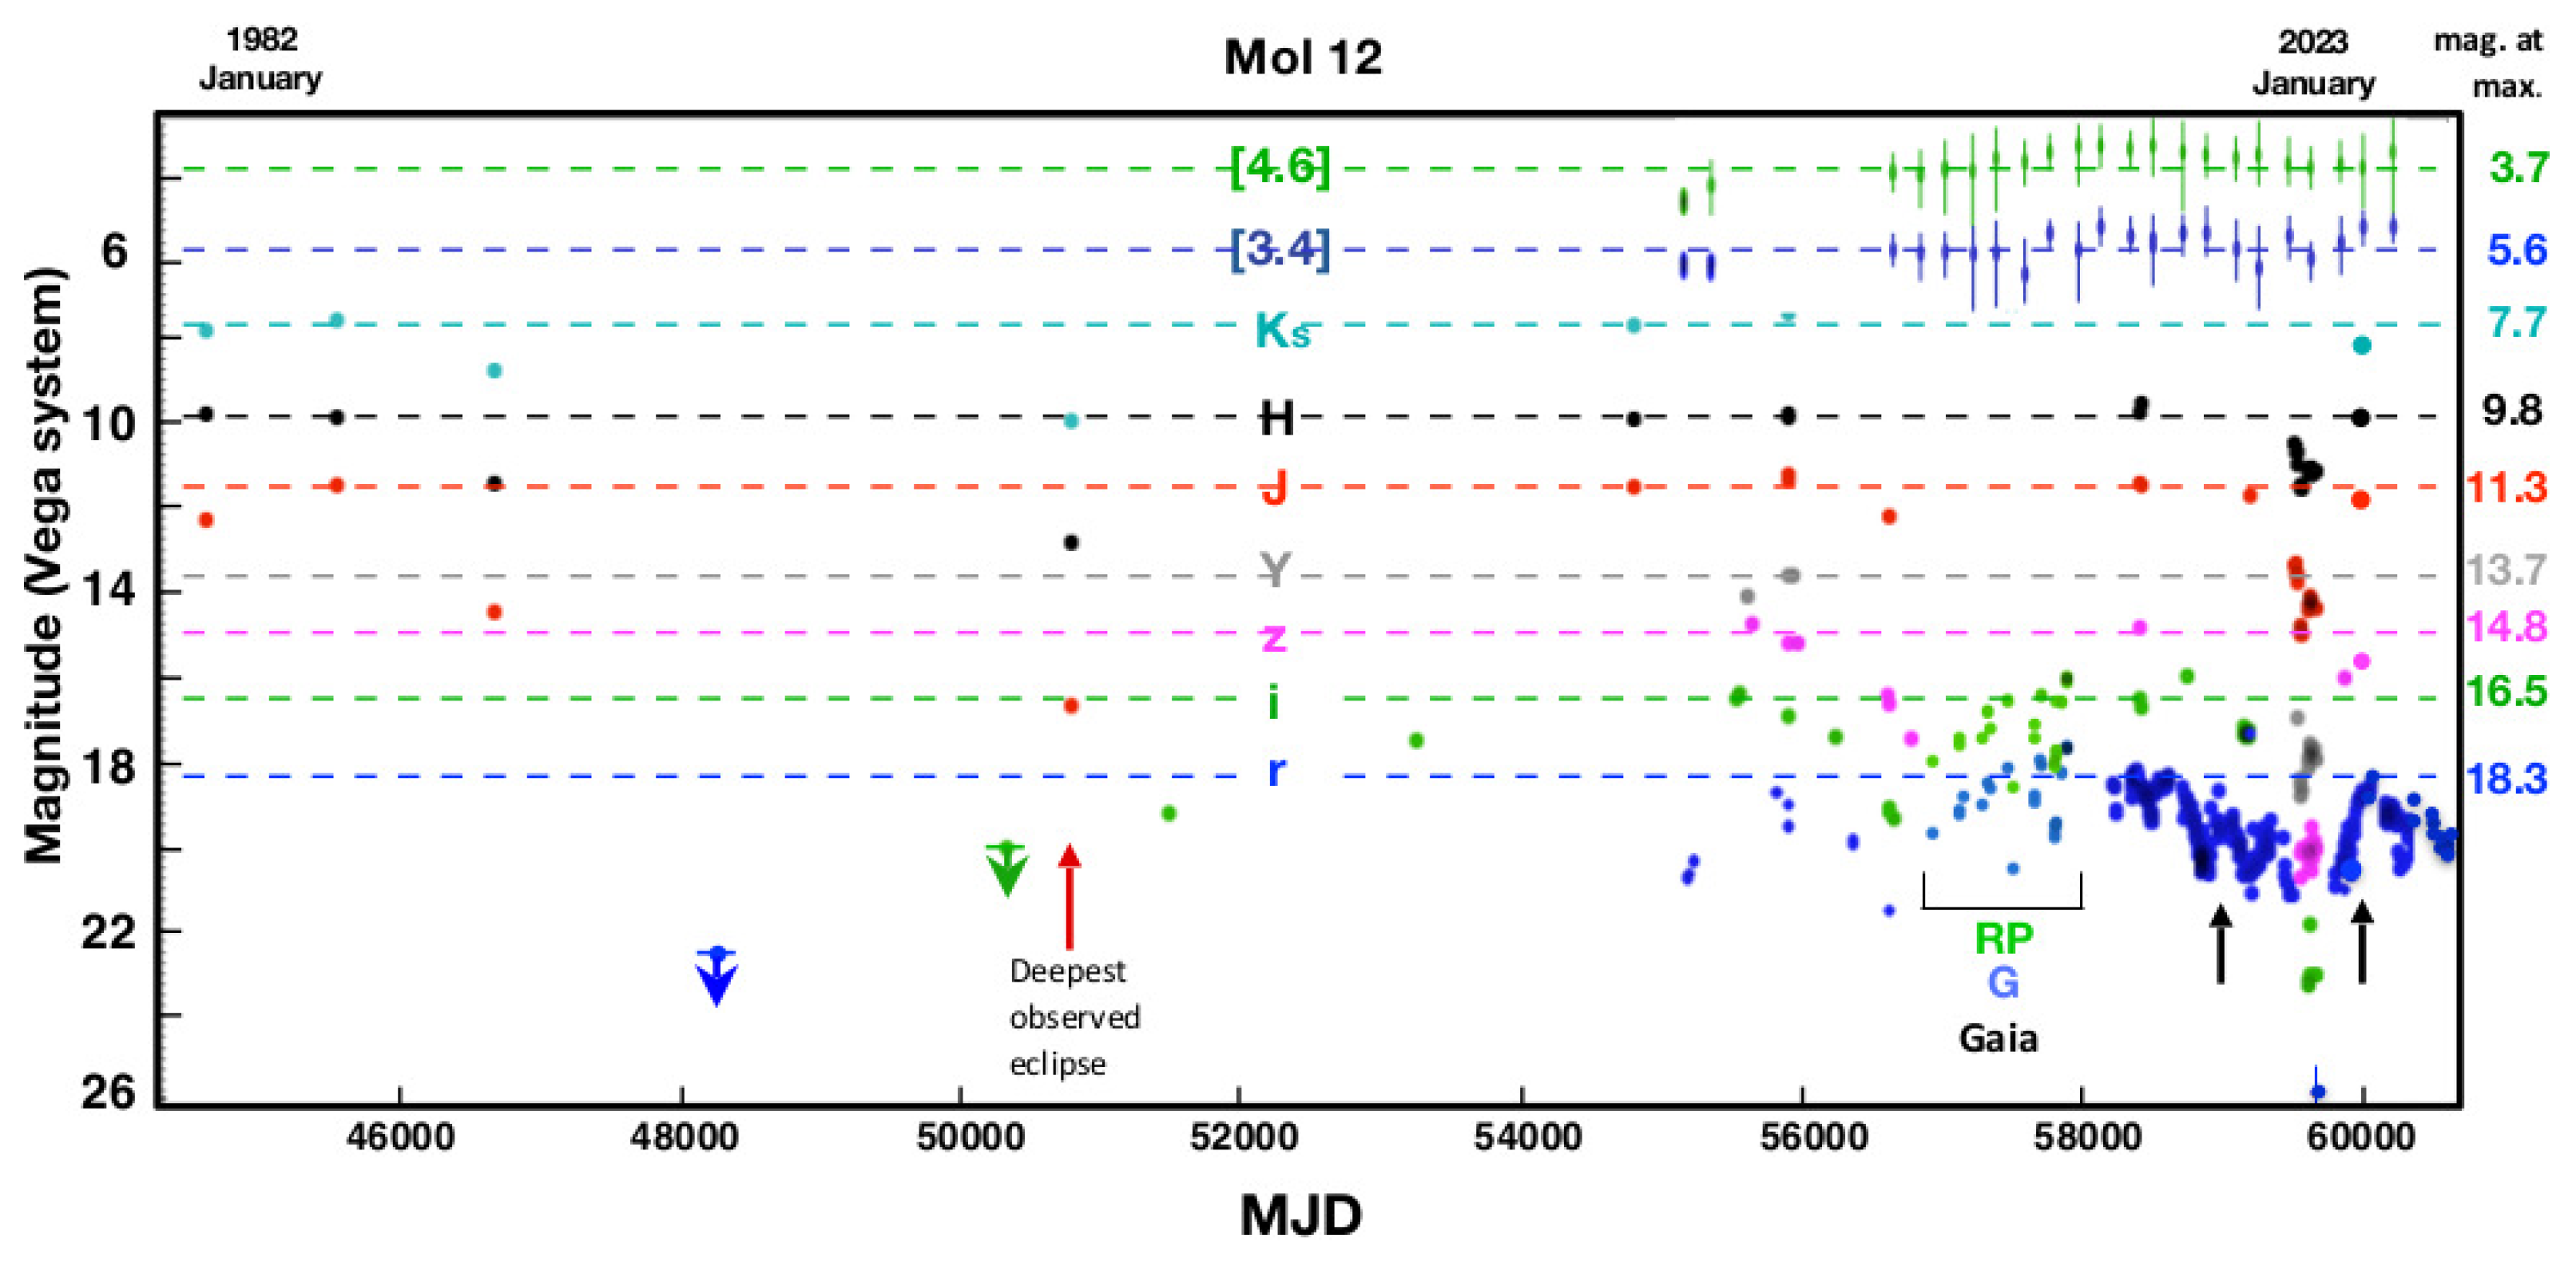
A compilation of these data is presented in Figure 5 in the form of light curves, where all individual measurements taken from 1980 December to 2024 April (MJD 44580 to MJD 60500) in the available photometric bands (each colour represents one filter) are plotted. The dashed lines represent the maximum light (minimum magnitude) reached by Mol 12A in each band. From the analysis of the light curves, especially from the r band ZTF light curve, obtained with a cadence of 2 to 3 days, it became clear that the stellar light suffered a series of irregular eclipse events with timescales of tens to hundreds of days. The deepest one occurred at around MJD 59600 and was a of around 7.5 magnitudes from the maximum light in that band (). Fortunately, this event coincided with a period of deep photometric monitoring of the object using a RATIR camera, which permitted the accurate and simultaneous multi-wavelength study of the obscuring event.
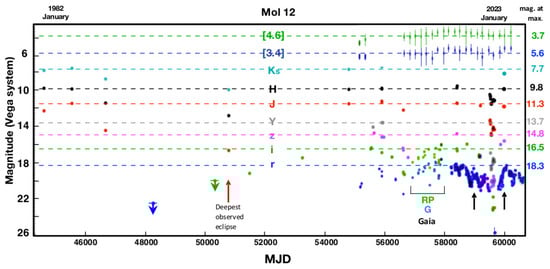
Figure 5.
Multi-wavelength light curves of Mol 12A covering the period from MJD 44580 to MJD 60500 (1980 December to 2024 April) constructed from the available photometric measurements of Mol 12A, as described in the text. These include the photometric bands r, i, z, y, J, H, , WISE [3.4], [4.6], and Gaia G and GRP, each plotted with a different colour as labelled. The arrows indicate the epoch when the spectra were obtained. The Gaia photometric bands (plotted with smaller dots) are marked. The dashed lines mark the out-of-eclipse brightness maxima of Mol 12A for each filter. The figures on the extreme right show the calculated out-of-eclipse (OoE) magnitudes. Adapted from Tapia et al. [8].
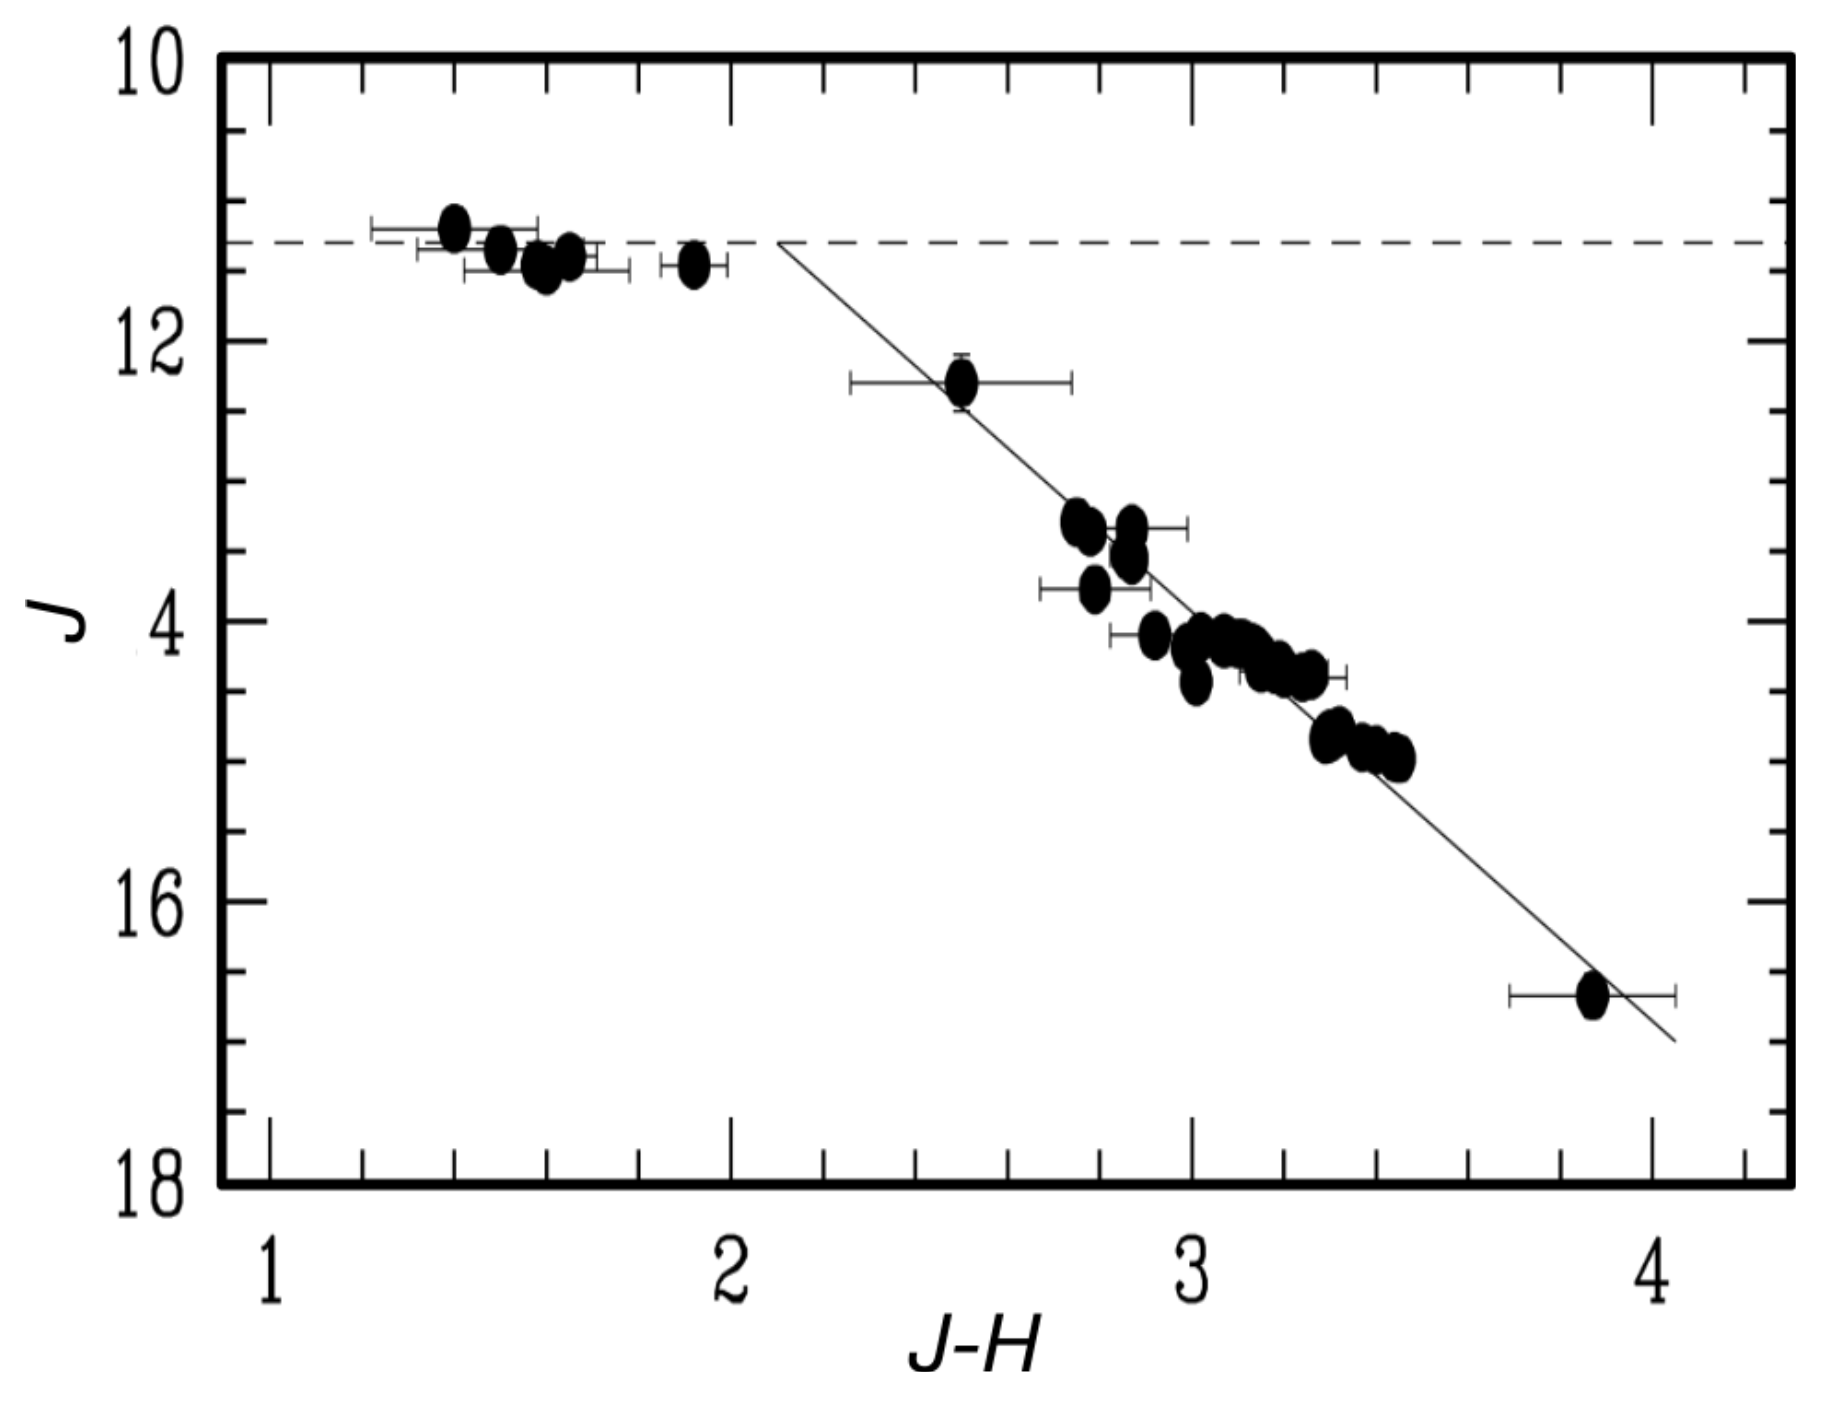
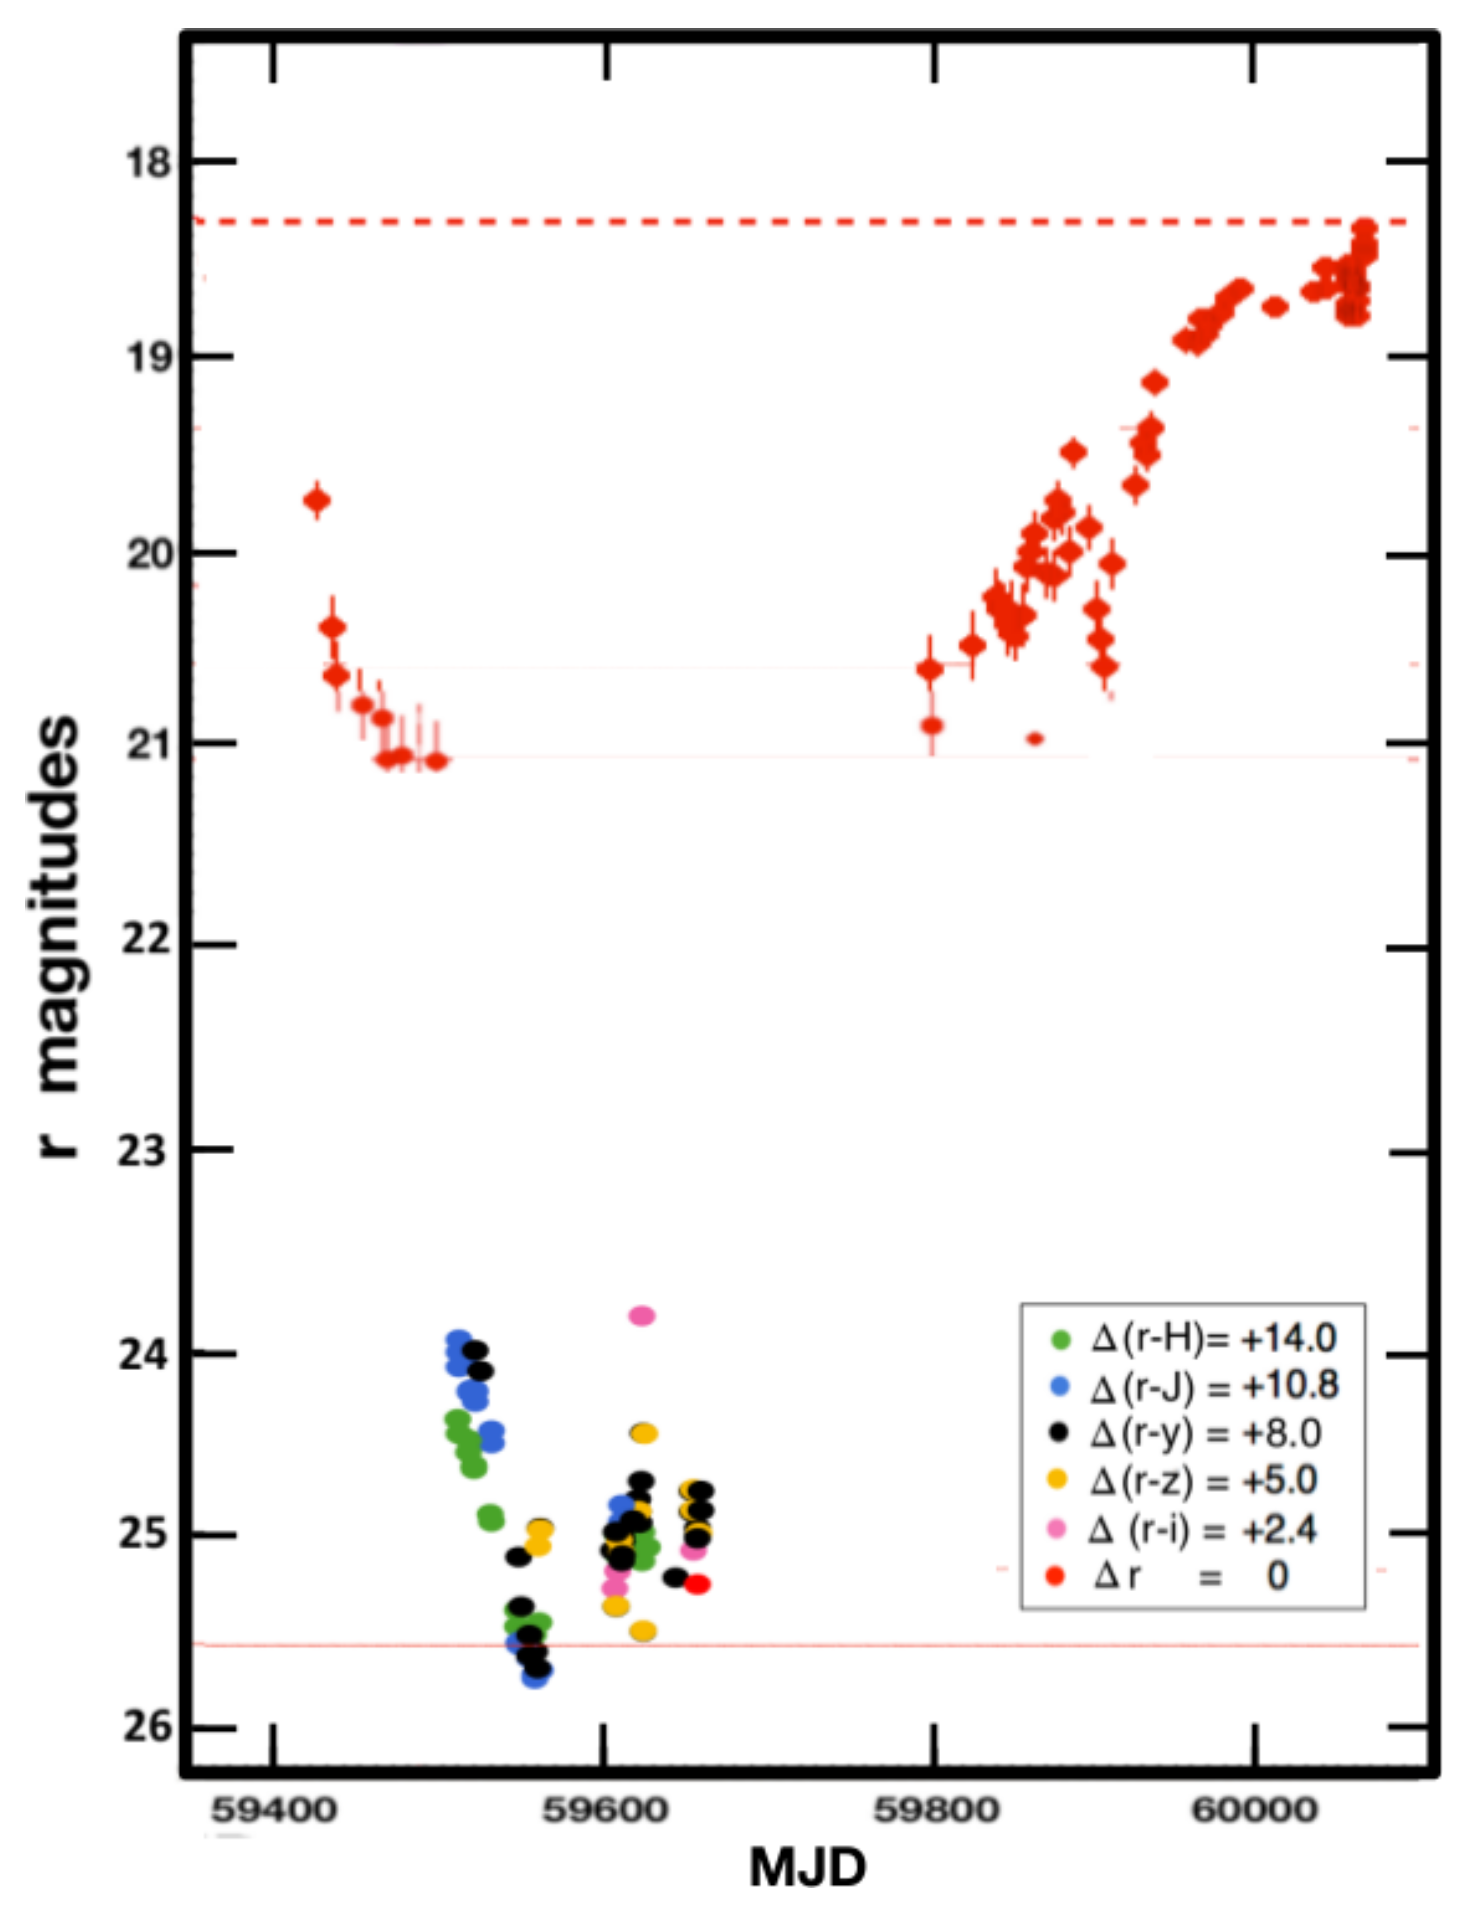
An example of a colour–magnitude diagram (J versus ) illustrating the colour dependence of the observed light variations of Mol 12A is shown in Figure 6. This behaviour is similar to that produced by interstellar dust extinction, a fact that was confirmed by other similar colour–magnitude diagrams. Naturally, we conclude that the observed fading events were caused by the absorption of dust in the form of small orbiting cloudlets, probably condensed material from the dispersing disc, producing the series of eclipses of the central star. Finally, in Figure 7, a reconstruction of the probable profile of the eclipse from MJD 59400 to MJD 60100 is shown, as explained in the caption.

Figure 6.
J versus diagram of Mol 12A at different epochs. The dashed line marks the max J magnitude at the maximum light intensity and the continuous line, with the slope , provides a comparison to the value of 2.1 that characterizes the standard interstellar reddening law.

Figure 7.
A close-up view of the r band light curve of Mol 12A (red points) covering the period from MJD 59420 to MJD 60100, from the ZTF survey. The points drawn in different colours correspond to the RATIR and H shifted magnitudes. Shifting each band consisted of adding an amount of , as shown in the legend, such that the minimum plateau reached during the eclipse was at the same level as the single r measurement. The horizontal broken line indicates the maximum r magnitude, and the thin continuous lines illustrate two characteristic minimum levels. Adapted from Tapia et al. [8].
Future spectral and photometric monitoring of Mol 12A is needed to better understand the evolving nature of this very young Herbig Be star. The full details of this work will be published by Tapia et al. [8], in preparation).
Author Contributions
All the authors worked on the conceptualization and writing of this manuscript. All authors have read and agreed to the published version of the manuscript.
Funding
This research was funded by UNAM-PAPIIT IN-110422, IG-101723, and CONAHCYT CF-86372 grants.
Data Availability Statement
The spectra are available upon request from the corresponding author. The ZTF, NEOWISE, and Pan-STARRS photometry is available from the NASA/IPAC Infrared Science Archive at https://irsa.ipac.caltech.edu, 28 April 2025.
Conflicts of Interest
The authors declare no conflicts of interest.
References
- Persi, P.; Tapia, M. Infrared imaging of high-mass young stellar objects: Evidence of multiple shocks and of a new protostar/star eclipsing system. Mon. Not. R. Astron. Soc. 2019, 485, 784–795. [Google Scholar] [CrossRef]
- Molinari, S.; Brand, J.; Cesaroni, R.; Palla, F.; Palumbo, G.G.C. A search for precursors of ultracompact H II regions in a sample of luminous IRAS sources. II. VLA observations. Astron. Astrophys. 1998, 336, 339–351. [Google Scholar]
- Choi, Y.K.; Hachisuka, K.; Reid, M.J.; Xu, Y.; Brunthaler, A.; Menten, K.M.; Dame, T.M. Trigonometric parallaxes of star forming regions in the Perseus spiral arm. Astrophys. J. 2014, 790, 99. [Google Scholar] [CrossRef]
- Molinari, S.; Brand, J.; Cesaroni, R.; Palla, F. A search for precursors of Ultracompact Hii regions in a sample of luminous IRAS sources. III. Circumstellar dust properties. Astron. Astrophys. 2000, 355, 617. [Google Scholar]
- Brown, G.M.; Johnston, K.G.; Hoare, M.G.; Lumsden, S.L. Connecting low- and high-mass star formation: The intermediate-mass protostar IRAS 05373+2349 VLA 2. Mon. Not. R. Astron. Soc. 2016, 463, 2839–2848. [Google Scholar] [CrossRef]
- Fairlamb, J.R.; Oudmaijer, R.D.; Mendigutía, I.; Ilee, J.D.; van den Ancker, M.E. A spectroscopic survey of Herbig Ae/Be stars with X-Shooter—II. Accretion diagnostic lines. Mon. Not. R. Astron. Soc. 2017, 464, 4721–4735. [Google Scholar] [CrossRef]
- Micolta, M.; Calvet, N.; Thanathibodee, T.; Magris, G.; Colmenares, M.J.; Díaz, J.V.; Alzate-Trujillo, J. The Ca II Lines as Tracers of Disk Structure in T Tauri Stars: The Chamaeleon I Region. Astrophys. J. 2023, 953, 177. [Google Scholar] [CrossRef]
- Tapia, M.; Hernández, J.; Persi, P.; Calvet, N. Mol 12A (IRAS 05373+2349): The most deeply embedded, massive Herbig Be star. 2025; in press. [Google Scholar]
- Butler, N.; Klein, C.; Fox, O.; Lotkin, G.; Bloom, J.; Prochaska, J.X.; Ramirez-Ruiz, E.; De Diego, J.A.; Georgiev, L.; González, J.; et al. First light with RATIR: An automated 6-band optical/NIR imaging camera. In Proceedings of the SPIE, Amsterdam, The Netherlands, 1–6 July 2012; Volume 8446, p. 844610. [Google Scholar]
- Watson, A.W.; Richer, M.G.; Bloom, J.S.; Butler, N.R.; Ceseña, U.; Clark, D.; Colorado, E.; Córdova, A.; Farah, A.; Fox-Machado, L.; et al. Automation of the OAN/SPM 1.5-meter Johnson telescope for operations with RATIR. In Proceedings of the SPIE, Amsterdam, The Netherlands, 1–6 July 2012; Volume 8444, p. 84445L. [Google Scholar]
Disclaimer/Publisher’s Note: The statements, opinions and data contained in all publications are solely those of the individual author(s) and contributor(s) and not of MDPI and/or the editor(s). MDPI and/or the editor(s) disclaim responsibility for any injury to people or property resulting from any ideas, methods, instructions or products referred to in the content. |
© 2025 by the authors. Licensee MDPI, Basel, Switzerland. This article is an open access article distributed under the terms and conditions of the Creative Commons Attribution (CC BY) license (https://creativecommons.org/licenses/by/4.0/).