Article

ALMA Observations of G333.6-0.2: Molecular and Ionized Gas Environment

by
Aruzhan Omar
1,2,
Aidana Abdirakhman
1,*,
Nazgul Alimgazinova
1,2,*,
Meiramgul Kyzgarina
1,2,
Aisha Naurzbayeva
1,2,
Zhomartkali Islyam
1,
Kunduz Turekhanova
1,2,
Aizat Demessinova
1,2 and
Arailym Manapbayeva
2
1
Faculty of Physics and Technology, Al-Farabi Kazakh National University, Al-Farabi Ave., 71, Almaty 050040, Kazakhstan
2
Institute of Experimental and Theoretical Physics, Al-Farabi Kazakh National University, Almaty 050040, Kazakhstan
*
Authors to whom correspondence should be addressed.
Galaxies 2025, 13(4), 73; https://doi.org/10.3390/galaxies13040073
Submission received: 26 March 2025 / Revised: 19 June 2025 / Accepted: 24 June 2025 / Published: 27 June 2025
(This article belongs to the Special Issue Circumstellar Matter in Hot Star Systems)

Abstract

We present high-angular resolution observations, conducted with the Atacama Large Millimeter/Submillimeter Array (ALMA) in Band 6, of high-excitation molecular lines of CH 3 CN , CH3OH, and the H29 α radio recombination line, towards the G333.6-0.2 ultracompact (UC) H ii region. Our observations reveal three hot molecular cores: A, B, and C, where emission is detected in ten components of the J = 14 13 rotational ladder of CH 3 CN and in the CH3OH J = 5 1 , 4 4 1 , 3 transition. Rotational diagram analysis of CH 3 CN reveals excitation temperatures ranging from 380 to 430 K. First-order moment maps of CH 3 CN and CH3OH reveal distinct velocity gradients in all cores, suggesting rotating structures, with core A also showing evidence of expansion motions. The H29 α recombination line shows a linewidth of 30.2 ± 0.12 km s−1, dominated by dynamical and thermal broadening, indicative of large-scale motions in ionized gas. Analysis of the ionized gas properties yields an electron density of ( 4.8 ± 0.4 ) × 10 5 cm−3, an emission measure of ( 1.23 ± 0.06 ) × 10 9 pc cm−6, and a Lyman continuum photon flux consistent with an O5–O6 V (Zero-Age Main Sequence; ZAMS) star. Our results suggest that G333.6-0.2 is in an intermediate evolutionary stage between hypercompact (HC) and ultracompact (UC) H ii regions, hosting active high-mass star formation with rotating hot cores and ionized gas dynamics.

1. Introduction

High-mass star-forming regions (HMSFRs) exhibit rich chemistry that significantly influences the evolution and composition of the interstellar medium (ISM) [1]. Over the years, numerous complex organic molecules (COMs) have been identified in hot molecular cores [2], which are compact, hot, and dense regions associated with luminous infrared (IR) sources or UC H ii regions [3,4].
Various complex physical processes, including accretion, infall, and outflows, occur during the early evolutionary stages of HMSFRs. They begin within dense and massive molecular cores, where high-mass protostellar objects accrete material at rates of 10 5 to 10 3 M yr 1  [1]. These objects complete their Kelvin–Helmholtz (K–H) contraction rapidly and transition to the main sequence [5]. At this stage, the star emits extreme ultraviolet (UV) photons, ionizing its surroundings and creating compact regions of ionized gas. Observationally, these regions are characterized by sizes (r) 0.03 pc, densities (ne) > 10 6 cm−3, and emission measures (EM) exceeding 10 8 pc cm−6 [6].
The object of our study, G333.6-0.2, is a bright H ii region extensively observed at radio and infrared wavelengths [7,8], but completely obscured at optical wavelengths. This region is located at a distance of approximately 3.1–3.6 kpc from the Sun [8,9,10] and is thought to be ionized by a cluster of massive O–B type stars [11].
G333.6-0.2 is classified as an UC H ii region [12], embedded within the giant H ii complex RCW 106 [13]. Its total luminosity is estimated to be less than 9.0 × 10 5 , L  [9], indicating ongoing high-mass star formation. Based on radio continuum analysis, G333.6-0.2 is suggested to harbor the equivalent of 19 O7V-type stars [8]. However, it has also been argued that the ionizing sources may include even earlier spectral types, ranging from O3 to O5 [9].
In this work, we present high-angular resolution interferometric observations (ALMA archival data) toward G333.6-0.2. We report the detection of high-excitation lines of CH 3 CN   and CH3OH, as well as the H29 α radio recombination line, and analyze the kinematics and physical properties of the hot molecular cores associated with this UC H ii region. In Section 2, we describe the observations and data reduction process. Section 3 presents the analysis of the molecular gas environment. In Section 4, we analyze the rotational diagrams to derive physical parameters. Section 5 focuses on radio recombination line (RRL) fitting and the estimation of broadening parameters. In Section 6, we discuss the derived properties of the H ii region. Finally, all results are summarized in Section 7.

2. Observations

We analyze archival ALMA data (Project 2016.1.00577.S) covering the 240.8 to 260.625 GHz frequency range (Band 6) to investigate molecular line emission towards the UC H,ii region G333.6-0.2. Observations were conducted in August 2017 using forty 12 m antennas. The array configuration provided baseline lengths ranging from 108.440 m to 864.182 m, resulting in a synthesized beam size of 0 163 . The observations covered four spectral windows spanning the frequency ranges 240.82–241.288 GHz, 243.72–244.188 GHz, 256.119–256.587 GHz, and 257.156–257.625 GHz. The phase center of the array was set to α J 2000 = 16 h 22 m 09 s δ J 2000 = 50 ° 15 59 . The flux calibrator was Titan, the phase calibrator was J1427-4206 and the bandpass calibrator was J1603-4904. The data cube has a spectral resolution of 488 kHz and a synthesized beam of 0″23×0″.14 with a position angle (PA) of ∼ 41.9 ° . The systemic velocity of the source is known to be ∼ 47  km s−1. Image analysis was performed using the CASA 4.7.2 software package [14]. Spectral line identification and processing analysis presented in this article were performed using the software packages CASA, CARTA, and MADCUBA, while final visualization was performed using AstroPy [15].

3. Molecular Gas Environment

The molecular gas environment surrounding the G333.6-0.2 UC H ii region has been analyzed using high-resolution ALMA observations. We present the results obtained for typical hot core tracers, such as CH 3 CN  , CH 3 13 CN, and CH3OH.
Based on the analysis of moment maps and spectral profiles, we identified three cores around the G333.6-0.2 H ii region. Cores A and C are identified as hot core candidates based on the detection of CH3OCHO lines at 216.1 GHz [16]. From the G333.6-0.2 H ii region, core A is located at a distance of 0.29 pc, core B at 0.25 pc, and core C at 0.33 pc, assuming a distance of 4.2 kpc [17,18].
Figure 1 presents the moment 0 map of CH 3 CN   emission shown in color scale, with the moment 0 contours of the H29 α recombination line overlaid in gray. Three distinct molecular cores are identified in the CH 3 CN   emission map and are labeled as A-core, B-core, and C-core. Three distinct molecular cores are identified in the CH3CN emission map and are labeled as A-core, B-core, and C-core. We estimate the size of the emission regions by fitting a two-dimensional Gaussian. We also estimate the deconvolved source sizes using the following formula:
Source Size = FWHM maj × FWHM min θ beam 2 ,
where FWHM maj and FWHM min are the major and minor FWHM size obtained from the two-dimensional Gaussian fit, and θ beam is the geometric mean of the beam’s major and minor axes, calculated as
θ beam = b maj × b min .
The sizes and coordinates of the cores, along with the peak velocities of the molecular lines, are listed in Table 1. These molecular cores are spatially separated and exhibit different peak intensities, with A-core being the brightest. A zoomed-in view and further characterization of each core are provided in the corresponding moment maps.
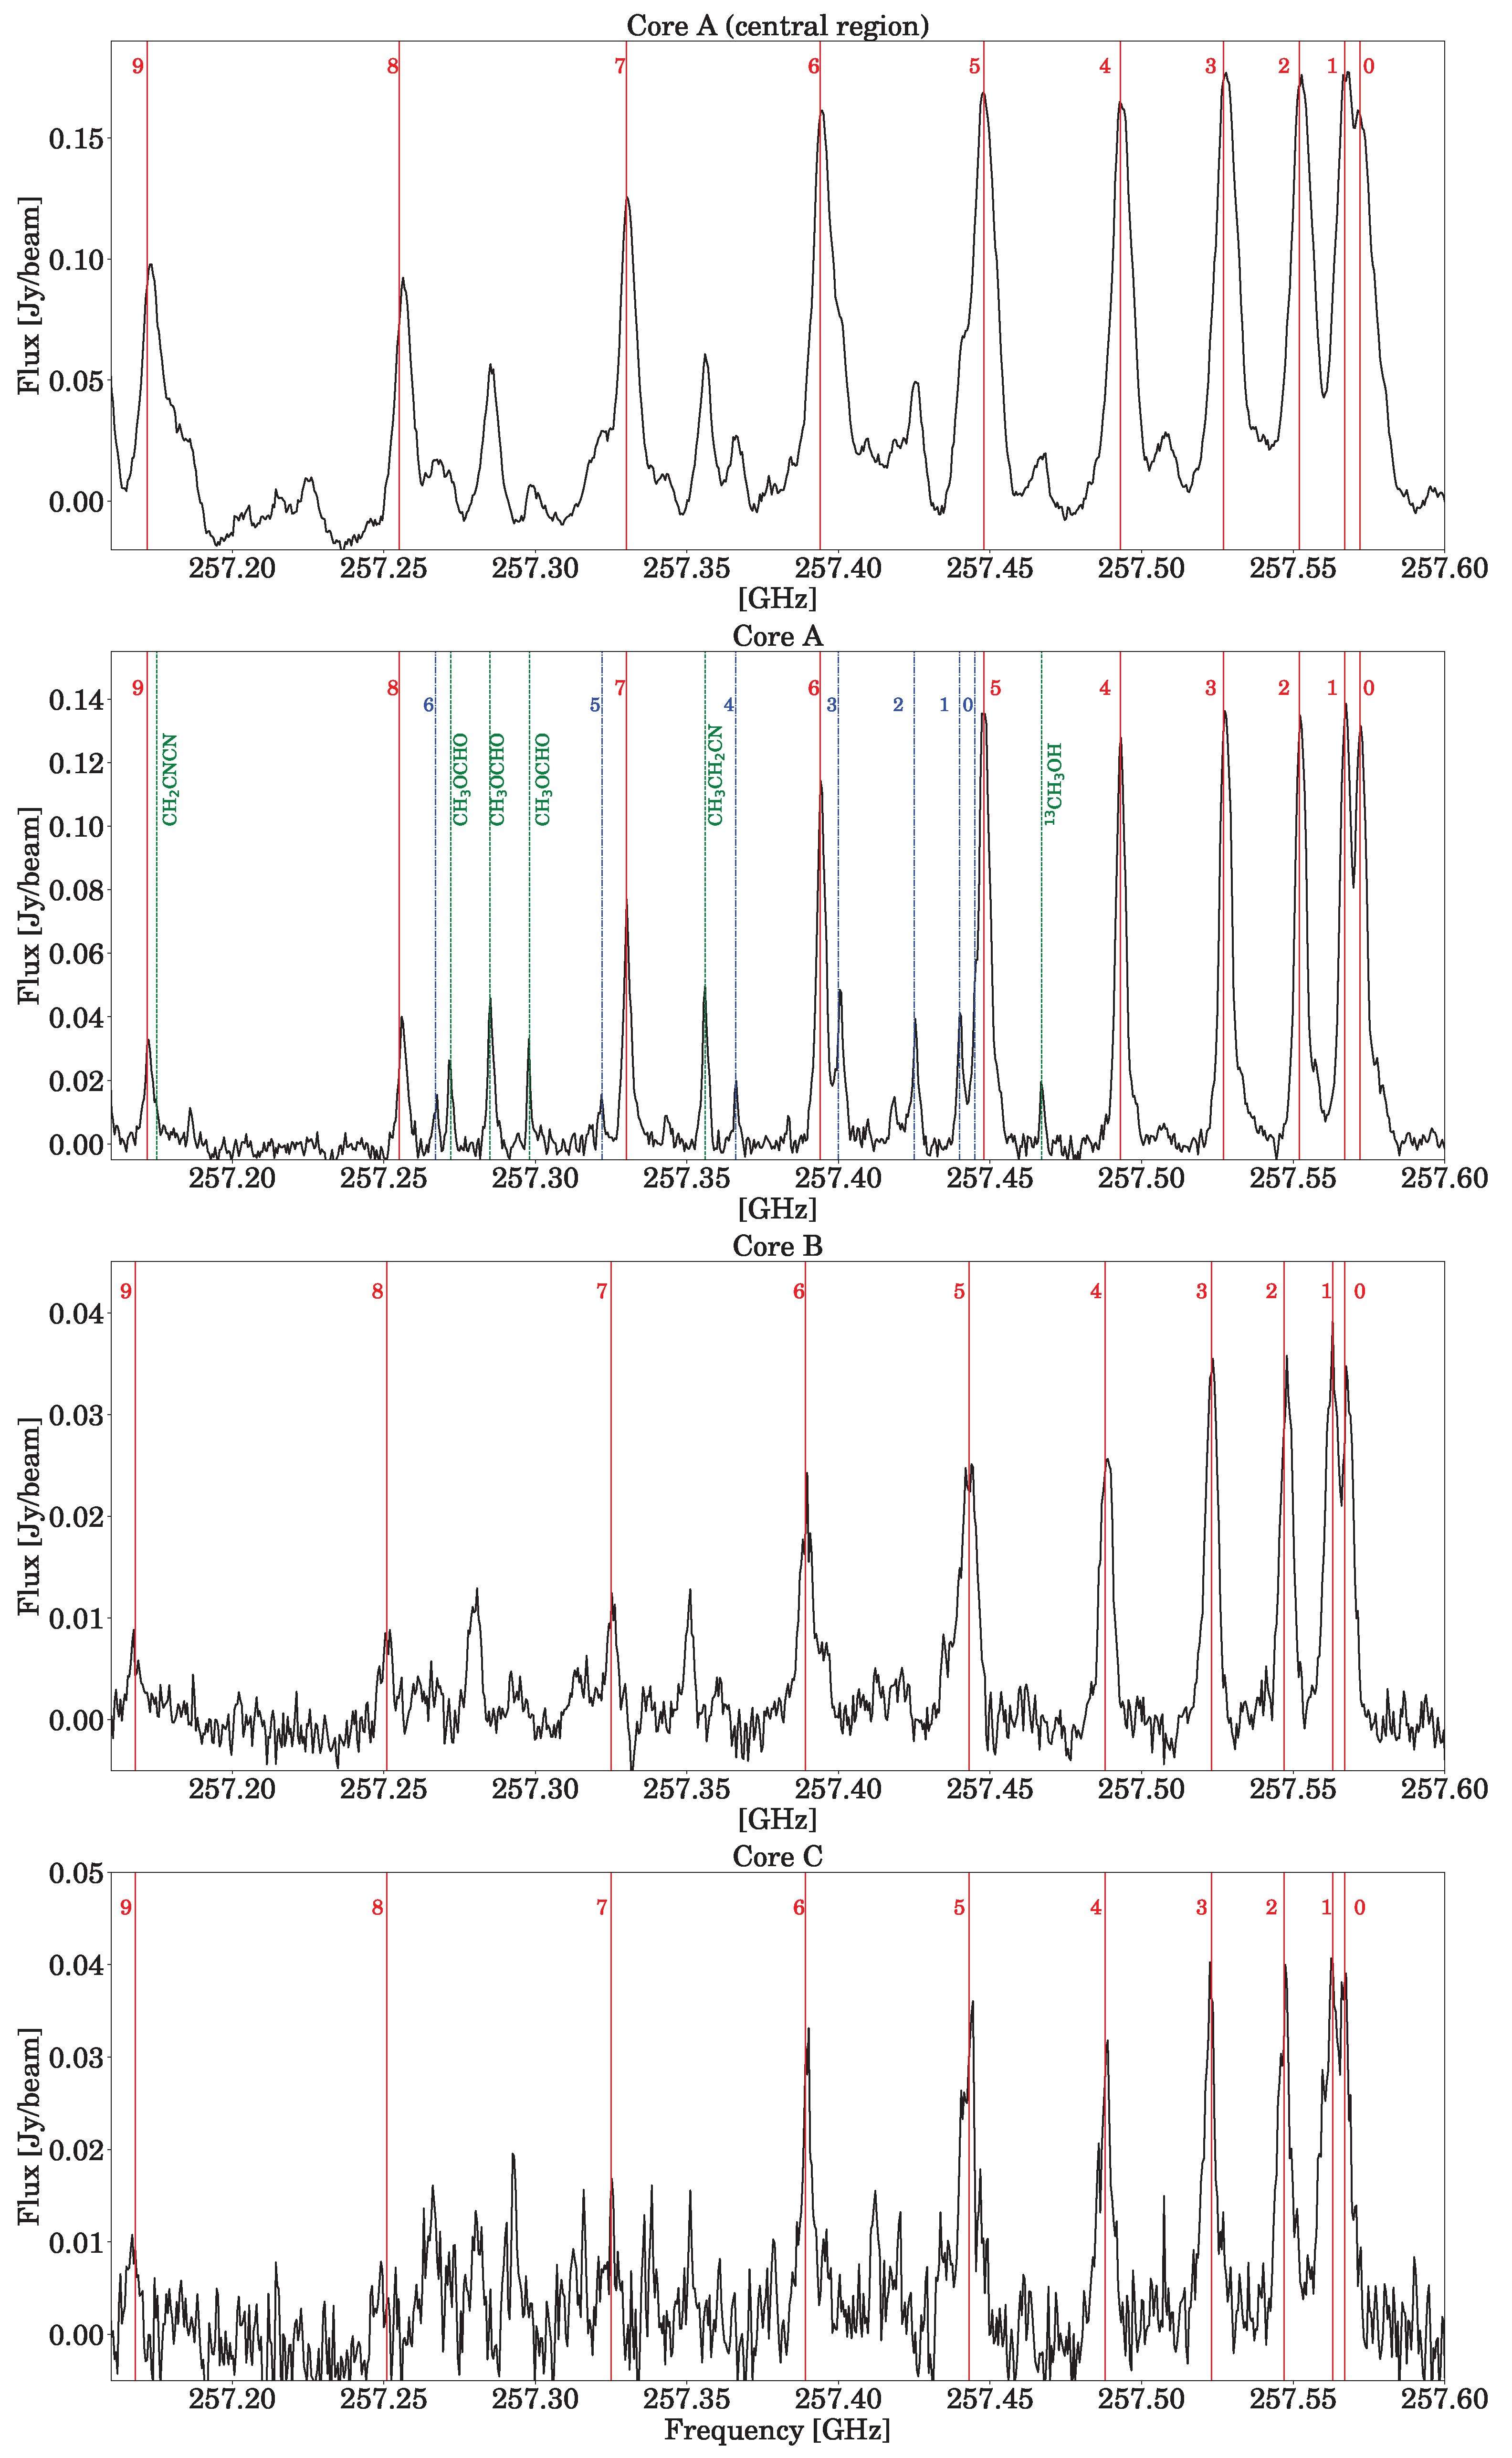
Figure 2 shows the emission spectrum of the J = 14 13 rotational transition of CH3CN, integrated over a region corresponding to a beam diameter. Other molecular lines are also present.
We detected the emission of CH3CN in three cores, identified as A, B, and C. The ten components ( K = 0 , 1 , , 9 ) of the J = 14 13 ladder of CH3CN are detected in these cores. For core A, the spectra were extracted from a region located northeast of the center (indicated by a blue plus sign), while the central region exhibits saturation and significant line blending (see Figure 3).
In addition, seven components ( K = 0 to K = 6 ) of the J = 14 13 transition of the CH 3 13 CN molecule were identified (indicated by blue dash-dot lines). Other molecular species identified within this spectral window are marked in green and Table 2 lists the identified transitions, line frequencies, and upper-state energy levels for the three cores.
Figure 3 shows the moment maps of the CH 3 CN   J = 14 13 , K = 2 transition for cores A (left panels), B (middle panels), and C (right panels). For core A, the zero-order moment map shows a brightness increasing from the edge toward the center, reaching approximately 1.2 Jy beam −1 km s−1. The first-order moment map shows that the molecular gas exhibits two distinct velocity gradients: one from southwest (SW) to northeast (NE), suggesting gas expansion, and another from southeast (SE) to northwest (NW), indicative of rotational motion [19,20]. The second-order moment map (bottom panel) displays a velocity dispersion reaching up to ∼25 km2 s−2, which may be related to line saturation. For core B, the brightness in the zero-order moment map is ∼0.4 Jy beam −1 km s−1. The first-order moment map shows a velocity gradient oriented from southeast to northwest. For core C, the zero-order moment map displays a brightness of ∼0.25 Jy beam −1 km s−1 and the first-order moment map reveals a velocity gradient directed from west to east. The average velocity for both cores is approximately −46 km s−1. The second order moment map indicates a velocity dispersion of about 5 km2 s−2 for both cores.The velocity gradients observed in the first-order moment maps suggest the presence of ordered rotational kinematics.
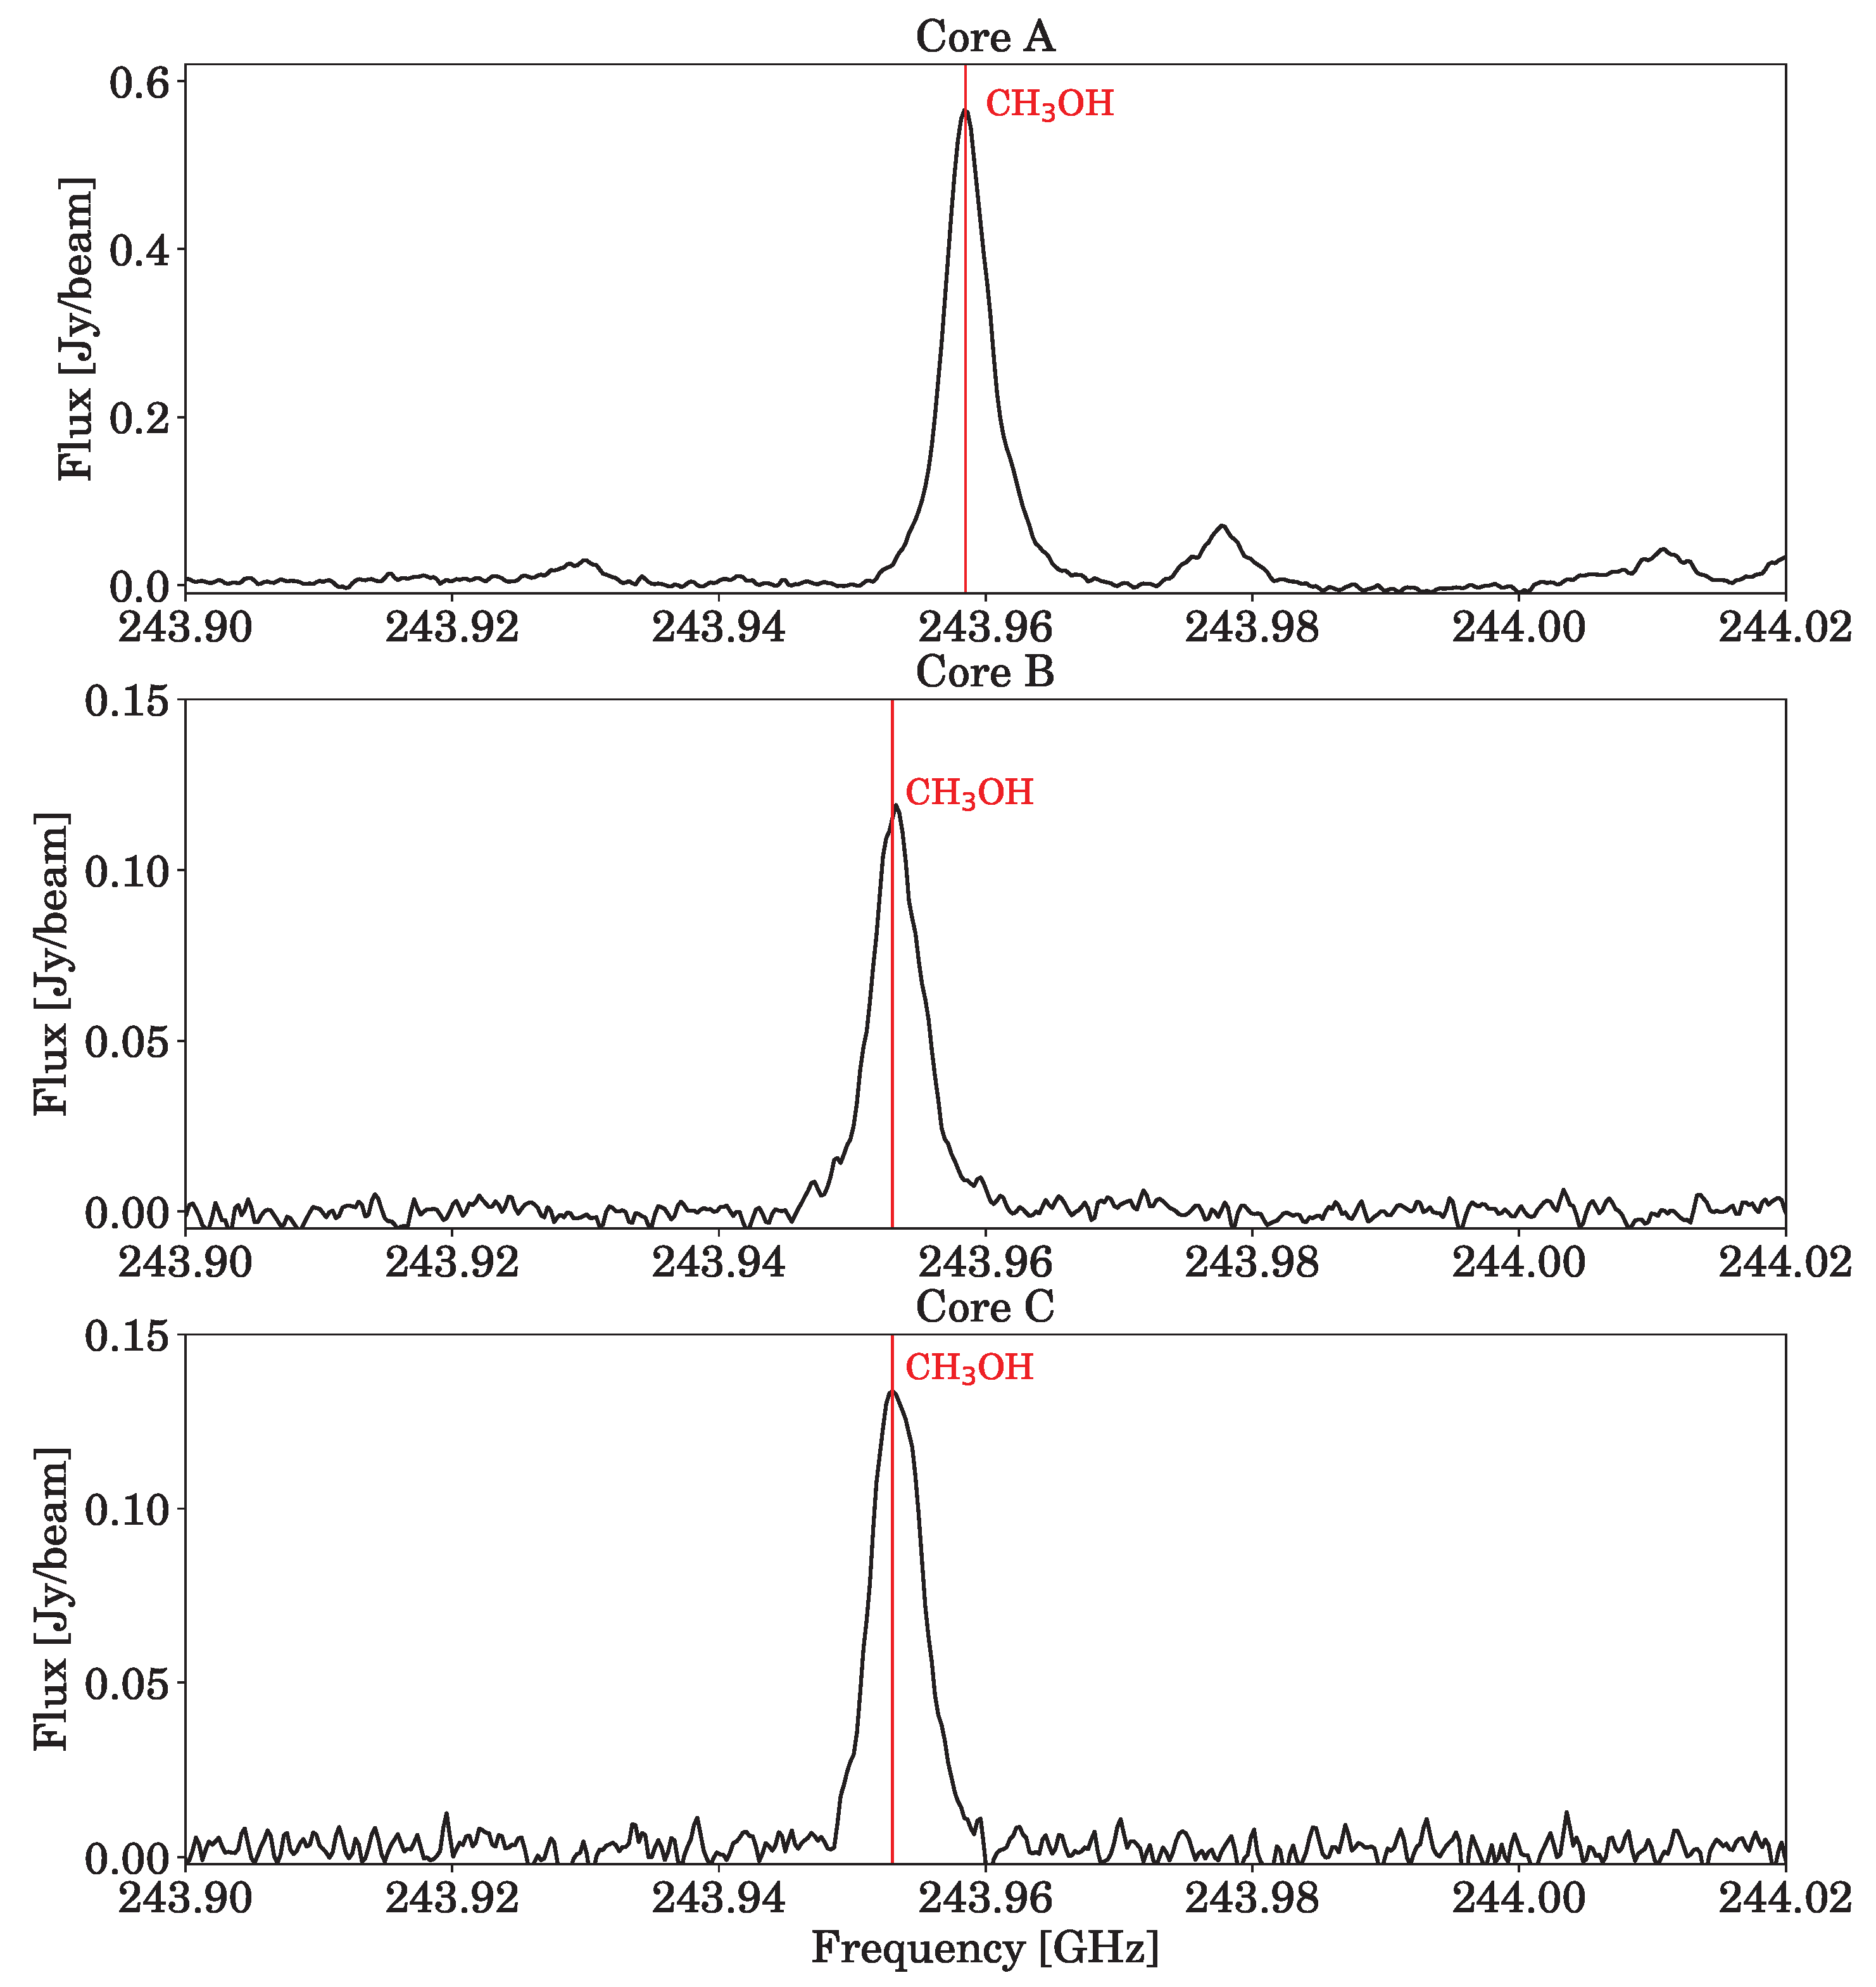
The spectral emission of the CH3OH molecule for cores A, B, and C is shown in Figure 4. The molecular line corresponds to a frequency of 243.916 GHz with a transition J = 5 1 , 4 4 1 , 3 . To compare the results obtained for molecular gas, we analyzed the moment maps (see Figure 5) of CH3OH emission for the A, B, and C cores.
Figure 5 shows the moment maps (Moment 0, 1, and 2) of CH3OH emission toward cores A, B, and C. For core A, the zero-order moment map (top panel) shows a centrally peaked brightness distribution, reaching up to ∼0.25  Jy beam 1 km s 1 . The first-order moment map (middle panel) reveals a velocity gradient oriented from southeast (SE) to northwest (NW), indicative of ordered gas motions. The second-order moment map (bottom panel) displays a velocity dispersion up to ∼3.0 km2 s−2.
For core B, the CH3OH zero-order moment map (top panel) shows lower brightness compared to core A, with an integrated intensity of ∼0.15  Jy beam 1 km s 1 . The velocity gradient seen in the first-order moment map (middle panel) is directed from south to north. The second-order moment map (bottom panel) indicates a velocity dispersion of up to ∼2.0 km2 s−2.
For core C, the zero-order moment map (top panel) exhibits a peak intensity of ∼0.10  Jy beam 1 km s 1 . The first-order moment map (middle panel) shows a velocity gradient extending from southwest to northeast. The velocity dispersion shown in the second-order moment map (bottom panel) reaches ∼1.5 km2 s−2.
These velocity gradients observed in the first-order moment maps suggest the presence of organized gas motions within the molecular cores.
In Figure 6, the position–velocity (PV) diagrams for the three core structures are presented. PV cuts were extracted along the axes of the local velocity gradients, as identified from the moment 1 (intensity-weighted velocity) maps (see Figure 3). The PV axes are overlaid on the moment 1 images for reference. The velocity gradient in core A is oriented from northeast to southwest (position angle 30°); in core B, from southeast to northwest (PA −45°); and in core C, from northeast to southwest (PA 78°).
The position–velocity (PV) diagram of core A reveals an asymmetric velocity structure. The redshifted side shows a butterfly-like pattern indicative of Keplerian-like rotation, whereas the blueshifted side is less prominent.
In contrast, the PV diagrams of cores B and C exhibit more symmetric velocity gradients on both sides of the central position. These features are consistent with rotational motion within the molecular cores, though without clear signatures of Keplerian dynamics. The observed kinematics suggest that cores B and C are rotating structures, potentially in earlier or less compact evolutionary stages than core A.

4. Rotation Diagram Analysis: Estimation of Gas Temperature

We employed rotation diagram analysis to derive the rotational temperatures. We performed the derivation of the rotational temperature and total column density of CH3CN using the Madrid Data Cube Analysis (MADCUBA) software, assuming local thermodynamic equilibrium (LTE) [21].
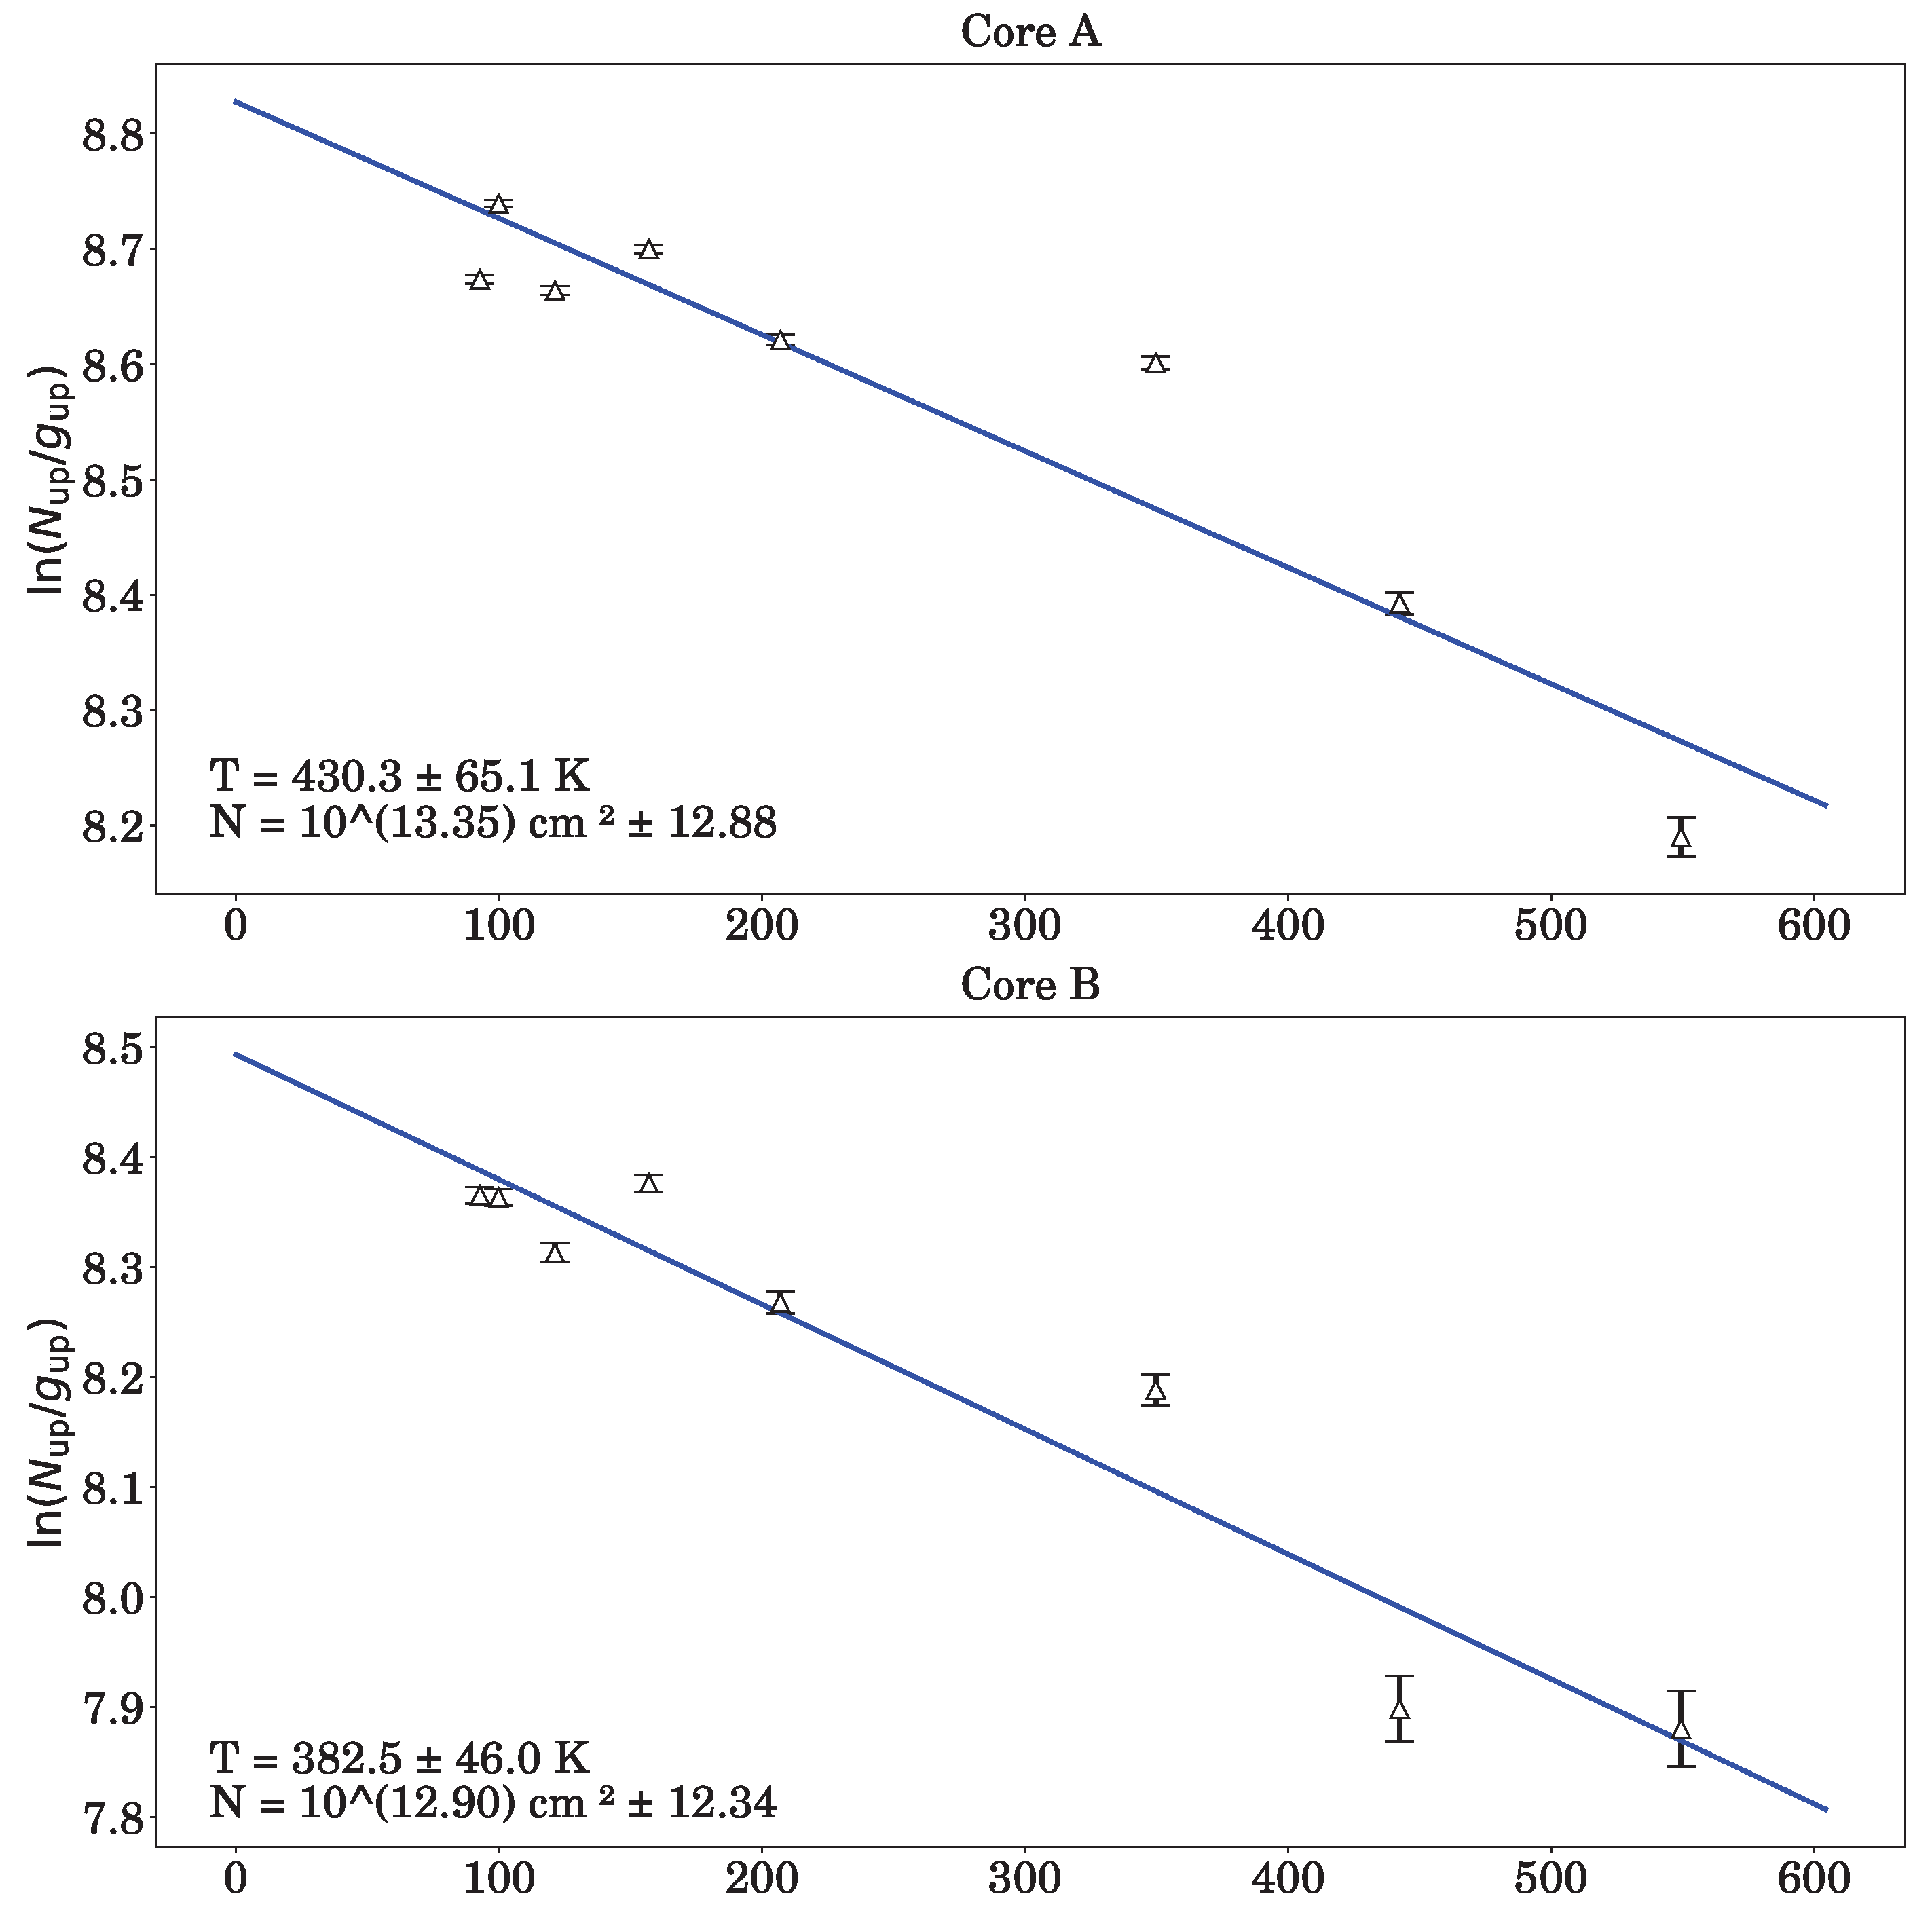
Figure 7 shows the rotational diagrams of the cores A and B. The derived rotational temperatures for cores A and B are 430 ± 65 K and 383 ± 46 K, respectively, with corresponding column densities of 2.24 × 10 12 cm−2 and 7.94 × 10 12 cm−2.
The data points corresponding to energy levels of 271 K (K = 5) and 670 K (K = 9) were excluded from the fit. This is because the K = 5 component of methyl cyanide overlaps with the K = 0 transition of CH 3 13 CN, while the K = 9 transition at 670 K is blended with a line from CH2CHCN.
In addition, the rotational temperature and column density were also derived for core A using the CH 3 13 CN isotopologue. These values were obtained based on seven detected components ( K = 0 to K = 6 ) of the J = 14 13 transition. The resulting temperature is 140 ± 14 K, and the corresponding column density is 3.44 × 10 11 cm−2.

5. Radio Recombination Lines: H29 α and He29 α

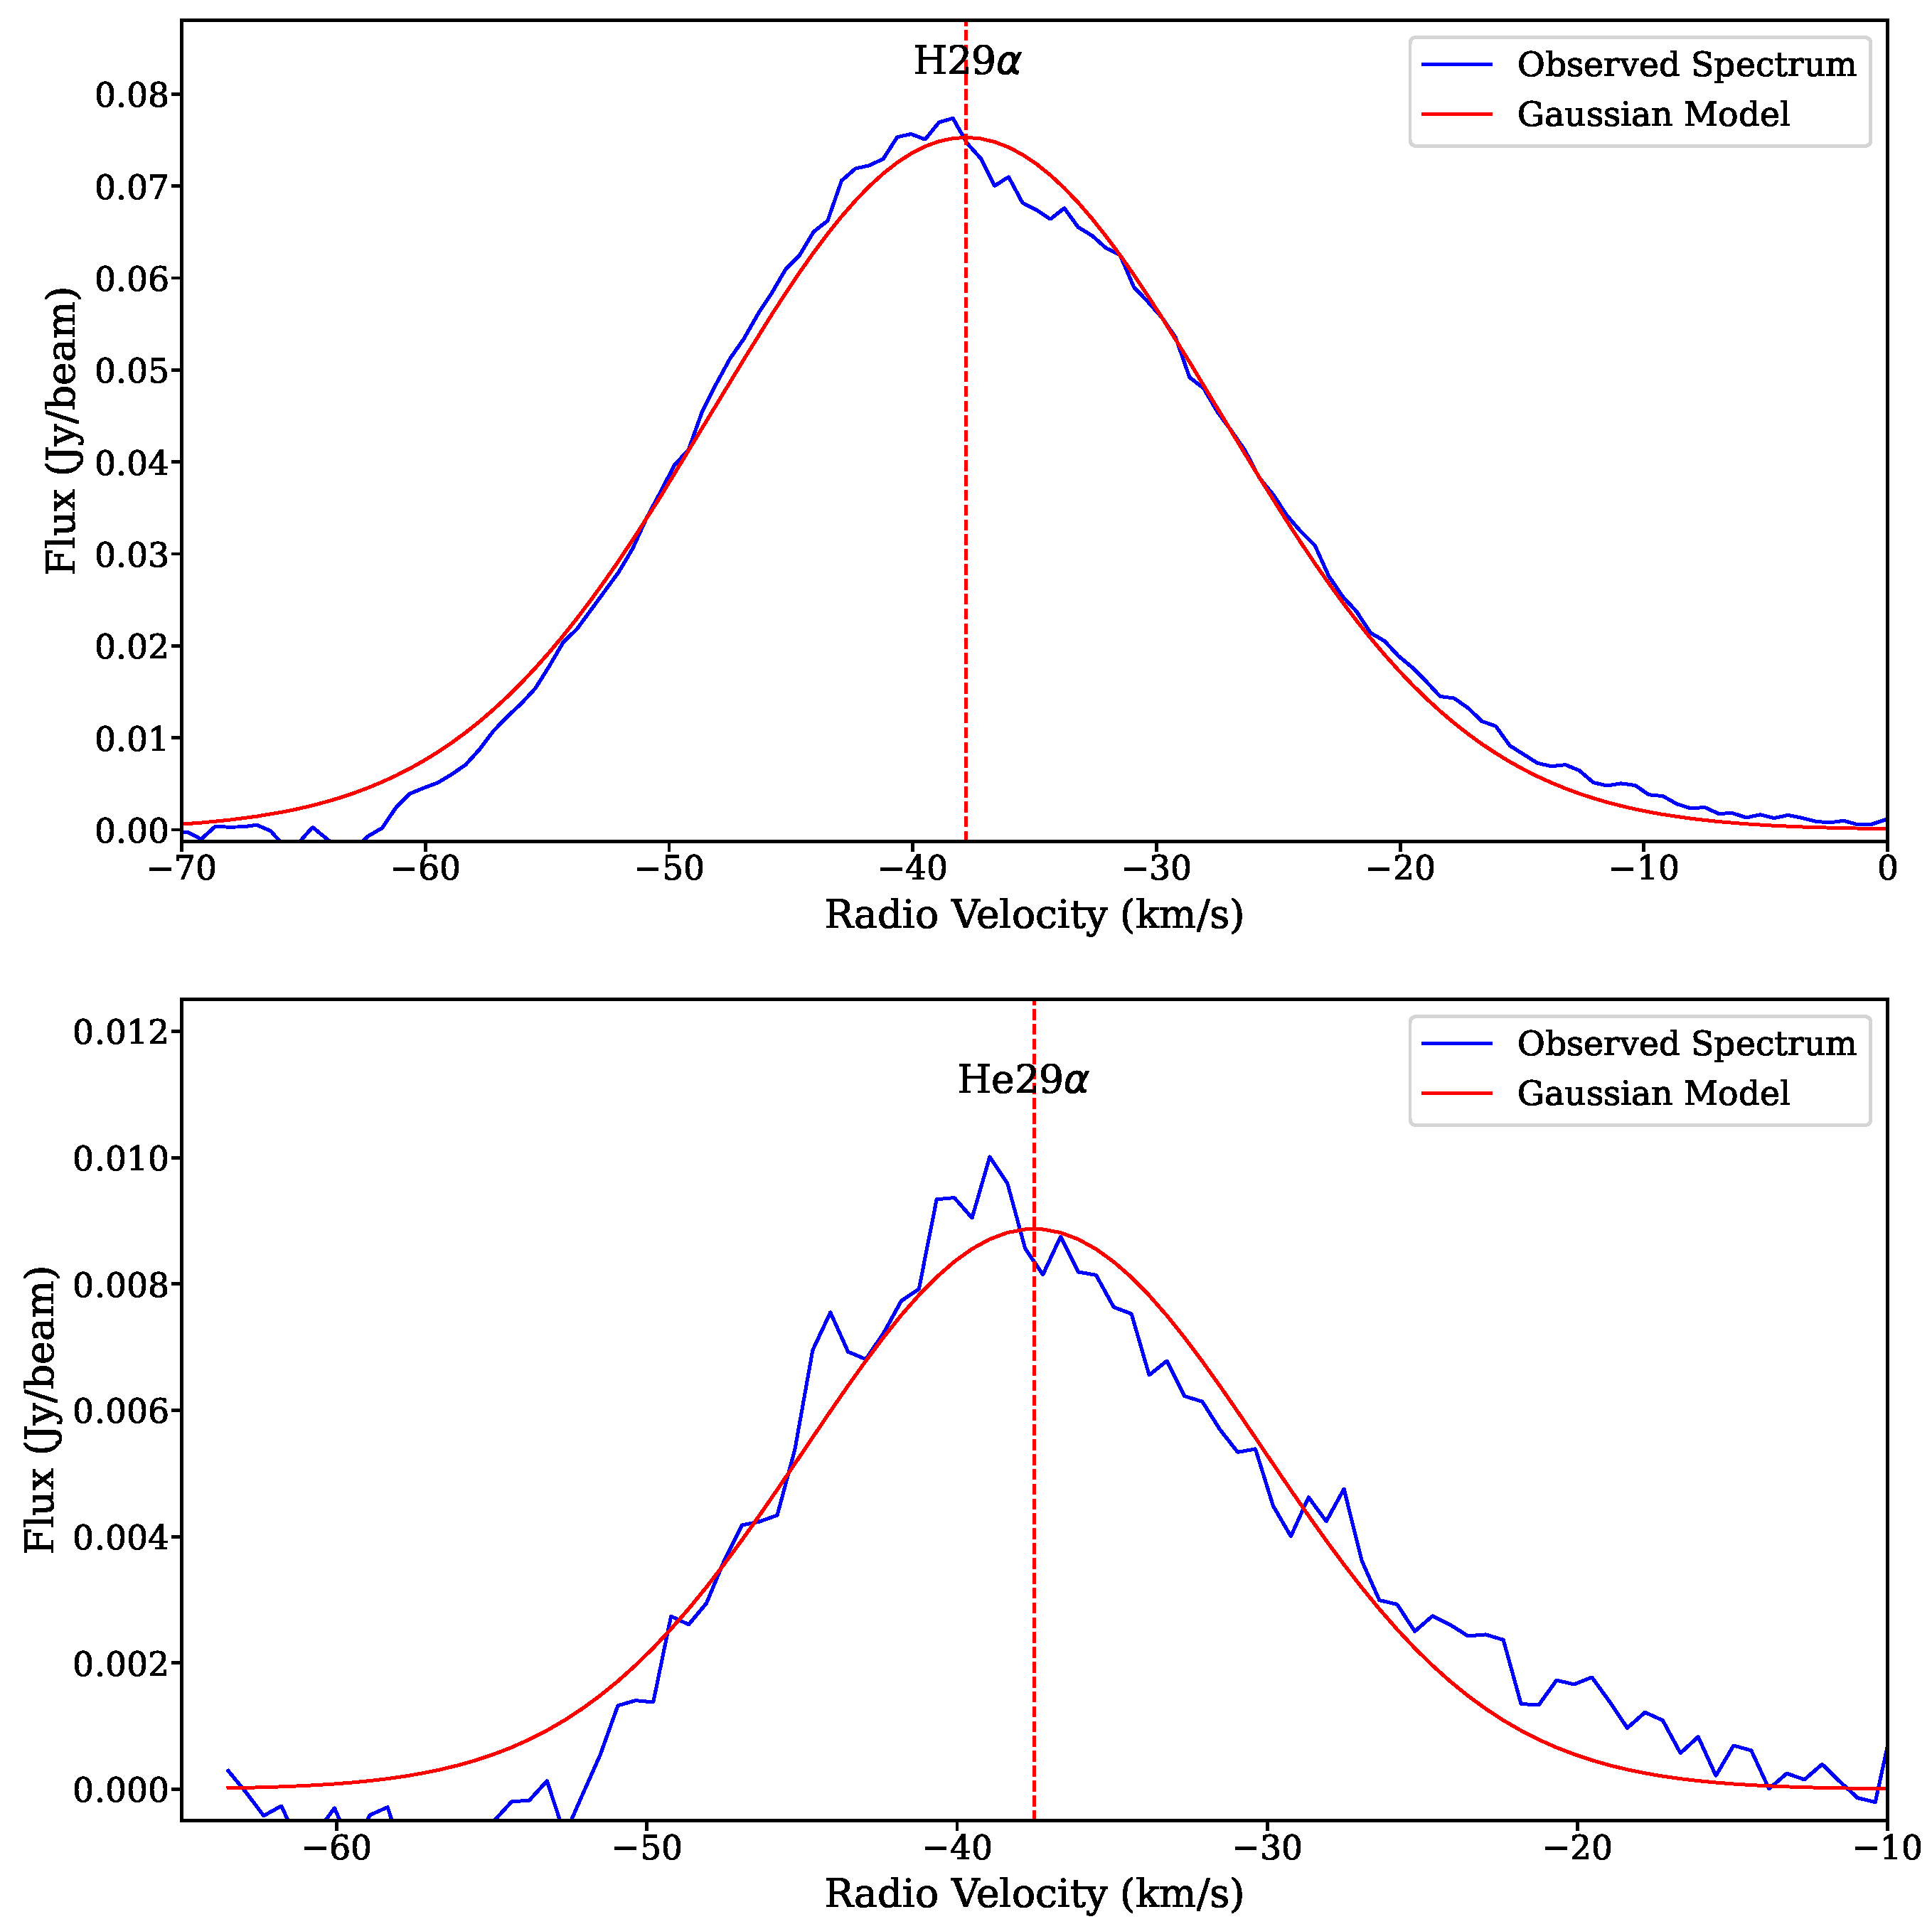
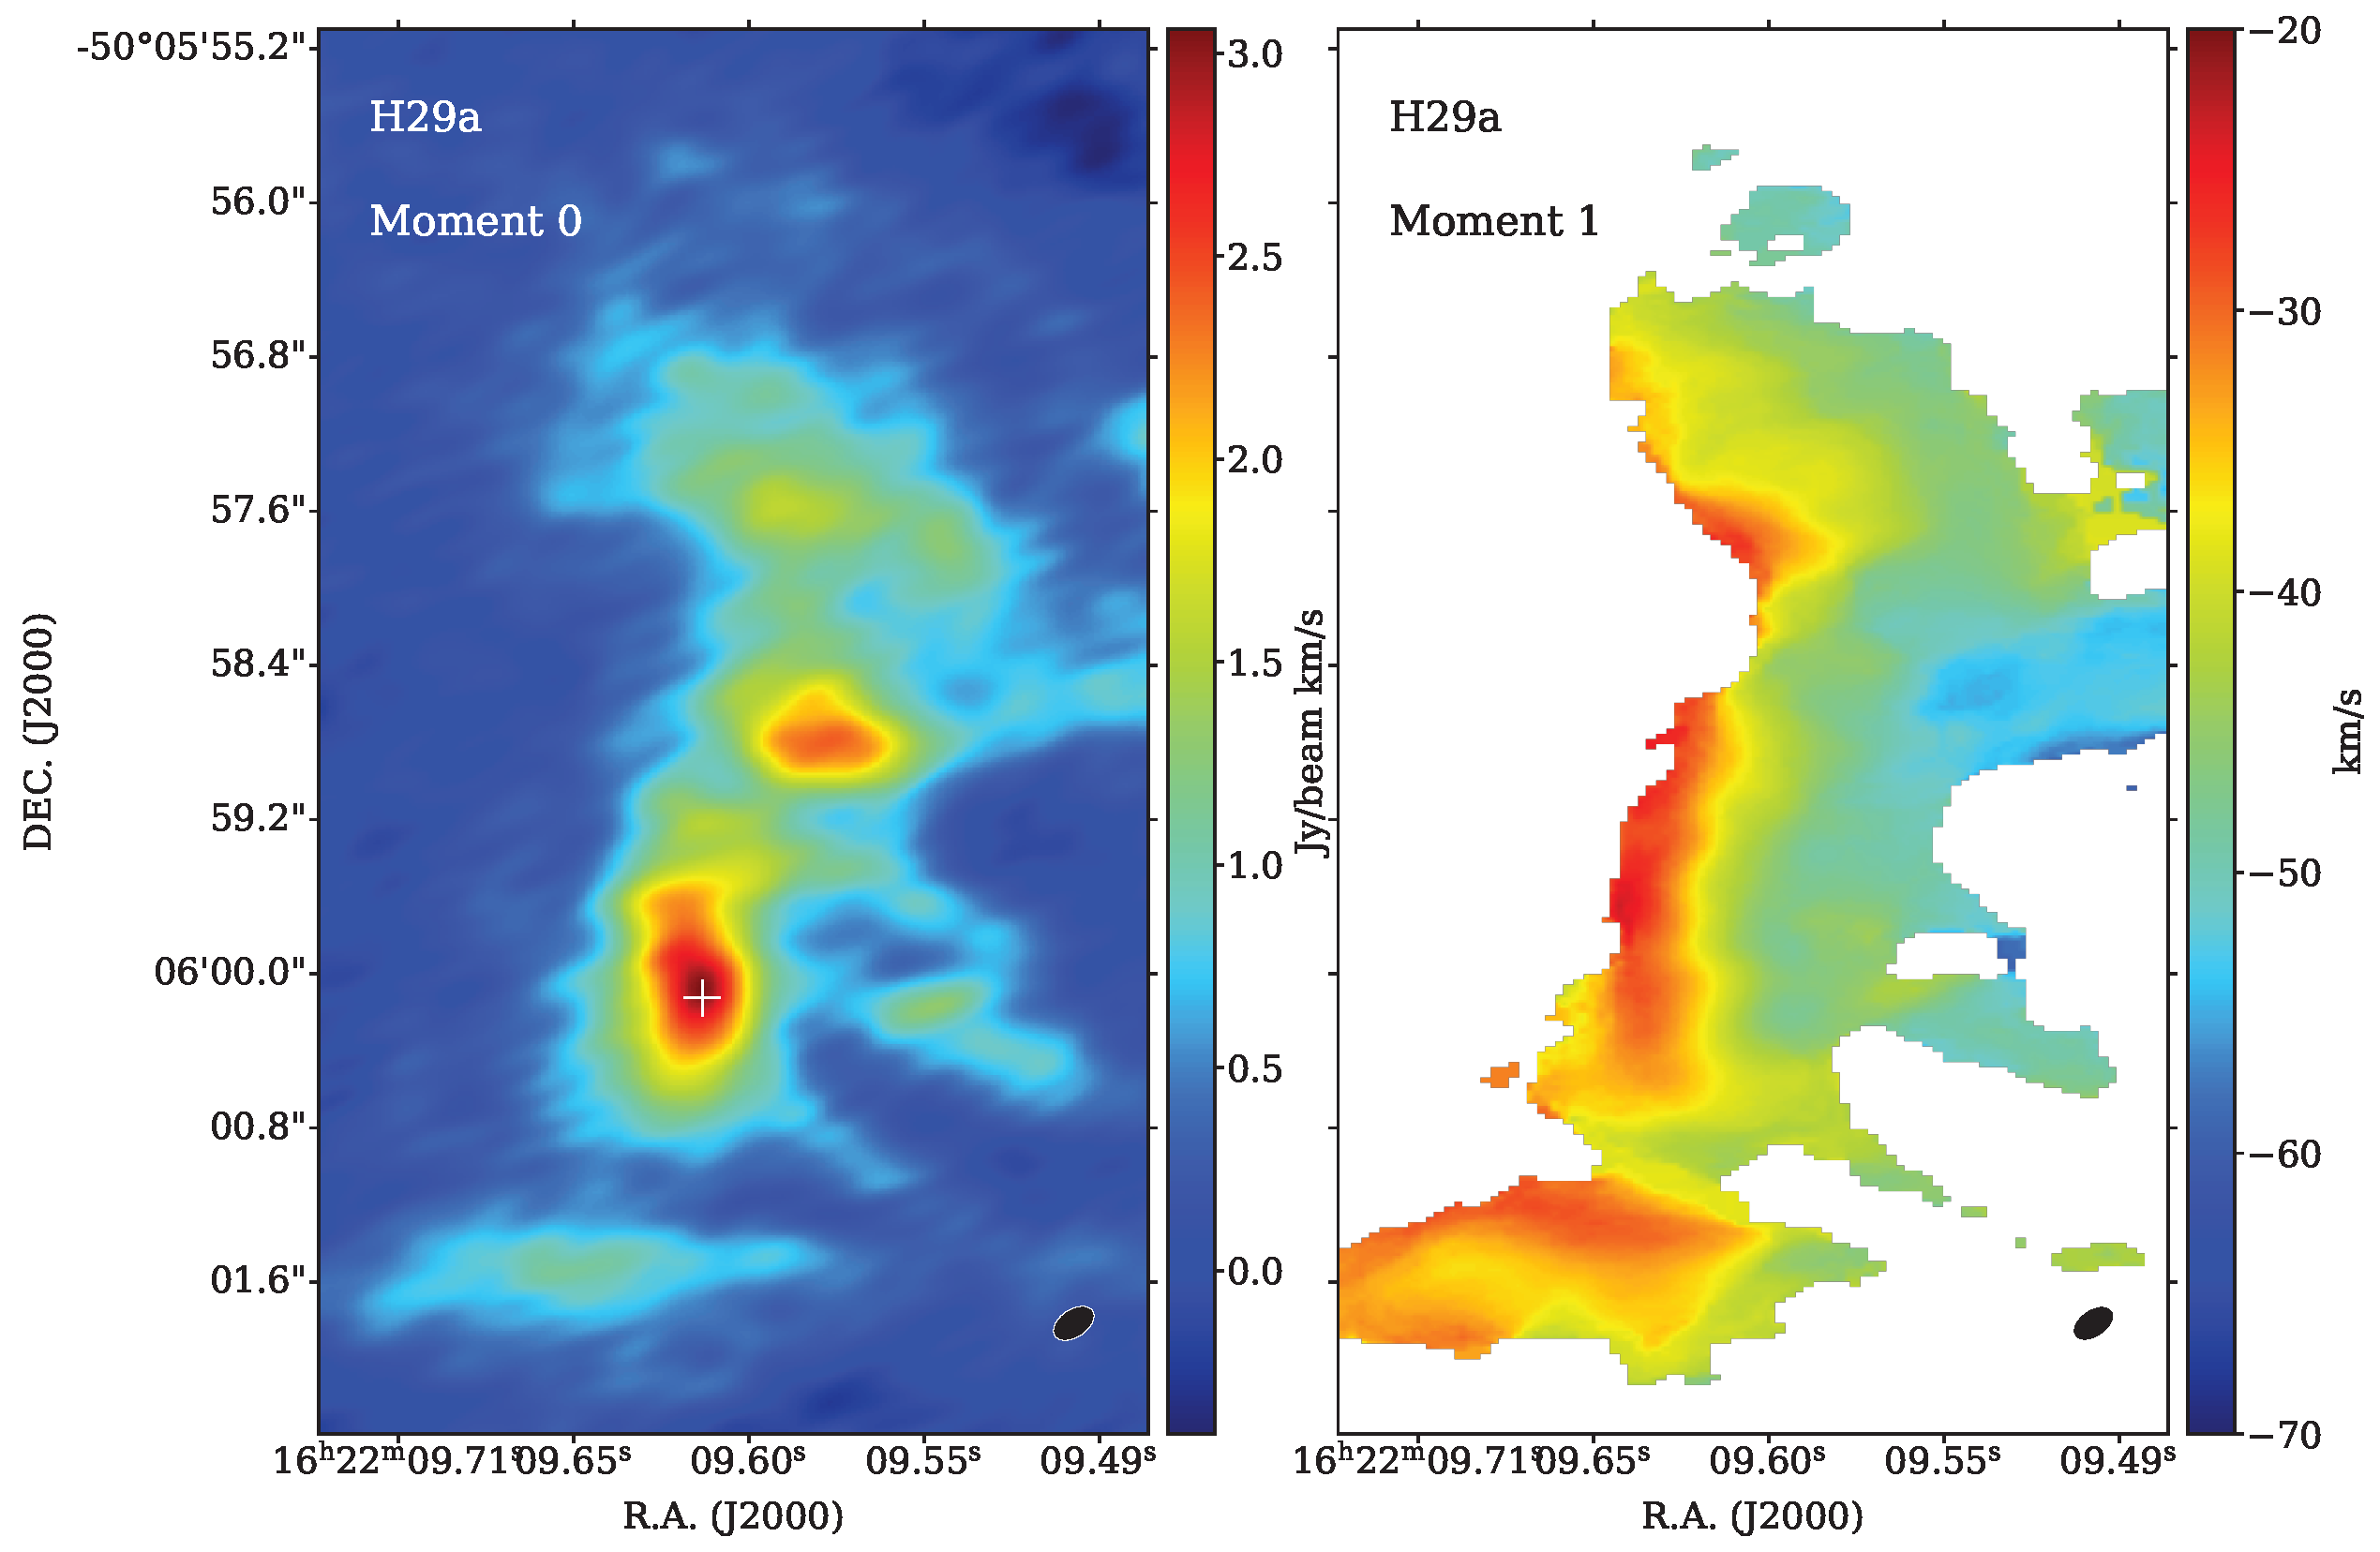
We identified the radio recombination lines (RRLs): H29 α (256.302 GHz) and He29 α (256.317 GHz). Figure 7 shows the spectrum of the H29 α and He29 α recombination lines, integrated over the peak position (0.26″) of the recombination emission indicated by the white cross in Figure 8. A Gaussian fit to the H29 α line profile yields a linewidth (FWHM) of 30.2 ± 0.12 km s−1 and a central velocity of V LSR = 40.57 ± 0.05 km s−1, a peak amplitude of 0.418 ± 0.001 Jy.
For the He29 α line, the fitted linewidth (FWHM) is 28.57 ± 1.23 km s−1, with a central velocity of V LSR = 37.52 ± 0.5 km s−1, and a peak amplitude of 0.0399 ± 0.0015 Jy. A Gaussian fit to the He29 α line profile yields a full width at half maximum (FWHM) of 17.41 ± 0.43 km s 1 , a central velocity of V LSR = 37.52 ± 0.18 km s 1 , and a peak amplitude of 0.00887 ± 0.00019 Jy . The corresponding integrated intensity is measured to be 0.164 ± 0.004 Jy km s 1 . Notably, the central velocities of the recombination lines differ from those of the molecular lines, which may indicate a slight spatial offset between the ionized gas and the molecular material [22]. As an initial estimate for the relative He-to-H line brightness, we calculate a helium-to-hydrogen number abundance of N He / N H = 0.09 ± 0.005 [23]. This value is typical for the interstellar medium (ISM) in the Milky Way [24].
Figure 9 presents the velocity-integrated intensity (moment 0) and intensity-weighted velocity (moment 1) maps of the H29 α line. The integration was performed over the velocity range −73 km s−1 to −5 km s−1. The position of the peak emission in the velocity-integrated map, marked with a white cross, reaches a maximum intensity of 3 Jy beam −1km s−1. The moment 1 map reveals a clear velocity gradient from northwest to southeast, suggesting rotational motion or an outflow/infall.
The observed linewidth ( Δ V ) of the H29 α radio recombination line is determined by a combination of pressure broadening ( Δ V P ) and Doppler broadening ( Δ V D ). The Doppler broadening itself consists of two components: thermal broadening ( Δ V ther ), caused by the thermal motion of particles and dynamical broadening ( Δ V dyn ), which arises from large-scale motions such as infall, outflow, or rotation. Thus, the total observed linewidth can be expressed as the quadrature sum of these contributions. The line broadening mechanisms can be described as follows [25]:
Δ V = Δ V D 2 + Δ V P 2
Δ V D = Δ V dyn 2 + Δ V ther 2 = Δ V dyn + 0.0458 ( T e )
Δ V P = 3.74 × 10 14 × n 4.4 × n e × λ × T e 0.1 ,
where n = 29 is the principal quantum number of the H29 α . The line broadening is estimated using the local electron density and electron temperature for the UC H ii region. The thermal broadening is Δ V ther 19.56 km s−1. The pressure broadening is Δ V P 0.02 km s−1 and contributes little to the total linewidth. The dynamical broadening is Δ V dyn 23.01 km s−1. Dynamical broadening dominates, indicating contributions from large-scale motions; this is further supported by intensity-weighted velocity (moment 1) maps of the H29 α line.

6. Properties of the H ii Region

We use the size θ s = 0 29 × 0 23 0 26 of the maximum peak, indicated by the white cross (see Figure 9), to calculate the parameters of the ionized gas. The emission measure (EM) is a crucial parameter for the H ii region. We derive EM using the equation from [26,27,28]:
EM = 7.1 pc cm 6 S L Jy λ mm T e K 1.5 Δ V km s 1 θ s arcsec 2
We used electron temperature Te = 8350 K from [12]. For the H29 α line, the peak line intensity is SL = 0.42 Jy. Based on the parameters above, we calculated an EM = 1.23 ± 0.006 × 10 9 pc cm−6. The corresponding volume electron density is obtained n e = ( 4.8 ± 0.4 ) × 10 5 cm 3 from EM = n e 2 L f ν where L = 4.2 kpc × tan ( 0 26 ) = 0.0053 pc = 1092 AU is the path length and f V = 1 is a volume filling factor. We employ a mass of H ii region, the Lyman continuum photon number ( N L ), and the excitation parameter (U) to infer the corresponding star type. The corresponding equations are expressed [29,30,31].
M HII M = 3.7 × 10 5 ν GHz 0.05 S ν mJy 0.5 T e 10 4 K 0.175 θ s arcsec 1.5 D kpc 2.5
N L = 4.761 × 10 48 s 1 α ( ν , T e ) 1 ν GHz 0.1 D kpc 2 S ν Jy T e K 0.45
U = 2.706 × 10 16 pc cm 2 T e K 4 / 15 N L s 1 1 / 3
where D = 4.2 ± 0.7 kpc is the source distance, α ( ν , T e ) 1 is a slowly varying function [30,32]. We used continuum flux density (Sν) at 250 GHz [13]. Based on our previously obtained parameters, we get a mass of ionized gas M HII = ( 3.9 ± 2.5 ) × 10 2 M and N L = ( 7.5 ± 2.5 ) × 10 49 s−1, U = 126.6 ± 14 pc cm 2 . The estimated Lyman continuum photon flux suggests the presence of a massive star with a spectral type of O5-O6 V (ZAMS) [33]. The physical parameters of the H ii region indicate an intermediate evolutionary stage between hypercompact (HC) and ultracompact (UC) H ii regions [34].

7. Conclusions

We have reported high-angular resolution ALMA Band 6 observations of highly excited molecular lines of CH 3 CN and CH3OH, along with the H29 α radio recombination line, toward the UC H ii region G333.6-0.2. The main results are summarized as follows.
We identified three hot molecular cores, designated A, B, and C, in which all ten observed K components of the J = 14 13 rotational ladder of CH 3 CN were detected, along with emission in the CH3OH line. Rotational diagrams of the methyl cyanide ( CH 3 CN ) emission show excitation temperatures and column densities of 430 ± 65 K and 2.24 × 10 12 cm−2 for core A and 383 ± 46 K and 7.94 × 10 12 cm−2 for core B.
The first-order moment maps of the CH 3 CN and CH3OH lines show that the molecular gas exhibits two distinct velocity gradients: one from southwest (SW) to northeast (NE), indicating gas expansion, and another from southeast (SE) to northwest (NW), suggesting rotational motion in core A. In addition, velocity gradients were identified in cores B and C: in core B, the gradient is oriented from southeast to northwest and in core C, from west to east. The velocity gradients observed in the first-order moment maps are consistent with rotational motion.The position–velocity analysis confirms differential rotation in all three cores, with core A showing a Keplerian-like profile.
Emission was detected in the H29 α line, with a line center velocity of V LSR = 40.57 ± 0.05 km s−1 and a linewidth (FWHM) of 30.2 ± 0.12 km s−1. The observed linewidth is attributed to dynamical and/or turbulent motions of hot ionized gas, with contributions from dynamical broadening Δ V dyn 23.01 km s−1, thermal broadening Δ V ther 19.56 km s−1 and negligible pressure broadening Δ V P 0.02 km s−1. The dominance of dynamical broadening suggests the presence of large-scale motions, further supported by the intensity-weighted velocity map of the H29 α line. The He29 α line exhibits a central velocity of V LSR = 37.52 ± 0.5 km s−1.
The radio recombination line indicates that the ionized gas originates from a region with a radius of 0.0053 pc, an ionized gas mass of ( 3.9 ± 2.5 ) × 10 2   M , an emission measure of 1.23 × 10 9 ± 5.71 × 10⁶, and an electron density of ( 4.8 ± 0.41 ) × 10 5 cm 3 , assuming a distance of 4.2 kpc. We also calculated the Lyman continuum photon flux, which indicates the presence of a massive star with a spectral type of O5−O6 V (ZAMS). We conclude that the physical parameters of the H ii region suggest an intermediate evolutionary stage between the HC and UC H ii regions.

Author Contributions

Conceptualization, A.O.; methodology, A.O. and A.A.; software, A.O.; validation, A.N., A.N. and M.K.; formal analysis, A.O., A.A. and Z.I.; investigation, A.O., A.M. and A.D.; resources, A.N.; data curation, A.A.; writing—original draft, A.O.; writing—review and editing, N.A. and K.T.; visualization, A.O., A.A. and Z.I. All authors have read and agreed to the published version of the manuscript.

Funding

This research was funded by the Science Committee of the Ministry of Science and Higher Education of the Republic of Kazakhstan (Grant No. AP23489575).

Data Availability Statement

The data used in this study are archival Atacama Large Millimeter/submillimeter Array (ALMA) Band 6 observations, available under project code 2016.1.00577.S from the ALMA Science Archive (accessed on 28 July 2023; https://almascience.eso.org/).

Conflicts of Interest

The authors declare no conflict of interest.

Abbreviations

The following abbreviations are used in this manuscript: HMSFRs—High-mass star-forming regions; ALMA—Atacama Large Millimeter/Submillimeter Array; ISM—Interstellar Medium; RRL—Radio recombination line; ZAMS—Zero Age Main Sequence; COMs—Complex Organic Molecules; UC H ii—Ultracompact H ii region; HC H ii—Hypercompact H ii region; CASA—Common Astronomy Software Applications; CARTA—Cube Analysis and Rendering Tool for Astronomy; MADCUBA—Madrid Data Cube Analysis.

References

  1. Tan, J.C.; Beltrán, M.T.; Caselli, P.; Fontani, F.; Fuente, A.; Krumholz, M.R.; McKee, C.F.; Stolte, A. Massive Star Formation. In Protostars and Planets VI; Beuther, H., Klessen, R.S., Dullemond, C.P., Henning, T., Eds.; University of Arizona Press: Baltimore, MD, USA, 2014; pp. 149–172. [Google Scholar] [CrossRef]
  2. van Dishoeck, E.F.; Blake, G.A. Chemical Evolution of Star-Forming Regions. Annu. Rev. Astron. Astrophys. 1998, 36, 317–368. [Google Scholar] [CrossRef] [PubMed]
  3. Cesaroni, R.; Hofner, P.; Araya, E.; Kurtz, S. The structure of hot molecular cores over 1000 AU. Astron. Astrophys. 2010, 509, A50. [Google Scholar] [CrossRef]
  4. Bonfand, M.; Belloche, A.; Menten, K.M.; Garrod, R.T.; Müller, H.S.P. Exploring molecular complexity with ALMA (EMoCA): Detection of three new hot cores in Sagittarius B2(N). Astron. Astrophys. 2017, 604, A60. [Google Scholar] [CrossRef]
  5. Keto, E.; Wood, K. Observations on the Formation of Massive Stars by Accretion. Astrophys. J. 2006, 637, 850–859. [Google Scholar] [CrossRef]
  6. Kurtz, S.; Cesaroni, R.; Churchwell, E.; Hofner, P.; Walmsley, C.M. Hot Molecular Cores and the Earliest Phases of High-Mass Star Formation. In Protostars and Planets IV; Mannings, V., Boss, A.P., Russell, S.S., Eds.; University of Arizona Press: Baltimore, MD, USA, 2000; pp. 299–326. [Google Scholar]
  7. Goss, W.M.; Shaver, P.A. Galactic Radio Sources I: High Resolution 5000 MHz observations. Aust. J. Phys. Astrophys. Suppl. 1970, 14, 1. [Google Scholar]
  8. Fujiyoshi, T.; Smith, C.H.; Caswell, J.L.; Moore, T.J.T.; Lumsden, S.L.; Aitken, D.K.; Roche, P.F. Radio and infrared recombination studies of the southern massive star forming region G333.6-0.2. Mon. Not. R. Astron. Soc. 2006, 368, 1843–1855. [Google Scholar] [CrossRef]
  9. Grave, J.M.C.; Kumar, M.S.N.; Ojha, D.K.; Teixeira, G.D.C.; Pace, G. The ionizing sources of luminous compact HII regions in the RCW106 and RCW122 clouds. Astron. Astrophys. 2014, 563, A123. [Google Scholar] [CrossRef]
  10. Conti, P.S.; Crowther, P.A. MSX mid-infrared imaging of massive star birth environments - II. Giant HII regions. Mon. Not. R. Astron. Soc. 2004, 355, 899–917. [Google Scholar] [CrossRef]
  11. Fujiyoshi, T.; Smith, C.H.; Moore, T.J.T.; Aitken, D.K.; Roche, P.F.; Quinn, D.E. 12-μm fine-structure emission line and continuum images of G333.6-0.2. Mon. Not. R. Astron. Soc. 1998, 296, 225–230. [Google Scholar] [CrossRef]
  12. Kumar, M.S.N. Radiatively driven Rayleigh-Taylor instability candidates around a forming massive star system. NACO adaptive optics and VISIR study of G333.6-0.2. Astron. Astrophys. 2013, 558, A119. [Google Scholar] [CrossRef]
  13. Mookerjea, B.; Kramer, C.; Nielbock, M.; Nyman, L.Å. The Giant Molecular Cloud associated with RCW 106. A 1.2 mm continuum mapping study. Astron. Astrophys. 2004, 426, 119–129. [Google Scholar] [CrossRef]
  14. McMullin, J.P.; Waters, B.; Schiebel, D.; Young, W.; Golap, K. CASA Architecture and Applications. In Proceedings of the Astronomical Data Analysis Software and Systems XVI, Tucson, AZ, USA, 15–18 October 2017; Astronomical Society of the Pacific Conference Series. Shaw, R.A., Hill, F., Bell, D.J., Eds.; Astronomical Society of the Pacific: San Francisco, CA, USA, 2007; Volume 376, p. 127. [Google Scholar]
  15. Astropy Collaboration; Robitaille, T.P.; Tollerud, E.J.; Greenfield, P.; Droettboom, M.; Bray, E.; Aldcroft, T.; Davis, M.; Ginsburg, A.; Price-Whelan, A.M.; et al. Astropy: A community Python package for astronomy. Astron. Astrophys. 2013, 558, A33. [Google Scholar] [CrossRef]
  16. Bonfand, M.; Csengeri, T.; Bontemps, S.; Brouillet, N.; Motte, F.; Louvet, F.; Ginsburg, A.; Cunningham, N.; Galván-Madrid, R.; Herpin, F.; et al. ALMA-IMF. XI. The sample of hot core candidates: A rich population of young high-mass protostars unveiled by the emission of methyl formate. Astron. Astrophys. 2024, 687, A163. [Google Scholar] [CrossRef]
  17. Csengeri, T.; Bontemps, S.; Wyrowski, F.; Megeath, S.T.; Motte, F.; Sanna, A.; Wienen, M.; Menten, K.M. The ATLASGAL survey: The sample of young massive cluster progenitors. Astron. Astrophys. 2017, 601, A60. [Google Scholar] [CrossRef]
  18. Motte, F.; Bontemps, S.; Csengeri, T.; Pouteau, Y.; Louvet, F.; Stutz, A.M.; Cunningham, N.; López-Sepulcre, A.; Brouillet, N.; Galván-Madrid, R.; et al. ALMA-IMF. I. Investigating the origin of stellar masses: Introduction to the Large Program and first results. Astron. Astrophys. 2022, 662, A8. [Google Scholar] [CrossRef]
  19. Komesh, T.; Omar, A.; Garay, G.; Assembay, Z.; Alimgazinova, N.; Zhumabay, N.; Kyzgarina, M. ALMA observations of the environments of G333.0162+00.7615. In Proceedings of the Resolving the Rise and Fall of Star Formation in Galaxies, Busan, Republic of Korea, 9 June 2023; Wong, T., Kim, W.T., Eds.; IAU Symposium. Cambridge University Press: Cambridge, UK, 2023; Volume 373, pp. 35–38. [Google Scholar] [CrossRef]
  20. Assembay, Z.; Komesh, T.; Garay, G.; Omar, A.; Esimbek, J.; Alimgazinova, N.; Kyzgarina, M.; Murat, S. ALMA observations of the environments of G301.1364-00.2249A. In Proceedings of the Cosmic Masers: Proper Motion Toward the Next-Generation Large Projects, Kagoshima, Japan, 20–24 March 2023; Hirota, T., Imai, H., Menten, K., Pihlström, Y., Eds.; IAU Symposium. Cambridge University Press: Cambridge, UK, 2024; Volume 380, pp. 204–206. [Google Scholar] [CrossRef]
  21. Martín, S.; Martín-Pintado, J.; Blanco-Sánchez, C.; Rivilla, V.M.; Rodríguez-Franco, A.; Rico-Villas, F. Spectral Line Identification and Modelling (SLIM) in the MAdrid Data CUBe Analysis (MADCUBA) package. Interactive software for data cube analysis. Astron. Astrophys. 2019, 631, A159. [Google Scholar] [CrossRef]
  22. Komesh, T.; Garay, G.; Henkel, C.; Omar, A.; Estalella, R.; Assembay, Z.; Li, D.; Guzmán, A.; Esimbek, J.; Huang, J.; et al. Infall Motions in the Hot Core Associated with the Hypercompact H II Region G345.0061+01.794 B. Astrophys. J. 2024, 967, 15. [Google Scholar] [CrossRef]
  23. Roelfsema, P.R.; Goss, W.M. High resolution radio recombination line observations. Astron. Astrophys. Rev. 1992, 4, 161–214. [Google Scholar] [CrossRef]
  24. Méndez-Delgado, J.E.; Esteban, C.; García-Rojas, J.; Arellano-Córdova, K.Z.; Valerdi, M. Helium abundances and its radial gradient from the spectra of H II regions and ring nebulae of the Milky Way. Mon. Not. R. Astron. Soc. 2020, 496, 2726–2742. [Google Scholar] [CrossRef]
  25. Gordon, M.A.; Sorochenko, R.L. Radio Recombination Lines: Their Physics and Astronomical Applications; Springer: Berlin/Heidelberg, Germany, 2002; Volume 282. [Google Scholar]
  26. Wilson, T.L.; Rohlfs, K.; Hüttemeister, S. Tools of Radio Astronomy; Springer: Berlin/Heidelberg, Germany, 2009. [Google Scholar] [CrossRef]
  27. Shi, H.; Zhao, J.H.; Han, J.L. Nature of W51e2: Massive Cores at Different Phases of Star Formation. Astrophys. J. 2010, 710, 843–852. [Google Scholar] [CrossRef]
  28. Manapbayeva, A.; Omar, A.; Alimgazinova, N.; Komesh, T.; Kyzgarina, M.; Esimbek, J.; Assembay, Z. Determination of physical parameters of the W40 HII region using observations of H110α radio recombination line. Rec. Contr. Phys. 2023, 86, 4–11. [Google Scholar] [CrossRef]
  29. Rubin, R.H. A Discussion of the Sizes and Excitation of H II Regions. Astrophys. J. 1968, 154, 391. [Google Scholar] [CrossRef]
  30. Mezger, P.G.; Smith, L.F.; Churchwell, E. IR-excess Radiation and the Absorption Characteristics of Dust in Galactic H II Regions. Astron. Astrophys. 1974, 32, 269. [Google Scholar]
  31. Matsakis, D.N.; Evans, N.J., II; Sato, T.; Zuckerman, B. Radio continuum measurements of compact H II regions and other sources. Astron. J. 1976, 81, 172–177. [Google Scholar] [CrossRef]
  32. Mehringer, D.M. Radio Continuum and Radio Recombination Line Observations of W51. Astrophys. J. Suppl. 1994, 91, 713. [Google Scholar] [CrossRef]
  33. Panagia, N. Some Physical parameters of early-type stars. Astron. J. 1973, 78, 929–934. [Google Scholar] [CrossRef]
  34. Yang, A.Y.; Urquhart, J.S.; Thompson, M.A.; Menten, K.M.; Wyrowski, F.; Brunthaler, A.; Tian, W.W.; Rugel, M.; Yang, X.L.; Yao, S.; et al. A population of hypercompact H II regions identified from young H II regions. Astron. Astrophys. 2021, 645, A110. [Google Scholar] [CrossRef]
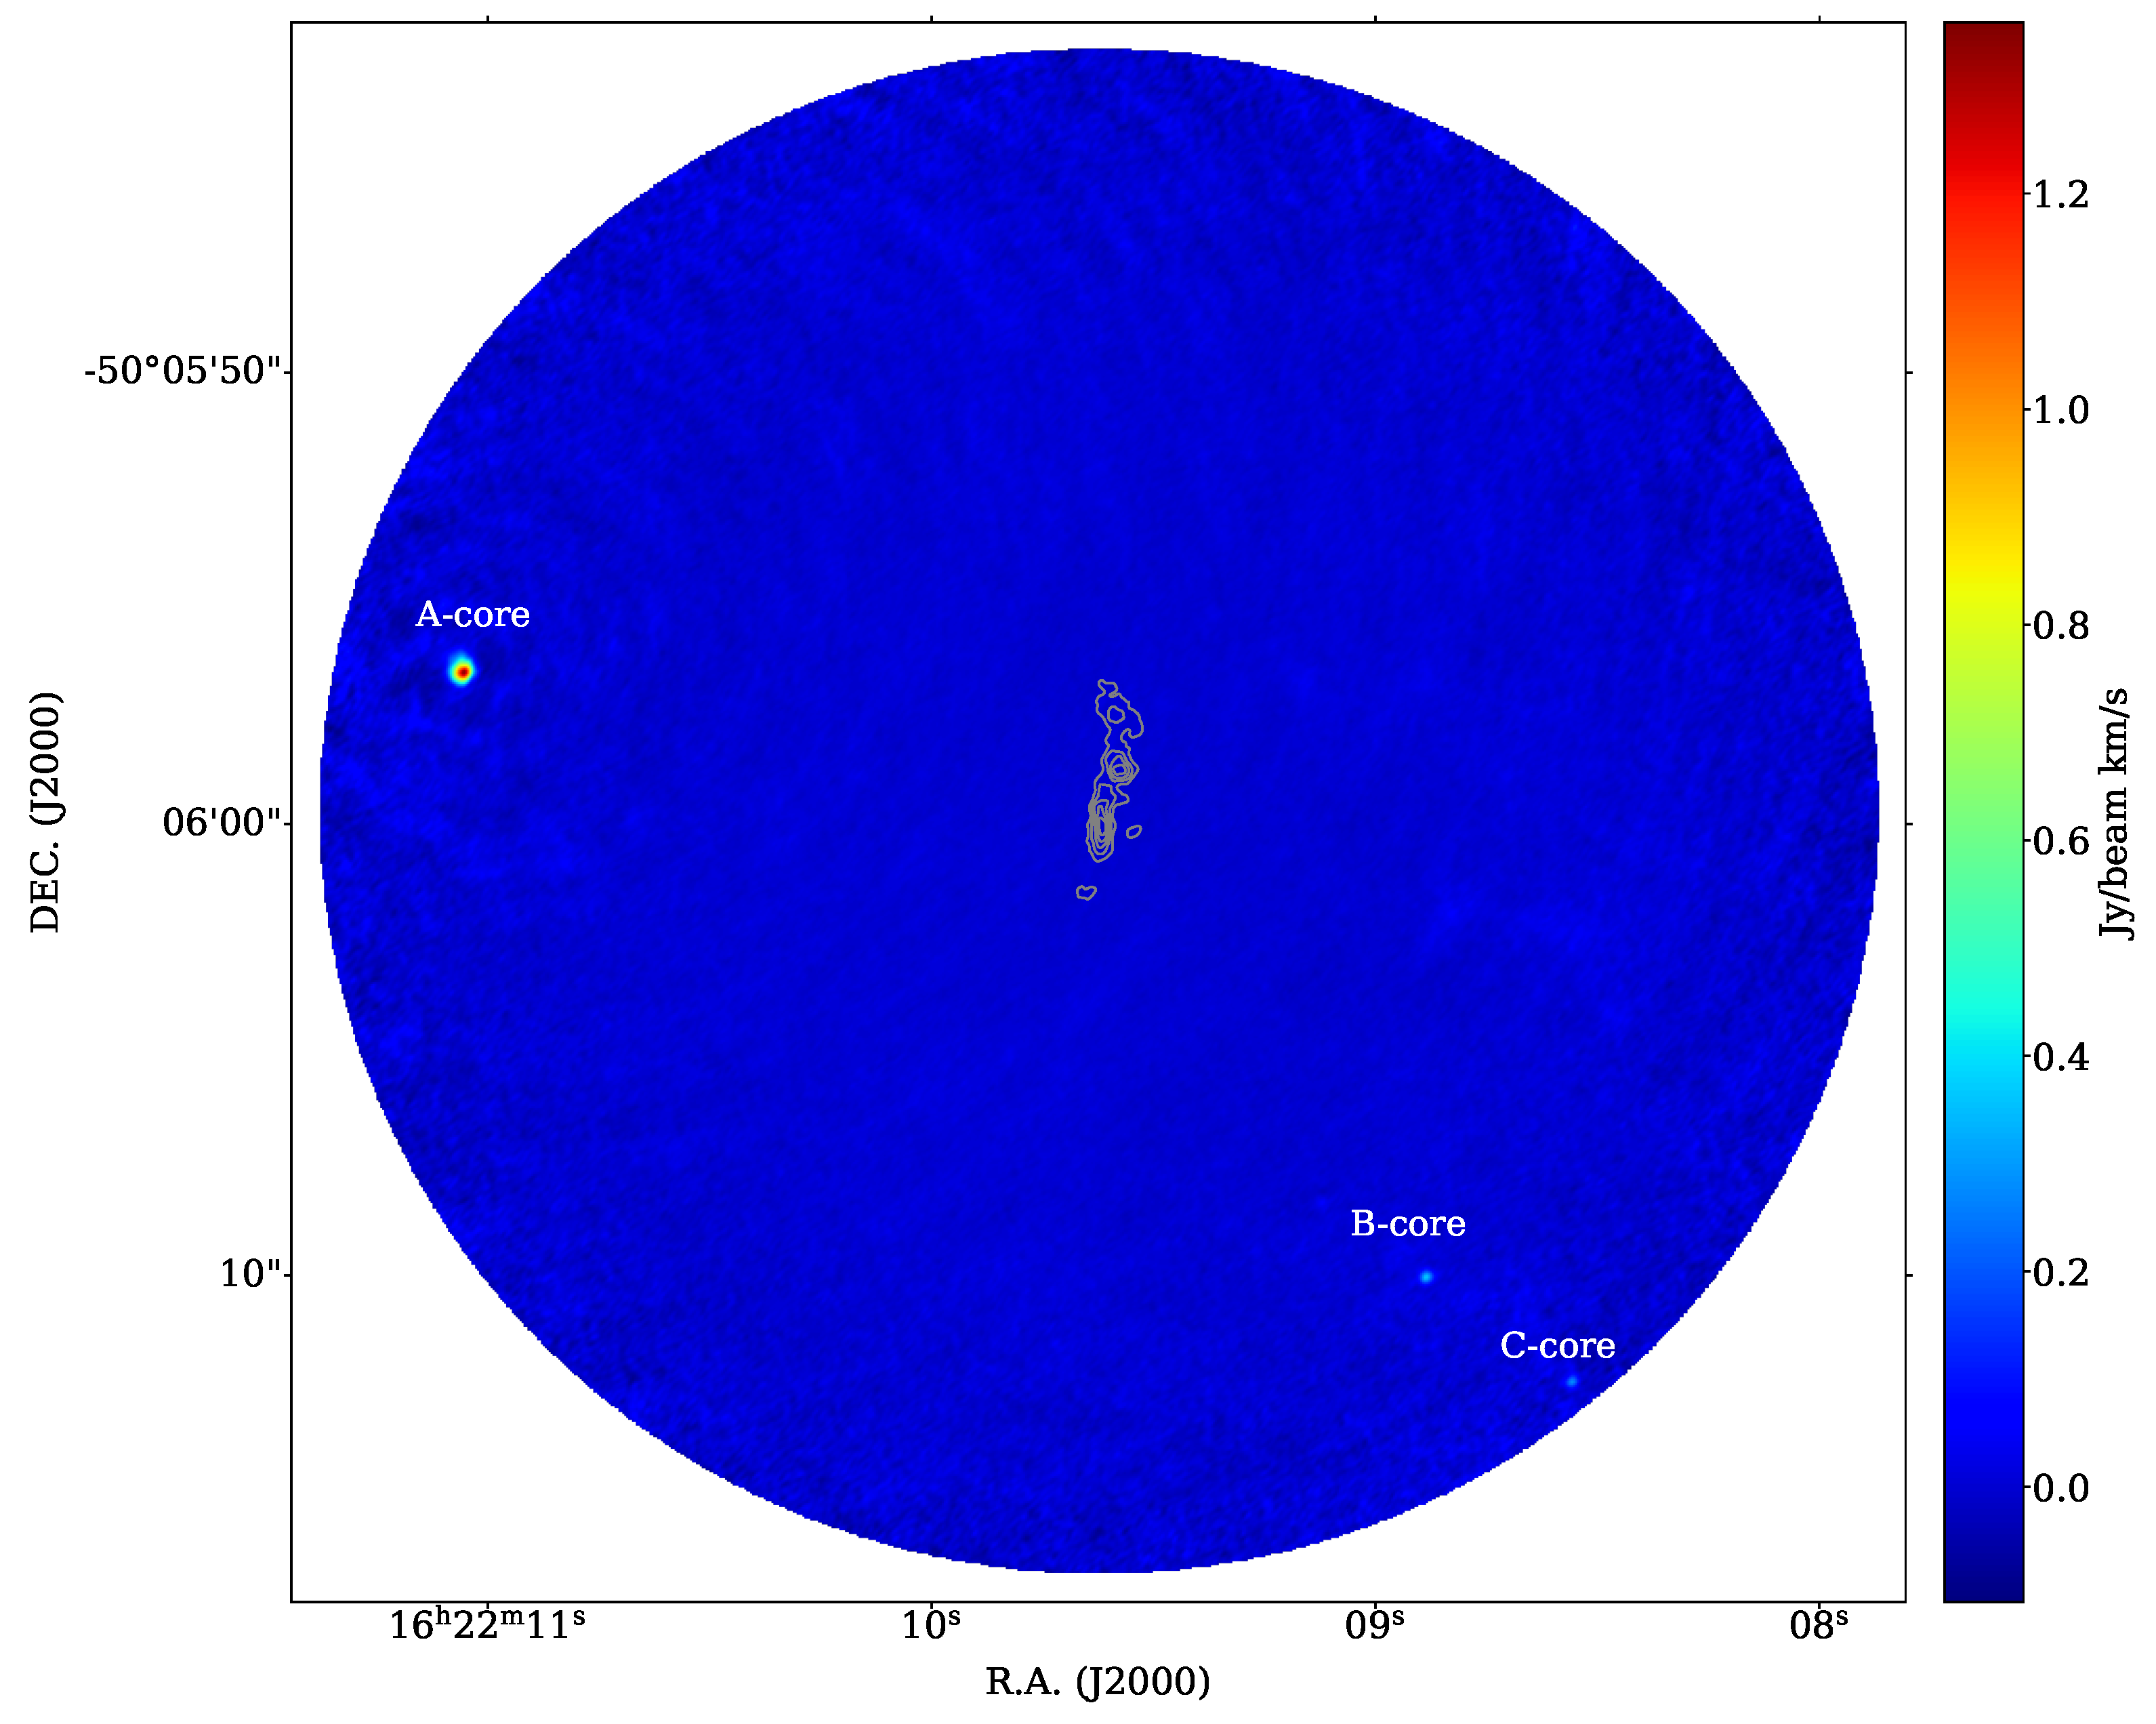
Figure 1. Moment 0 map of CH3CN emission (color scale) overlaid with H29 α moment 0 contours. Three molecular cores labeled A, B, and C.
Galaxies 13 00073 g001
Figure 2. Spectra of CH 3 CN emission in the J = 14 13 transition. (Top) Core A (central region); (Second) core A; (Third) core B; (Bottom) core C. The K-components (K = 0–9) are marked with red dashed lines (VLSR = −47 km s−1). Additional molecular lines detected in core A are marked with blue dashed lines.
Galaxies 13 00073 g002
Figure 3. Images of the velocity-integrated intensity (moment 0; upper panels), intensity-weighted velocities (moment 1; middle panels), and velocity dispersion map (moment 2; lower panels) in the CH 3 CN J = 14 13 K = 2 transition for cores A, B, C. The black ellipse shown at the bottom right corner of the lower left panel indicates the beam size.
Galaxies 13 00073 g003
Figure 4. Spectral emission features of CH3OH toward cores A, B, and C. The red line shows the detected CH3OH spectrum.
Galaxies 13 00073 g004
Figure 5. Same as Figure 5 for CH3OH J = 5 1 , 4 4 1 , 3 emission.
Galaxies 13 00073 g005
Figure 6. Position–velocity (PV) diagrams of cores A, B, and C. The color scale represents the emission intensity in Jy beam−1 for each core. For core A, the intensity ranges from 0.075 to 0.2 Jy beam−1; for core B, from 0.015 to 0.048 Jy beam−1; and for core C, from 0.014 to 0.04 Jy beam−1.
Galaxies 13 00073 g006
Figure 7. Rotational diagrams of cores A and B. The black open triangles represent the observed data points of CH3CN rotational transitions, and the solid blue lines indicate the best-fit linear regressions used to estimate the excitation temperature and column density.
Galaxies 13 00073 g007
Figure 8. Spectrum of the H29 α and He29 α radio recombination lines (RRLs). The blue line indicates the observed data and the red line denotes the Gaussian model fit.
Galaxies 13 00073 g008
Figure 9. Maps of the velocity-integrated intensity (moment 0; left panel) and intensity-weighted velocity (moment 1; right panel) of the H29 α radio recombination line. The black ellipse at the bottom right corner indicates the synthesized beam. The white plus sign marks the peak of RRL emission at RA = 16h22m09.617s, Dec = 50 ° 06 00 110 .
Galaxies 13 00073 g009
Table 1. Coordinates, peak velocities, and sizes of the hot cores.
CoreCoordinates (RA, Dec) V LSR [km s−1]Sizea [″] Size deconv b [″]
A(16h 22m 11.061s, 50 ° 05′56″64) 52.3 0.3600.315
B(16h 22m 08.892s, 50 ° 06′10″03) 46.9 0.2370.162
C(16h 22m 08.559s, 50 ° 06′12″34) 46.2 0.2470.176
a Observed source size from a 2D Gaussian fit (FWHM, not deconvolved). b Deconvolved source size, corrected for beam broadening using the geometric mean beam size.
Table 2. Observational parameters of CH 3 CN   J = 14 13 rotational transitions and other detected lines within this spectral window.
SpeciesTransitionFrequency (GHz)Eu/k (K)
CH3CN140 → 130257.52792.70
141 → 131257.52299.85
142 → 132257.508121.28
143 → 133257.483156.99
144 → 134257.448206.98
145 → 135257.404271.23
146 → 136257.349349.72
147 → 137257.285442.45
148 → 138257.210549.38
149 → 139257.127670.50
CH313CN140 → 130, F = 14-13257.40092.65
141 → 131, F = 14-13257.39599.80
142 → 132, F = 14-13257.380121.23
143 → 133, F = 14-13257.355156.94
144 → 134, F = 14-13257.321206.93
145 → 135, F = 14-13257.276271.17
146 → 136, F = 14-13257.222349.67
CH3OCHO23 (2.22)−22 (2.21) E257.242342.23
20 (5.15)–19 (5.14) E257.227142.79
20 (5.15)–19 (5.14) A257.253142.79
13CH3OH15 (3.13)–15 (2.14)257.422321.79
CH3CH2CN30 (0.30)–29 (0.29)257.310193.54
CH2CHCN27 (16.11)–26 (16.10)257.1301718.76
Note: The letters “A” and “E” refer to torsional species of the CH3 group caused by internal rotation. These symmetry labels arise from the quantum mechanical treatment of the hindered rotation of the methyl group in asymmetric top molecules such as CH3OCHO.
Disclaimer/Publisher’s Note: The statements, opinions and data contained in all publications are solely those of the individual author(s) and contributor(s) and not of MDPI and/or the editor(s). MDPI and/or the editor(s) disclaim responsibility for any injury to people or property resulting from any ideas, methods, instructions or products referred to in the content.