Article

Searching for New Objects with the B[e] Phenomenon

by
Aisha Zh. Naurzbayeva
1,
Nazgul Sh. Alimgazinova
1,*,
Anatoly S. Miroshnichenko
2,3,
Corinne Rossi
4,
Inna V. Reva
3,
Raushan I. Kokumbayeva
3,
Chingis T. Omarov
3,
Sergei V. Zharikov
5,
Nadine Manset
6,
Ashish Raj
7,8,
Arti Joshi
9,
Richard J. Rudy
10,
Richard C. Puetter
11,
Raleigh B. Perry
12 and
Kunduz M. Turekhanova
1
1
Faculty of Physics and Technology, Al-Farabi Kazakh National University, Al-Farabi Ave., 71, Almaty 050040, Kazakhstan
2
Department of Physics and Astronomy, University of North Carolina, Greensboro, NC 27402, USA
3
Fesenkov Astrophysical Institute, Observatory, 23, Almaty 050020, Kazakhstan
4
Dipartimento di Fisica, Universitá Sapienza, Piazzale Aldo Moro 2, I 00185 Roma, Italy
5
Instituto de Astronomía, Universidad Nacional Autónoma de Mexico, AP 106, Ensenada 22800, BC, Mexico
6
Canada-France-Hawaii Telescope Corporation, 65-1238 Mamalahoa Hwy, Kamuela, HI 96743, USA
7
Indian Centre for Space Physics, 466 Barakhola, Netai Nagar, Kolkata 700099, West Bengal, India
8
Uttar Pradesh State Institute of Forensic Science (UPSIFS), Aurawan, P.O. Banthra, Lucknow 226401, UP, India
9
Institute of Astrophysics, Pontificia Universidad Católica de Chile, Av. Vicuña MacKenna 4860, Santiago 7820436, Chile
10
Kookoosint Scientific, 1530 Calle Portada, Camarillo, CA 93010, USA
11
Center for Astrophysics, Space Science University of California, 9500 Gilman Dr La Jolla, San Diego, CA 92093, USA
12
Alabaster Scientific, P.O. Box 120, Irvington, VA 22480, USA
*
Author to whom correspondence should be addressed.
Galaxies 2025, 13(3), 67; https://doi.org/10.3390/galaxies13030067
Submission received: 17 April 2025 / Revised: 5 June 2025 / Accepted: 6 June 2025 / Published: 11 June 2025
(This article belongs to the Special Issue Circumstellar Matter in Hot Star Systems)

Abstract

Objects with the B[e] phenomenon, whose defining features are the presence of forbidden emission lines and infrared excess coming from circumstellar dust, represent a broad range of evolutionary stages from pre-main-sequence to planetary nebulae. They are important for understanding mechanisms of the circumstellar matter formation and evolution. However, it is not easy to discover them, especially among faint stars, as forbidden emission lines are usually weak and hardly noticeable in low-resolution spectra. We developed photometric criteria to search for candidate objects with this phenomenon based on a combination of optical and near-infrared color indices and found nearly 40 objects that satisfy these criteria. Spectroscopy of the candidates allows us to make more confident conclusions on their classification. We present the results of our photometric and spectroscopic observations of six objects, which are part of a large list of ∼40 objects that satisfy our photometric selection criteria for candidate objects with the B[e] phenomenon. Forbidden lines of neutral oxygen were clearly detected in the optical spectrum of one object (VES 683) and suspected in three others. One object, AS 415, is most likely a binary system with components that exhibit partial eclipses but without the B[e] phenomenon, while IRAS 20402 + 4638 may be a luminous member of the FS CMa objects group.

1. Introduction

The B[e] phenomenon is the simultaneous presence of line emission (forbidden, such as [O I], [Fe II], [N II], and sometimes [O III], and permitted, such as Balmer and Fe II) and large IR excesses due to hot circumstellar (CS) dust in the spectra of B–type stars [1]. It has been found in five stellar groups [2]: pre-main-sequence stars, symbiotic binaries (a cool giant and a white dwarf or a neutron star), compact planetary nebulae, supergiants, and unclassified objects. Most of the latter became members of the FS CMa-type objects group, whose previously unexplained properties were suggested to be due to ongoing or past interaction in binary systems [3].
Symbiotic binaries and compact planetary nebulae can be identified relatively easily due to their distinct features, such as the dominance of a cool star or a special atmospheric chemical composition that reflects a very evolved evolutionary stage, respectively. The subgroup of Galactic B[e] supergiants is rather small (about a dozen objects), with an average luminosity of log L/L⊙ = 5.1 ± 0.2, most of which are recognized binary systems [3]. These systems seem to produce CS dust during mass-transfer events, which may lead to a significant increase of the gainer’s mass accompanied with a luminosity increase. The latter process may lead to classification of FS CMa-type objects as B[e] supergiants if the evolutionary scenario is unknown, e.g., [4].
It is more challenging to distinguish pre-main-sequence Herbig Ae/Be stars and dust-producing supposedly more evolved FS CMa objects. The former are typically found in star-forming regions and still contain large amounts of cold dust, which produces a large IR excess up to wavelengths of λ∼100 μm. The latter are usually field stars and exhibit more dust with higher temperatures near the sublimation limit (∼1500 K) over more distant, colder dust that results in a steep decrease of the IR flux longward of λ∼10–30 μm. Confusion between the two subgroups still exists, as some Herbig Ae/Be stars are isolated, and far-IR fluxes are still not precisely measured for faintest objects. Also, precise classification and fundamental parameter determination of many objects with the B[e] phenomenon is difficult due to veiling of the stellar features by the CS material, uncertain contributions of the CS material to the systems’ brightness, and uncertain distances despite the recent Gaia measurements.
The original list of objects with the B[e] phenomenon [1] was nearly unchanged until the end of the 20th century due to rare IR surveys and a lack of reliable criteria to search for more objects. The advent of IR all-sky surveys and systematization of the data that existed by the 2010s allowed for a few expansions of the above mentioned list [5,6]. Our studies were particularly focused on the FS CMa objects, because they remained the least understood group that exhibit this phenomenon. It contains only a few bright stars, which were observed spectroscopically by that time. Therefore, we concentrated on a statistical study of available photometric data.
Here we describe the results of our study of six objects selected on the basis of the criteria outlined in Section 2 as an example of a multi-method and multi-wavelength approach compared to occasional observations, which were more common in the past. The candidate objects selection method is described in Section 2, our observations of the selected candidate objects are reported in Section 3, the results of our analysis of the objects’ observed properties are presented in Section 4, and conclusions are summarized in Section 5.

2. Methodology

The idea of our method is based on some distinct photometric properties of FS CMa-type objects originally described in [3]. The first attempt at finding more candidates to this group yielded 20 objects introduced in [6], 10 of which became bona fide group members. This experience was summarized by Kuratova et al. [7], where the photometric criteria were updated.
The search for new candidates was performed in the NOMAD catalog [8] and refined with the UCAC–4 catalog [9]. Both catalogs contain optical and near-IR JHK photometry (from 2MASS) along with accurate positions. Since objects with the B[e] phenomenon contain a B-type star, we were searching for objects with optical color indices of reddened hot stars. This was a qualitative criterion, as optical data in NOMAD were obtained non-simultaneously.
The quantitative criteria were as follows: VK ≥ 2 mag, JH ≥ 0.7 mag, and HK ≥ 0.7 mag to select objects with IR excesses stronger than those typically introduced by the interstellar reddening and free–free emission. Additionally, mid- and far-IR data were searched for the objects selected in this way to analyze the slope of the IR spectral energy distribution (SED). Only those objects whose SED slope was d [log(λ Fλ)]/d [logλ] ≤ −0.5 at wavelengths λ ≥ 10 μm were closely studied. First results of this search were presented at the international conference “The B[e] Phenomenon. Forty Years of Studies” [10].
Objects whose properties satisfy the above criteria (including the mentioned IR SED slope) are observed spectroscopically, and only those with detected emission lines are studied further. We also take advantage of the wealth of data taken in the course of recent or still ongoing all-sky surveys both in the optical and IR spectral regions in order to put more constraints on the objects’ nature and evolutionary status.
The described criteria allow for selection of other kinds of objects, such as binary systems with components of very different temperatures and no real IR excess radiation or extremely reddened hot stars and only gaseous CS environments. Our systematic searches in the NOMAD and UCAC–4 catalogs resulted in finding nearly a hundred objects that satisfy the quantitative photometric criteria. Nearly 40 objects were found to exhibit emission lines in their optical spectra.
Although the method has limitations, it has been shown to be a good source of expansion of the FS CMa group (see [11] and references therein). Most objects from the above mentioned catalogs that are brighter than V∼13–14 mag with the B[e] phenomenon and other ones with previously unknown presence of CS matter have been found in our searches. Starting with this paper, we intend to proceed with their detailed studies to the extent that our spectroscopic observations allow us. A better understanding of the objects’ properties requires higher-quality and higher-resolution spectroscopic data, which can be obtained with larger telescopes.

3. Observations

Spectroscopic observations were performed with various telescopes and with spectrographs shown in Table 1. Data reduction was performed with standard techniques (bias subtraction, flat-fielding, and wavelength calibration with various calibration lamps filled with ThAr for higher-resolution and other gases for lower-resolution instruments). These procedures are described in the references shown in the last column of Table 1.
Photometric observations for several objects were obtained at two 1-m telescopes of the Tien-Shan Astronomical Observatory of the Fesenkov Astrophysical Institute (near Almaty, Kazakhstan). A 3056 × 3056 Apogee F9000 D9 CCD camera with 12-μm pixels and a 3–step cooling was used with a set of BVRc filters. The images covered a 10′ × 10′ around the objects. The TShAO data were reduced using Maxim-DL software1 using standard steps, such as bias subtraction, flat-field correction, and removal of bad pixels using dark images taken with the same exposure times as the object images.
Comparison stars were chosen in the object images using photometry from the UCAC–4 catalog and checking for variability using ASAS SN light curves. Transformations from the TShAO instrumental photometric system into the Johnson–Cousins system were performed using images of standard fields, such as the open cluster NGC2169. The photometric data are shown in Table 2. The uncertainties of all the measurements range from 0.01 mag for the two brightest stars to 0.03 mag for the faintest one.
Additionally, we collected archival data from various ground-based (2MASS2) and space-based IR missions, such as IRAS [12], WISE [13], MSX [14], and AKARI [15], to construct SEDs of the objects selected using our criteria and assess their IR excesses. The object SEDs shown in Figure 1 were corrected for the total (interstellar + possible CS) extinction using an average interstellar extinction law [16].
Table 1. Summary of spectroscopic observations.
ObservatoryD, mΔ λ, μmR = λλRef.
Bol.1.520.40–0.70∼800–1500BFOSC *
HCT2.000.40–0.70∼800–1500HFOSC [17]
OAN SPM2.120.40–0.70∼18,000REOSC [18]
LO3.000.46–2.50∼700NIRIS [19]
CFHT3.600.36–1.05∼60,000ESPaDoNs [20]
Column information: (1)—Observatory or telescope names: Bol.—Bologna Observatory (Mt. Orzale, Italy), HCT—Himalayan Chandra Telescope (India), OAN SPM—Observatorio Astronómico Nacional San Pedro Martir (México), LO—Lick Observatory (USA), CFHT—Canada–France–Hawaii Telescope (Mauna Kea, USA); (2)—diameter of the telescope primary mirror, (3)—spectral range observed; (4)—spectral resolving power; (5)—spectrograph name and reference to the spectrograph description and data reduction. * Information about the BFOSC spectrograph can be found here: http://www.bo.astro.it/~loiano/TechPage/bfosceng/BFOSC.html; accessed on 5 June 2025.
Table 2. TShAO photometry.
IRAS IDHJDVBVVR
00040 + 65182,459,135.32111.410.560.13
2,459,136.24511.410.570.13
2,459,139.26311.400.560.14
2,459,205.10611.420.550.14
2,459,219.04711.410.550.13
00205 + 70232,458,121.04111.230.630.21
2,459,108.39811.230.640.20
2,459,109.38411.230.630.18
2,459,149.04811.220.640.20
20402 + 46382,459,137.13014.611.731.27
2,459,138.07414.501.881.50
2,459,139.07214.651.841.46
Column information: (1)—Objects’ ID from IRAS, (2)—time of the observation, (3)—V-band magnitude, (4)—(BV) color-index, (5)—(VRc) color-index. Typical uncertainties of the brightness and color-indices 0.01–0.02 mag.

4. Results

As mentioned in Section 2, our search resulted in selecting several dozen objects, most of which were observed spectroscopically and classified. The spectral classification criteria included properties of both absorption and emission lines, such as the temperature-dependent ratio of the equivalent widths of the He I 4471 Å and Mg II 4482 Å lines and the presence of He I lines in emission. The classification based on these criteria was tested by the analysis of the optical SED described below, as its IR part typically contains an excess radiation due to the CS matter.
The SEDs were fitted with theoretical ones from a grid by [21] assuming that the observed SED was affected by extinction from both CS and interstellar medium. The wavelength dependence of both possible extinction components was assumed to follow an average Galactic interstellar law [16], which is a reasonable assumption used in many studies. In the fitting process, we compared a set of theoretical SEDs with the observed ones dereddened with different amount of extinction, which was applied in a range of AV from 0 to 4–5 mag with an increment of 0.01 mag. The observed SEDs dereddened with each extinction value was compared to all theoretical SEDs in a range of Teff from 5000 K to 30,000 K. The smallest (typically a few percent) deviation between a theoretical SED and the observed one with a certain AV was considered the best fit.
This procedure is virtually insensitive to the surface gravity, because it mostly affects the UV part of the spectral range. However, we typically do not have UV data for our objects due to their faintness. We estimate the accuracy of the best-fitting T eff to be ∼1000–2000 K, which is reasonable for stars hotter than 10,000 K. Our spectroscopic T eff estimates agree well with the photometric ones. The best fitting A V was tested by the presence of diffuse interstellar bands in the objects’ spectra, taking into account that these features only represent the interstellar part of the extinction.
Below we describe the properties of a sample of six objects, which fit with the defining criteria for FS CMa type objects from [3], and analyze additional information on them from published sources. Other objects found in our searches are being analyzed and will be presented elsewhere.

4.1. UCAC–4 778–000339 (VES 683 = IRAS 00040 + 6518 = HIP 549)

The star was first mentioned in [22] as a member of the Cepheus IV (currently known as Cep OB4) association and described as a new Be star with a spectral type of ∼B8 and very broad Balmer lines, particularly Hβ and Hγ. It was also included in the catalog of Vatican Emission-line Stars as VES 683 [23] and detected in the course of the Northern Milky Way survey for stars with Hα emission [24]. Despite its relative faintness, it was part of the HIPPARCOS mission [25], which obtained a set of visual photometric data but failed to measure its parallax.
The IRAS mission measured IR fluxes at λ 12 μm and λ 25 μm [12]. Kerton and Brunt [26] detected two sources of molecular CO emission at a few arcminutes from the star. At such a large linear distance (≥105 AU), the sources are unlikely to be associated with the star that rules out its young age. The detection of the star by HIPPARCOS, IRAS, and MSX missions led Clarke et al. [5] to include it in their catalog of stars with IR excesses, but the evolutionary status was not assigned to it. At the same time, the properties of VES 683 have not been closely studied.
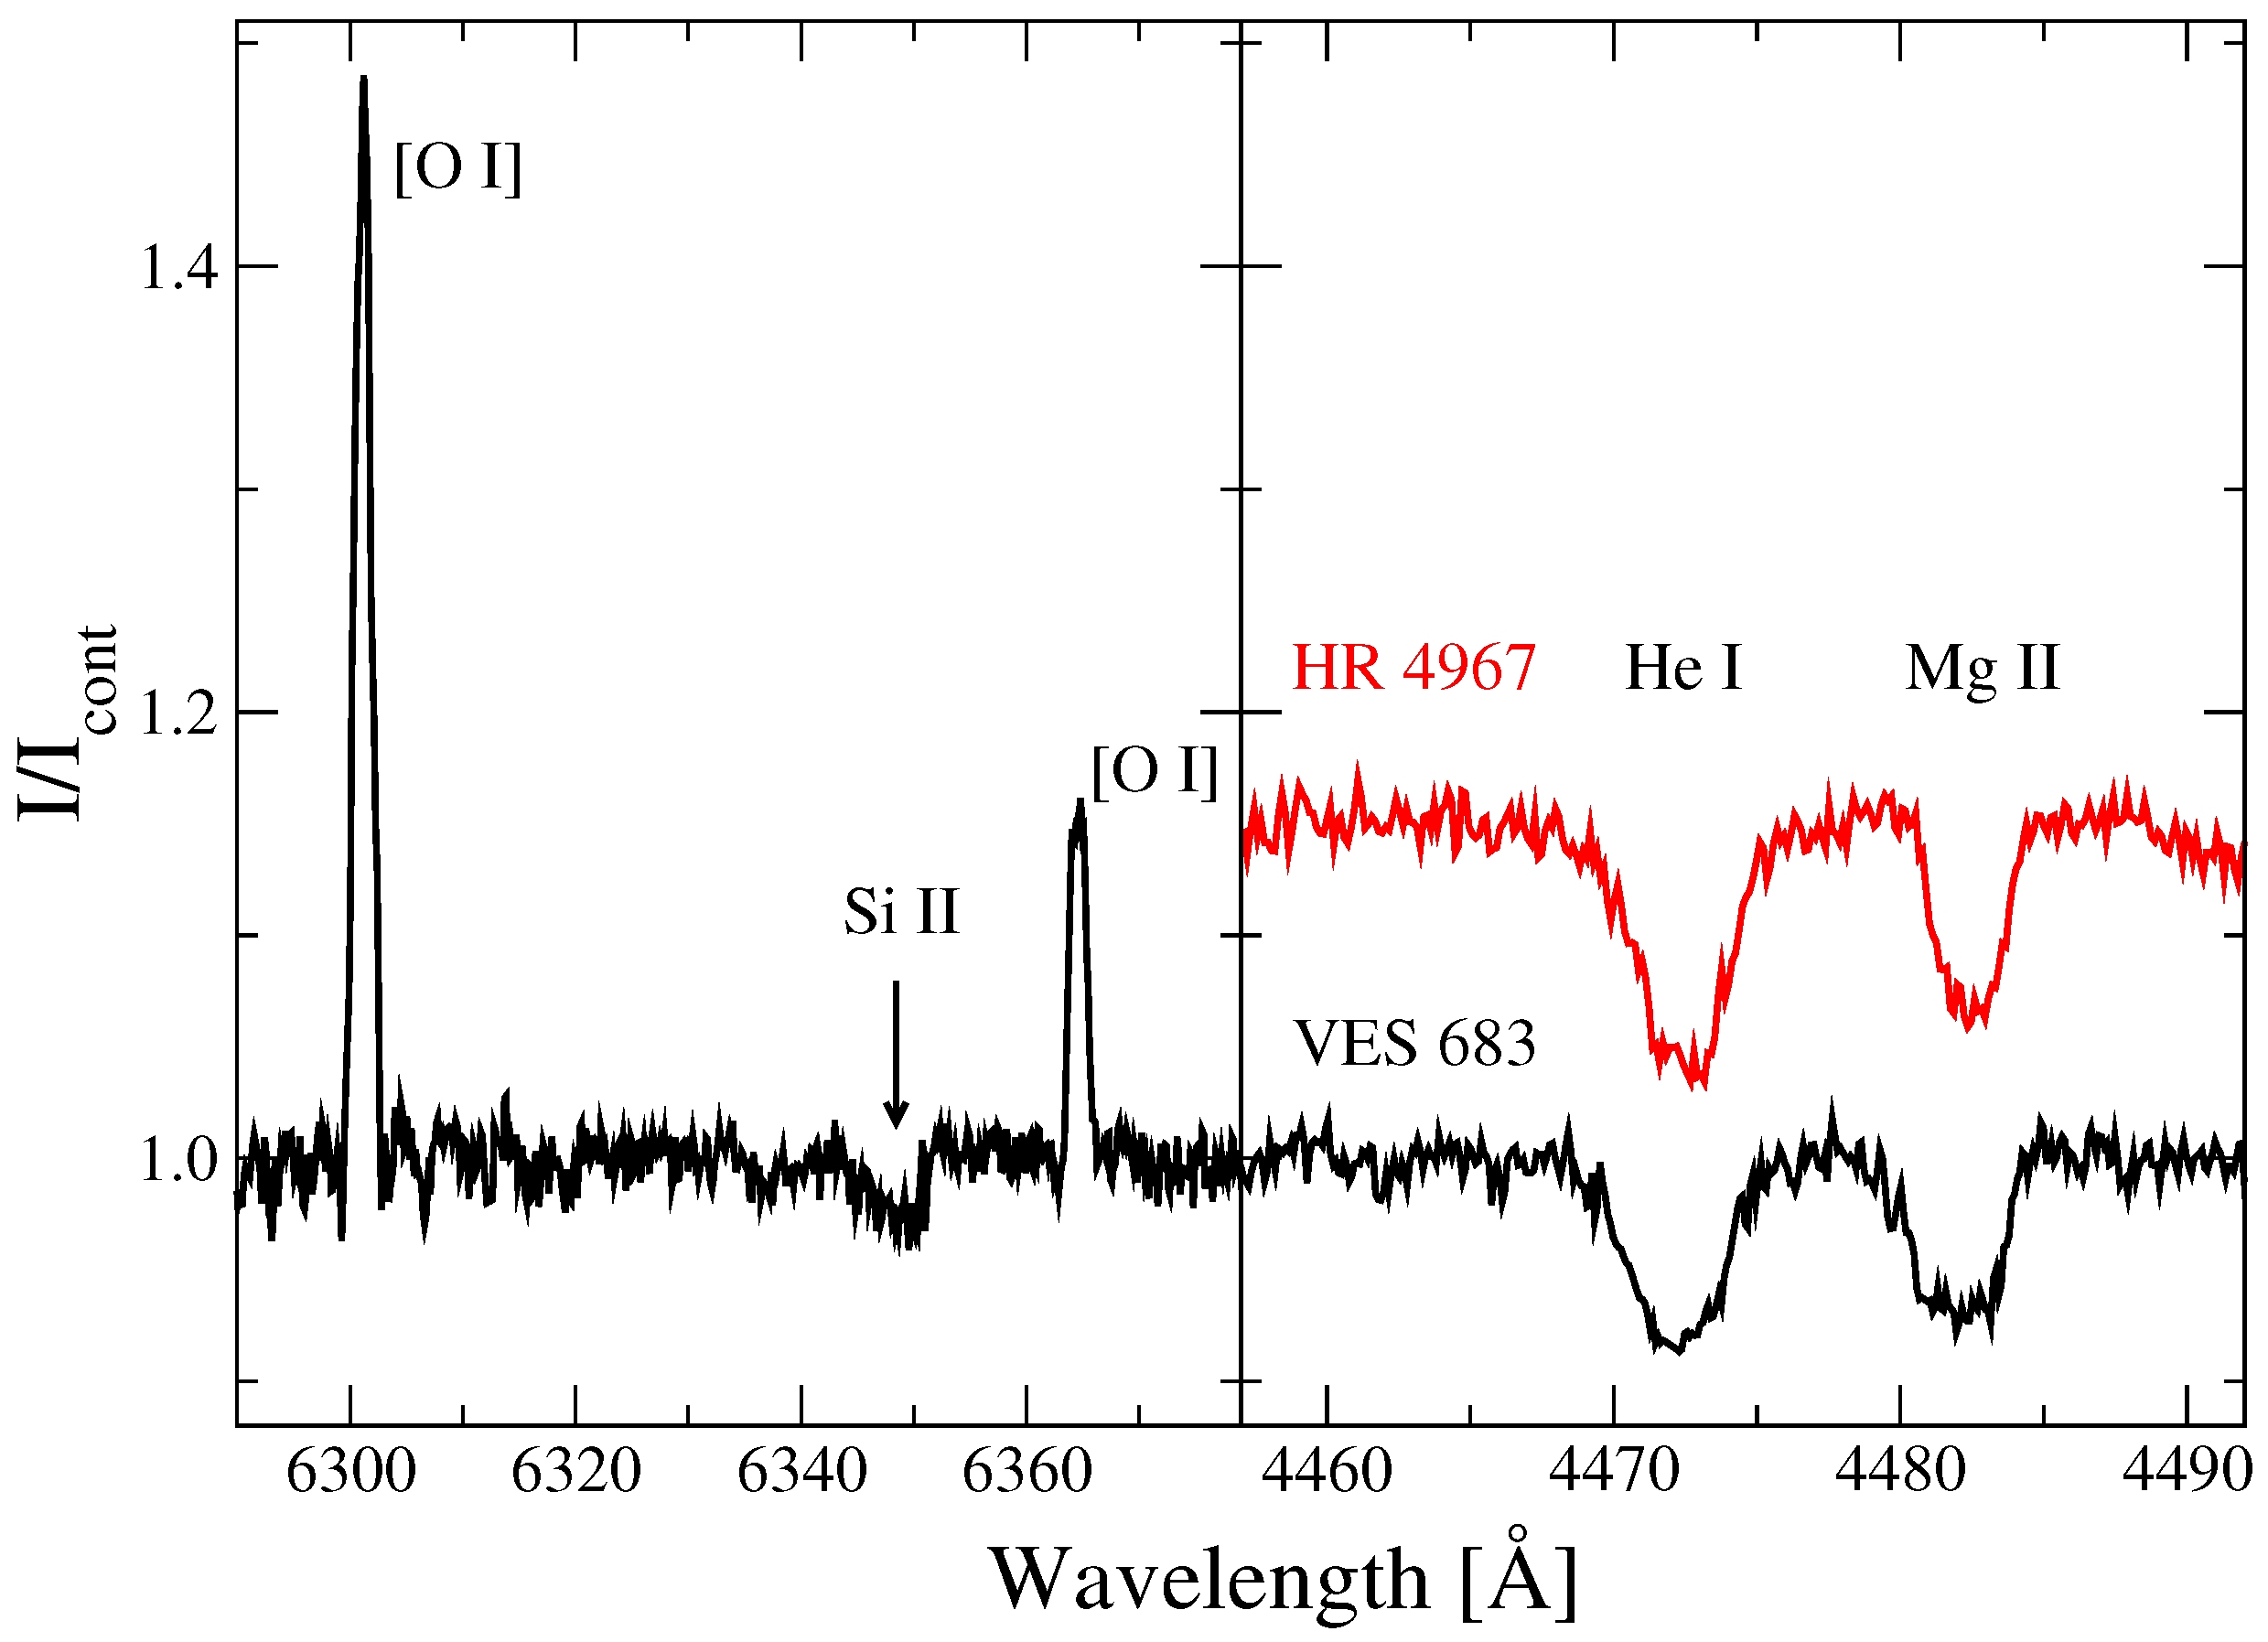
We obtained one medium-resolution optical spectrum at OAN SPM and one low-resolution optical/near-IR spectrum at the Lick Observatory in 2018. The optical spectrum shows double-peaked Balmer line profiles in emission, relatively strong emission lines of [O I] at 6300 Å and 6363 Å (see Figure 2, left panel), absorption lines of He I, as well as nearly equally strong absorption lines of He I and Mg II at 4471 Å and 4482 Å (see Figure 2, right panel), respectively. This figure shows a comparison of these line profiles with those of the B5/6 III star HR 4967 that has a Teff = 14,100 K [27] and a projected rotational velocity v sin i = 115 km s−1 [28]. The comparison star spectrum was taken at the 0.81 ṁ telescope of the Three College Observatory (TCO, North Carolina, USA) with an Eshel spectrograph from Shelyak Instruments3 and a spectral resolving power of R∼12,000.
The comparison suggests that VES 683 has a slightly lower Teff of 12,000–13,000 K and a slightly higher v sin i of ∼150 km s−1. The spectroscopic Teff estimate agrees well with that derived from the SED fitting (see Figure 1).
The clearly detected IR excess shows a strong decline toward longer wavelengths (see Figure 1). Along with the detected forbidden oxygen lines, this feature is consistent with the properties of FS CMa-type objects rather than with those of pre-main-sequence Herbig Ae/Be stars.

4.2. UCAC–4   729–007078 (IRAS 00411 + 5528)

This object has not been referred to in the literature, except for the detection by the IRAS mission. We obtained one medium-resolution optical spectrum at OAN SPM in 2010 and one low-resolution optical spectrum at Mt. Orzale in 2012. The OAN SPM spectrum has a low signal-to-noise ratio but shows a P-Cyg type Hα line profile (see Figure 1) and two components in both Na I interstellar absorption D–lines (5889 Å and 5895 Å). The low-resolution spectrum reveals absorption lines of the hydrogen Balmer series typical for a late B-type star. Neither helium absorption lines nor other emission lines were clearly detected in the noise.
The SED shows an IR excess starts from the H–band and declines longward of λ∼10 μm. This property along with the P-Cyg Hα profile are consistent with those of a subgroup of FS CMa objects, whose CS disks are viewed nearly edge-on (cf. [29]). The object is unlikely to be a pre-main-sequence Herbig Be star, as it lacks a surrounding nebulocity and belongs to no star-forming region.

4.3. UCAC–4   725–014138 (2MASS J01380790 + 5453463)

This is another almost unstudied object mentioned only in one paper. Lee and Lim [30] reported it in their study of the Per OB1 association as an emission-line star of the spectral type A0 and classified it as a Herbig Ae/Be star. These authors took low-dispersion optical spectroscopic observations with a resolution of 4.8 Å/pixel and detected signs of emission in the Hα line that was filling the atmospheric absorption.
Our medium-resolution spectrum taken at OAN SPM in October 2010 shows P-Cyg type emission-line profiles of Hα and Hβ, weak Fe II emission lines at 4923 Å, 5018 Å, and 5169 Å, as well as weak but clearly recognized emission components in the Na I D-lines. Lines of neutral helium were not detected, probably due to a low signal-to-noise ratio and their intrinsic weakness. The low-resolution spectrum taken at Mt. Orzale in December 2010 also shows a P-Cyg type profile of the Hα line and the same Fe II emission lines, but the higher members of the Balmer series show purely absorption profiles. This spectrum also shows the Mg II 4482 Å line that is much stronger than the neighboring He I 4471 Å line, thus confirming the spectral type near A0.
The object’s Gaia DR3 distance (see Table 3) is in agreement with that of Per OB1, e.g., [31]. A Digital Sky Survey visual image of it shows an arc-shaped nebulosity that may be considered an indicator of its young age. However, the steep decline of the IR-excess is inconsistent with its pre-main-sequence status. The emission-line spectrum is similar to those of evolved objects with the B[e] phenomenon. A higher quality spectrum is needed to further clarify the object’s nature and evolutionary status.

4.4. UCAC–4   685–083239 (IRAS 20402 + 4638)

The object was first mentioned as an emission-line star in the vicinity of the North America nebula (NGC7000) by Welin [33]. In this paper, it was denoted UHα 5 with a spectral type B3 and a P-Cyg type profile in the Hβ line. It also appeared in the Northern Milky Way survey of stars with the Hα emission [24].
We took one low-resolution spectrum at Mt. Orzale in 2010 and two spectra at HCT in 2020. All three spectra show the Hα through Hγ lines in emission with P-Cyg profiles. Higher members of the Balmer series are too weak to be recognized in the noise, as the object is faint and reddened. Other emission features include numerous Fe II lines. We did not clearly recognize the presence of He I lines, some of which are blended with those of Fe II lines (e.g., 4922 Å and 5015 Å) at this resolution, and ruled out their appearance in emission. Based on the spectral features and the SED fitting, we classify the object as a B3-type star.
The ASAS SN light curve shows a stable average brightness (V = 14.69 ± 0.05 mag, g = 15.67 ± 0.07 mag), while TESS data show some pulsation-like activity with an amplitude of ≤0.1 mag. Such a small variability makes us confident in the existence of an IR excess (see Figure 1). Although our low-resolution spectra contain no obvious forbidden lines, the detected properties are most consistent with those of FS CMa objects (especially the steep slope of the IR SED).

4.5. UCAC–4   657–086975 (AS 415 = [KW97] 46–33 = TIC 14320055)

AS 415 was included in the Mount Wilson Catalog of Additional Stars with Hα emission by [34]. The Hα line emission was later confirmed by [24]. It is projectionally located near the Cyg OB2 association at a distance of ∼1.7 kpc from the Sun, which is known to contain many massive stars obscured by a large interstellar extinction, e.g., [35]. Comerón et al. [36] selected AS 415 as an object located in the outskirts of Cyg OB2, which is corroborated by the Gaia DR3 distance (see Table 3).
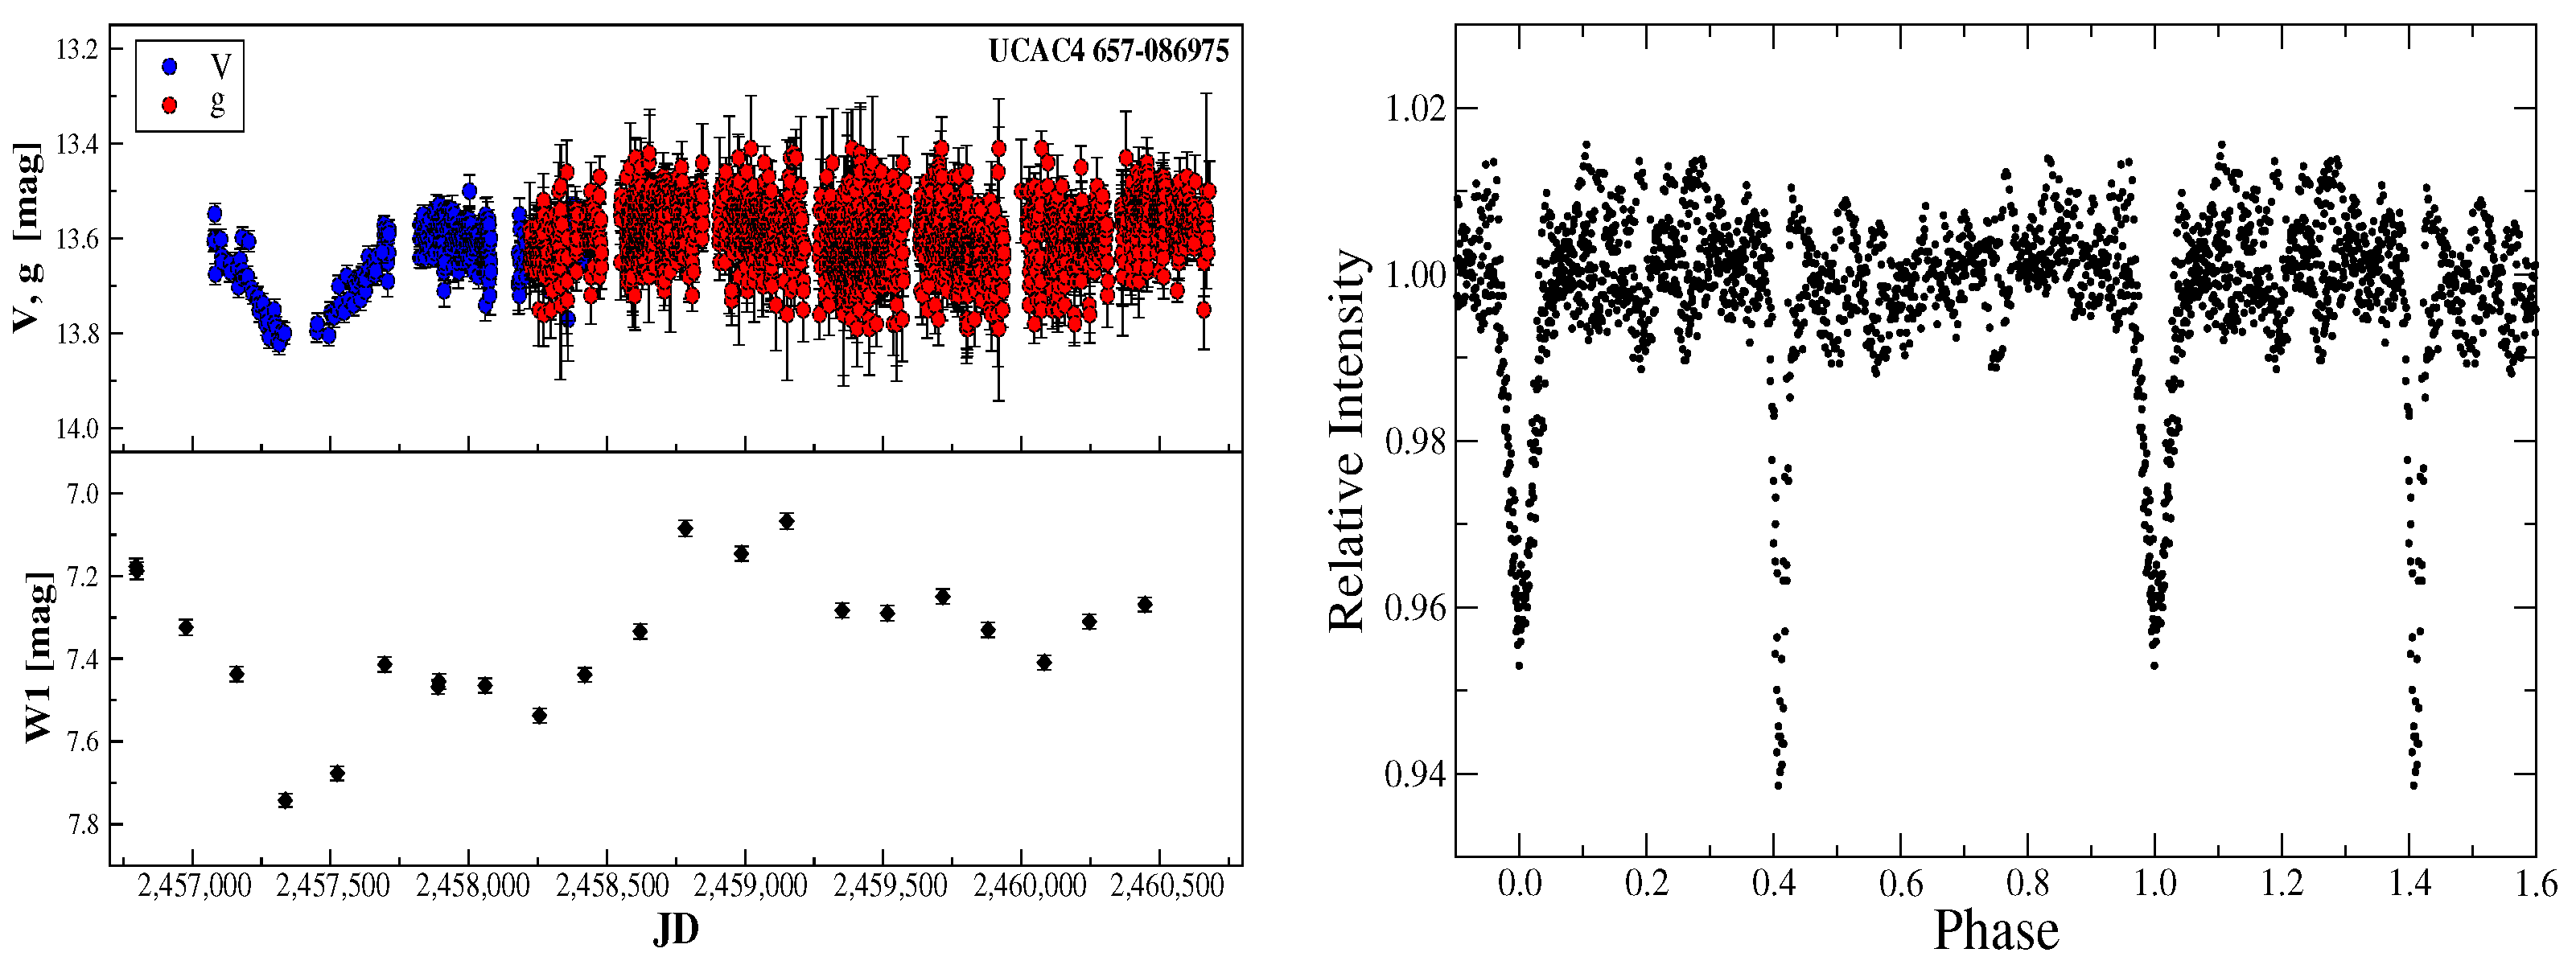
We took two low-resolution spectra with the HCT telescope that show the presence of He I 5876 Å line in emission as well as relatively strong DIBs at 5780 Å and 5797 Å in addition to the emission in Hα. Our SED fitting reveals a weak IR excess and a discrepancy between the WISE and MSX fluxes that may be due to temporal brightness variations, as the data were taken at different times. This assumption is supported by the visual and near-IR light curves shown in Figure 3. The brightness decrease occurred simultaneously in both spectral regions, suggesting that it might have been due to obscuration of the star and its wind by an external object or changes of the star’s intrinsic properties (e.g., luminosity). There is no clear indication of a dusty IR excess.
The presence of the He I line in emission sets a lower limit for the star’s Teff to 20,000 K, e.g., [37]. The large extinction found in our SED fitting is mostly interstellar and consistent with that for many objects in and around Cyg OB2 association. Correction for the extinction makes its luminosity close to 105 L⊙, which corresponds to that of a ∼15 M⊙ star near the end of main sequence. The relatively strong Hα emission suggests the presence of a stellar wind, although the P Cyg absorption component is not clearly seen at our spectral resolution. The origin of the photometric fading episode is unclear. This makes further photometric observations as well as a higher-resolution spectroscopy worthwhile for refining the knowledge of the object’s nature.
AS 415 was observed by The Asteroid Terrestrial-impact Last Alert System (ATLAS) in two optical photometric bands ([38] c-band covering 420–650 nm and o-band covering 560–820 nm) and found to be variable with a period of 891 days and amplitudes of 0.3 mag in both bands based on 69 c-band and 117 o-band observations. It was classified as a long-period variable (LPV). However, the sparseness of the data makes this result uncertain.
TESS data taken during in seven sectors from 2019 to 2024 show weak and strictly periodic brightness minima (see Figure 2, right panel) of different duration (∼0.58 and ∼0.295 days) and a period of 8.27 days. Due to a small depth (∼5% of the maximum brightness), the minima are not seen on the ASAS SN light curve, but a sample of the ASAS SN data show nearly sinusoidal cycles with a similar period of 8.38 days and an amplitude of 0.16 mag [39]. Additionally, shorter-term regular brightness variations are also visible in the TESS data and may be due to pulsations. A preliminary analysis of the TESS phase curve suggests that the binary system exhibits partial eclipses and consists of stars with different radii but with nearly the same brightness in the red spectral region. A more detailed analysis of the light curve is out of scope for this paper, but the position of AS 415 on the HR diagram (see Figure 4) would change if the component luminosities are comparable.

4.6. UCAC–4   804–001080 (IRAS 00205 + 7023 = TYC 4298–248–1)

This is an unstudied object, whose unusual color indices were recognized in our search with the criteria mentioned above. We took two high-resolution optical spectra with the 2.1 m OAN SPM telescope and 4 spectra with CFHT (two in 2017 and four in 2018) and a low-resolution optical/near-IR spectrum at Lick in 2018. The optical spectra show several emission lines, such as a relatively weak Hα (see Figure 1), a much weaker Hβ within a wide absorption profile, an O I 8446 Å, and three Ca II 8498 Å, 8542 Å, and 8662 Å lines. All the emission-line profiles are double-peaked with nearly the same peak intensity ratios. In particular, the Hα line profile shows very small variations of the violet-to-red peak intensity ratio of 1.14 ± 0.01.
Among the purely absorption lines that appear in the CFHT spectra, we identified a narrow Ca II K line at 3933 Å, several He I lines, Mg II 4482 Å, Si II 6347 Å, blended together lines of the O I triplet at 7772–7775 Å, and hydrogen lines of the Paschen series. All the lines are broad, indicating a high projected rotational velocity. Forbidden emission lines characteristic of objects with the B[e] phenomenon were not detected in our spectra.
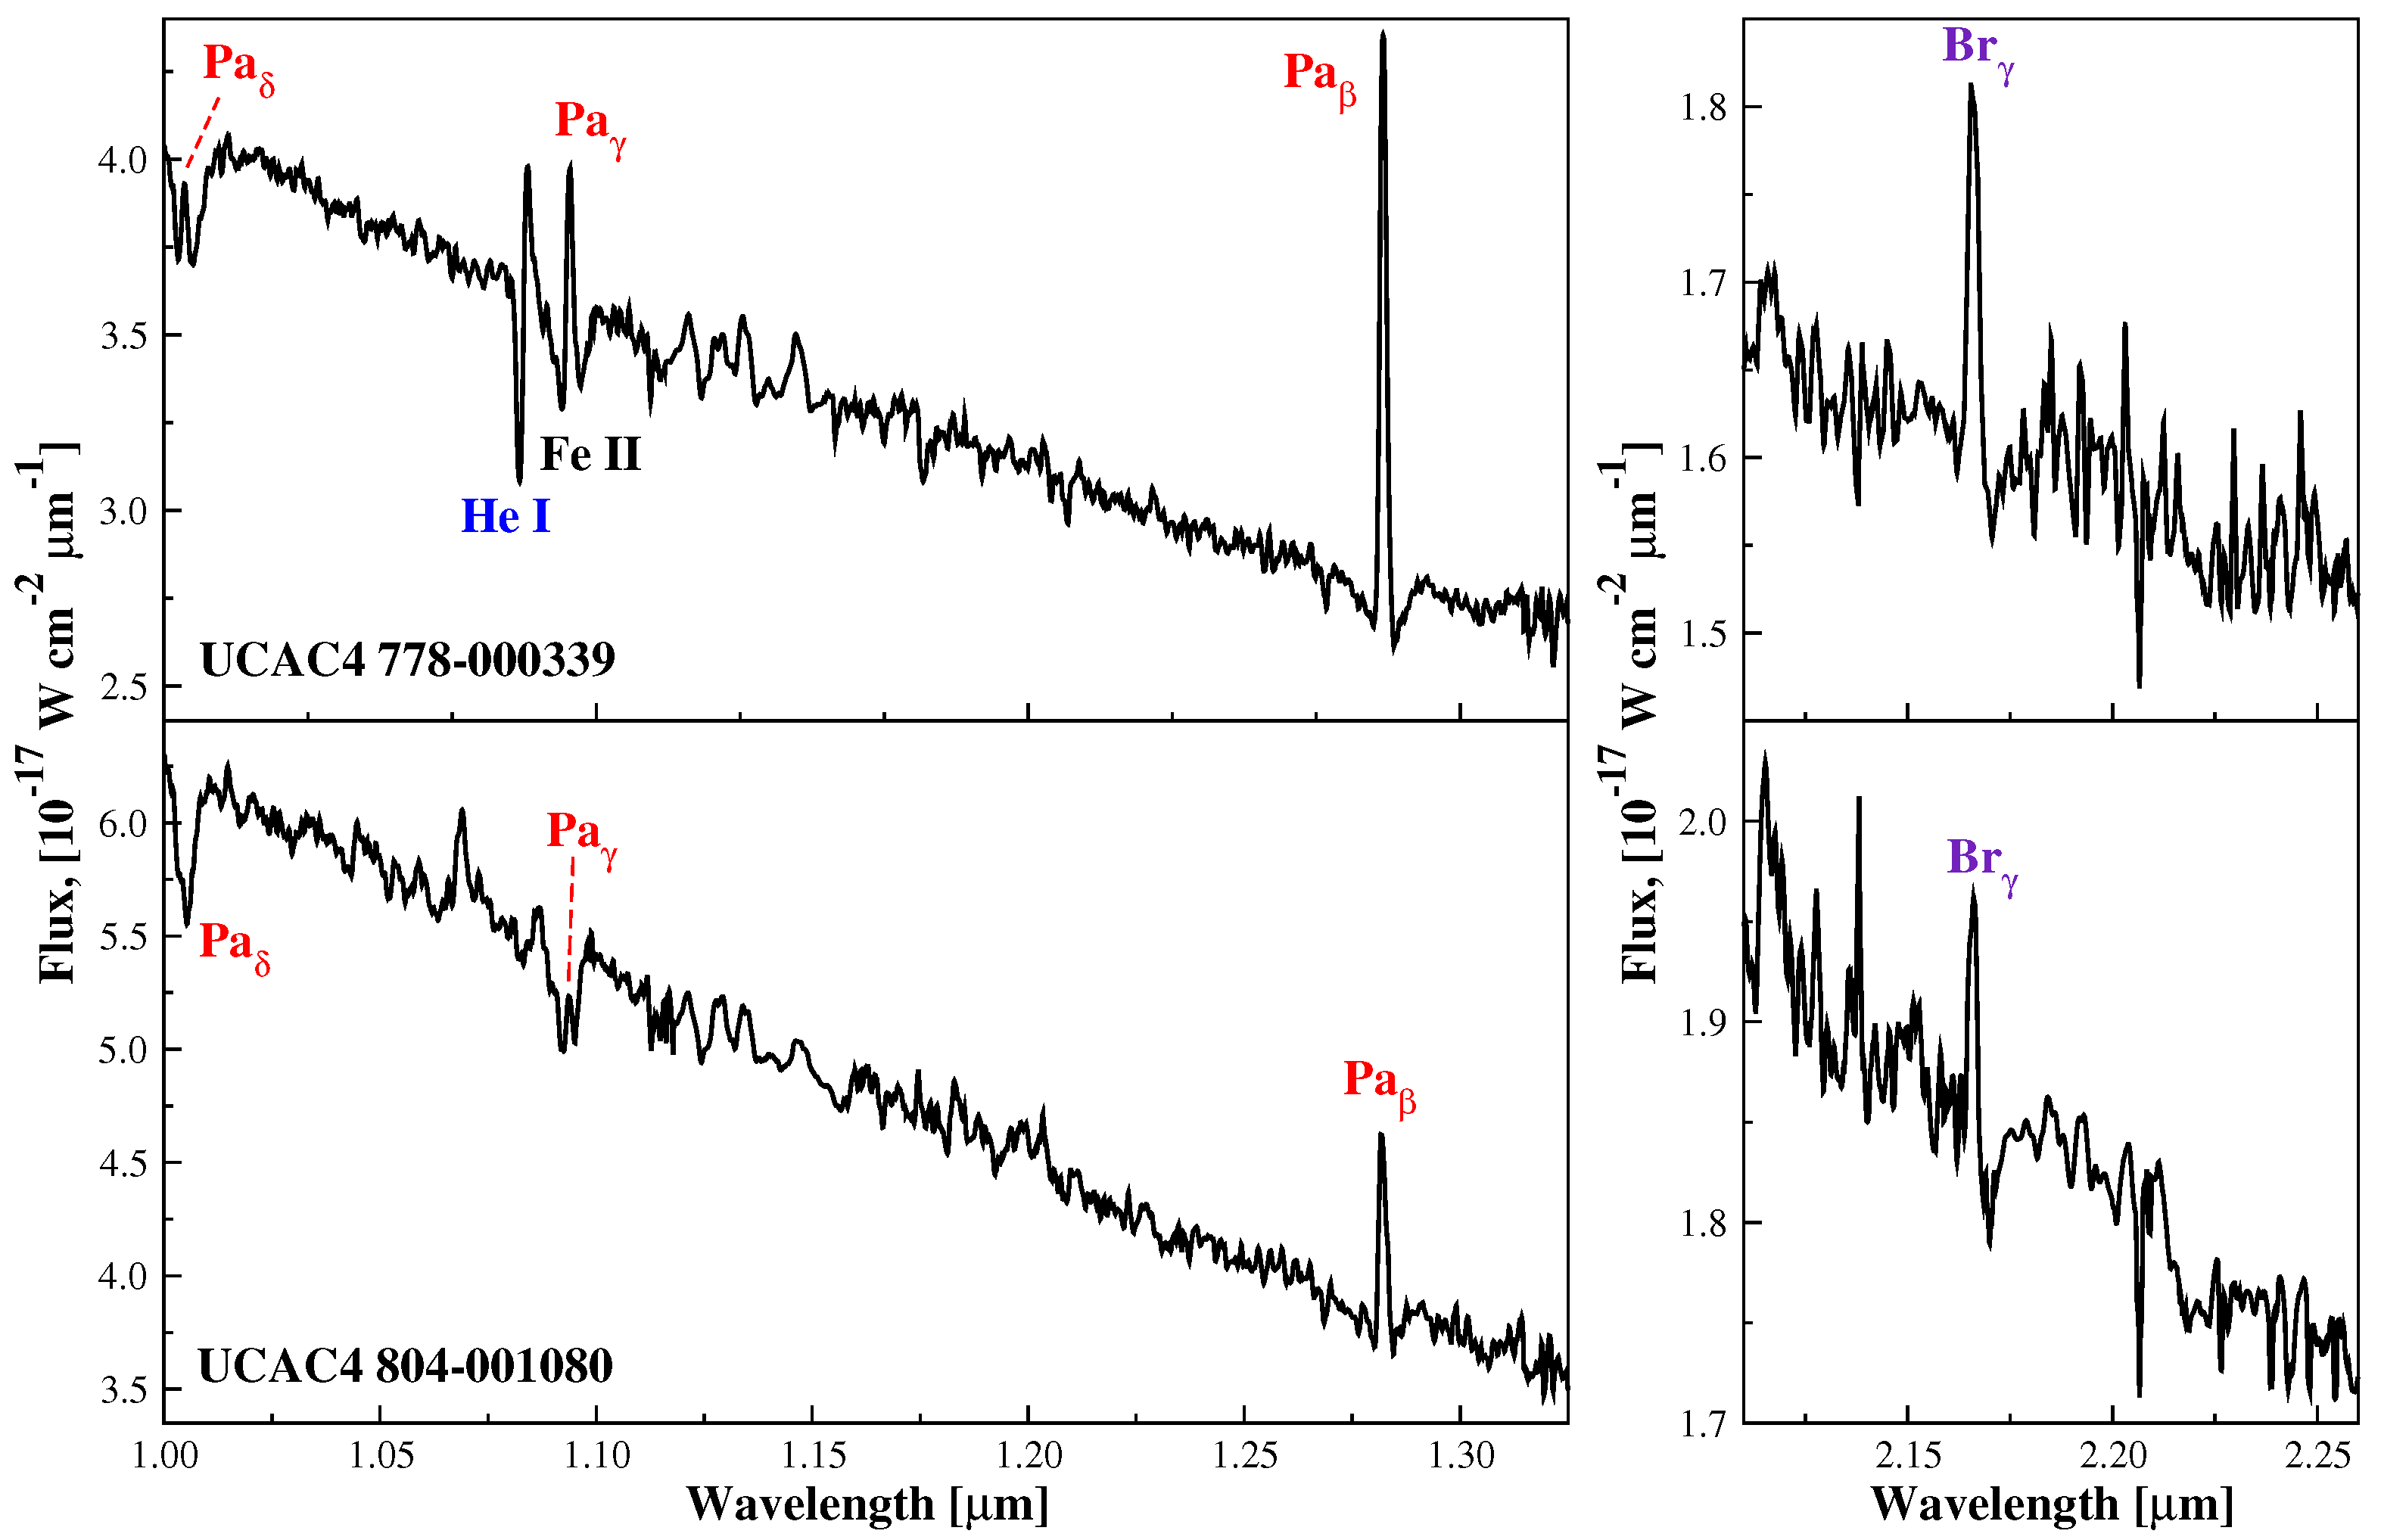
The OAN SPM spectra taken with a lower resolving power (R∼18,000) show weak absorption lines of He I 4471 Å and Mg II 4482 Å better than in the CFHT spectra due to a higher S/N ratio (∼110). The Mg II line is slightly stronger than the He I line, indicating a late-B spectral type. The near-IR spectrum contains several hydrogen lines in emission, such as Paβ at 1.28 μm and Brγ at 2.2 μm, while Paγ at 1.08 μm and Paδ at 1.01 μm are in absorption (see Figure 5).
Combining the spectral type estimate and the averaged color index BV = 0.58 ± 0.11 mag (averaged from our data shown in Table 2 and 27 observations taken from the APASS DR10 survey [42]), one can derive a color excess of E(BV) = 0.7 ± 0.1 mag that is consistent with a theoretical SED for Teff∼12,000 K and the He I/Mg II EW ratio. At the same time, the DIBs seem to be too weak for such a large E(BV). For instance, EW of the DIB at 5780 Å is equal to 0.17 Å that results in E(BV)∼0.4 mag, according to [43]. The interstellar reddening in the object’s direction [44] shows a large jump very close to its Gaia DR3 distance (see Table 3). In particular, E(gr)∼E(BV) = 0.49 mag at D = 0.97 kpc and 0.73 mag at 1.14 kpc. Therefore, part of the total reddening derived in our SED fitting may be of CS origin.
IRAS 00205 + 7023 is classified as a young stellar object on the ASAS SN [39] website. However, a steep flux decrease longward of λ ≥ 10 μm suggests the absence of large amounts of cold dust typical of pre-main-sequence stars. The object’s location on the HR-diagram does not rule out its young age. It could be an isolated Herbig Be star, as no obvious star-forming region has been found near its location.

5. Conclusions

In this study, which represents a part of our long-term search for candidate objects with the B[e] phenomenon, we reported the results of our spectroscopic observations of six objects from a group of several dozen objects selected on the basis of our earlier developed photometric criteria. These criteria described in Section 2 include the following color indices: VK ≥ 2 mag, JH ≥ 0.7 mag, and HK ≥ 0.7 mag, as well as the constraint on the slope of the IR SED: d [log(λ Fλ)] / d [logλ] ≤ −0.5 at wavelengths λ ≥ 10 μm.
The spectra were supplemented with BVRC photometry of the three sample objects taken at TShAO and photometric data from a range of optical and IR sky surveys. Fundamental parameters of the underlying stars were estimated from the SED fitting in the optical range, while the IR excess shapes were used to evaluate the evolutionary state. The optical SED fitting process compared the observed SEDs dereddened with an average interstellar extinction wavelength dependence [16] to a grid of theoretical SEDs from [21] assuming a range of extinctions. The best fits are typically accurate to a few percent, and the Teff values derived this way agree well with the spectroscopic estimates.
Forbidden emission lines, which are one of the defining features of the B[e] phenomenon, were clearly found in one object (UCAC–4 778–000339, see left panel of Figure 2) and may be present in spectra of UCAC–4 725–014138, UCAC–4 685–083239 (IRAS 20402 + 4638), and UCAC–4 804–001080 (IRAS 00205 + 7023). Our spectra of the three latter objects are either too low-resolution or have too low signal-to-noise to be confident in their presence. Also, five of the six objects clearly show an IR-excess typical of the CS dust emission. The only object without an obvious IR-excess is UCAC–4 657–086975 (AS 415), whose SED may not be well-constrained because of the photometric variability. We should note here that forbidden lines may be very weak and hard to detect in objects with small gaseous disks, whose size is limited by such factors as close companions or recent changes in the mass-loss or mass-exchange processes.
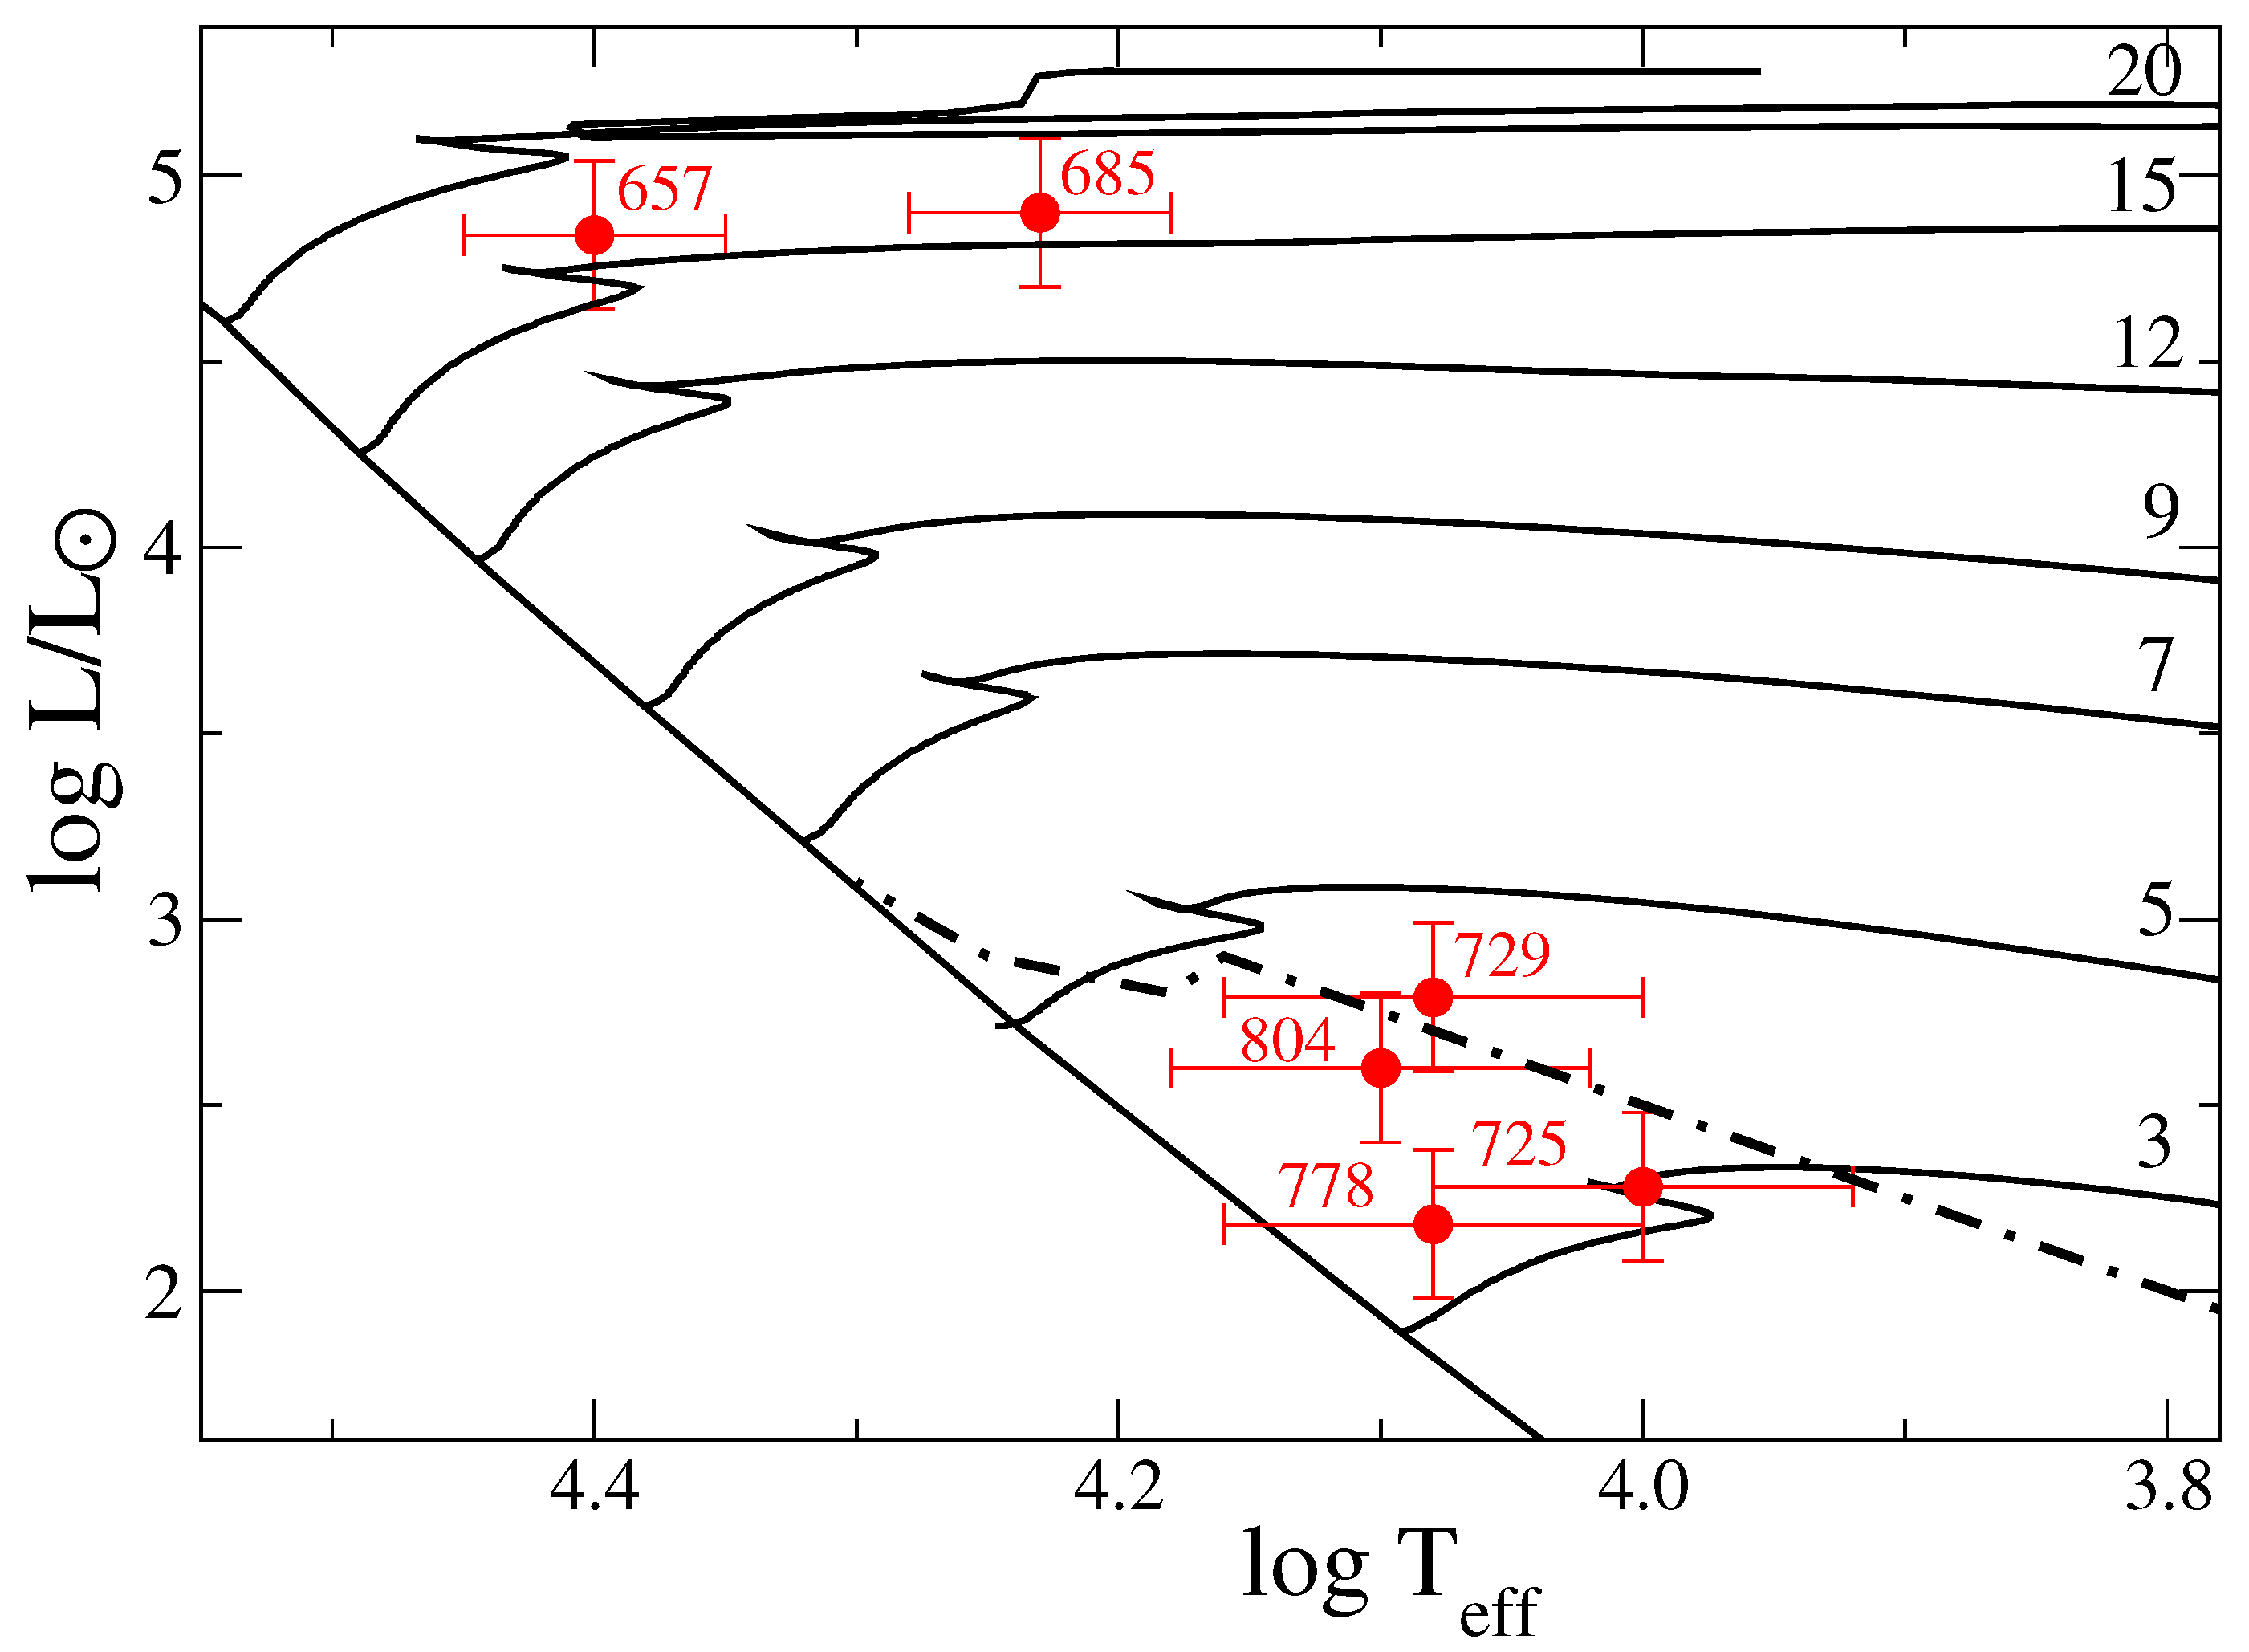
Four of the six objects (VES 683, IRAS 00411 + 5528, 2MASS J01380790 + 5453463, and IRAS 00205 + 7023) were found to have luminosities between 102 L⊙ and 103 L⊙ and Teff between 10,000 K and 13,000 K (see Figure 4). They may be either isolated pre-main-sequence Herbig Be stars or early stages of more evolved objects with the B[e] phenomenon, such as FS CMa type objects. The latter cf. [3] are proposed to be binary systems, which at some evolutionary stage experience mass transfer that leads to the CS gas and dust formation, or binary mergers cf. [45]. However, we found no signs of binarity in five out of the six objects discussed here. Our experience shows that the best method to detect binarity is spectroscopic monitoring (see [11] for a recent review), while we have only taken a few spectra of the discussed objects.
The two remaining objects were found to have much higher luminosities (∼105 L⊙) and higher Teff∼20,000 K. They might be massive stars with masses ∼15 M⊙ (see Figure 4). UCAC–4 685–083239 is most likely a B[e] supergiant, as it shows a definite IR-excess due to CS dust and a strong Hα line emission. If considered a single star, UCAC–4 657–086975 can be an early B-type supergiant that does not exhibit the B[e] phenomenon. However, if the detected optical and near-IR brightness variations are indeed due to the presence of a secondary component, a more detailed study of the system involving a higher-resolution spectroscopy would be needed.
The results we obtained for these objects call for more detailed studies, which should include high-resolution (R ≥ 10,000) spectroscopy and multicolor photometry in order to refine the stellar and CS parameters, search for possible binarity, and clarify the objects’ evolutionary status. The objects are not bright enough for spectroscopy that allows precise RV measurements at telescopes with mirrors smaller than ∼1 m, but this is the best way for solving some remaining problems, such as distinguishing pre-main-sequence from more evolved objects with CS environments.

Author Contributions

Observations, A.S.M., S.V.Z., I.V.R., A.R., A.J., R.J.R., R.C.P., R.B.P., N.M. and C.R.; data reduction, S.V.Z., A.R., I.V.R., R.I.K., R.J.R., R.C.P., R.B.P., N.M. and C.R.; data analysis, A.Z.N., N.S.A. and A.S.M.; software A.Z.N., N.S.A. and A.S.M.; writing—original draft preparation, A.Z.N., N.S.A. and A.S.M.; writing—review and editing, A.Z.N., N.S.A., A.S.M., S.V.Z., C.T.O. and K.M.T. All authors have read and agreed to the published version of the manuscript.

Funding

This work was supported by the Ministry of Science and Higher Education of the Republic of Kazakhstan (Grant No. AP23489575). The work is carried out within the framework of Project No. BR24992759 Development of the concept for the first Kazakhstani orbital cislunar telescope—Phase I, financed by the Ministry of Science and Higher Education of the Republic of Kazakhstan. S.Z. acknowledges PAPIIT grants IN102120 and IN119323.

Data Availability Statement

The spectral and photometric are available on request via email at a_mirosh@uncg.edu; accessed on 5 June 2025.

Acknowledgments

We thank the anonymous reviewers for comments that allowed a substantial improvement of the original version of the paper. This research has made use of the SIMBAD database, operated at CDS, Strasbourg, France; SAO/NASA ADS, ASAS, and Gaia data products. This paper is partly based on observations obtained at the 2.1 m telescope of the Observatorio Astronómico Nacional San Pedro Martir (Baja California, México), the 3 m telescope of the Lick Observatory (California, USA), the 1.5 m telescope of the Bologna Observatory (Mt. Orzale, Italy), the 2 m Chandra Himalayan Telescope (Hanle, India), and a 1 m of the Tien-Shan Astronomical Observatory (Almaty, Kazakhstan). This paper includes data collected by the TESS mission. Funding for the TESS mission is provided by the NASA’s Science Mission Directorate.

Conflicts of Interest

The authors declare no conflicts of interest.

Abbreviations

The following abbreviations are used in this manuscript: RV—radial velocity, R—spectral resolving power, SED—spectral energy distribution, Teff—star’s effective temperature, CS—circumstellar, TShAO—Tien-Shan Astronomical Observatory.

Notes

1
2
3

References

  1. Allen, D.A.; Swings, J.P. The spectra of peculiar Be star with infrared excesses. Astron. Astrophys. 1976, 47, 293–302. [Google Scholar]
  2. Lamers, H.J.G.L.M.; Zickgraf, F.J.; de Winter, D.; Houziaux, L.; Zorec, J. An improved classification of B[e]-type stars. Astron. Astrophys. 1998, 340, 117–128. [Google Scholar]
  3. Miroshnichenko, A.S. Toward Understanding the B[e] Phenomenon. I. Definition of the Galactic FS CMa Stars. Astrophys. J. 2007, 667, 497–504. [Google Scholar] [CrossRef]
  4. Miroshnichenko, A.S.; Danford, S.; Zharikov, S.V.; Klochkova, V.G.; Chentsov, E.L.; Vanbeveren, D.; Zakhozhay, O.V.; Manset, N.; Pogodin, M.A.; Omarov, C.T.; et al. Properties of Galactic B[e] Supergiants. V. 3 Pup-Constraining the Orbital Parameters and Modeling the Circumstellar Environments. Astrophys. J. 2020, 897, 48. [Google Scholar] [CrossRef]
  5. Clarke, A.J.; Oudmaijer, R.D.; Lumsden, S.L. Tycho-2 stars with infrared excess in the MSX Point Source Catalogue. Mon. Not. R. Astron. Soc. 2005, 363, 1111–1124. [Google Scholar] [CrossRef]
  6. Miroshnichenko, A.S.; Manset, N.; Kusakin, A.V.; Chentsov, E.L.; Klochkova, V.G.; Zharikov, S.V.; Gray, R.O.; Grankin, K.N.; Gandet, T.L.; Bjorkman, K.S.; et al. Toward Understanding the B[e] Phenomenon. II. New Galactic FS CMa Stars. Astrophys. J. 2007, 671, 828–841. [Google Scholar] [CrossRef]
  7. Kuratova, A.K.; Miroshnichenko, A.S.; Kuratov, K.S.; Naurzbayeva, A.Z.; Alimgazinova, N.S.; Manapbayeva, A.B. A Search for New Objects with the B[e] Phenomenon. In The B[e] Phenomenon: Forty Years of Studies; Astronomical Society of the Pacific Conference Series; Miroshnichenko, A., Zharikov, S., Korčáková, D., Wolf, M., Eds.; The Astronomical Society of the Pacific: Francisco, CA, USA, 2017; Volume 508, p. 229. [Google Scholar]
  8. Zacharias, N.; Monet, D.G.; Levine, S.E.; Urban, S.E.; Gaume, R.; Wycoff, G.L. The Naval Observatory Merged Astrometric Dataset (NOMAD). Am. Astron. Soc. Meet. Abstr. 2004, 205, 15–48. [Google Scholar]
  9. Zacharias, N.; Finch, C.T.; Girard, T.M.; Henden, A.; Bartlett, J.L.; Monet, D.G.; Zacharias, M.I. The Fourth US Naval Observatory CCD Astrograph Catalog (UCAC4). Astron. J. 2013, 145, 44. [Google Scholar] [CrossRef]
  10. Miroshnichenko, A.S.; Polcaro, V.F.; Rossi, C.; Zharikov, S.V.; Rudy, R.J.; Kusakin, A.V.; Kuratov, K.S.; Naurzbayeva, A.Z.; Alimgazinova, N.S.; Manapbayeva, A.B.; et al. Observations of Newly Found Objects with the B[e] Phenomenon. In The B[e] Phenomenon: Forty Years of Studies; Astronomical Society of the Pacific Conference Series; Miroshnichenko, A., Zharikov, S., Korčáková, D., Wolf, M., Eds.; The Astronomical Society of the Pacific: Francisco, CA, USA, 2017; Volume 508, p. 387. [Google Scholar]
  11. Miroshnichenko, A.S.; Zharikov, S.V.; Manset, N.; Khokhlov, S.A.; Nodyarov, A.S.; Klochkova, V.G.; Danford, S.; Kuratova, A.K.; Mennickent, R.; Chojnowski, S.D.; et al. Recent Progress in Finding Binary Systems with the B[e] Phenomenon. Galaxies 2023, 11, 36. [Google Scholar] [CrossRef]
  12. Helou, G.; Walker, D.W. Vizier Online Data Catalog: IRAS Catalog of Point Sources, Version 2.0 (1986). In VizieR Online Data Catalog; Infrared Processing & Analysis Center at California Institute of Technology: Pasadena, CA, USA, 1988; p. II/125. [Google Scholar]
  13. Cutri, R.M.; Wright, E.L.; Conrow, T.; Fowler, J.W.; Eisenhardt, P.R.M.; Grillmair, C.; Kirkpatrick, J.D.; Masci, F.; McCallon, H.L.; Wheelock, S.L.; et al. Explanatory Supplement to the AllWISE Data Release Products; Infrared Processing & Analysis Center at California Institute of Technology: Pasadena, CA, USA, 2013. [Google Scholar]
  14. Egan, M.P.; Price, S.D.; Kraemer, K.E.; Mizuno, D.R.; Carey, S.J.; Wright, C.O.; Engelke, C.W.; Cohen, M.; Gugliotti, M.G. VizieR Online Data Catalog: MSX6C Infrared Point Source Catalog. The Midcourse Space Experiment Point Source Catalog Version 2.3 (October 2003); Infrared Processing & Analysis Center at California Institute of Technology: Pasadena, CA, USA, 2003. [Google Scholar]
  15. Ishihara, D.; Onaka, T.; Kataza, H.; Salama, A.; Alfageme, C.; Cassatella, A.; Cox, N.; García-Lario, P.; Stephenson, C.; Cohen, M.; et al. The AKARI/IRC mid-infrared all-sky survey. Astron. Astrophys. 2010, 514, A1. [Google Scholar] [CrossRef]
  16. Savage, B.D.; Mathis, J.S. Observed properties of interstellar dust. Annu. Rev. Astron. Astrophys. 1979, 17, 73–111. [Google Scholar] [CrossRef]
  17. Sriram, S.; Kumar, A.; Surya, A.; Sivarani, T.; Giridhar, S.; Kathiravan, S.; Anand, M.N.; Jones, D.; Grobler, D.; Jakobsson, R.; et al. Hanle echelle spectrograph: Design and performance. In Ground-Based and Airborne Instrumentation for Astronomy VII; Society of Photo-Optical Instrumentation Engineers (SPIE) Conference Series; Evans, C.J., Simard, L., Takami, H., Eds.; Society of Photo-Optical Instrumentation Engineers: Bellingham, WA, USA, 2018; Volume 10702, p. 107026K. [Google Scholar] [CrossRef]
  18. Contarini, G.; Gratton, R. The Instrumental Profile and Straylight in the REOSC Ekar Echelle Spectrograph. Eur. South. Obs. Conf. Workshop Proc. 1992, 42, 737. [Google Scholar]
  19. Rudy, R.J.; Puetter, R.C.; Mazuk, S. Paschen Lines and the Reddening of the Radio Galaxy 3C 109. Astron. J. 1999, 118, 666–669. [Google Scholar] [CrossRef]
  20. Manset, N.; Donati, J.F. ESPaDOnS: An Exhelle Spectro-Polarimetric Device for the Observation of Stars; Society of Photo-Optical Instrumentation Engineers (SPIE) Conference Series; Fineschi, S., Ed.; Society of Photo-Optical Instrumentation Engineers: Bellingham, WA, USA, 2003; Volume 4843, pp. 425–436. [Google Scholar] [CrossRef]
  21. Castelli, F.; Kurucz, R.L. New Grids of ATLAS9 Model Atmospheres. In Modelling of Stellar Atmospheres; IAU Symposium; Piskunov, N., Weiss, W.W., Gray, D.F., Eds.; Society of Photo-Optical Instrumentation Engineers: Bellingham, WA, USA, 2003; Volume 210, p. A20. [Google Scholar] [CrossRef]
  22. MacConnell, D.J. A Study of the Cepheus IV Association. Astrophys. J. Suppl. 1968, 16, 275. [Google Scholar] [CrossRef]
  23. Coyne, G.V.; Lee, T.A.; de Graeve, E.; Wisniewski, W.; Corbally, C.; Otten, L.B.; MacConnell, D.J. VizieR Online Data Catalog: Vatican Emission-Line Stars (Coyne+ 1974–1983); Varican Observatory: Tucson, AZ, USA, 2008. [Google Scholar]
  24. Kohoutek, L.; Wehmeyer, R. Catalogue of H-alpha emission stars in the Northern Milky Way. Astron. Astrophys. Suppl. 1999, 134, 255–256. [Google Scholar] [CrossRef]
  25. Perryman, M.A.C.; Lindegren, L.; Kovalevsky, J.; Hoeg, E.; Bastian, U.; Bernacca, P.L.; Crézé, M.; Donati, F.; Grenon, M.; Grewing, M.; et al. The HIPPARCOS Catalogue. Astron. Astrophys. 1997, 323, L49–L52. [Google Scholar]
  26. Kerton, C.R.; Brunt, C.M. The association of IRAS sources and 12CO emission in the outer Galaxy. Astron. Astrophys. 2003, 399, 1083–1099. [Google Scholar] [CrossRef]
  27. Zverko, J.; Iliev, I.; Romanyuk, I.; Barzova, I.; Kudryavtsev, D.; Stateva, I.; Semenko, E. Stars with discrepant v sin i as derived from Ca II λ 3933 Å and Mg II λ 4481 Å lines. III. Stars with v sin i (λ 3933 Å) < v sin i (λ 4481 Å). Astrophys. Bull. 2013, 68, 57–77. [Google Scholar] [CrossRef]
  28. Abt, H.A.; Levato, H.; Grosso, M. Rotational Velocities of B Stars. Astrophys. J. 2002, 573, 359–365. [Google Scholar] [CrossRef]
  29. Carciofi, A.C.; Miroshnichenko, A.S.; Bjorkman, J.E. Toward Understanding the B[e] Phenomenon. IV. Modeling of IRAS 00470 + 6429. Astrophys. J. 2010, 721, 1079–1089. [Google Scholar] [CrossRef]
  30. Lee, H.T.; Lim, J. On the Formation of Perseus OB1 at High Galactic Latitudes. Astrophys. J. 2008, 679, 1352–1363. [Google Scholar] [CrossRef]
  31. de Burgos, A.; Simon-Díaz, S.; Lennon, D.J.; Dorda, R.; Negueruela, I.; Urbaneja, M.A.; Patrick, L.R.; Herrero, A. High-resolution spectroscopic study of massive blue and red supergiants in Perseus OB1. I. Definition of the sample, membership, and kinematics. Astron. Astrophys. 2020, 643, A116. [Google Scholar] [CrossRef]
  32. Bailer-Jones, C.A.L.; Rybizki, J.; Fouesneau, M.; Demleitner, M.; Andrae, R. Estimating Distances from Parallaxes. V. Geometric and Photogeometric Distances to 1.47 Billion Stars in Gaia Early Data Release 3. Astrophys. J. 2021, 161, 147. [Google Scholar] [CrossRef]
  33. Welin, G. Hα-emission stars in and near NGC 7000. Astron. Astrophys. Suppl. 1973, 9, 183. [Google Scholar]
  34. Merrill, P.W.; Burwell, C.G. Additional Stars whose Spectra have a Bright H α Line. Astrophys. J. 1950, 112, 72. [Google Scholar] [CrossRef]
  35. Knödlseder, J. Cygnus OB2—A young globular cluster in the Milky Way. Astron. Astrophys. 2000, 360, 539–548. [Google Scholar] [CrossRef]
  36. Comerón, F.; Pasquali, A.; Figueras, F.; Torra, J. The outskirts of Cygnus OB2. Astron. Astrophys. 2008, 486, 453–466. [Google Scholar] [CrossRef]
  37. Miroshnichenko, A.S. MWC 314: A high-luminosity peculiar Be star. Astron. Astrophys. 1996, 312, 941–949. [Google Scholar]
  38. Heinze, A.N.; Tonry, J.L.; Denneau, L.; Flewelling, H.; Stalder, B.; Rest, A.; Smith, K.W.; Smartt, S.J.; Weiland, H. A First Catalog of Variable Stars Measured by the Asteroid Terrestrial-impact Last Alert System (ATLAS). Astron. J. 2018, 156, 241. [Google Scholar] [CrossRef]
  39. Kochanek, C.S.; Shappee, B.J.; Stanek, K.Z.; Holoien, T.W.S.; Thompson, T.A.; Prieto, J.L.; Dong, S.; Shields, J.V.; Will, D.; Britt, C.; et al. The All-Sky Automated Survey for Supernovae (ASAS-SN) Light Curve Server v1.0. Publ. Astron. Soc. Pac. 2017, 129, 104502. [Google Scholar] [CrossRef]
  40. Ekström, S.; Georgy, C.; Eggenberger, P.; Meynet, G.; Mowlavi, N.; Wyttenbach, A.; Granada, A.; Decressin, T.; Hirschi, R.; Frischknecht, U.; et al. Grids of stellar models with rotation. I. Models from 0.8 to 120 M at solar metallicity (Z = 0.014). Astron. Astrophys. 2012, 537, A146. [Google Scholar] [CrossRef]
  41. Tognelli, E.; Prada Moroni, P.G.; Degl’Innocenti, S. The Pisa pre-main sequence tracks and isochrones. A database covering a wide range of Z, Y, mass, and age values. Astron. Astrophys. 2011, 533, A109. [Google Scholar] [CrossRef]
  42. Henden, A.A. APASS DR10 Has Arrived! (Abstract). J. Am. Assoc. Var. Star Obs. 2019, 47, 130. [Google Scholar]
  43. Herbig, G.H. The Diffuse Interstellar Bands. IX. Constraints on the Identification. Astrophys. J. 1993, 407, 142. [Google Scholar] [CrossRef]
  44. Green, G.M.; Schlafly, E.; Zucker, C.; Speagle, J.S.; Finkbeiner, D. A 3D Dust Map Based on Gaia, Pan-STARRS 1, and 2MASS. Astrophys. J. 2019, 887, 93. [Google Scholar] [CrossRef]
  45. Moranchel-Basurto, A.; Korčáková, D.; Chametla, R.O. 2.5D magnetohydrodynamic models of circumstellar discs around FS CMa post-mergers—I. Non-stationary accretion stage. Mon. Not. R. Astron. Soc. 2023, 523, 5554–5564. [Google Scholar] [CrossRef]
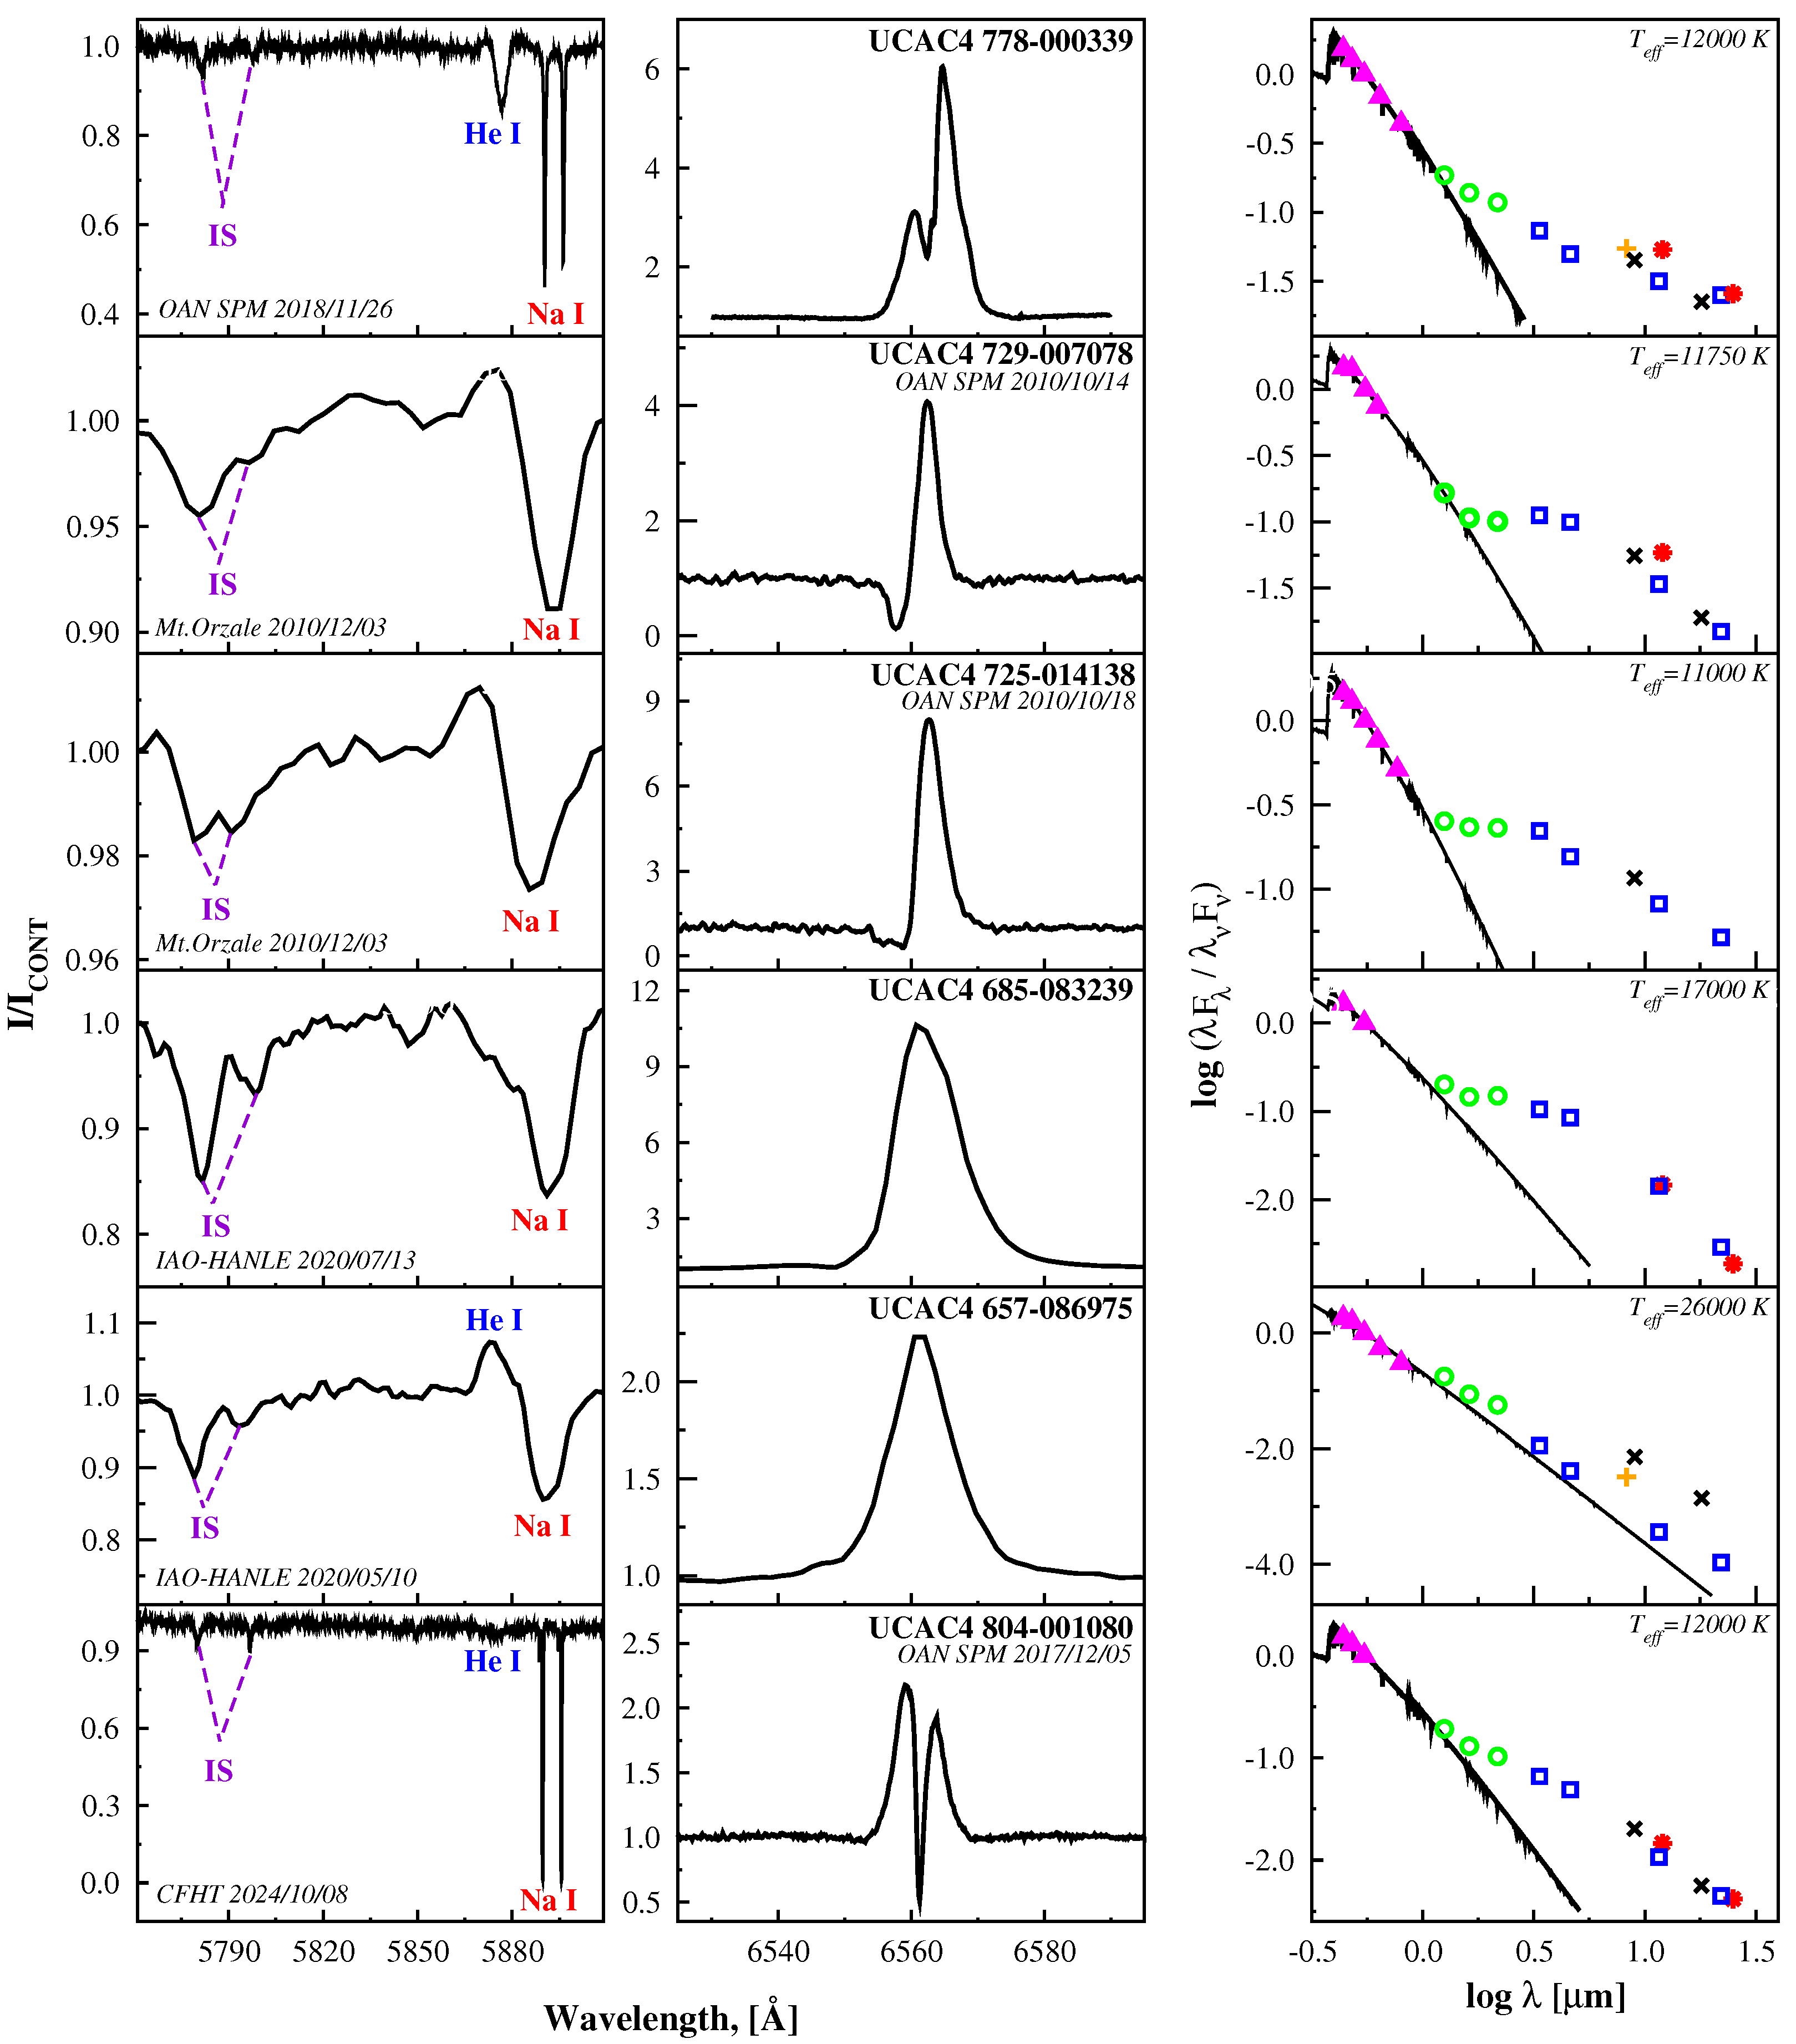
Figure 1. Objects’ properties. Left column shows a spectral region with the diffuse interstellar (marked IS) features at 5780 and 5797 Å, He I 5875 Å line, and interstellar Na I D–lines (5889 and 5895 Å); central column shows Hα line profiles; right column shows SEDs corrected for total extinction. Symbols: triangles—optical photometry, green circles—2MASS JHK data, blue squares—WISE data, orange pluses—MSX data, black crosses—AKARI 9-μm data, red asterisks—IRAS 12 and 25-μm data. Solid lines show the best theoretical fits for the objects’ intrinsic SEDs with the model Teff shown in each panel.
Galaxies 13 00067 g001
Figure 2. Parts of the OAN SPM spectrum of UCAC 4 778–000339 taken on 25 November 2018. (Left panel): Forbidden oxygen 6300 Å and 6363 Å lines and the Si II 6347 Å absorption line. (Right panel): He I 4471 Å and Mg II 4482 Å absorption lines. Part of the spectrum of the B7 III star HR 4967 is shown by the red line for comparison (see Section 4.1 for a description). Intensity is normalized to the local continuum. The wavelength scale is shown in Angströms.
Galaxies 13 00067 g002
Figure 3. Light curves of UCAC–4 657–086975 (AS 415). (Left panel): Top part shows the V-band (blue symbols) and g–band (red symbols) light curve, while the bottom part shows the W1-band (λ3.5 μm) light curve from the NEOWISE mission. The W1-band data are shown as monthly averages. (Right panel): TESS light curve taken in sectors 14 and 15 (18 July 2019–9 October 2019) with a 30–min cadence. The data are normalized to the local maximum brightness and folded with a period of 8.27 days.
Galaxies 13 00067 g003
Figure 4. HR diagram for the studied objects. The objects are marked with the first three digits of their UCAC–4 ID. Conservative uncertainties of 10% on Teff and 20% on the luminosities are assigned to the objects’ parameters. Theoretical evolutionary tracks for rotating single stars from [40] are shown as black solid lines along with the zero-age main-sequence. A theoretical birth line for pre-main-sequence stars that corresponds to a 1 Myr isochrone from [41] is shown by a dash-dotted line. Initial masses in solar units are shown near each corresponding track. The position of UCAC–4 657–086975 is given under the assumption that it is a single star.
Galaxies 13 00067 g004
Figure 5. Parts of the near-IR spectra taken at the Lick Observatory. Major spectral lines are marked. Intensity is shown in absolute units derived through calibration by standard stars. The wavelength scale is shown in microns.
Galaxies 13 00067 g005
Table 3. Parameters of the studied objects.
UCAC–4lbVKE(BV)TefflogLEW HαSlopeDist.
deg deg mag mag mag K L⊙ Å pc
778–000339118.3+3.111.48.440.712,0002.18−29.6−0.7705 (6)
729–007078121.9−7.112.69.520.811,7502.79−9.9−1.12012 (42)
725–014138129.7−7.413.010.370.711,0002.28−25.4−0.82346 (99)
685–08323985.6+2.914.77.532.117,0004.92−110.3−1.96490 (525)
657–08697579.2+2.113.77.082.326,0004.84−17.51778 (62)
804–001080120.6+7.911.28.260.812,0002.60−9.2−1.5971 (12)
Column information: (1)—ID from the UCAC–4 catalog, (2)—galactic longitude, (3)—galactic latitude, (4)—V-band magnitude, (5)—K–band magnitude from 2MASS, (6) —color-excess E(BV) derived from the SED fitting, (7)—Teff estimates described in the text (see Section 4), (8)—logarithm of the luminosity in solar units, (9)—equivalent width of the Hα emission line shown in Angströms, (10)—the IR SED slope at wavelengths λ ≥ 10 μm defined as d [log(λ Fλ)]/d [logλ], (11)—distance from Gaia DR3 in parsecs with uncertainties shown in brackets [32].
Disclaimer/Publisher’s Note: The statements, opinions and data contained in all publications are solely those of the individual author(s) and contributor(s) and not of MDPI and/or the editor(s). MDPI and/or the editor(s) disclaim responsibility for any injury to people or property resulting from any ideas, methods, instructions or products referred to in the content.