Abstract
Dissipation processes derived from the kinetic theory of gases (shear viscosity and heat conduction) are employed to examine the solar wind that interacts with planetary ionospheres. The purpose of this study is to estimate the mean free path of wave-particle interactions that produce a continuum response in the plasma behavior. Wave-particle interactions are necessary to support the fluid dynamic interpretation that accounts for the interpretation of various features measured in a solar wind–planet ionosphere region; namely, (i) the transport of solar wind momentum to an upper ionosphere in the presence of a velocity shear, and (ii) plasma heating produced by momentum transport. From measurements conducted in the solar wind interaction with the Venus ionosphere, it is possible to estimate that in general terms, the mean free path of wave-particle interactions reaches λH ≥ 1000 km values that are comparable to the gyration radius of the solar wind particles in their Larmor motion within the local solar wind magnetic field. Similar values are also applicable to conditions measured by the Mars ionosphere and in cometary plasma wakes. Considerations are made in regard to the stochastic trajectories of the plasma particles that have been implied from the measurements made in planetary environments. At the same time, it is as possible that the same phenomenon is applicable to the interaction of stellar winds with the ionosphere of exoplanets, and also in regions where streaming ionized gases reach objects that are subject to rotational motion in other astrophysical problems (galactic flow–plasma interactions, black holes, etc.).
1. Introduction
A common view in studies of the motion of charged planetary particles assimilated by the solar wind that interacts with planetary ionospheres is that they execute gyration trajectories within the magnetic field that the solar wind brings along, and that piles up around the planets’ dayside ionosphere. The Larmor radius of the planetary particles can be comparable to a planetary radius (Venus–Mars), and thus they may be subject to laminar motion in large distances along the planetary wakes. Since particle–particle interactions under such conditions are practically non-existent in the solar wind–planet interaction region, it is necessary to consider that other processes should be effective to produce the measured stochastic motion of the plasma particles. Such conditions arise from the frequent variations in the magnitude and direction of the magnetic field that were first reported from the Mariner 5 data as the spacecraft flew by Venus [1], and also from the Venus Express measurements in the inner regions of its flank ionosheath [2]. The Mariner 5 spacecraft trajectory is indicated in the lower panel of Figure 1 using cylindrical coordinates to represent its azimuthal and latitudinal position with respect to the sun coordinates.
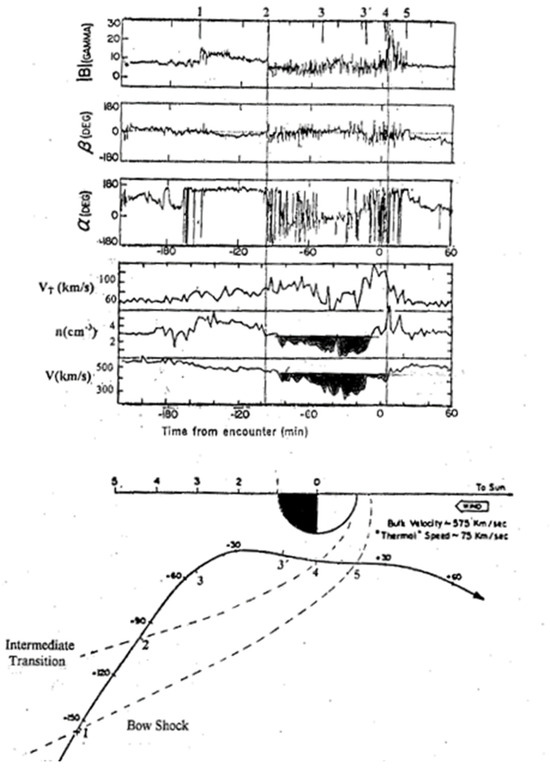
Figure 1.
(Lower panel) Trajectory of the Mariner 5 spacecraft projected in cylindrical coordinates in its flyby past Venus. Labels 1 to 5 along the trajectory mark important events in the plasma properties (a bow shock is identified at features 1 and 5), and the intermediate plasma transition occurs at features 2 and 4). (Upper panel) Magnetic field intensity and its latitudinal and azimuthal orientation, together with the plasma properties (thermal speed, density, and bulk speed) measured around Venus [1].
The magnetic field and the plasma data measured by Venus are presented in the upper panel of Figure 1 to show the frequent and repeated changes of the magnetic field intensity and in its orientation. The large fluctuations in the latter coordinates reveal strong and frequent deviations of the magnetic field direction. At the same time, the same panel of that figure also indicates a persistent change in the value of the density and the bulk speed of the solar wind at and past the feature labeled 2 in their profiles (at −100 min before closest approach). The latter changes are stressed by the shaded areas in that region and are peculiar since they display significantly smaller values of both variables throughout the inner regions of the Venus ionosheath and that lead to a local loss of the solar wind momentum in that region.
Calculations have shown that the “missing” momentum flux of the solar wind is comparable to the momentum flux of the ionospheric flow measured by the terminator in the Venus upper ionosphere [3,4]. Such a result supports the existence of an efficient transport of momentum between both plasmas with a related increase in the ion thermal speed up to VT ~ 100 km/s values, as noted in the temperature profile in the Mariner 5 data in Figure 1 beginning at label 2 in the inner ionosheath. Evidence of plasma heating in that region was later more extensively reported from measurements conducted with the Venera spacecraft [5,6,7]. As shown in Figure 2, enhanced temperatures were measured together with smaller flow speeds. Similar variations were also reported from the VEX plasma data with higher temperatures for the planetary O+ fluxes and the electron component measured by the flanks of the Venus ionosheath ([8] see Figure 2 and Figure 3 by 01:50 UT).
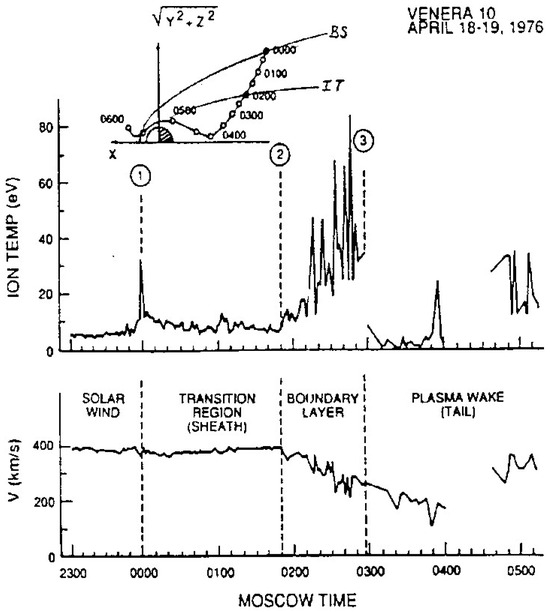
Figure 2.
Ion speed and temperature measured along the orbit of Venera 10 on 19 April 1976. The Venera orbit in cylindrical coordinates is shown at the top. The temperature burst at position 1 was recorded during a flank crossing of a bow shock. A boundary layer is apparent by the increase in temperature and decrease in speed, and is initiated by the intermediate transition at the position labeled 2. A latter discontinuity in the boundary layer temperature profile corresponds to the boundary of the magneto-tail (from [6]).
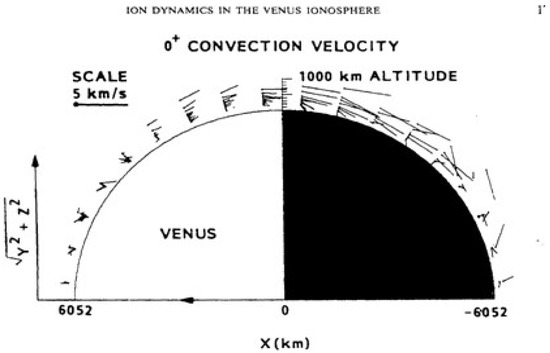
Figure 3.
Vector velocity speeds of the trans-terminator flow in the Venus upper ionosphere measured with instruments onboard the Pioneer Venus Orbiter spacecraft [9].
A more complex feature of the solar wind interaction with the Venus ionosphere is related to measurements of distinct ionospheric holes in the nightside hemisphere in the electron density profiles, and that shows narrow deep decreases to low density values [10]. Such features have been interpreted as reflecting conditions that can be accounted for in terms of fluid dynamic processes. In particular, those structures reveal the continued erosion of ionospheric particles, and that has been interpreted as resulting from ionospheric channels or ducts produced at the magnetic polar regions of the Venus ionosphere and that extend downstream along the Venus wake [4,11]. The dynamics of the plasma configuration within those channels have been examined and reveal features that, as will be illustrated below in Figure 7, have a corkscrew shape formed by vortex structures [12], and of which the width decreases with the downstream distance along the wake [13]. This variation is derived from the expansion of the solar wind into the Venus wake from the magnetic polar regions of the ionosphere and produces a gradual decrease in the width of the region where the ionospheric plasma is being dragged by the solar wind. As a result, the width of the vortex structures is also being reduced, leading to the shape indicated in Figure 7, which will be examined in regard to the acceleration of planetary ions along the wake.
The importance of fluid dynamics to validate the information provided by measurements should be justified by a procedure that relies on mathematical aspects, applicable to the discussion. Thus, we examine a mechanism that is applied to derive the mean free path values of wave-particle interactions that are suitable to account for the observations.
2. Plasma Data Calculations
In the fluid dynamic description of the features measured in the solar wind interaction with the Venus upper ionosphere, it is necessary to identify the physical conditions that allow for such an interpretation. In particular, it is necessary to account for the correlation that exists between fluid dynamic concepts and the physical origin of the processes that produce them. This is the case for the manner in which the solar wind is modified through wave-particle interactions with the Venus upper ionosphere. As a whole, such interactions are derived from the statistical transport of fluid dynamic properties through dissipation processes in a collective medium (shear viscosity and heat conduction). In this sense Liepmann and Roshko [14] (Section 14.9 in p. 372) examined the connection between both phenomena using the kinetic transport of gases and concluded that, independent of the active processes that produce dissipation, their effect is related to the corresponding mean free path λH in those processes. Accordingly, they first defined the variables:
(obtained from the momentum and the energy equations of a fluid) where ﬠ is the kinematic viscosity coefficient and k/ρcp the corresponding transport parameter for heat diffusion. Both relations can be derived by considering that the media involved in a mixing process (namely the solar wind and the Venus upper ionosphere) only experience small deviations away from equilibrium, and thus we will assume that there are linear relations between stress and the rate of strain for viscous dissipation, and also between the heat flow and the temperature gradient in the case of thermal dissipation. In both cases, the purpose of the approach is to obtain the gas dynamic expressions for the shear viscosity μ = ﬠρ and for the heat conductivity k when the flow is subject to wave-particle interactions. Under such conditions, both quantities in Equation (1a,b) are related to the mean free path λH through:
where t*1 and t*2 are the relaxation times corresponding to the momentum and to the energy of the flow that are modified by wave-particle interactions (the method can be applied to any property of the medium that is altered under such conditions). It should be noted that these relations lead to Equation (1a,b), since the transport coefficients μ and k are connected through the time factors t*1 and t*2 with the thermal speed VT (i.e., VT = λH/t*), providing a relation that can be employed to derive the mean free path λH value.
ﬠ= VT·λH is for viscous dissipation
VT·λH = α·k/ρcp is for thermal dissipation
μ/ρ = VT·λH = VT2·t*1
α k/ρcp = VT·λH = VT2·t*2
Within this framework, we can take VT ~ 60 km/s for the thermal speed of the solar wind requested in both equations, and that is available in the upper panel of Figure 1. Separately, we can also estimate values for the kinematic viscosity coefficient ﬠ = μ/ρ that is employed in Equation (1a). A procedure to carry out this effort is to measure the magnitude of the viscous force in the momentum equation of the plasma as the solar wind streams and interacts with the Venus ionosphere. To this effect, we first calculate in the momentum equation the relative value of the viscous force with respect to that of the magnetic field J × B force that applies to the planetary ions that are carried along by the solar wind [15]:
ρ(U·∇)·U = (B·∇)·B/μe − ∇ (B2/2μe) + μ∇2·U
The first two terms on the right side indicate the magnetic tension and the magnetic pressure derived from the J × B forces, thus providing their total dimensional value; the third term refers to viscous forces [16]. In a dimensionless form, this equation leads to:
where B0 = 10 nT is the reference value of the magnetic field in the freestream solar wind derived from the Mariner 5 measurements shown in the upper panel of Figure 1, L = 6000 km is the Venus radius, and U0 = 500 km/s is the freestream solar wind speed indicated in the upper panel of the same figure. In turn, ρ0 = 1.6 × 10⁻²⁴ gr cm−3 derives from the free stream density value (nsw ~ 3 cm−3) indicated in the same figure. The first term here indicates the combined dimensional value of the magnetic field pressure component together with that of the magnetic field tension. This equation can in turn be reduced to
where VA = B0·(μe·ρ0)−1/2 ≈ 100 km/s is the Alfven speed and R = ρ0U0L/μ the Reynolds number. At the same time, δsw ~ 2000 km is the width of the velocity boundary layer implied by the data in the lower panel of Figure 1 (approximate distance between the Venus ionopause and the Mariner 5 position by the 3′-4 labels at the terminator), and also that δi = 1000 km is the width of the trans-terminator ionospheric flow revealed by the label “altitude” in the PVO data indicated in Figure 3. A similar value for this latter parameter is available from the H+ and O+ ion average velocity profiles reported by Lundin et al., (2011) [17] presented in Figure 4. In their profiles, there is a drastic decrease in the flow speed of the H+ and O+ ions from ~100 km/s by ~103 km altitudes to very low ~30 km/s by ~102 km altitudes, thus again leading to δi = 1000 km for the width of the trans-terminator flow.
ρ0·U02/L ~ B02/(2μe·L) + μU0·δsw−2
ρ0·U02 ~ ρ0·U02 [(VA/U0)2/2 + (L/δsw)2/R]
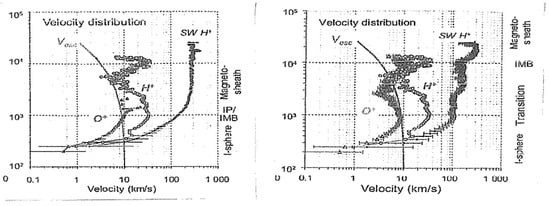
Figure 4.
Measured flow velocities versus VEX altitude for solar wind H+ ions, and ionospheric H+ and O+ ions. The curve marked vesc illustrates escape velocity versus altitude above Venus. The data points represent average values in 50 km altitude intervals sampled within Y = +0.5 of the dawn-dusk Meridian (left panel) and of the noon–midnight Meridian (right panel). Regions and boundaries are marked on the right-hand side as the I-sphere (the ionopause (IP), and the ionosheath (IMB) (from Lundin et al., (2011) [17]).
With these numbers, we can estimate the total value of the factor multiplying ρ0U02 within the square parenthesis on the right side of Equation (5), since it has to be equal to the number one so that it is equivalent to on the left side. Thus, we can compare the contribution of its terms and require that (L/δsw)2/R ≈ 1 × since (VA/U0)2 ~ 0.04 can be neglected. Using the values for L and δsw indicated above, we have (L/δsw)2 ~ 9 so that R ≈ 9, and thus ρ0U0L/μ = 9, leading to an equivalent kinematic viscosity coefficient ﬠ = μ/ρ0 ~ 3 × 10⁵ km2/s by using the values for Uo and L given above. This value of the kinematic viscosity coefficient is due to the low mass density ρ0 = 1.6 × 10⁻²³ gr cm−3 of the solar wind and, at the same time, it is related to the ability of particle motion to eliminate velocity variations that give rise to viscous transport ([18], see p. 37). Also, the corresponding value of the shear viscosity coefficient μ = ﬠ∙ρ0 ~ 5 × 10⁻⁸ gr cm−1s−1 is a measure of the internal friction opposing deformation of the flow ([18], see p. 36). With such values for ﬠ and μ, it is possible to validate Equation (5) and, at the same time, employ the kinematic viscosity coefficient ﬠ to calculate, together with the thermal speed VT ≈ 102 km/s, the mean free path value λH in Equation (1a). When VT ≈ 102 km/s we obtain λH ~ 3 × 10³ km and when VT ≈ 60 km/s we have λH ~ 5 × 10³ km.
A separate manner to derive λH is available by using the relation: αk = 0.75 nswBVT∙λH where B = 1.4 × 10⁻¹⁶ ergs °K−1 is the Boltzmann number, and that derives from studies of magnetic field fluctuations applied to particle motion [19]. At the same time, the value αk ~ 6 ergs cm−1K−1 s−1 with the thermal conductivity is obtained by combining Equation (1a,b) which lead to αk = ρcp VT λH; so that by using nsw = 3 cm−3 and VT = 60 km/s for freestream conditions in Figure 1 we have: λH = αk × [0.75 nswBVT]−1 which leads to λH = (6 ergs cm−1s−1 °K−1) × [0.75 × (3 cm−3) × (1.4 × 10−16 ergs °K−1) × (6 × 106 cm s−1)]−1 =3 × 109 cm thus implying λH ~ 3 × 10⁴ km (see Appendix A) and that varies with the VT value (α ~ 0.6). As a whole, the mean free path derived here is in a value range nearly one order of magnitude larger than that implied above from considerations on the viscous transport of momentum as discussed by Liepmann and Roshko [14]. In summary, two methods leading to similar results have been proposed to derive mean free path values of the solar wind that interacts with the Venus upper ionosphere, either through wave-particle interactions in terms of their relationship between the viscous transport of momentum and thermal conductivity, and also by applying magnetic field fluctuations to particle motion. That difference may be characteristic of wave-particle interactions.
A peculiar property in both procedures that lead to the mean free path λH value is that as shown in Equation (1a) they provide a relationship between this parameter and the thermal speed VT of the flow particles. In both procedures higher VT speeds imply lower λH values. This variation indicates that the thermal speed profile VT in Figure 1 leads to two different speed values, namely ~60 km/s in the solar wind before the inbound bow shock crossing marked as (1) and after the outbound crossing marked as (5), and differently, they reach ~100 km/s values through the inbound ionosheath between the marks labeled 2 and 3. As shown in Equation (1a) an increase in the thermal speed implies a decrease in the magnitude of the mean free path. This is the case in the solar wind where VT = 60 km/s implies λH = 5 × 10³ km, and also in the inner ionosheath where we have VT = 100 km/s thus implying λH = 3 × 10³ km. A similar variation is also applicable from the relation αk = 0.75 nswBVT λH that derives from studies of magnetic field fluctuations applied to particle motion. In particular, with ﬠ = 3 × 105 cm2/s for the viscosity coefficient we obtain λH = 3 × 10⁴ km when VT = 6 × 106 cm s−1 in the solar wind, and λH = 2 × 10⁴ km when VT = 107 cm s−1 in the inner ionosheath (see Appendix A). These latter values exceed by an order of magnitude those derived from Equation (1a) and thus suggest conditions that may not be applicable to wave particle interaction. In fact, no magnetic fluctuations can be identified in the solar wind or in the outer ionosheath. Different conditions are encountered in the inner ionosheath where VT = 100 km/s.
A notable aspect of the mean free path values obtained so far is the up to one order of magnitude difference between those obtained with the magnetic field fluctuation calculation and those derived from the wave-particle interaction procedure. This is better illustrated in Figure 5 where the linear variation in both traces reflects the relation between λH and VT that states as to how they are connected. It should be noticed, however, that the criteria used in both cases is different and thus it should not be expected that they lead to identical values. Despite their distinct peculiarity it is of interest to note that since VT is larger in the inner ionosheath smaller λH values should occur in that region. The wo different connecting traces in Figure 5 have been included to state the similar variation for each different procedure. As noted above, the different width value of the mean free path in the inner and in the outer ionosheath may be related to the more enhanced accumulation of the plasma particles in the inner ionosheath where the thermal speed is larger. Much research with detail calculations should be conducted to account for this behavior.
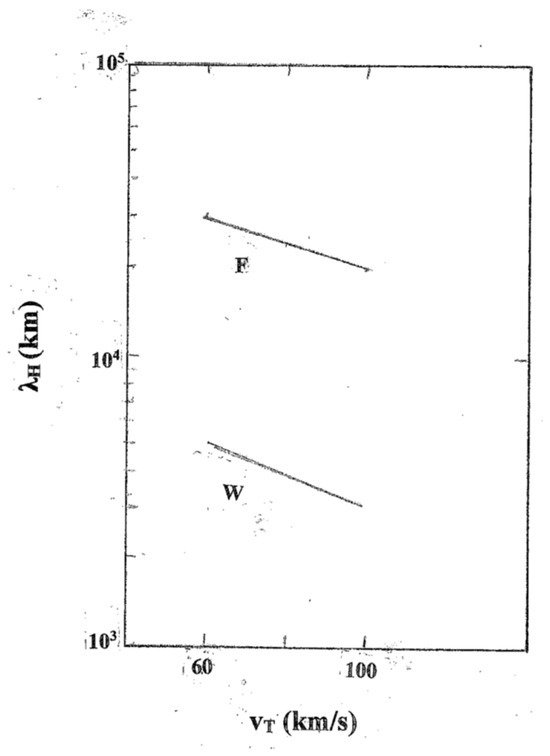
Figure 5.
Mean free path values λH of the solar wind obtained in wave-particle interactions and also in magnetic field fluctuations using the solar wind thermal speed VT and its kinematic viscosity coefficient ﬠ during the Mariner 5 trajectory in Figure 1. The connecting line labeled “W” refers to a value in the Venus inner and in the outer ionosheath that is implied by wave-particle interactions. The connecting line labeled “F” is implied by the magnetic field fluctuations.
The values derived in these calculations provide an approximate estimate of the variables involved since only a few of them can be measured. For example, the kinematic viscosity coefficient ﬠ was inferred from the general position of the Mariner 5 spacecraft as it moved across the terminator plane over the Venus ionosphere. Thus, it is possible that a more general ﬠ ~ 105 km2/s value for the kinematic viscosity coefficient could also be employed thus leading to a smaller λH ~ 104 km value for the mean free path being closer to those inferred from the wave-particle interactions.
The validity of Equation (1a) can also be supported by noting, through an unrelated example that is applicable to air flows where there is also a relationship between the viscosity coefficient and the mean free path value. In fact, with VT = 4.5 × 104 cm s−1 for the thermal speed of air particles at room temperature, together with λ = 4 × 10⁻⁵ cm for their mean free path value [14], Equation (1a) leads to ﬠ = 1.8 cm2/s for the kinematic viscosity coefficient of air flows at atmospheric pressures. Such value is comparative to those reported by Hughes and Brighton (1967) [20] under such conditions. The implication is that the viscosity coefficient and the thermal temperature of the solar wind derived from measurements may also lead to approximate mean free path values that satisfy Equation (1a).
3. Discussion
The main argument examined in this study has been to employ a procedure used in gas dynamic theories to support a fluid view that describes the behavior of the solar wind in its interaction with the Venus upper ionosphere. The procedure is useful in the sense that despite the absence of collisions among the particles of both populations, it is possible to transfer their statistical properties through dissipation processes that are necessary to validate a continuum flow approach. Under such circumstances, the continuum flow contact between both plasma populations is provided via wave-particle interactions that are produced through the viscous transport of momentum and thermal conductivity.
As a whole, the procedure is different from that used in standard techniques where the combined motion of individual particles is followed as they lead to plasma instabilities and electric current systems that in the end produce wave-particle interactions as well [21,22,23]. In all those studies, it is desirable to validate weather Maxwell–Boltzmann velocity distributions are adequate to represent the solar wind motion. Suitable examples of its velocity profiles are derived from measurements conducted with the PVO spacecraft in the Venus ionosheath that are presented in Figure 6 [24]. Those profiles show shapes that resemble Maxwell–Boltzmann distribution functions in the outer ionosheath (labeled I and IV in the upper panel), while an energy profile with lower values is derived from measurements in the inner ionosheath (labeled II). A more complicated distribution (labeled III) shows two peak values that describe different conditions in the outer and in the inner ionosheath. Between those peak values, there is a plasma transition, as identified in Figure 2, that is related to the effects of dissipative viscous processes responsible for the plasma heating revealed by the temperature profile shown in that figure.
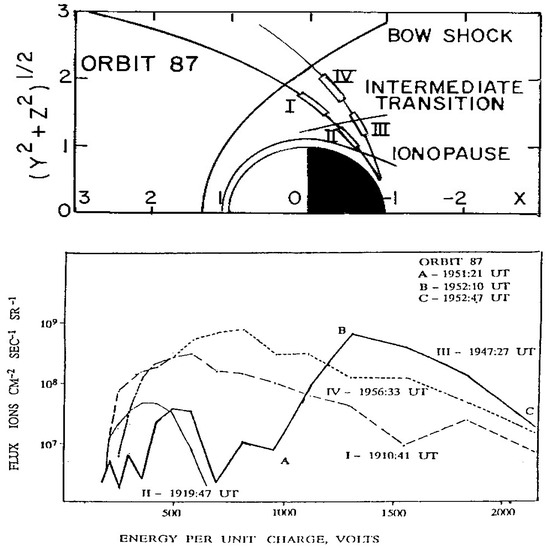
Figure 6.
(Upper panel) Trajectory of the PVO in orbit 87 projected on one quadrant in cylindrical coordinates. The bow shock, the intermediate transition, and the ionopause are indicated. (Lower panel) Ion flux values measured as a function of energy in cycles I, II, III, and IV state their start time (their position is noted in the upper panel along the PVO trajectory). Positions A, B, and C in spectrum III mark the time when the ion fluxes were obtained ([24]).
As a result of momentum transfer between the solar wind and the Venus upper ionosphere, there is evidence in the solar wind speed profile of the H+ ions depicted in Figure 4 that there is a significant speed decrease from the freestream 300 km/s values measured above the interaction region in the dawn–dusk Meridian (left panel) to ~10 km/s values measured across a layer that extends from ~104 km altitudes to ~102 km altitudes. A similar contour is also encountered in the noon–midnight speed profile (right panel) but with variations. In particular, in the latter case, there are smaller speed values measured within that layer suggesting the spacecraft transit through a plasma channel that mostly develops by the vicinity of the midnight plane (Pérez-de-Tejada, 2023 [25], see Figure 4.11). In addition, the sudden increase in the speed values of the planetary H+ ions with an altitude from ~10 km/s to ~50 km/s above ~5 × 10³ km in the upper part of the speed profiles in both panels of Figure 4 should also be accounted for. Such a change is consistent with the entry of a spacecraft through the narrow section of a corkscrew flow shape as that indicated in Figure 7 (see [13], Figure 5.15). In fact, momentum flux conservation requires higher flow speed values within the corkscrew when its cross-section decreases. This would be the case when the spacecraft moves through the thinner region of the corkscrew as it moves along the wake. Wave-particle interactions are necessary to allow for momentum flux conservation to increase the flow speed depending on the width of the corkscrew configuration. Such a change in the shape of the corkscrew flow, shown in Figure 7, implies a necessary increase in the local flow speed at high altitudes across its thin regions, as reported in both panels of Figure 4.

Figure 7.
View of a corkscrew vortex flow in fluid dynamics. Its geometry is equivalent to that of a vortex flow in the Venus wake, with its width and position varying during the solar cycle. Near the solar cycle minimum, the vortex is located closer to Venus (located by the right side) and there are also indications that its width becomes smaller with increasing distance downstream from the planet [13].
A distinct characteristic of the procedure described here and that is based on the effects of dissipation processes is that the calculations of values for the mean free path of the solar wind particles subject to such conditions are comparable to those of the Larmor radius in gyrotropic trajectories. The latter are due to their motion within the ~10 nT intensity of the magnetic field measured in the solar wind. The difference between both situations is that in both cases, the particle trajectory is entirely different with stochastic variations being dominant in the region where a fluid description is applicable. Gyrotropic trajectories occur, on the other hand, far from the interaction region.
It is of interest to note that that there is also observational evidence of vortex flow structures measured in the solar wind–Mars ionosphere boundary, as inferred from plasma features in the vicinity of the Mars ionosphere detected with the plasma data of the Maven spacecraft. Ruhunusiri et al. (2016) [26] identified vortex plasma waves with average periods of nearly 3 min by the boundary of the Mars ionosphere that are comparable to those derived from the Venus ionosheath measurements [13].
A useful outcome in the onset of wave-particle interactions for the solar wind that mixes up with planetary/cometary plasmas is that similar conditions should also be applicable in the interaction of stellar winds with exoplanets. In such cases, there should also be evidence of a fluid dynamic response in the behavior of the interacting plasmas. Similarly, it would be of interest to examine whether a fluid dynamic approach is also applicable to larger (galactic)-scale plasma flow interactions involving plasma-directed flows mixing with rotating plasmas.
Funding
This research received no external funding.
Data Availability Statement
Data are contained within the article.
Acknowledgments
I wish to thank Gilberto A. Casillas for the technical work provided. Financial support was available from the UNAM-IN108814-3 project in Mexico City.
Conflicts of Interest
The author declares no conflict of interest.
Appendix A
Values of the thermal conductivity coefficient k can be obtained from Equation (A1a,b) that relate such parameter with the mean free path λH value; namely:
ﬠ= VT∙λH is for viscous dissipation
VT∙λH = α∙k/ρcp is for thermal dissipation
Using both equations we obtain:
α∙k = ρcp∙vT∙λH = ρcp∙ﬠ
From calculations in the text we have = 3 × 1015 cm2·s−1
and using nsw = 3 cm−3 from Figure 1 we have:
ρ = (m∙nsw) (1.6 × 10⁻²⁴ gr)(3 cm−3) = 4.8 × 10⁻²⁴ gr·cm−3 and cp = 4 × 10⁸ ergs·gr−1·K−1.
Thus: αk = (4.8 × 10⁻²⁴ gr·cm−3) × (4 × 108 ergs·gr−1·K−1) × (3 × 1015 cm2·s−1).
αk = (19.2 × 10⁻¹⁶ cm−3 ergs·K−1) × (3 × 1015 × cm2 s−1) = 6 ergs·cm−1·s−1·K−1.
This value is used in: αk = 0.75 nswBvT·λH that derives from studies of magnetic field fluctuations applied to particle motion [19]. (B = 1.4 × 10⁻¹⁶ ergs·°K−1 is the Boltzmann number).
1—We employ vT = 6 × 106 cm/s for the solar wind in the outer ionosheath:
and calculate αk = 0.75nswBvT λH or λH = αk [0.75nswBvT]−1
2—We employ vT = 107 cm/s in the inner ionosheath:
and calculate αk = 0.75nsw∙BvT∙λH or λH = αk [0.75nswBvT]−1.
References
- Bridge, H.S.; Lazarus, A.J.; Snyder, C.W.; Smith, E.J.; Davis, L.; Coleman, P.J.; Jones, D.E. Mariner, V. Plasma and Magnetic Fields Observed near Venus. Science 1967, 158, 1669–1673. [Google Scholar] [CrossRef] [PubMed]
- Vörös, Z.; Zhang, T.L.; Leaner, M.P.; Volwerk, M.; Delva, M.; Baumjohann, W. Intermittent turbulence, noisy fluctuations and wavy structures in the Venusian magnetosheath and wake. J. Geophys. Res. 2008, 113, ED0B21. [Google Scholar] [CrossRef]
- Pérez-De-Tejada, H. Fluid dynamic constraints of the Venus ionospheric flow. J. Geophys. Res. 1986, 91, 6765–6770. [Google Scholar] [CrossRef]
- Pérez-De-Tejada, H.; Lundin, R.; Futaana, Y.; Zhang, T. Measurement of plasma channels in the Venus wake. Icarus 2019, 321, 1026–1037. [Google Scholar] [CrossRef]
- Phillips, J.L.; McComas, D.J. The magnetosheath and magnetotail of Venus. Space Sci. Rev. 1991, 55, 1–80. [Google Scholar] [CrossRef]
- Romanov, S.A.; Smirnov, V.; Vaisberg, O. Interaction of the solar wind with Venus. Cosmic Res. 1979, 16, 603. [Google Scholar]
- Verigin, M.I.; Gringauz, K.I.; Gombosi, T.; Breus, T.K.; Bezrukikh, V.V.; Remizov, A.P.; Volkov, G.I. Plasma near Venus from the Venera 9 and 10 wide-angle analyzer data. J. Geophys. Res. 1978, 83, 3721–3728. [Google Scholar] [CrossRef]
- Pérez-De-Tejada, H.; Lundin, R.; Barabash, S.; Sauvaud, J.; Coates, A.; Zhang, T.L.; Winningham, D.; Reyes-Ruiz, M.; Durand-Manterola, H. Plasma transition at the flanks of the Venus ionosheath: Evidence from the Venus Express data. J. Geophys. Res. Space Phys. 2011, 116, A01103. [Google Scholar] [CrossRef][Green Version]
- Knudsen, W.C.; Spenner, K.; Miller, K.L.; Novak, V. Transport of ionospheric O+ ions across the Venus terminator and implications. J. Geophys. Res. 1980, 85, 7803–7810. [Google Scholar] [CrossRef]
- Brace, L.H.; Theis, R.F.; Mayr, H.G.; Curtis, S.A.; Luhmann, J.G. Holes in the nightside ionosphere of Venus. J. Geophys. Res. 1982, 87, 199–211. [Google Scholar] [CrossRef]
- Pérez-de-Tejada, H. Plasma channels and electron density profiles near the midnight plane in the Venus nightside ionosphere. J. Geophys. Res. 2004, 109, A04106. [Google Scholar] [CrossRef]
- Lundin, R.; Barabash, S.; Futaana, Y.; Holmström, M.; Perez-De-Tejada, H.; Sauvaud, J. A large-scale flow vortex in the Venus plasma tail and its fluid dynamic interpretation. Geophys. Res. Lett. 2013, 40, 1273–1278. [Google Scholar] [CrossRef]
- Pérez-de-Tejada, H.; Lundin, R. Particle Acceleration in the Venus Wake, Chapter 5. In Plasma Science—Recent Advances, New Perspectives and Applications; Singh, S., Ed.; IntechOpen: London, UK, 2023. [Google Scholar] [CrossRef]
- Liepmann, J.; Roshko, A. Elements of Gasdynamics; John Wiley: Hoboken, NJ, USA, 1967; p. 372. [Google Scholar]
- Pérez-De-Tejada, H. Viscous Forces in Velocity Boundary Layers around Planetary Ionospheres. Astrophys. J. 1999, 525, L65–L68. [Google Scholar] [CrossRef]
- Shercliff, J.A. A Text of Magnetohydrodynamics; Pergamon Press: Oxford, UK, 1965; p. 24. [Google Scholar]
- Lundin, R.; Barabash, S.; Futaana, Y.; Sauvaud, J.-A.; Fedorov, A.; Perez-De-Tejada, H. Ion flow and momentum transfer in the Venus plasma environment. Icarus 2011, 215, 751–758. [Google Scholar] [CrossRef]
- Batchelor, G.K. An Introduction to Fluid Dynamics; Cambridge University Press: Cambridge, UK, 1979; p. 36. [Google Scholar]
- Cravens, T.E.; Gombosi, T.I.; Kozyra, J.; Nagy, A.F.; Brace, L.H.; Knudsen, W.C. Model calculations of the dayside ionosphere of Venus: Energetics. J. Geophys. Res. 1980, 85, 7778–7786. [Google Scholar] [CrossRef]
- Hughes, W.F.; Brighton, J.A. Fluid Dynamics, Schaums Outline Series; Appendix A, Table A.2., p. 245; McGraw-Hill: New York, NY, USA, 1967. [Google Scholar]
- Szegö, K.; Shapiro, V.S.; Shevchenko, V.I.; Sagdeev, R.Z.; Kasprzak, W.T.; Nagy, A.F. Physical processes in the plasma mantle of Venus. Geophys. Res. Lett. 1991, 18, 2305–2308. [Google Scholar] [CrossRef]
- Dobe, Z.; Quest, K.B.; Shapiro, V.D.; Szego, K.; Huba, J.D. Interaction of the Solar Wind with Unmagnetized Planets. Phys. Rev. Lett. 1999, 83, 260–263. [Google Scholar] [CrossRef]
- Delva, M.; Zhang, T.L.; Volwerk, M.; Vörös, Z.; Pope, S.A. Proton cyclotron waves in the solar wind at Venus. J. Geophys. Res. 2008, 113, E00B06. [Google Scholar] [CrossRef]
- Perez-De-Tejada, H.; Intriligator, D.S.; Strangeway, R.J. Intermediate transition in the Venus ionosheath. J. Geophys. Res. 1995, 100, 14523–14535. [Google Scholar] [CrossRef]
- Pérez-de-Tejada, H. Vortex Structures in Planetary Plasma Wakes; Cambridge Scholars Pub: Cambridge, UK; IntechOpen: London, UK, 2023; ISBN 978-1-83768-023-8. ISBN(10): 1-5275-0110-8. [Google Scholar]
- Ruhunusiri, S.; Halekas, J.S.; McFadden, J.P.; Connerney, J.E.P.; Espley, J.R.; Harada, Y.; Livi, R.; Seki, K.; Mazelle, C.; Brain, D.; et al. MAVEN observations of partially developed Kelvin-Helmholtz vortices at Mars. Geophys. Res. Lett. 2016, 43, 4763–4773. [Google Scholar] [CrossRef]
Disclaimer/Publisher’s Note: The statements, opinions and data contained in all publications are solely those of the individual author(s) and contributor(s) and not of MDPI and/or the editor(s). MDPI and/or the editor(s) disclaim responsibility for any injury to people or property resulting from any ideas, methods, instructions or products referred to in the content. |
© 2024 by the author. Licensee MDPI, Basel, Switzerland. This article is an open access article distributed under the terms and conditions of the Creative Commons Attribution (CC BY) license (https://creativecommons.org/licenses/by/4.0/).