Article

Investigating Possible Correlations between Gamma-Ray and Optical Lightcurves for TeV-Detected Northern Blazars over 8 Years of Observations

by
Atreya Acharyya
1,*,† and
Alberto C. Sadun
2,†
1
Department of Physics and Astronomy, University of Alabama, Tuscaloosa, AL 35487, USA
2
Department of Physics, University of Colorado Denver, Campus Box 157, P.O.Box 173364, Denver, CO 80217, USA
*
Author to whom correspondence should be addressed.
These authors contributed equally to this work.
Galaxies 2023, 11(4), 81; https://doi.org/10.3390/galaxies11040081
Submission received: 11 May 2023 / Revised: 5 June 2023 / Accepted: 28 June 2023 / Published: 1 July 2023
(This article belongs to the Special Issue Distant Glowing Objects: Quest for Quasars)

Abstract

:
Blazars are a subclass of active galactic nuclei (AGN) having relativistic jets aligned within a few degrees of our line-of-sight and form the majority of the AGN detected in the TeV regime. The Fermi-Large Area Telescope (LAT) is a pair-conversion telescope, sensitive to photons having energies between 20 MeV and 2 TeV, and is capable of scanning the entire gamma-ray sky every three hours. Despite the remarkable success of the Fermi mission, many questions still remain unanswered, such as the site of gamma-ray production and the emission mechanisms involved. The Asteroid Terrestrial-impact Last Alert System (ATLAS) is a high cadence all sky survey system optimized to be efficient for finding potentially dangerous asteroids, as well as in tracking and searching for highly variable and transient sources, such as AGN. In this study, we investigate possible correlations between the Fermi-LAT observations in the 100 MeV–300 GeV energy band and the ATLAS optical data in the R-band, centered at 679 nm, for a sample of 18 TeV-detected northern blazars over 8 years of observations between 2015 and 2022. Under the assumption that the optical and gamma-ray flares are produced by the same outburst propagating down the jet, the strong correlations found for some sources suggest a single-zone leptonic model of emission.

1. Introduction

Blazars form a subclass of radio-loud active galactic nuclei (AGN) that have jets closely aligned to our line-of-sight, resulting in the emission from these objects being highly Doppler-boosted and making them some of the brightest gamma-ray sources in the extragalactic sky [1]. Blazars are generally characterized by non-thermal, highly-polarized continuum emission, spanning the entire electromagnetic spectrum and characteristically show very fast variability, which has been observed down to timescales of minutes in the gamma-ray regime [2,3,4], as well as in the optical regime [5,6,7].
The spectral energy distribution (SED) of a typical blazar comprises two distinct peaks. Although the first peak, occurring in the radio to the X-ray regime, has been attributed to synchrotron emission from electrons and positrons within the jet, the physical mechanisms responsible for the second peak, produced in the X-ray to gamma-ray regime, is still a matter of debate and two main scenarios have been postulated to explain it. Leptonic models [8,9] attribute the high-energy peak to the inverse Compton (IC) scattering between the energetic leptons in the jet and a field of low energy photons (for example, [10]), either the same photons emitted through synchrotron emission (synchrotron self-Compton (SSC)) or photon populations external to the jet (external inverse Compton (EIC)). On the other hand, hadronic models (for example, [11]) suggest that the second peak may be a result of high energy photons produced in cosmic-ray interactions through the decay of neutral pions (for example, [12]) or proton synchrotron emission (for example, [13]).
Localizing the gamma-ray emission is an indirect process and a variety of different methods have been used previously in the literature. Assuming constant jet geometry, the size of the emission region, r, has been used to infer its distance from the supermassive black hole (SMBH), R, using r = ψ R . Here ψ is the semi-aperture opening angle of the jet [14,15]. This relation has been used to constrain the emission region to be within a few parsec from the base of the jet. For example, Ref. [16], using ∼2 years of Fermi-LAT observations, constrained the emission to be from within the broad line region (BLR) under the assumption that the full width of the jet is responsible for the emission.
Moreover, the observation of very high energy (VHE) photons ( E γ 20 GeV) suggest the emission originates farther out, at parsec scale distances and from within the molecular torus (MT) region [17,18]. VHE photons are expected to be severely attenuated from interactions with the photons in the BLR and the detection of blazars with ground-based instruments is difficult to explain if the emission were assumed to originate in regions near the central engine. A possible solution which accommodates both the short variability timescales and VHE detection is to abandon the one-zone emission model and invoke the presence of multiple emission regions [19].
An important technique to localize the emission region in blazars is the correlation of multi-wavelength lightcurves. In particular, it helps in identifying potential relationships between emission zones and in understanding the dominant emission mechanisms. For instance, a strong correlation between synchrotron produced optical data and IC scattering produced gamma-ray observations (for example, [20,21]) is expected in some leptonic models. The lags and leads, if highly significant, can help to constrain the location of the gamma-ray emission region relative to the optical emission region and also discriminate between SSC and EC models. On the other hand, orphan flares in one waveband having no correlation with others, for example, the 2002 flare of 1ES 1959+650 [22], can be interpreted as evidence of multiple emission zones or as support for hadronic emission models.
In this respect, the Large Area Telescope (LAT) on board the Fermi satellite [23] has been particularly important. This pair-conversion telescope, launched in June 2008, is sensitive to photon energies between 20 MeV and 2 TeV and scans the entire gamma-ray sky every three hours. For example, Ref. [24] presented an investigation of correlations between optical data collected with the robotic 0.76 m Katzman Automatic Imaging Telescope (KAIT) at Lick Observatory and gamma-ray observations with the Fermi-LAT using discrete correlation functions (DCFs). The same method was used by [25,26] to study radio–gamma-ray correlations in blazars.
The Asteroid Terrestrial-impact Last Alert System (ATLAS [27]) is a high cadence all sky survey system comprising four independent units, one on Haleakala (HKO), and one on Mauna Loa (MLO) in the Hawaiian islands in the Northern Hemisphere and one each at the El Sauce Observatory, Chile and the South African Astronomical Observatory in the Southern Hemisphere. It is optimized to be efficient for finding potentially dangerous asteroids, as well as in tracking and searching for highly variable and transient sources, such as AGN, and is capable of discovering more bright, less than 19 mag, supernovae candidates than other ground based surveys.
Blazar observations with ATLAS are in the R-band, centered at 679 nm, having a typical cadence of one data point per two days. In this work, we apply local cross-correlation functions (LCCFs [28]) to investigate possible correlations between ATLAS optical data and gamma-ray observations with the Fermi-LAT for a sample of 18 TeV-detected northern blazars, over 8 years of observations between 2015 and 2022. For brighter sources (for example, Mrk 501 [29]), it is also possible to undertake an analysis of microvariability in outbursts using optical data and this will be investigated in detail in a future publication.

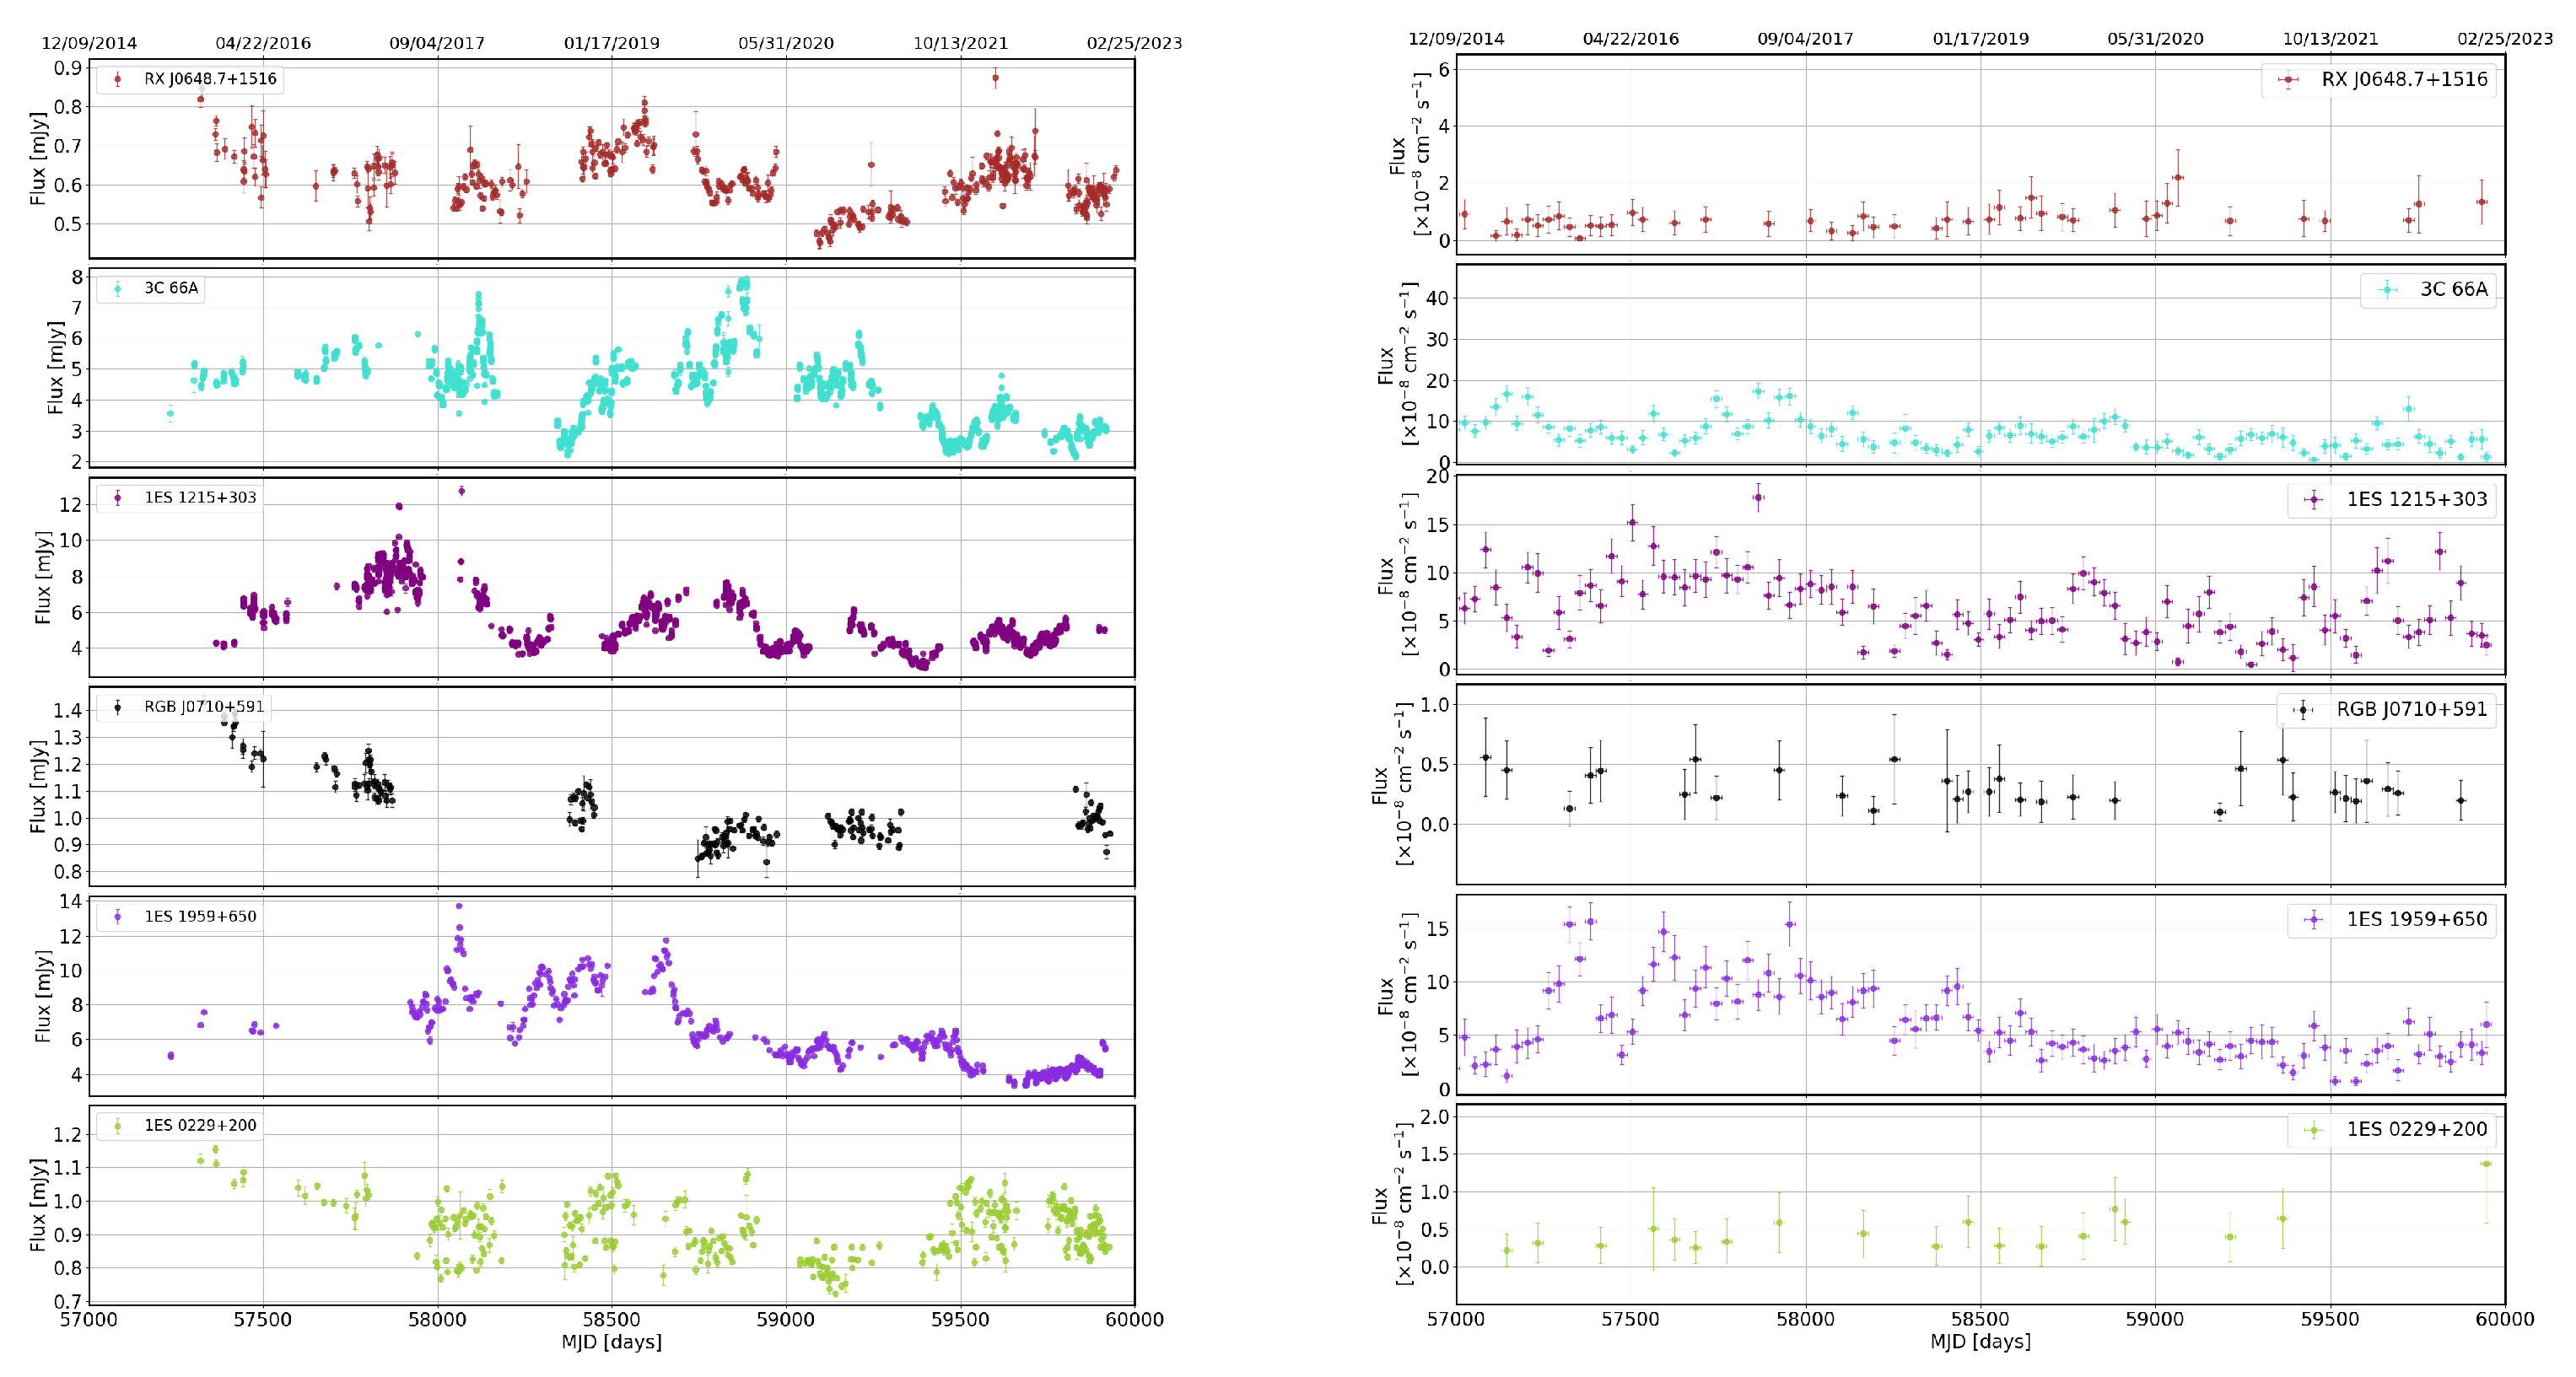
2. Source Selection and Data Reduction
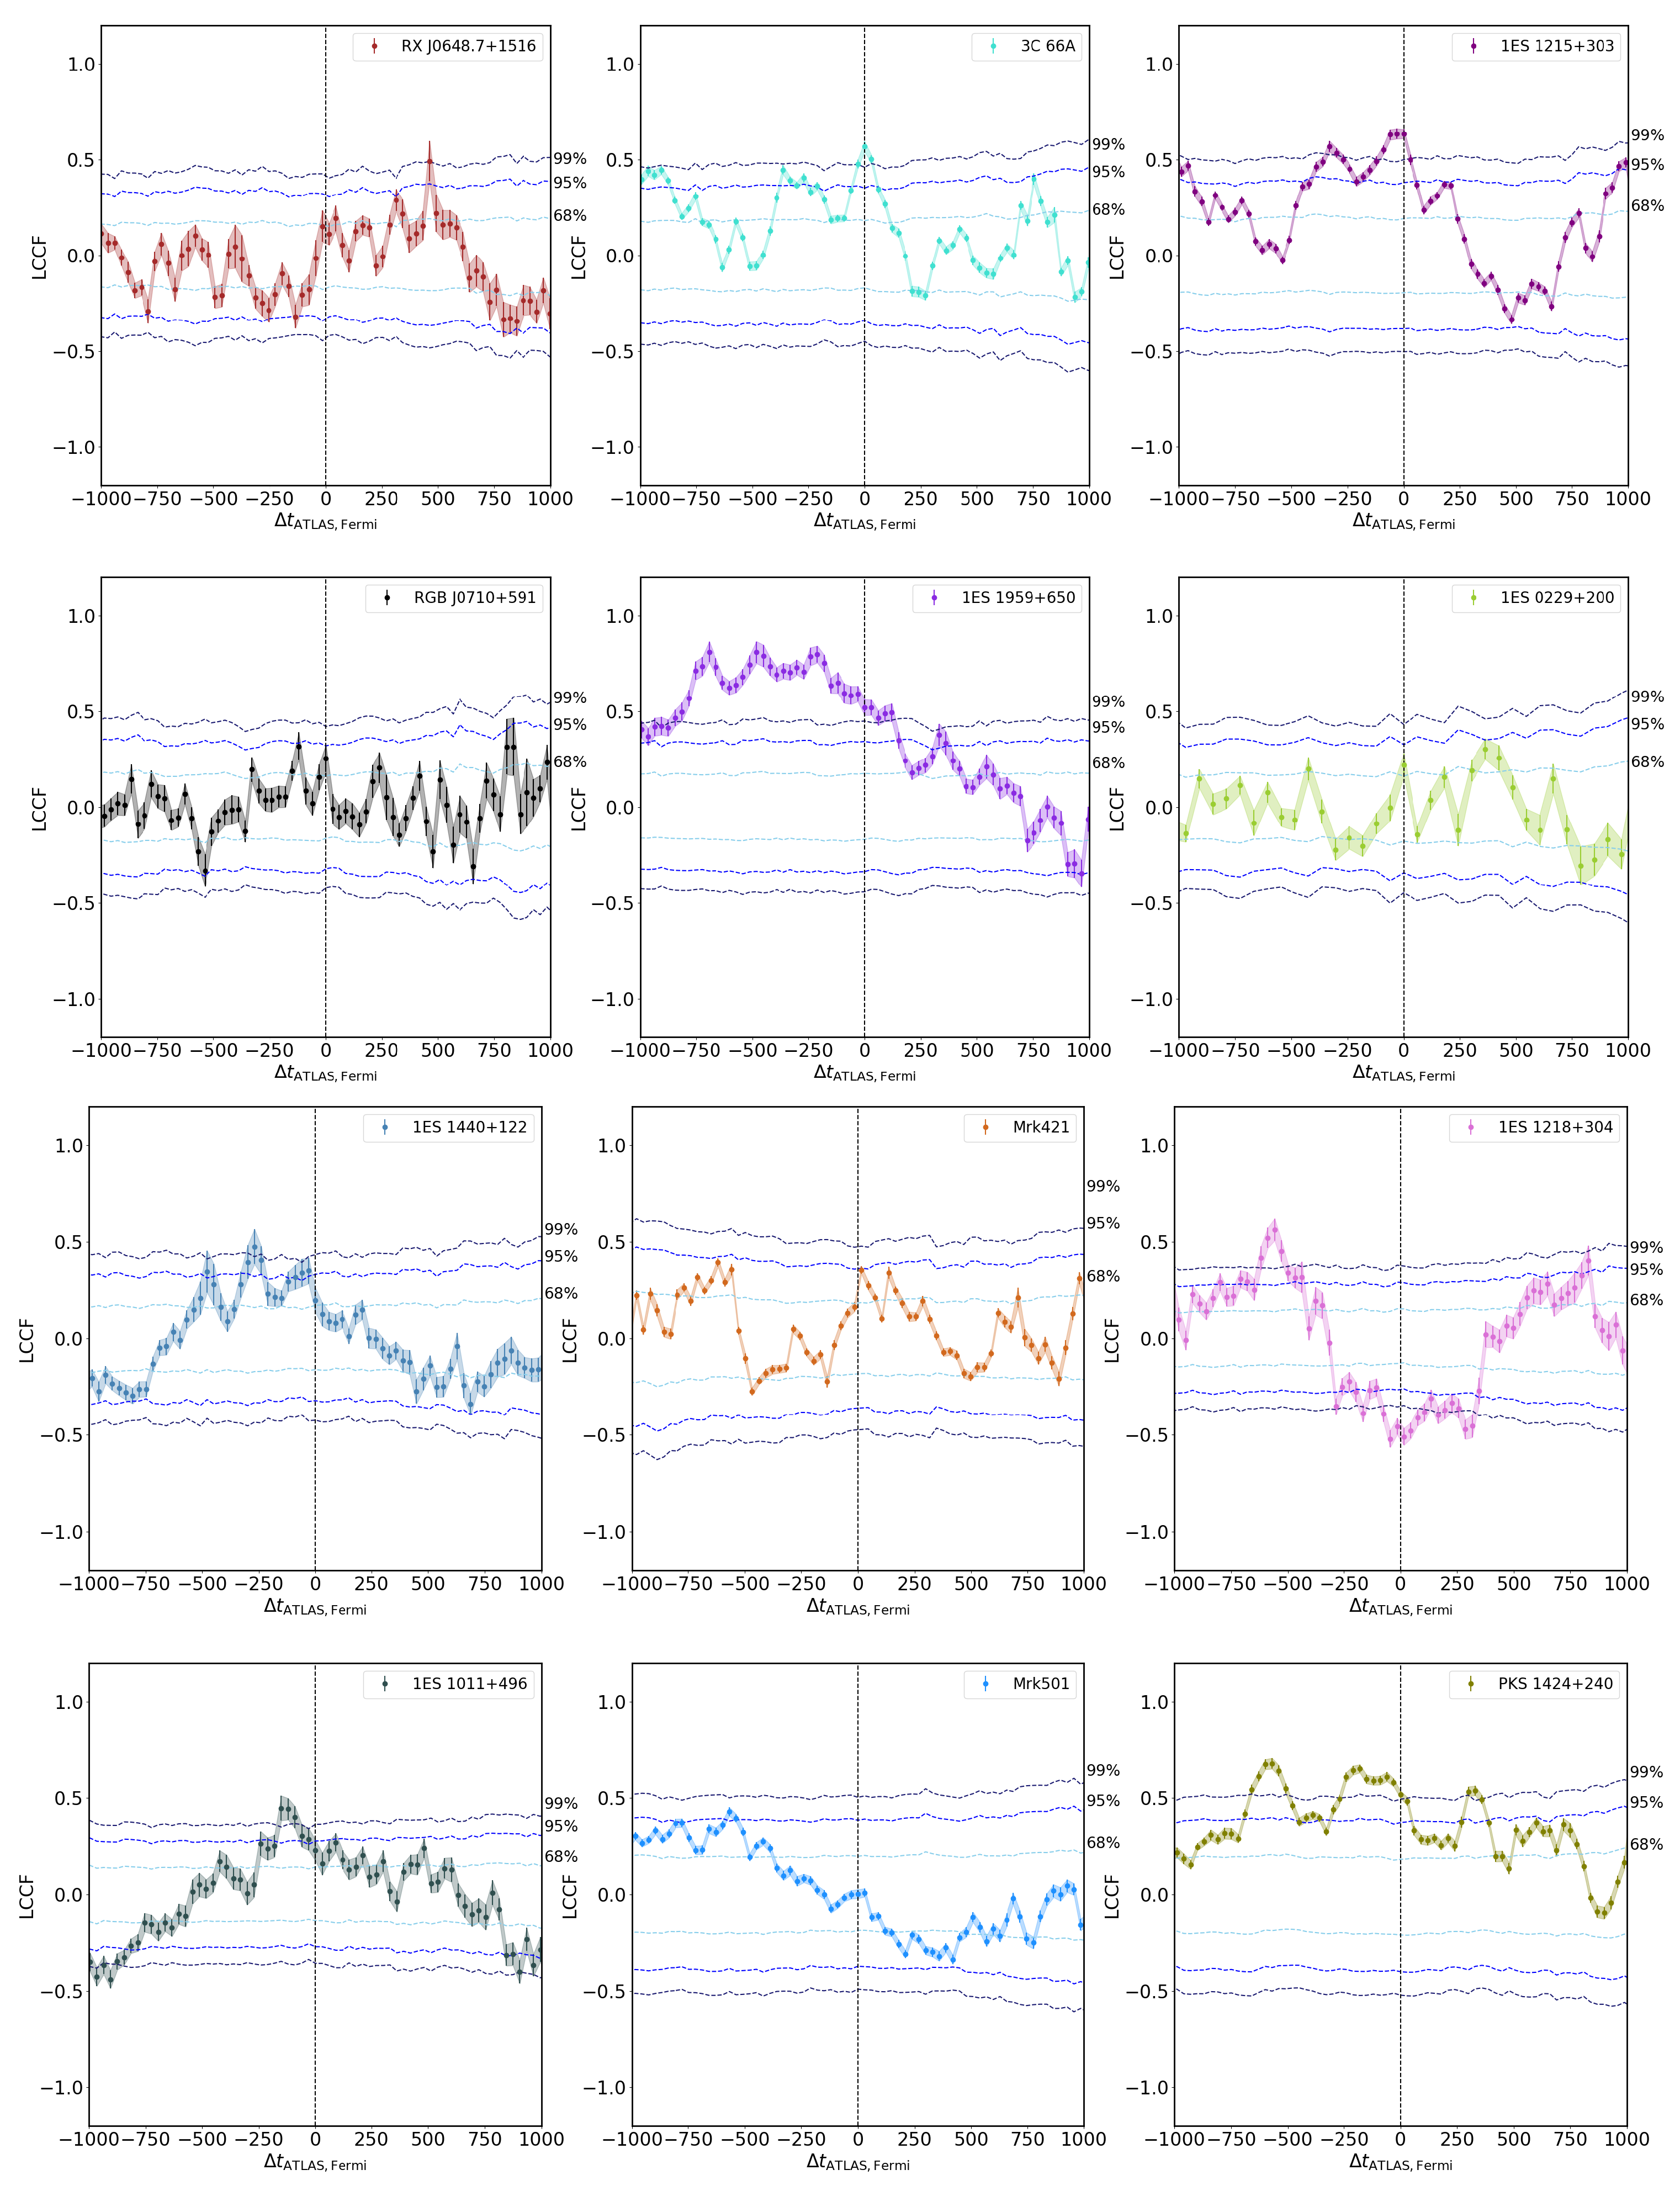
The main goal of this study is to investigate possible correlations between ATLAS optical data and Fermi-LAT gamma-ray observations in blazars. The identification of suitable sources was primarily governed by having sufficient photon statistics to allow for a detailed study of the LCCFs. The sample of sources chosen for this study comprised 18 Fermi-LAT northern blazars detected in the TeV regime1 with ground-based gamma-ray observatories is shown in Table 1.
Optical observations were made with the ATLAS, a high cadence all sky survey system of four 0.5 m telescopes that scan the entire sky periodically. The telescopes are located in Hawaii (Mauna Loa, Hawaii and Haleakala, Maui), in South Africa (Sutherland Observing Station), and Chile (El Sauce Observatory, Rio Hurtado). Between declinations −50 degrees and + 50 degrees, the cadence is one set of observations each day, and in the polar regions once every two days, during observing season and weather permitting. The filter used in these observations is roughly equivalent to the Johnson–Cousins R filter. The transmission curve is centered at 679 nm. The filter is nonstandard, but well calibrated, see [27]. All the data is archived in a database for retrieval.
A forced photometry system is used in which the point spread function (PSF), which represents the distribution of light from a point source on a detector, is obtained for each object based on bright stars, and the function is forced onto the object at the chosen coordinates. Data processing is described in [27,30]. When the data is retrieved from the database, software automatically calculates the magnitude according to the AB system, as well as the flux for each object. A catalog of variable stars produced by this method is shown by [31]. The optical lightcurves for the sample of blazars are shown in Figure 1, Figure 2 and Figure 3.
In this work, we analyzed Fermi-LAT photons detected between MJD 57000 and MJD 59945, which corresponds to midnight on 9 December 2014 until midnight on 1 January 2023. Throughout the gamma-ray analysis, we used the Fermi Science Tools version 11-05-032, FERMIPY version 1.0.13 [32], in conjunction with the latest PASS 8 IRFs [33]. We consider the energy range 100 MeV–300 GeV and a region of interest (RoI) with radius 15 centred on each source. A lower limit of 100 MeV is chosen because the PSF of the Fermi-LAT increases at lower energies, making a point source analysis difficult. Furthermore, most of the blazars selected have relatively soft gamma-ray spectra and are not expected to be significantly detected with the Fermi-LAT at energies above 300 GeV. Moreover, we selected only photon events from within a maximum zenith angle of 90 in order to reduce contamination from background photons from the Earth’s limb, produced by the interaction of cosmic-rays with the upper atmosphere.
Sources in the 4FGL-DR3 catalog [34] within a radius of 20 from the spatial position of each source in the sample were included in the initial model for the analyses, with their spectral parameters fixed to their catalog values. This takes into account the gamma-ray emission from sources lying outside the RoI which might yet contribute photons to the data, especially at low energies, due to the size of the point spread function of the Fermi-LAT. The contributions from the isotropic and galactic diffuse backgrounds were modeled using the most recent templates, iso_P8R3_SOURCE_V2_v1.txt and gll_iem_v07.fits, respectively.
The analysis began with an initial automatic optimization of the RoI by iteratively fitting the sources. This ensured all parameters were close to their global likelihood maxima. The spectral normalization of all modelled sources within the RoI were left free as were the normalization factor of both the isotropic and galactic diffuse emission templates. Furthermore, the spectral shape parameters of all sources within 5 of the centre of the RoI were left free to vary whereas those of other sources were fixed to the values reported in the 4FGL-DR3 catalog. A binned likelihood analysis was then performed in order to obtain the spectral parameters best describing the model using a spatial binning of 0.1 pixel 1 and 8 energy bins per decade.
In order to pursue a study of the temporal behaviour of the gamma-ray fluxes, the 15 year Fermi-LAT data were binned monthly with a likelihood routine applied to each bin separately4. During the production of the lightcurve, the spectral parameters of all sources within 5 of the RoI centre were left free for each bin as were the normalization factors of the background emission models. The resulting lightcurves for the sample of blazars are shown in Figure 1, Figure 2 and Figure 3, along with the corresponding uncertainties. Only time intervals having TS ≥ 10 were considered, which roughly equates to a significance of 3 σ .

3. Results

Local cross-correlation functions (LCCFs; [28]) were then applied to investigate correlations between the Fermi-LAT and ATLAS lightcurves. Consider two lightcurves having fluxes a i and b j , corresponding to times t a i and t b j , the LCCF can then be computed as:
LCCF ( τ ) = 1 M Σ ( a i a ¯ τ ) ( b j b ¯ τ ) σ a τ σ b τ .
Here, the sums run over M pairs for which τ t a i t b j < τ + Δ t for a chosen timestep Δ t , and a ¯ τ and b ¯ τ are flux averages and σ a τ and σ b τ are standard deviations over the M pairs, respectively [28]. As adopted in [35], we choose the higher half median of the time separations between consecutive data points in the two lightcurves as the binning of the timelags, τ . Furthermore, the minimum and maximum values of τ are chosen to be ± 0.5 times the length of the shorter lightcurve [36]. This method is independent of any difference in sampling rates between the lightcurves. LCCFs are intrinsically bound in the interval [−1,1] and [36] found them to be more efficient than the use of Discrete Correlation Functions (DCFs; [37]). The LCCFs obtained for each source are shown in Figure 4 and Figure 5.
As done in [24], the centroid lags and uncertainties are derived from weighted least-square Gaussian fits to the LCCF points at the location of the most significant correlation peak. Although the peaks of the Gaussian fits give a first order determination of the uncertainty, these do not account for the effects of correlated red-noise between the datasets [38]. The significances of the correlations are obtained by performing Monte Carlo simulations to produce 1000 artificial lightcurves matching the probability distribution function (PDF) and power spectral density (PSD) of each observation using the method outlined in [39]5. The 68%, 95%, and 99% confidence intervals obtained are also shown in Figure 4, in blue from lighter to darker shades.
The centroid lags and significances obtained for each source are summarised in Table 1. Throughout this paper, a positive time delay, Δ t > 0 , is defined as corresponding to the optical emission leading the gamma-ray emission. Wider LCCF peaks may indicate a range of characteristic timescales in the correlated response or limitations in the instruments [24]. The presence of a peak, significant at a level of above 3 σ , implies strong optical and gamma-ray correlations. This is seen for W Comae, S3 1227+25, 3C 66A, and 1ES 1215+303, and suggests a single-zone model of emission. Under the assumption that the optical and gamma-ray flares are produced by the same outburst propagating down the jet, both positive and negative time-lags on timescales of days to tens of days are predicted in SSC and EIC models. A significant peak consistent with zero indicates an absence of time-lag and is seen for S3 1227+25 and 3C 66A.
The results obtained in this investigation are broadly in agreement with those seen in [20], where the optical and gamma-ray correlations of 121 blazars were found to be significant at a level of above 68 % (∼ 1 σ ). The majority of the corresponding time-lags were within ± 20 days of zero-lag and this was interpreted as evidence of a common origin for the flares in the two bands, implying leptonic processes dominate blazar gamma-rays, while not excluding the possibility of hadronic contribution to the emission. However, it should be noted that although [20] found that the time delays, in general, did not exceed 50 days at 2 σ level and was less at 3 σ level, in this study, we find significant delays for 11 of the 18 considered objects, often exceeding 100 days.
Furthermore, out of the nine objects with a correlation of above 99 % , five sources, namely, 1ES 0414+009, 1ES 1959+650, 1ES 1440+122, 1ES 1011+496, 1ES 1218+304, and PKS 1424+240, are found have a delay of more than 100 days. In all of these cases a negative time-lag is found, suggesting that the gamma-ray emission lags the optical emission. This long delay could imply a more complex emission mechanism than the simple one-zone leptonic SSC model found for the remaining sources; for example, one with multiple emission regions with the optical emission originating upstream of the gamma-ray emission (this was also seen for gamma-ray and radio correlations in [26]). However, continuous and simultaneous monitoring over a longer time period is required to draw any stronger conclusions.
Moreover, while similar conclusions of leptonic single-zone models where the low- and high-energy emission comes from the same population of electrons were also found in [21] from a study of gamma-ray and optical correlations for a sample of 1180 blazars, it should also be noted that they find evidence of “orphan” flares, gamma-ray flares with no optical counterpart or optical flares having no gamma-ray counterpart, in some of the sources. As seen in Figure 1, Figure 2 and Figure 3, a few sources in this investigation, for example, 1ES 0502+675 (MJD∼59750) and S3 1227+25 (MJD∼58600), also show “orphan” flares. The origin of these flares is uncertain but they have been interpreted as support for hadronic emission models (for example, [40]), evidence of multiple emission zones (for example, [19]) or a result of contamination in the optical regime due to accretion disk emission (for example, [41]).
Table 1. The final sample of Fermi-LAT northern blazars detected in the TeV regime, selected for this study along with their classification, right ascensions (RA), and declinations (DEC) in degrees, redshifts (z; shown as “–” for sources not having a verified redshift measurement). The final two columns list the times corresponding to the peaks of the Gaussian fit along with the associated uncertainties and their significance in percentile derived from Monte Carlo simulations. Listed below are the TeV detection references for each source in the sample.
SourceClassRADeczTimelagSignificance
[deg][deg] [days][%]
1ES 0502+675  [ a ] HBL76.967.60.340−9.75 ± 3.52≥68
W Comae  [ b ] IBL185.428.20.10274.78 ± 6.85≥99
VER J0521+211  [ c ] IBL80.421.2−236.07 ± 6.65≥95
S3 1227+25  [ d ] IBL187.625.320.71 ± 7.10≥99
1ES 0414+009  [ e ] HBL64.21.10.287−746.48 ± 5.34≥99
1ES 0806+524  [ f ] HBL122.552.30.138626.02 ± 6.65≥95
RXJ0648.7+1516  [ g ] HBL102.215.30.179466.59 ± 3.85≥95
3C 66A  [ h ] IBL35.743.00.3402.61 ± 2.67≥99
1ES 1215+303  [ i ] HBL184.530.10.131−56.10 ± 5.97≥99
RGB J0710+591  [ j ] EHBL107.659.10.125−130.00 ± 28.90≥68
1ES 1959+650  [ k ] HBL299.965.20.048−683.44 ± 9.26≥99
1ES 0229+200  [ l ] EHBL38.220.30.139331.57 ± 19.98≥68
1ES 1440+122  [ m ] HBL220.712.0−272.09 ± 2.03≥99
Mrk 421  [ n ] HBL166.138.20.03128.68 ± 7.08≥68
1ES 1218+304  [ o ] EHBL185.330.20.182−565.78 ± 2.09≥99
1ES 1011+496  [ p ] HBL153.849.40.212−122.25 ± 8.26≥99
Mrk 501  [ q ] HBL253.539.80.034−574.50 ± 9.65≥68
PKS 1424+240  [ r ] HBL216.823.8−581.28 ± 1.78≥99
TeV detection references: [a] VERITAS [42]; [b] VERITAS [43]; [c] VERITAS [44]; [d] VERITAS [45]; [e] H.E.S.S. [46]; [f] VERITAS [47]; [g] VERITAS [48]; [h] VERITAS [49]; [i] MAGIC [50]; [j] VERITAS [51]; [k] Utah [52]; [l] H.E.S.S. [53]; [m] VERITAS [54]; [n] Whipple [55]; [o] MAGIC [56]; [p] MAGIC [57]; [q] Whipple [58] and [r] MAGIC [59].

4. Conclusions

In this work, we present an investigation into possible correlations between ATLAS optical data and gamma-ray observations with the Fermi-LAT for a sample of 18 TeV-detected northern blazars, over 8 years of observations between 2015 and 2022. Overall, we find the optical and gamma-ray emission to be highly correlated in our sample, with varied time delays, ranging from timescales of days to even years for some sources. With the exception of one source, 1ES 1218+304, all the correlations are found to correspond to a significance of 68 % (∼ 1 σ ) and for nine sources the correlations are found to correspond to significance of 99 % (∼ 3 σ ).
The observed strong correlations support leptonic models of IC scattering gamma-ray emission in which the seed photons are scattered to higher energy in the relativistic jet by the same electrons responsible for synchrotron emission. It should be noted that the significance of the correlations and the corresponding time delays do not allow us to make strong conclusions on whether the seed photons are dominated by SSC or EIC radiation. However, the lack of clear trend towards lag or lead in our BL Lac sample agrees with the results presented in [24] and can be interpreted as evidence towards SSC being the dominant mechanism in BL Lac sources, as opposed to FSRQs which, in general, show the gamma-ray leading the optical emission, interpreted as evidence towards EIC emission being the dominant mechanism.
In conclusion, the gamma-ray optical correlation in BL Lac sources appears complex, as also seen in other variability studies (for example [21,24]). Multi-wavelength studies at high cadence over many years is needed to probe the emission mechanisms further and this will be possible with further coverage with ATLAS and other optical instruments in conjunction with the continued successful operation of the Fermi-LAT. Finally, we aim to perform a comprehensive study of the sample further investigating micro-variability in both energy bands in the future.

Author Contributions

Conceptualization, A.A. and A.C.S.; Methodology, A.A. and A.C.S.; Validation, A.C.S.; Formal analysis, A.A. and A.C.S.; Investigation, A.A.; Data curation, A.C.S.; Writing—original draft, A.A.; Writing—review & editing, A.C.S.; Supervision, A.C.S. All authors have read and agreed to the published version of the manuscript.

Funding

This work has made use of data from the Asteroid Terrestrial-impact Last Alert System (ATLAS) project. The Asteroid Terrestrial-impact Last Alert System (ATLAS) project is primarily funded to search for near earth asteroids through NASA grants NN12AR55G, 80NSSC18K0284, and 80NSSC18K1575; byproducts of the NEO search include images and catalogs from the survey area. This work was partially funded by Kepler/K2 grant J1944/80NSSC19K0112 and HST GO-15889, and STFC grants ST/T000198/1 and ST/S006109/1. AA acknowledges funding from NSF grant Award Number 1914579, WoU-MMA: Multi-Messenger Studies with Very-High-Energy Gamma Rays.

Acknowledgments

The ATLAS science products have been made possible through the contributions of the University of Hawaii Institute for Astronomy, the Queen’s University Belfast, the Space Telescope Science Institute, the South African Astronomical Observatory, and The Millennium Institute of Astrophysics (MAS), Chile.

Conflicts of Interest

The authors declare no conflict of interest.

Notes

1
http://tevcat2.uchicago.edu/ (accessed on 3 June 2023)
2
3
http://fermipy.readthedocs.io (accessed on 3 June 2023)
4
This was implemented using the gta.lightcurve() method in FERMIPY.
5
The code was developed from Connolly, S. D., 2016, Astrophysics Source Code Library, record ascl:1602.012. See https://github.com/samconnolly/DELightcurveSimulation, (accessed on 3 June 2023).

References

  1. Dermer, C.D.; Giebels, B. Active galactic nuclei at gamma-ray energies. C. R. Phys. 2016, 17, 594–616. [Google Scholar] [CrossRef]
  2. Gaidos, J.A.; Akerlof, C.W.; Biller, S.; Boyle, P.J.; Breslin, A.C.; Buckley, J.H.; Carter-Lewis, D.A.; Catanese, M.; Cawley, M.F.; Fegan, D.J.; et al. Extremely rapid bursts of TeV photons from the active galaxy Markarian 421. Nature 1996, 383, 319–320. [Google Scholar] [CrossRef] [Green Version]
  3. Aharonian, F.; Akhperjanian, A.G.; Anton, G.; Barres de Almeida, U.; Bazer-Bachi, A.R.; Becherini, Y.; Behera, B.; Benbow, W.; Bernlöhr, K.; Boisson, C.; et al. Simultaneous multiwavelength observations of the second exceptional γ-ray flare of PKS 2155-304 in July 2006. Astron. Astrophys. 2009, 502, 749–770. [Google Scholar] [CrossRef] [Green Version]
  4. Abeysekara, A.U.; Benbow, W.; Bird, R.; Brill, A.; Brose, R.; Buchovecky, M.; Buckley, J.H.; Christiansen, J.L.; Chromey, A.J.; Daniel, M.K.; et al. The Great Markarian 421 Flare of 2010 February: Multiwavelength Variability and Correlation Studies. Astrophys. J. 2020, 890, 97. [Google Scholar] [CrossRef] [Green Version]
  5. Aranzana, E.; Körding, E.; Uttley, P.; Scaringi, S.; Bloemen, S. Short time-scale optical variability properties of the largest AGN sample observed with Kepler/K2. Mon. Not. R. Astron. Soc. 2018, 476, 2501–2515. [Google Scholar] [CrossRef] [Green Version]
  6. Kim, J.; Karouzos, M.; Im, M.; Choi, C.; Kim, D.; Jun, H.D.; Lee, J.H.; Mezcua, M. Intra-Night Optical Variability of Active Galactic Nuclei in the Cosmos Field with the KMTNet. J. Korean Astron. Soc. 2018, 51, 89–110. [Google Scholar] [CrossRef]
  7. Goyal, A. A Comparative Study of Multiwavelength Blazar Variability on Decades to Minutes Timescales. Galaxies 2018, 6, 34. [Google Scholar] [CrossRef] [Green Version]
  8. Blandford, R.D.; Levinson, A. Pair Cascades in Extragalactic Jets. I. Gamma Rays. Astrophys. J. 1995, 441, 79. [Google Scholar] [CrossRef]
  9. Georganopoulos, M.; Aharonian, F.A.; Kirk, J.G. External Compton emission from relativistic jets in Galactic black hole candidates and ultraluminous X-ray sources. Astron. Astrophys. 2002, 388, L25–L28. [Google Scholar] [CrossRef]
  10. Sikora, M.; Begelman, M.C.; Rees, M.J. Comptonization of Diffuse Ambient Radiation by a Relativistic Jet: The Source of Gamma Rays from Blazars? Astrophys. J. 1994, 421, 153. [Google Scholar] [CrossRef]
  11. Böttcher, M.; Reimer, A.; Sweeney, K.; Prakash, A. Leptonic and Hadronic Modeling of Fermi-detected Blazars. Astrophys. J. 2013, 768, 54. [Google Scholar] [CrossRef] [Green Version]
  12. Mannheim, K.; Biermann, P.L. Gamma-ray flaring of 3C 279: A proton-initiated cascade in the jet? Astron. Astrophys. 1992, 253, L21–L24. [Google Scholar]
  13. Kovalev, Y.Y.; Kardashev, N.S.; Kellermann, K.I.; Lobanov, A.P.; Johnson, M.D.; Gurvits, L.I.; Voitsik, P.A.; Zensus, J.A.; Anderson, J.M.; Bach, U.; et al. RadioAstron Observations of the Quasar 3C273: A Challenge to the Brightness Temperature Limit. Astrophys. J. Lett. 2016, 820, L9. [Google Scholar] [CrossRef] [Green Version]
  14. Ghisellini, G.; Tavecchio, F. Canonical high-power blazars. Mon. Not. R. Astron. Soc. 2009, 397, 985–1002. [Google Scholar] [CrossRef]
  15. Dermer, C.D.; Finke, J.D.; Krug, H.; Böttcher, M. Gamma-Ray Studies of Blazars: Synchro-Compton Analysis of Flat Spectrum Radio Quasars. Astrophys. J. 2009, 692, 32–46. [Google Scholar] [CrossRef] [Green Version]
  16. Foschini, L.; Ghisellini, G.; Tavecchio, F.; Bonnoli, G.; Stamerra, A. Search for the shortest variability at gamma rays in flat-spectrum radio quasars. Astron. Astrophys. 2011, 530, A77. [Google Scholar] [CrossRef] [Green Version]
  17. Donea, A.C.; Protheroe, R.J. Gamma Ray and Infrared Emission from the M87 Jet and Torus. Prog. Theor. Phys. Suppl. 2003, 151, 186–191. [Google Scholar] [CrossRef] [Green Version]
  18. Liu, H.T.; Bai, J.M. Absorption of 10-200 GeV Gamma Rays by Radiation from Broad-Line Regions in Blazars. Astrophys. J. 2006, 653, 1089–1097. [Google Scholar] [CrossRef] [Green Version]
  19. Acharyya, A.; Chadwick, P.M.; Brown, A.M. Locating the gamma-ray emission region in the brightest Fermi-LAT flat-spectrum radio quasars. Mon. Not. R. Astron. Soc. 2021, 500, 5297–5321. [Google Scholar] [CrossRef]
  20. Liodakis, I.; Romani, R.W.; Filippenko, A.V.; Kocevski, D.; Zheng, W. Probing Blazar Emission Processes with Optical/Gamma-Ray Flare Correlations. Astrophys. J. 2019, 880, 32. [Google Scholar] [CrossRef] [Green Version]
  21. de Jaeger, T.; Shappee, B.J.; Kochanek, C.S.; Hinkle, J.T.; Garrappa, S.; Liodakis, I.; Franckowiak, A.; Stanek, K.Z.; Beacom, J.F.; Prieto, J.L. Optical/γ-ray blazar flare correlations: Understanding the high-energy emission process using ASAS-SN and Fermi light curves. Mon. Not. R. Astron. Soc. 2023, 519, 6349–6380. [Google Scholar] [CrossRef]
  22. Krawczynski, H.; Hughes, S.B.; Horan, D.; Aharonian, F.; Aller, M.F.; Aller, H.; Boltwood, P.; Buckley, J.; Coppi, P.; Fossati, G.; et al. Multiwavelength Observations of Strong Flares from the TeV Blazar 1ES 1959+650. Astrophys. J. 2004, 601, 151–164. [Google Scholar] [CrossRef]
  23. Atwood, W.B.; Abdo, A.A.; Ackermann, M.; Althouse, W.; Anderson, B.; Axelsson, M.; Baldini, L.; Ballet, J.; Band, D.L.; Barbiellini, G.; et al. The Large Area Telescope on the Fermi Gamma-Ray Space Telescope Mission. Astrophys. J. 2009, 697, 1071–1102. [Google Scholar] [CrossRef] [Green Version]
  24. Cohen, D.P.; Romani, R.W.; Filippenko, A.V.; Cenko, S.B.; Lott, B.; Zheng, W.; Li, W. Temporal correlations between optical and gamma-ray activity in blazars. Astrophys. J. 2014, 797, 137. [Google Scholar] [CrossRef] [Green Version]
  25. Fuhrmann, L.; Larsson, S.; Chiang, J.; Angelakis, E.; Zensus, J.A.; Nestoras, I.; Krichbaum, T.Â.P.; Ungerechts, H.; Sievers, A.; Pavlidou, V.; et al. Detection of significant cm to sub-mm band radio and γ-ray correlated variability in Fermi bright blazars. Mon. Not. R. Astron. Soc. 2014, 441, 1899–1909. [Google Scholar] [CrossRef] [Green Version]
  26. Max-Moerbeck, W.; Hovatta, T.; Richards, J.L.; King, O.G.; Pearson, T.J.; Readhead, A.C.S.; Reeves, R.; Shepherd, M.C.; Stevenson, M.A.; Angelakis, E.; et al. Time correlation between the radio and gamma-ray activity in blazars and the production site of the gamma-ray emission. Mon. Not. R. Astron. Soc. 2014, 445, 428–436. [Google Scholar] [CrossRef] [Green Version]
  27. Tonry, J.L.; Denneau, L.; Heinze, A.N.; Stalder, B.; Smith, K.W.; Smartt, S.J.; Stubbs, C.W.; Weiland, H.J.; Rest, A. ATLAS: A High-cadence All-sky Survey System. Publ. Astron. Soc. Pac. 2018, 130, 064505. [Google Scholar] [CrossRef] [Green Version]
  28. Welsh, W.F. On the Reliability of Cross-Correlation Function Lag Determinations in Active Galactic Nuclei. Publ. Astron. Soc. Pac. 1999, 111, 1347–1366. [Google Scholar] [CrossRef] [Green Version]
  29. Sadun, A.C.; Asadi-Zeydabadi, M.; Mills, B.; Moody, J.W. Statistical Analysis of the Microvariable AGN Source Mrk 501. Galaxies 2018, 6, 20. [Google Scholar] [CrossRef] [Green Version]
  30. Smith, K.W.; Smartt, S.J.; Young, D.R.; Tonry, J.L.; Denneau, L.; Flewelling, H.; Heinze, A.N.; Weiland, H.J.; Stalder, B.; Rest, A.; et al. Design and Operation of the ATLAS Transient Science Server. Publ. Astron. Soc. Pac. 2020, 132, 085002. [Google Scholar] [CrossRef]
  31. Heinze, A.N.; Tonry, J.L.; Denneau, L.; Flewelling, H.; Stalder, B.; Rest, A.; Smith, K.W.; Smartt, S.J.; Weiland, H. A First Catalog of Variable Stars Measured by the Asteroid Terrestrial-impact Last Alert System (ATLAS). Astron. J. 2018, 156, 241. [Google Scholar] [CrossRef] [Green Version]
  32. Wood, M.; Caputo, R.; Charles, E.; Di Mauro, M.; Magill, J.; Perkins, J.S.; Fermi-LAT Collaboration. Fermipy: An open-source Python package for analysis of Fermi-LAT Data. In Proceedings of the 35th International Cosmic Ray Conference (ICRC2017), Busan, Republic of Korea, 12–20 July 2017; Volume 301, p. 824. [Google Scholar]
  33. Atwood, W.; Albert, A.; Baldini, L.; Tinivella, M.; Bregeon, J.; Pesce-Rollins, M.; Sgrò, C.; Bruel, P.; Charles, E.; Drlica-Wagner, A.; et al. Pass 8: Toward the Full Realization of the Fermi-LAT Scientific Potential. arXiv 2013, arXiv:1303.3514. [Google Scholar]
  34. Fermi-LAT collaboration; Abdollahi, S.; Acero, F.; Baldini, L.; Ballet, J.; Bastieri, D.; Bellazzini, R.; Berenji, B.; Berretta, A.; Bissaldi, E.; et al. Incremental Fermi Large Area Telescope Fourth Source Catalog. arXiv 2022, arXiv:2201.11184. [Google Scholar]
  35. Meyer, M.; Scargle, J.D.; Blandford, R.D. Characterizing the Gamma-Ray Variability of the Brightest Flat Spectrum Radio Quasars Observed with the Fermi LAT. Astrophys. J. 2019, 877, 39. [Google Scholar] [CrossRef] [Green Version]
  36. Max-Moerbeck, W.; Richards, J.L.; Hovatta, T.; Pavlidou, V.; Pearson, T.J.; Readhead, A.C.S. A method for the estimation of the significance of cross-correlations in unevenly sampled red-noise time series. Mon. Not. R. Astron. Soc. 2014, 445, 437–459. [Google Scholar] [CrossRef] [Green Version]
  37. Edelson, R.A.; Krolik, J.H. The Discrete Correlation Function: A New Method for Analyzing Unevenly Sampled Variability Data. Astrophys. J. 1988, 333, 646. [Google Scholar] [CrossRef]
  38. Uttley, P.; Edelson, R.; McHardy, I.M.; Peterson, B.M.; Markowitz, A. Correlated Long-Term Optical and X-Ray Variations in NGC 5548. Astrophys. J. 2003, 584, L53–L56. [Google Scholar] [CrossRef]
  39. Emmanoulopoulos, D.; McHardy, I.M.; Papadakis, I.E. Generating artificial light curves: Revisited and updated. Mon. Not. R. Astron. Soc. 2013, 433, 907–927. [Google Scholar] [CrossRef] [Green Version]
  40. Böttcher, M. Modeling the emission processes in blazars. Astrophys. Space Sci. 2007, 309, 95–104. [Google Scholar] [CrossRef]
  41. Ackermann, M.; Ajello, M.; Allafort, A.; Antolini, E.; Barbiellini, G.; Bastieri, D.; Bellazzini, R.; Bissaldi, E.; Bonamente, E.; Bregeon, J.; et al. Multifrequency Studies of the Peculiar Quasar 4C +21.35 during the 2010 Flaring Activity. Astrophys. J. 2014, 786, 157. [Google Scholar] [CrossRef] [Green Version]
  42. Ong, R.A. Discovery of VHE Gamma-Ray Emission from the Fermi-LAT Source 1ES 0502+675. Astron. Telegr. 2009, 2301, 1. [Google Scholar]
  43. Acciari, V.A.; Aliu, E.; Beilicke, M.; Benbow, W.; Böttcher, M.; Bradbury, S.M.; Buckley, J.H.; Bugaev, V.; Butt, Y.; Celik, O.; et al. VERITAS Discovery of >200 GeV Gamma-Ray Emission from the Intermediate-Frequency-Peaked BL Lacertae Object W Comae. Astrophys. J. 2008, 684, L73. [Google Scholar] [CrossRef]
  44. Ong, R.A. VERITAS reports a High Gamma-ray Flux from VER J0521+211. Astron. Telegr. 2009, 2309, 1. [Google Scholar]
  45. Acharyya, A.; Adams, C.; Archer, A.; Bangale, P.; Benbow, W.; Brill, A.; Christiansen, J.; Chromey, A.; Errando, M.; Falcone, A.; et al. VERITAS discovery of very high energy gamma-ray emission from S3 1227+25 and multiwavelength observations. arXiv 2023, arXiv:2305.02860. [Google Scholar] [CrossRef]
  46. Collaboration, H.E.S.S.; Abramowski, A.; Acero, F.; Aharonian, F.; Akhperjanian, A.G.; Anton, G.; Balzer, A.; Barnacka, A.; Barres de Almeida, U.; Becherini, Y.; et al. Discovery of hard-spectrum γ-ray emission from the BL Lacertae object 1ES 0414+009. Astron. Astrophys. 2012, 538, A103. [Google Scholar] [CrossRef] [Green Version]
  47. Acciari, V.; Aliu, E.; Arlen, T.; Bautista, M.; Beilicke, M.; Benbow, W.; Böttcher, M.; Bradbury, S.M.; Buckley, J.H.; Bugaev, V.; et al. Discovery of Very High Energy Gamma-ray Radiation from the BL Lac 1ES 0806+524. Astrophys. J. 2009, 690, L126–L129. [Google Scholar] [CrossRef]
  48. Ong, R.A.; VERITAS Collaboration; Paneque, D.; Fermi Large Area Telescope. VERITAS Discovery of Very High-Energy Gamma-Ray Emission from 1FGL J0648.8+1516. Astron. Telegr. 2010, 2486, 1. [Google Scholar]
  49. Swordy, S. Discovery of >100 GeV Gamma-ray Emission from the Blazar 3C66A by VERITAS. Astron. Telegr. 2008, 1753, 1. [Google Scholar]
  50. Mariotti, M. Discovery of Very High Energy Gamma-Ray Emission from 1ES 1215+303 by MAGIC. Astron. Telegr. 2011, 3100, 1. [Google Scholar]
  51. Ong, R. VERITAS Discovery of VHE Gamma-Ray Emission from BL Lac object RGB J0710+591. Astron. Telegr. 2009, 1941, 1. [Google Scholar]
  52. Nishiyama, T. Detection of a new TeV gamma-ray source of BL Lac object 1ES 1959+650. In Proceedings of the 26th International Cosmic Ray Conference (ICRC26), Salt Lake City, UT, USA, 17–25 August 1999; Volume 3, p. 370. [Google Scholar]
  53. Aharonian, F.; Akhperjanian, A.G.; Barres de Almeida, U.; Bazer-Bachi, A.R.; Behera, B.; Beilicke, M.; Benbow, W.; Bernlöhr, K.; Boisson, C.; Bolz, O.; et al. New constraints on the mid-IR EBL from the HESS discovery of VHE γ-rays from 1ES 0229+200. Astron. Astrophys. 2007, 475, L9–L13. [Google Scholar] [CrossRef] [Green Version]
  54. Ong, R.A. Discovery of Very High Energy Gamma-ray Emission from the Blazar 1ES 1440+122. Astron. Telegr. 2010, 2786, 1. [Google Scholar]
  55. Punch, M.; Akerlof, C.W.; Cawley, M.F.; Chantell, M.; Fegan, D.J.; Fennell, S.; Gaidos, J.A.; Hagan, J.; Hillas, A.M.; Jiang, Y.; et al. Detection of TeV photons from the active galaxy Markarian 421. Nature 1992, 358, 477–478. [Google Scholar] [CrossRef] [Green Version]
  56. Albert, J.; Aliu, E.; Anderhub, H.; Antoranz, P.; Armada, A.; Asensio, M.; Baixeras, C.; Barrio, J.A.; Bartelt, M.; Bartko, H.; et al. Discovery of Very High Energy Gamma Rays from 1ES 1218+30.4. Astrophys. J. 2006, 642, L119–L122. [Google Scholar] [CrossRef] [Green Version]
  57. Albert, J.; Aliu, E.; Anderhub, H.; Antoranz, P.; Armada, A.; Baixeras, C.; Barrio, J.A.; Bartko, H.; Bastieri, D.; Becker, J.K.; et al. Discovery of Very High Energy γ-Rays from 1ES 1011+496 at z = 0.212. Astrophys. J. 2007, 667, L21–L24. [Google Scholar] [CrossRef] [Green Version]
  58. Quinn, J.; Akerlof, C.W.; Biller, S.; Buckley, J.; Carter-Lewis, D.A.; Cawley, M.F.; Catanese, M.; Connaughton, V.; Fegan, D.J.; Finley, J.P.; et al. Detection of Gamma Rays with E > 300 GeV from Markarian 501. Astrophys. J. 1996, 456, L83. [Google Scholar] [CrossRef]
  59. Acciari, V.A.; Aliu, E.; Arlen, T.; Aune, T.; Bautista, M.; Beilicke, M.; Benbow, W.; Böttcher, M.; Boltuch, D.; Bradbury, S.M.; et al. Discovery of Very High Energy Gamma Rays from PKS 1424+240 and Multiwavelength Constraints on Its Redshift. Astrophys. J. Lett. 2010, 708, L100–L106. [Google Scholar] [CrossRef]
Figure 1. Left: Optical flux observations for 1ES 0502+675, W Comae, VER J0521+211, S3 1227+25, 1ES 0414+009, and 1ES 0806+524 between 9 December 2014 (MJD 57000 ) and 1 January 2023 (MJD 59945) obtained with ATLAS in the R band data. The errors are purely statistical. Right: The corresponding gamma-ray lightcurves for 1ES 0502+675, W Comae, VER J0521+211, S3 1227+25, 1ES 0414+009, and 1ES 0806+524 between 9 December 2014 (MJD 57000) and 1 January 2023 (MJD 59945) binned in monthly periods. The errors are purely statistical and only data points with TS ≥ 10 are shown.
Galaxies 11 00081 g001
Figure 2. Left: Optical flux observations for RX J0648.7+1516, 3C 66A, 1ES 1215+303, RGB J0710+591, 1ES 1959+650, and 1ES 0229+200 between 9 December 2014 (MJD 57000) and 1 January 2023 (MJD 59945) obtained with ATLAS in the R band data. The errors are purely statistical. Right: The corresponding gamma-ray lightcurves for RX J0648.7+1516, 3C 66A, 1ES 1215+303, RGB J0710+591, 1ES 1959+650, and 1ES 0229+200 between 9 December 2014 (MJD 57000) and 1 January 2023 (MJD 59945) binned in monthly periods. The errors are purely statistical and only data points with TS ≥ 10 are shown.
Galaxies 11 00081 g002
Figure 3. Left: Optical flux observations for 1ES 1440+122, Mrk 421, 1ES 1218+304, 1ES 1011+496, Mrk 501, and PKS 1424+240 between 9 December 2014 (MJD 57000) and 1 January 2023 (MJD 59945) obtained with ATLAS in the R band data. The errors are purely statistical. Right: The corresponding gamma-ray lightcurves for 1ES 1440+122, Mrk 421, 1ES 1218+304, 1ES 1011+496, Mrk 501, and PKS 1424+240 between 9 December 2014 (MJD 57000) and 1 January 2023 (MJD 59945) binned in monthly periods. The errors are purely statistical and only data points with TS ≥ 10 are shown.
Galaxies 11 00081 g003
Figure 4. Local cross-correlation functions (LCCFs) calculated between the Fermi-LAT and ATLAS lightcurves for 1ES 0502+675, W Comae, VER J0521+211, S3 1227+25, 1ES 0414+009, and 1ES 0806+524. The x-axis represents the time delay, Δ t ATLAS , Fermi = t ATLAS t Fermi , in days for two lightcurves ATLAS and Fermi-LAT. The dashed vertical line corresponds to Δ t ATLAS , Fermi = 0 . The corresponding shaded regions indicate the error bounds of the LCCFs. The blue lines represent the 68%, 95%, and 99% confidence intervals (from lighter to darker shades) derived from Monte Carlo simulations.
Galaxies 11 00081 g004
Figure 5. Top: Local cross-correlation functions (LCCFs) calculated between the Fermi-LAT and ATLAS lightcurves for RX J0648.7+1516, 3C 66A, 1ES 1215+303, RGB J0710+591, 1ES 1959+650, and 1ES 0229+200. The x-axis represents the time delay, Δ t ATLAS , Fermi = t ATLAS t Fermi , in days for two lightcurves ATLAS and Fermi-LAT. The dashed vertical line corresponds to Δ t ATLAS , Fermi = 0 . The corresponding shaded regions indicate the error bounds of the LCCFs. The blue lines represent the 68%, 95%, and 99% confidence intervals (from lighter to darker shades) derived from Monte Carlo simulations. Bottom: Local cross-correlation functions (LCCFs) calculated between the Fermi-LAT and ATLAS lightcurves for 1ES 1440+122, Mrk 421, 1ES 1218+304, 1ES 1011+496, Mrk 501, and PKS 1424+240. The x-axis represents the time delay, Δ t ATLAS , Fermi = t ATLAS t Fermi , in days for two lightcurves ATLAS and Fermi-LAT. The dashed vertical line corresponds to Δ t ATLAS , Fermi = 0 . The corresponding shaded regions indicate the error bounds of the LCCFs. The blue lines represent the 68%, 95%, and 99% confidence intervals (from lighter to darker shades) derived from Monte Carlo simulations.
Galaxies 11 00081 g005
Disclaimer/Publisher’s Note: The statements, opinions and data contained in all publications are solely those of the individual author(s) and contributor(s) and not of MDPI and/or the editor(s). MDPI and/or the editor(s) disclaim responsibility for any injury to people or property resulting from any ideas, methods, instructions or products referred to in the content.

