
Isolating an Outflow Component in Single-Epoch Spectra of Quasars


Abstract
1. Introduction
2. Data
3. Analysis
4. Results
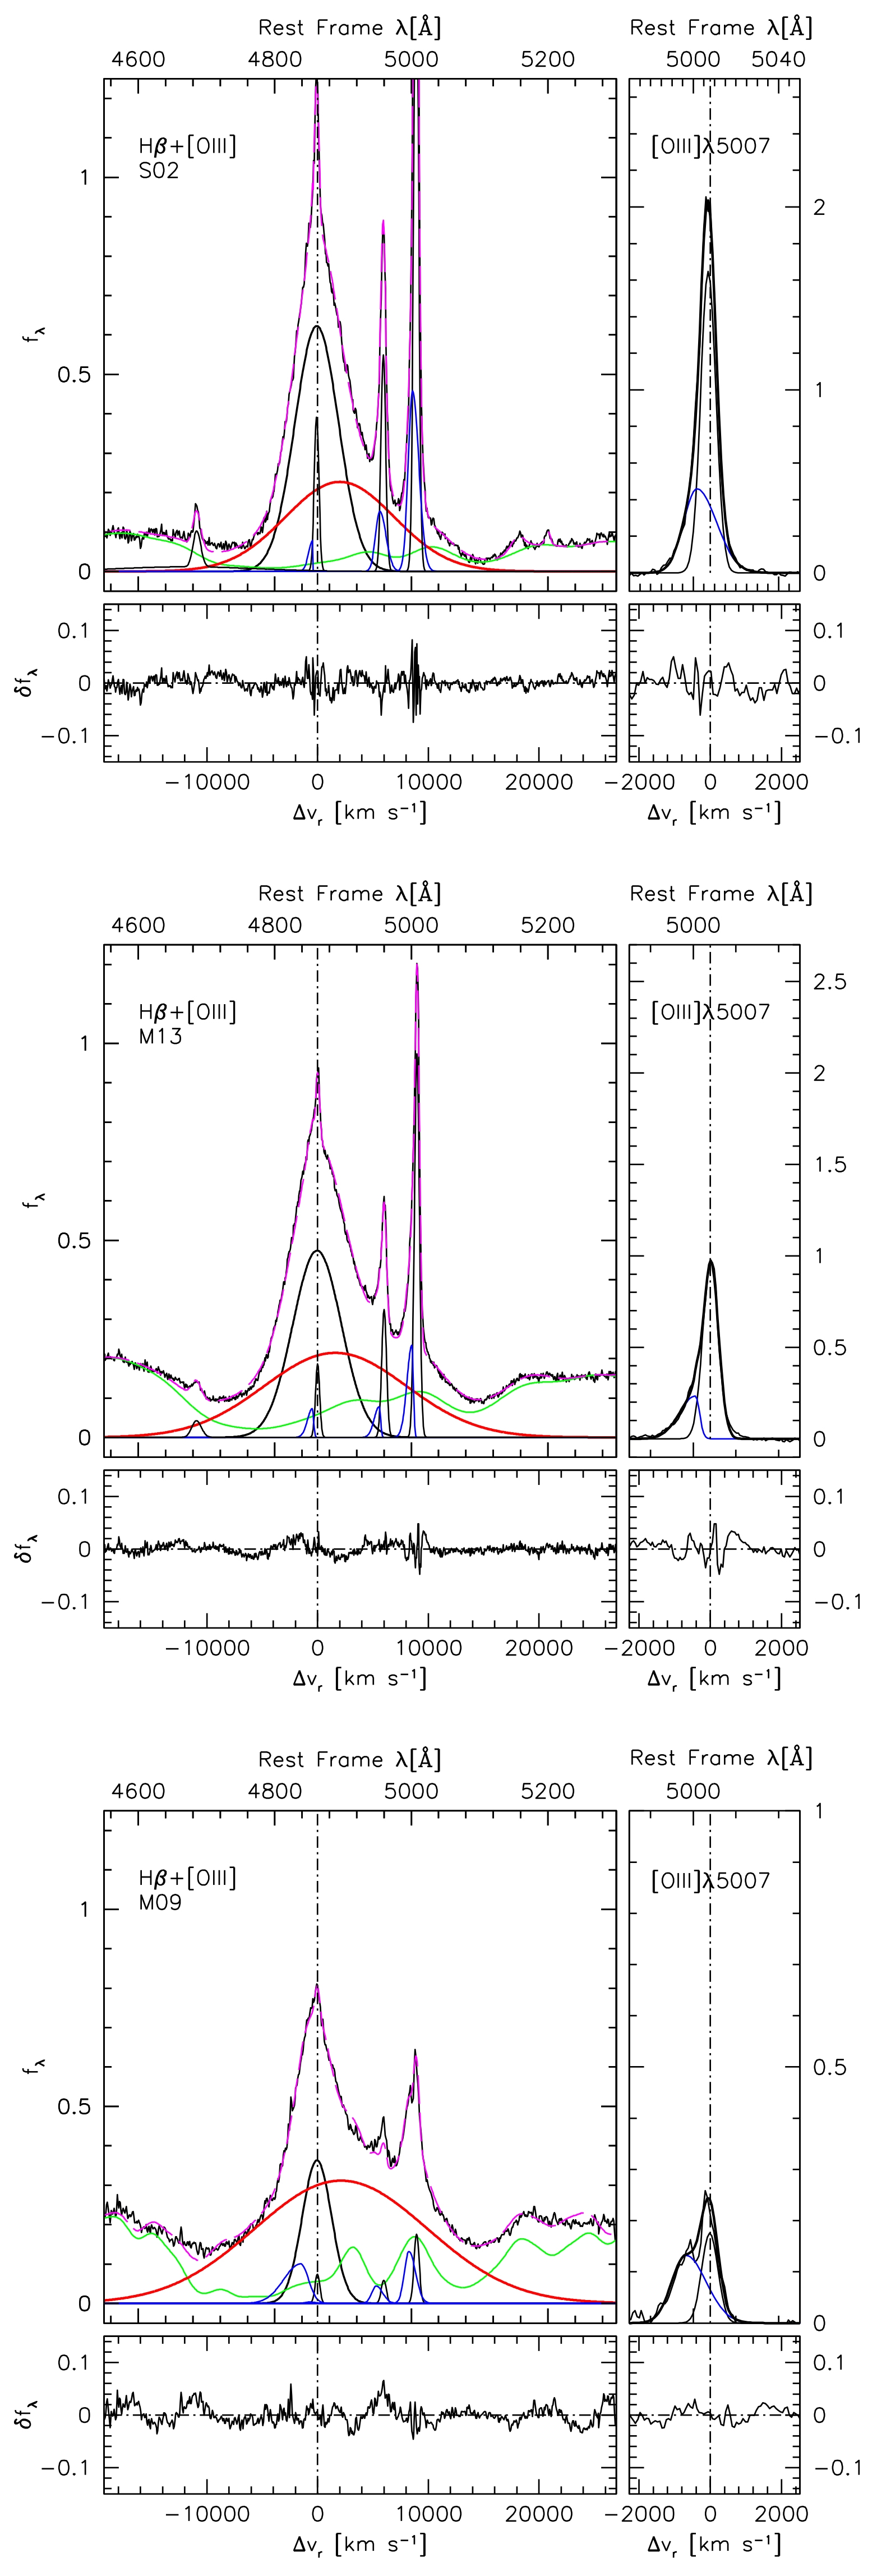
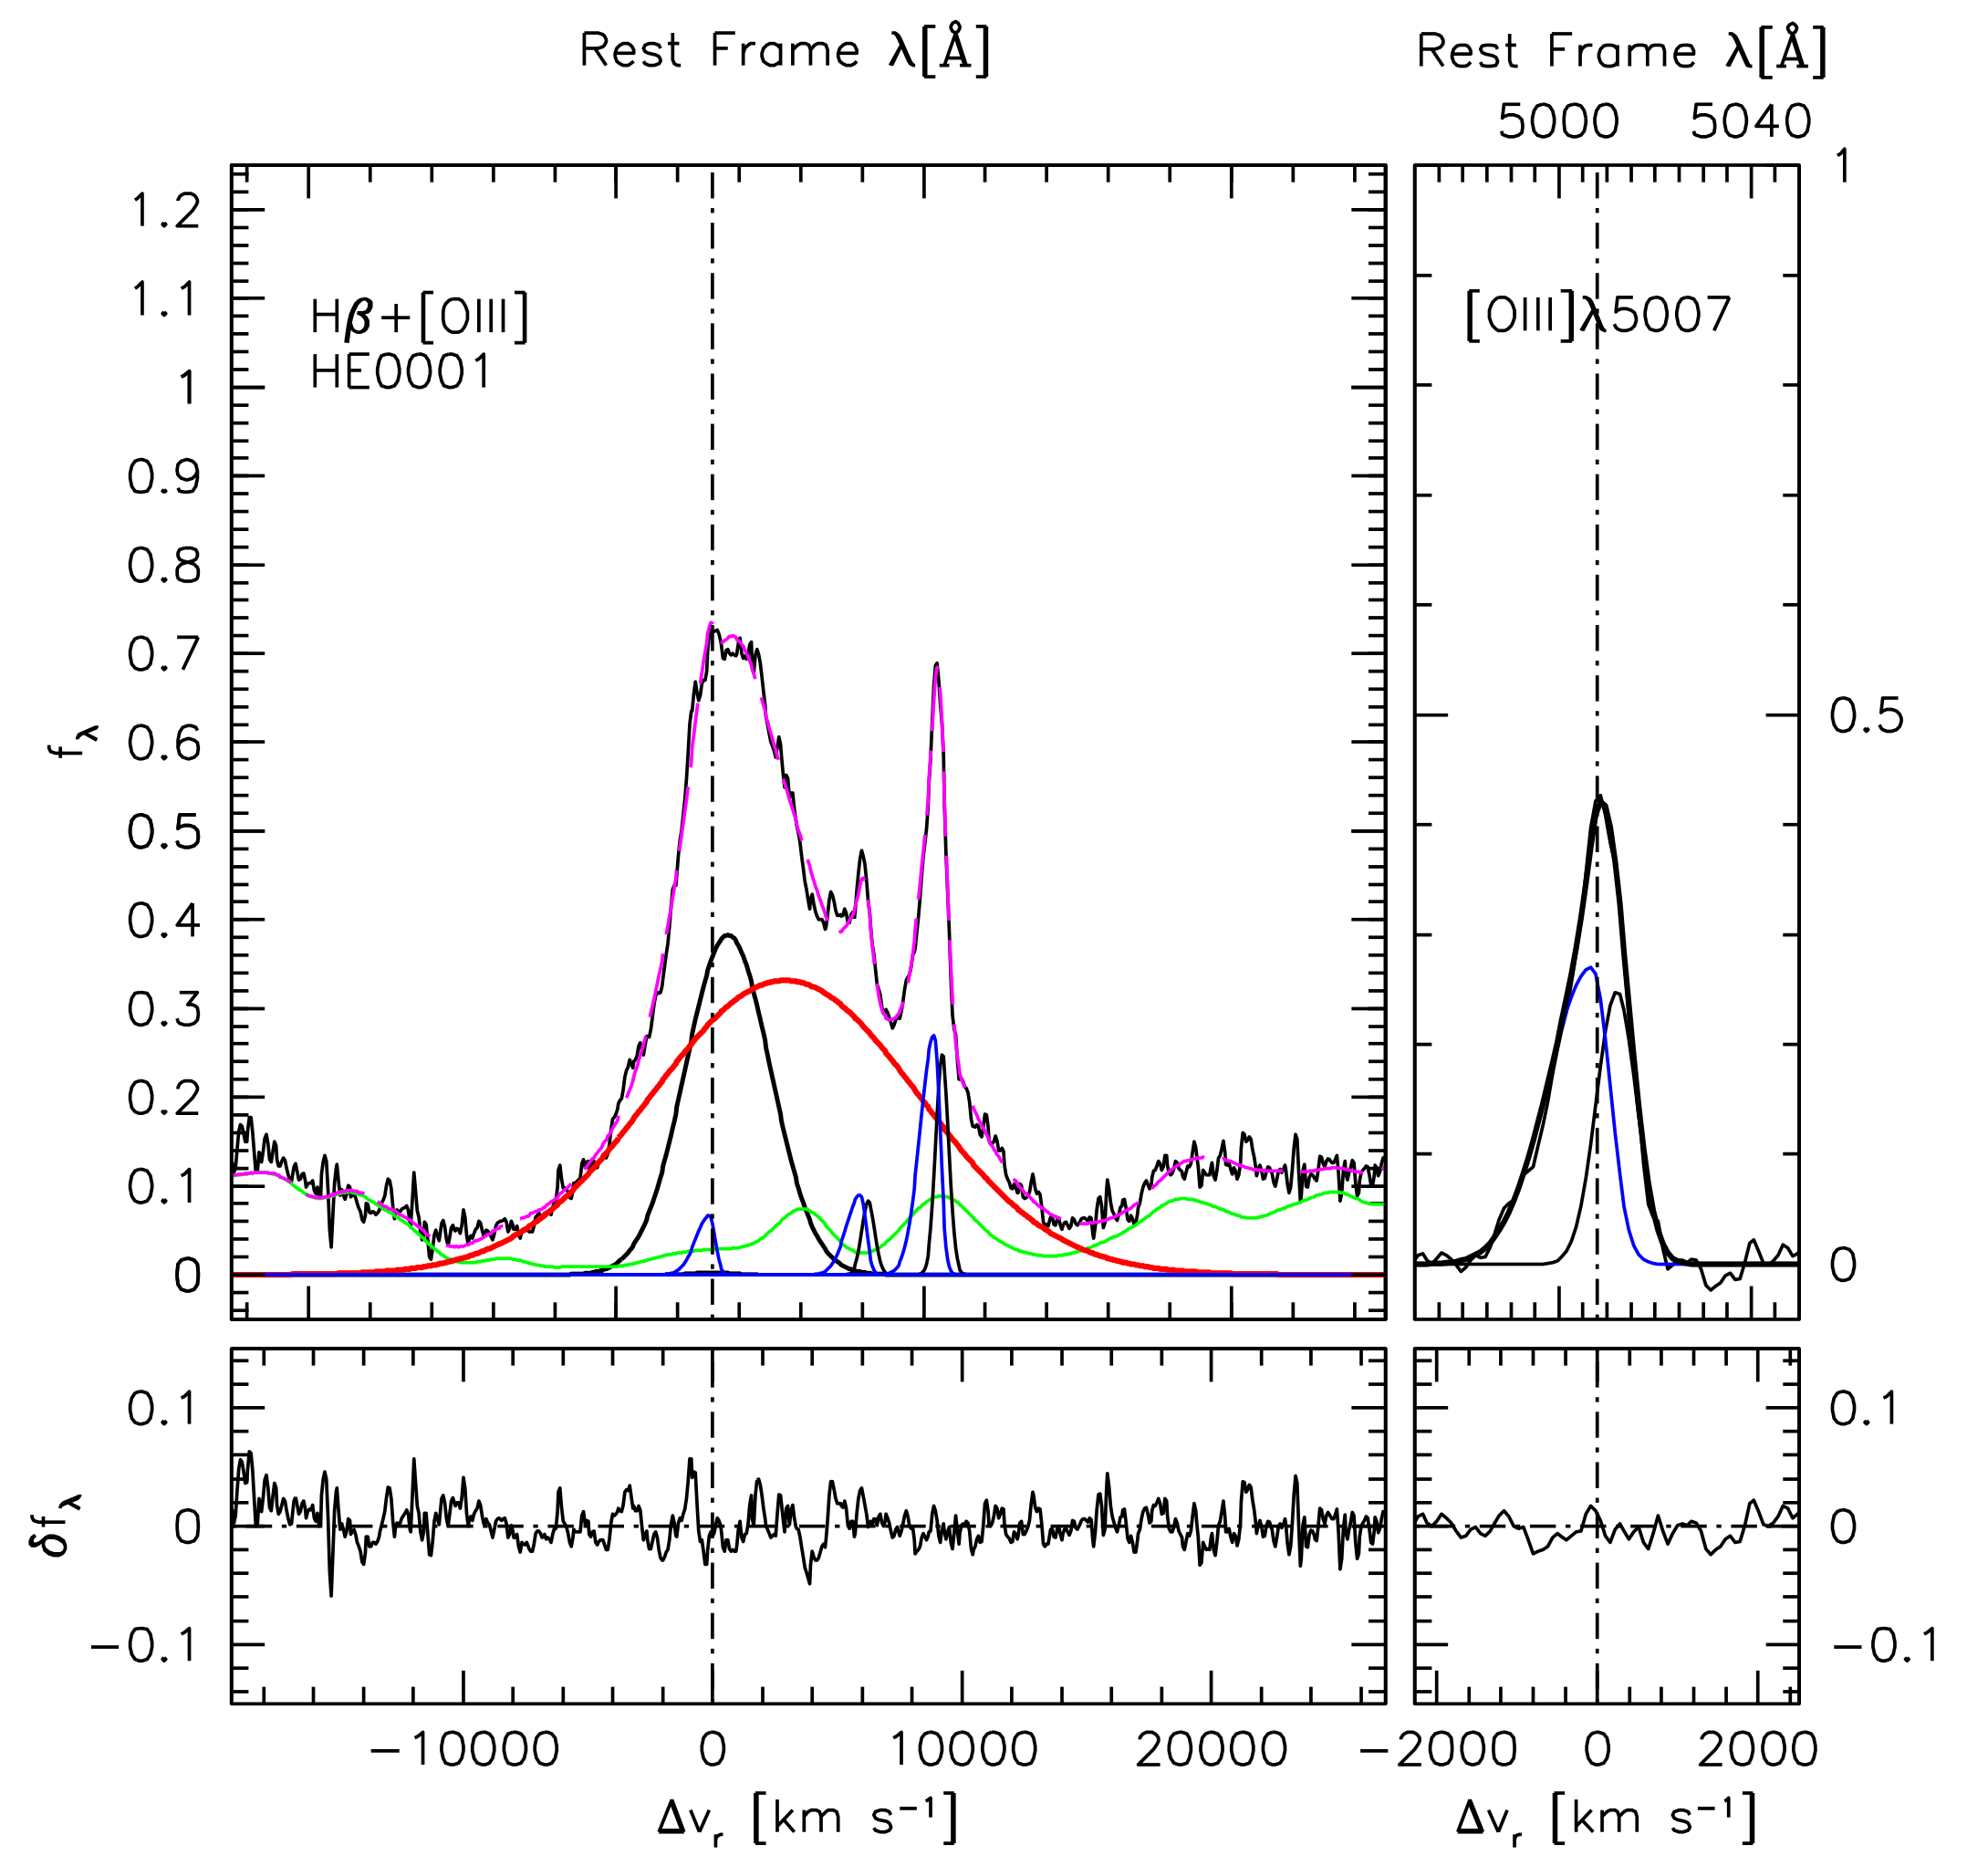
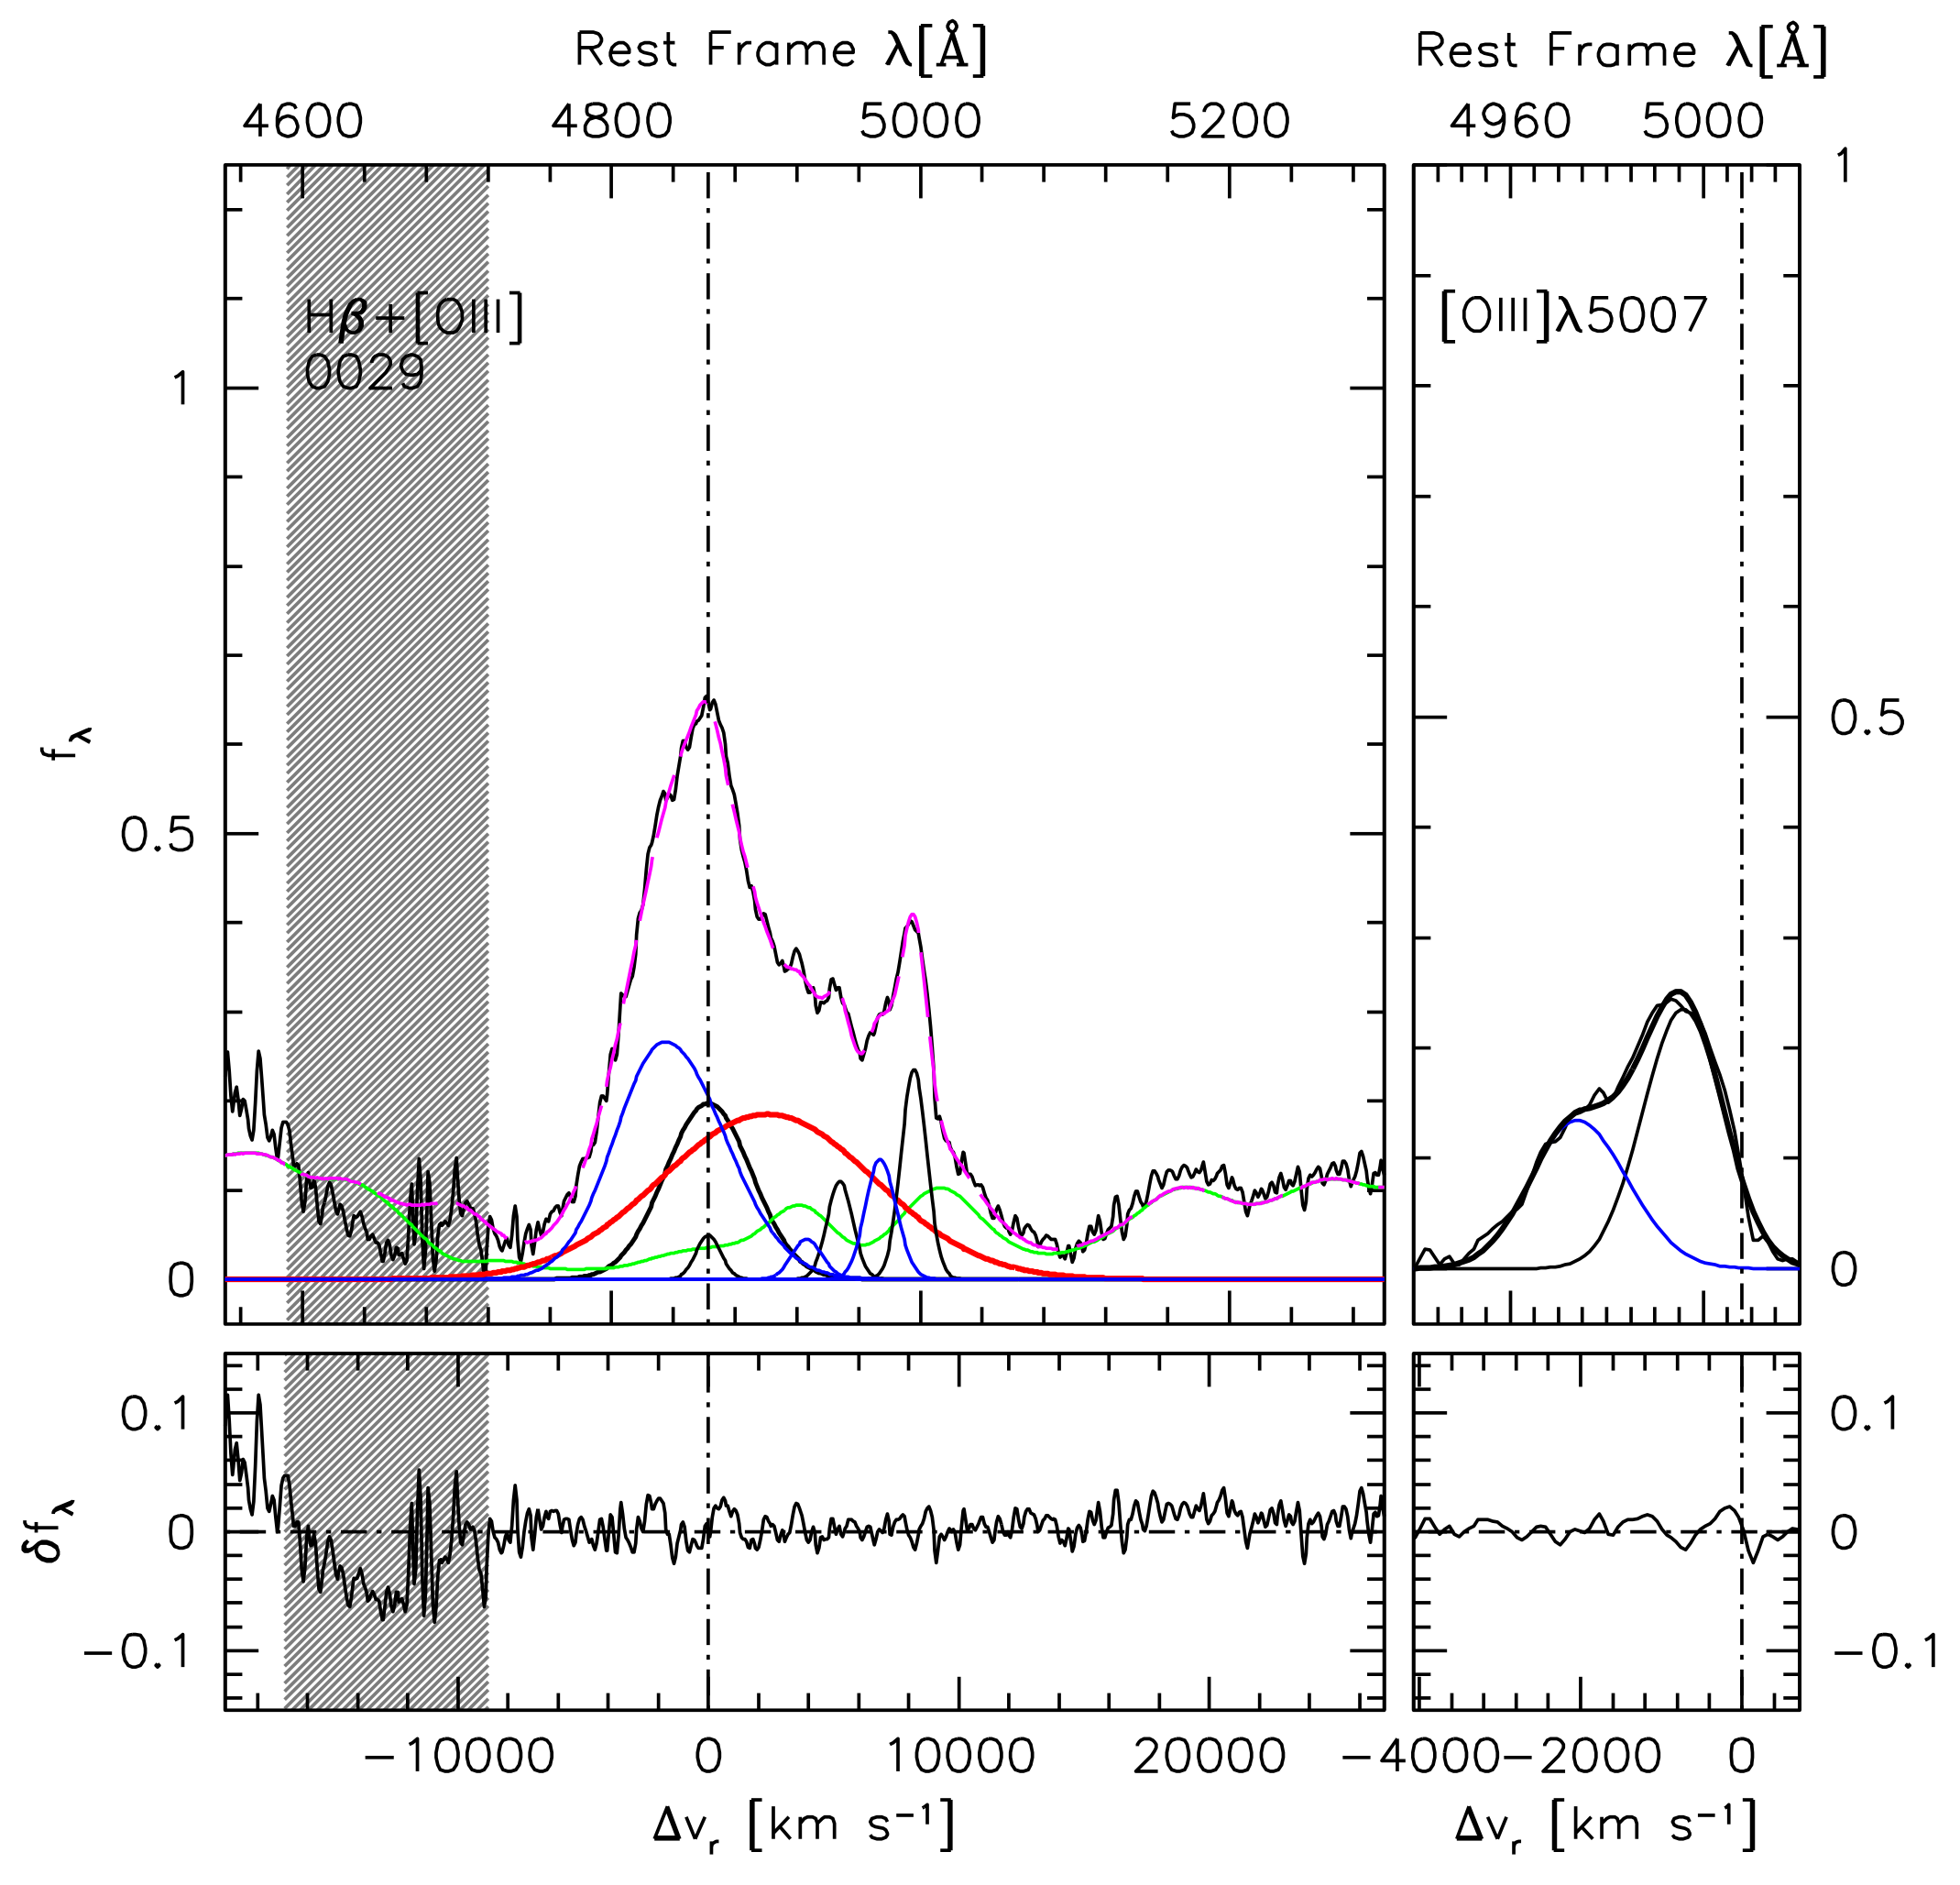
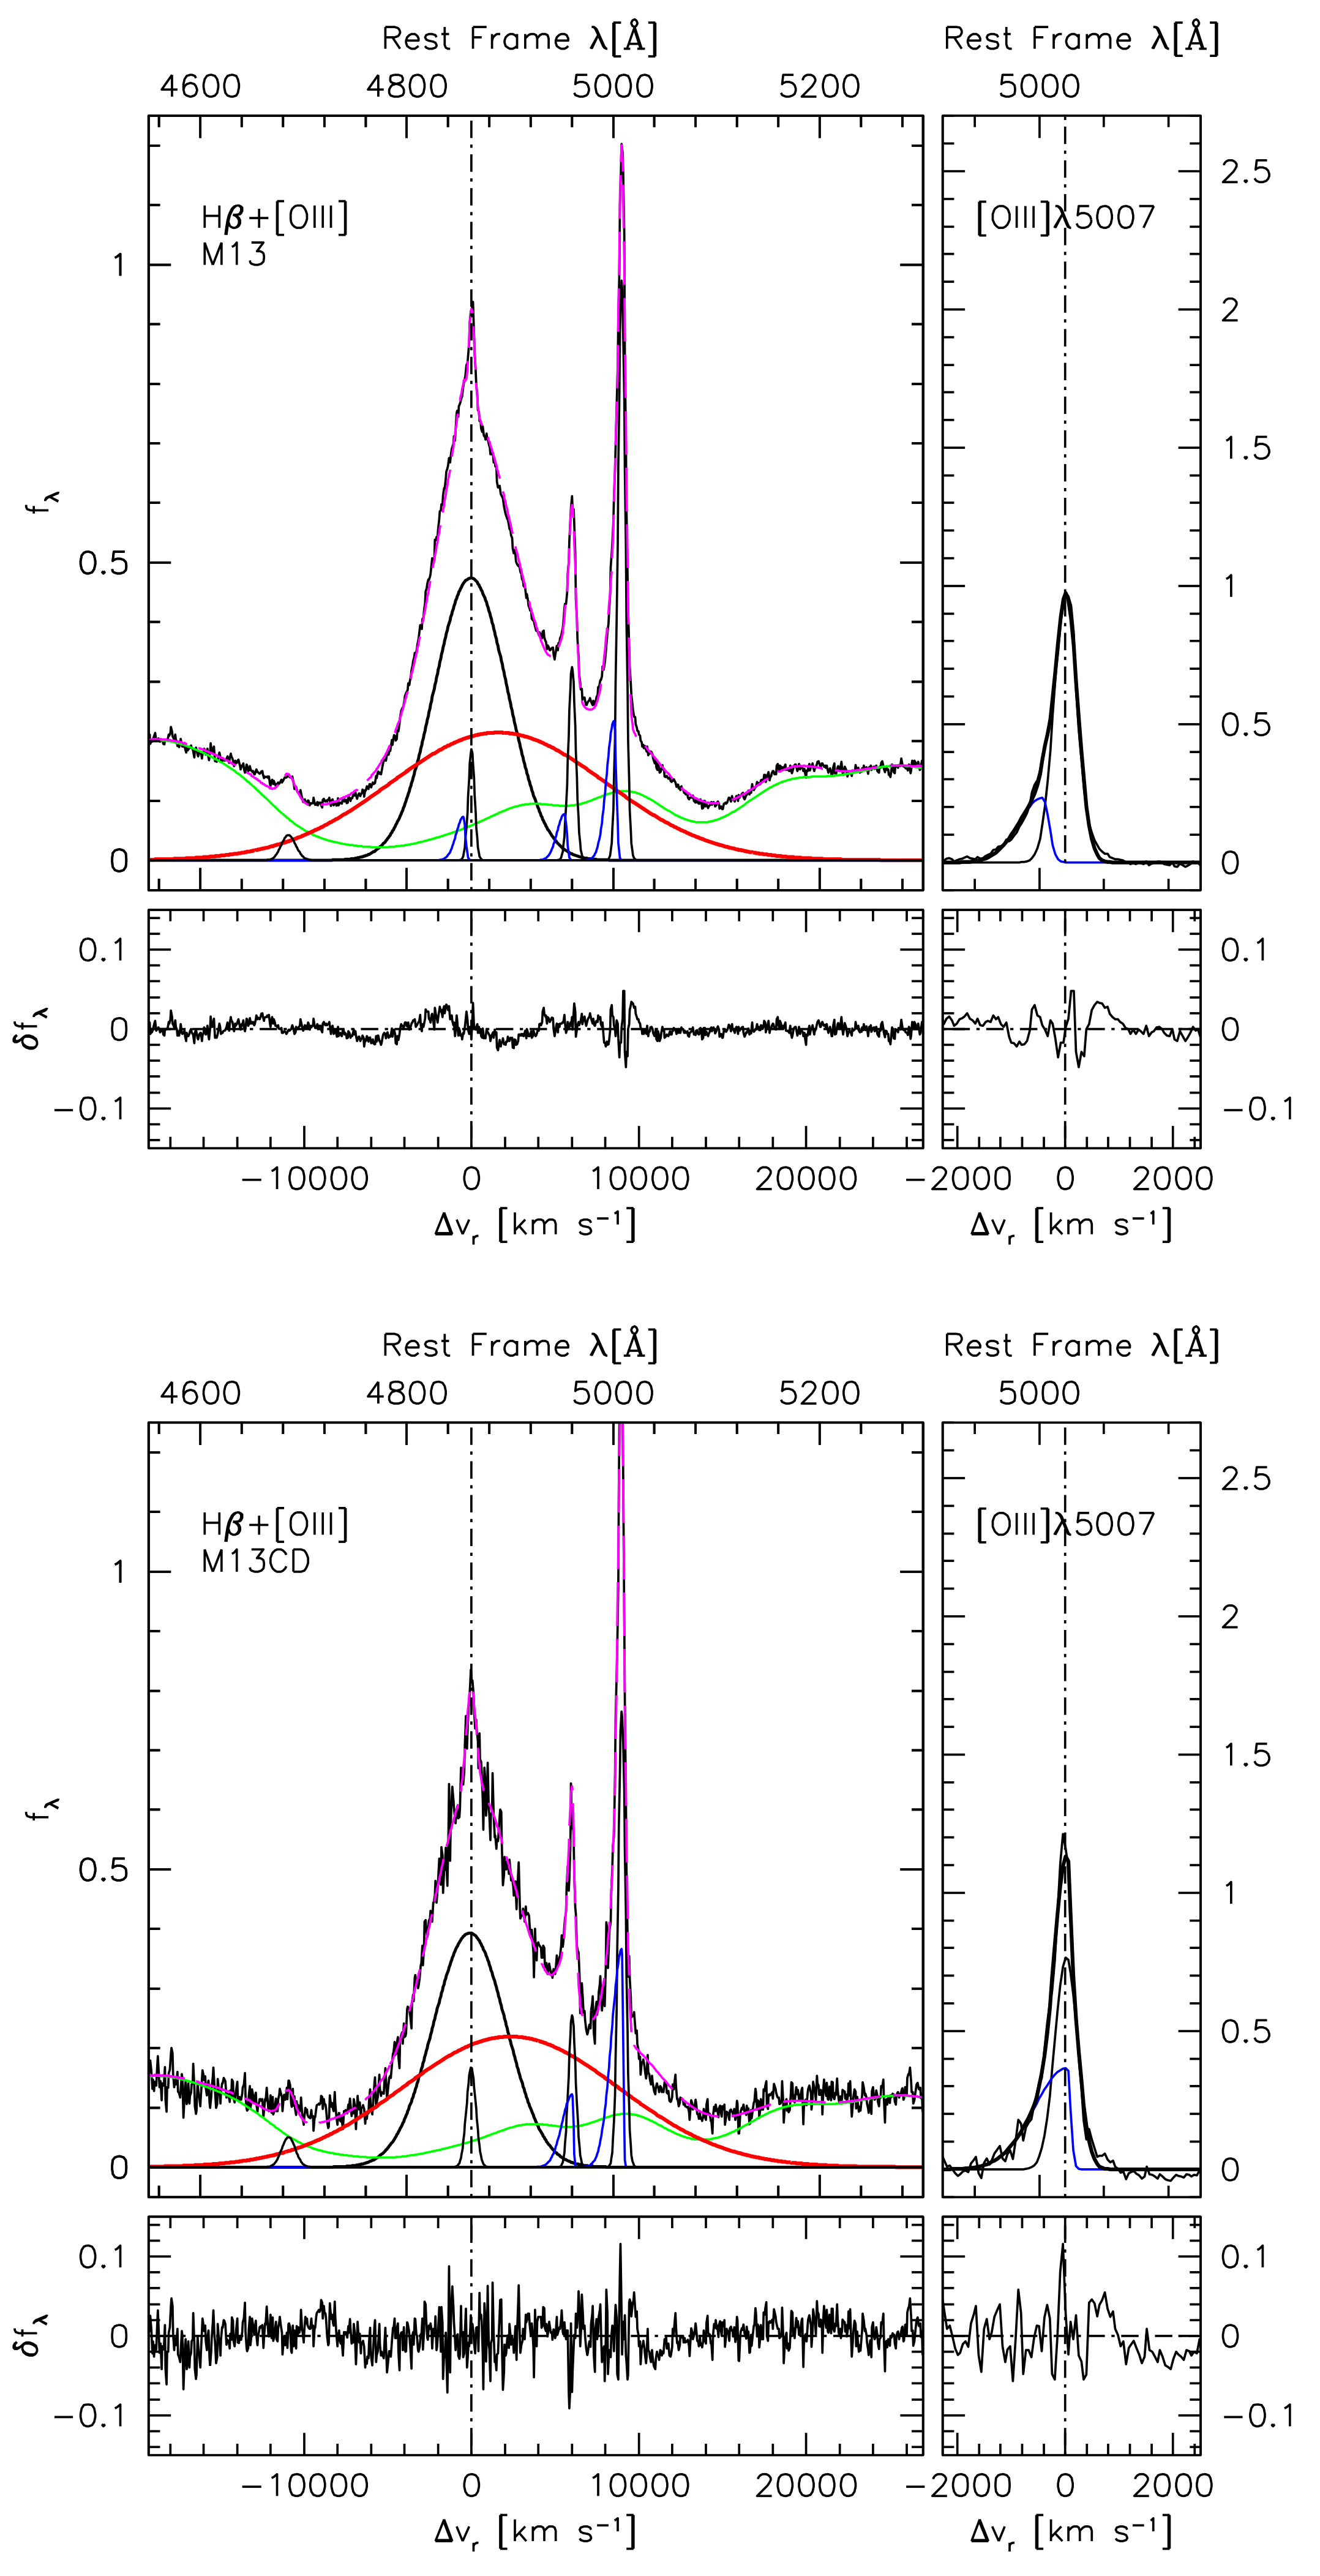
4.1. Broad H
4.2. [Oiii]5007 and H Narrow-Line Emission
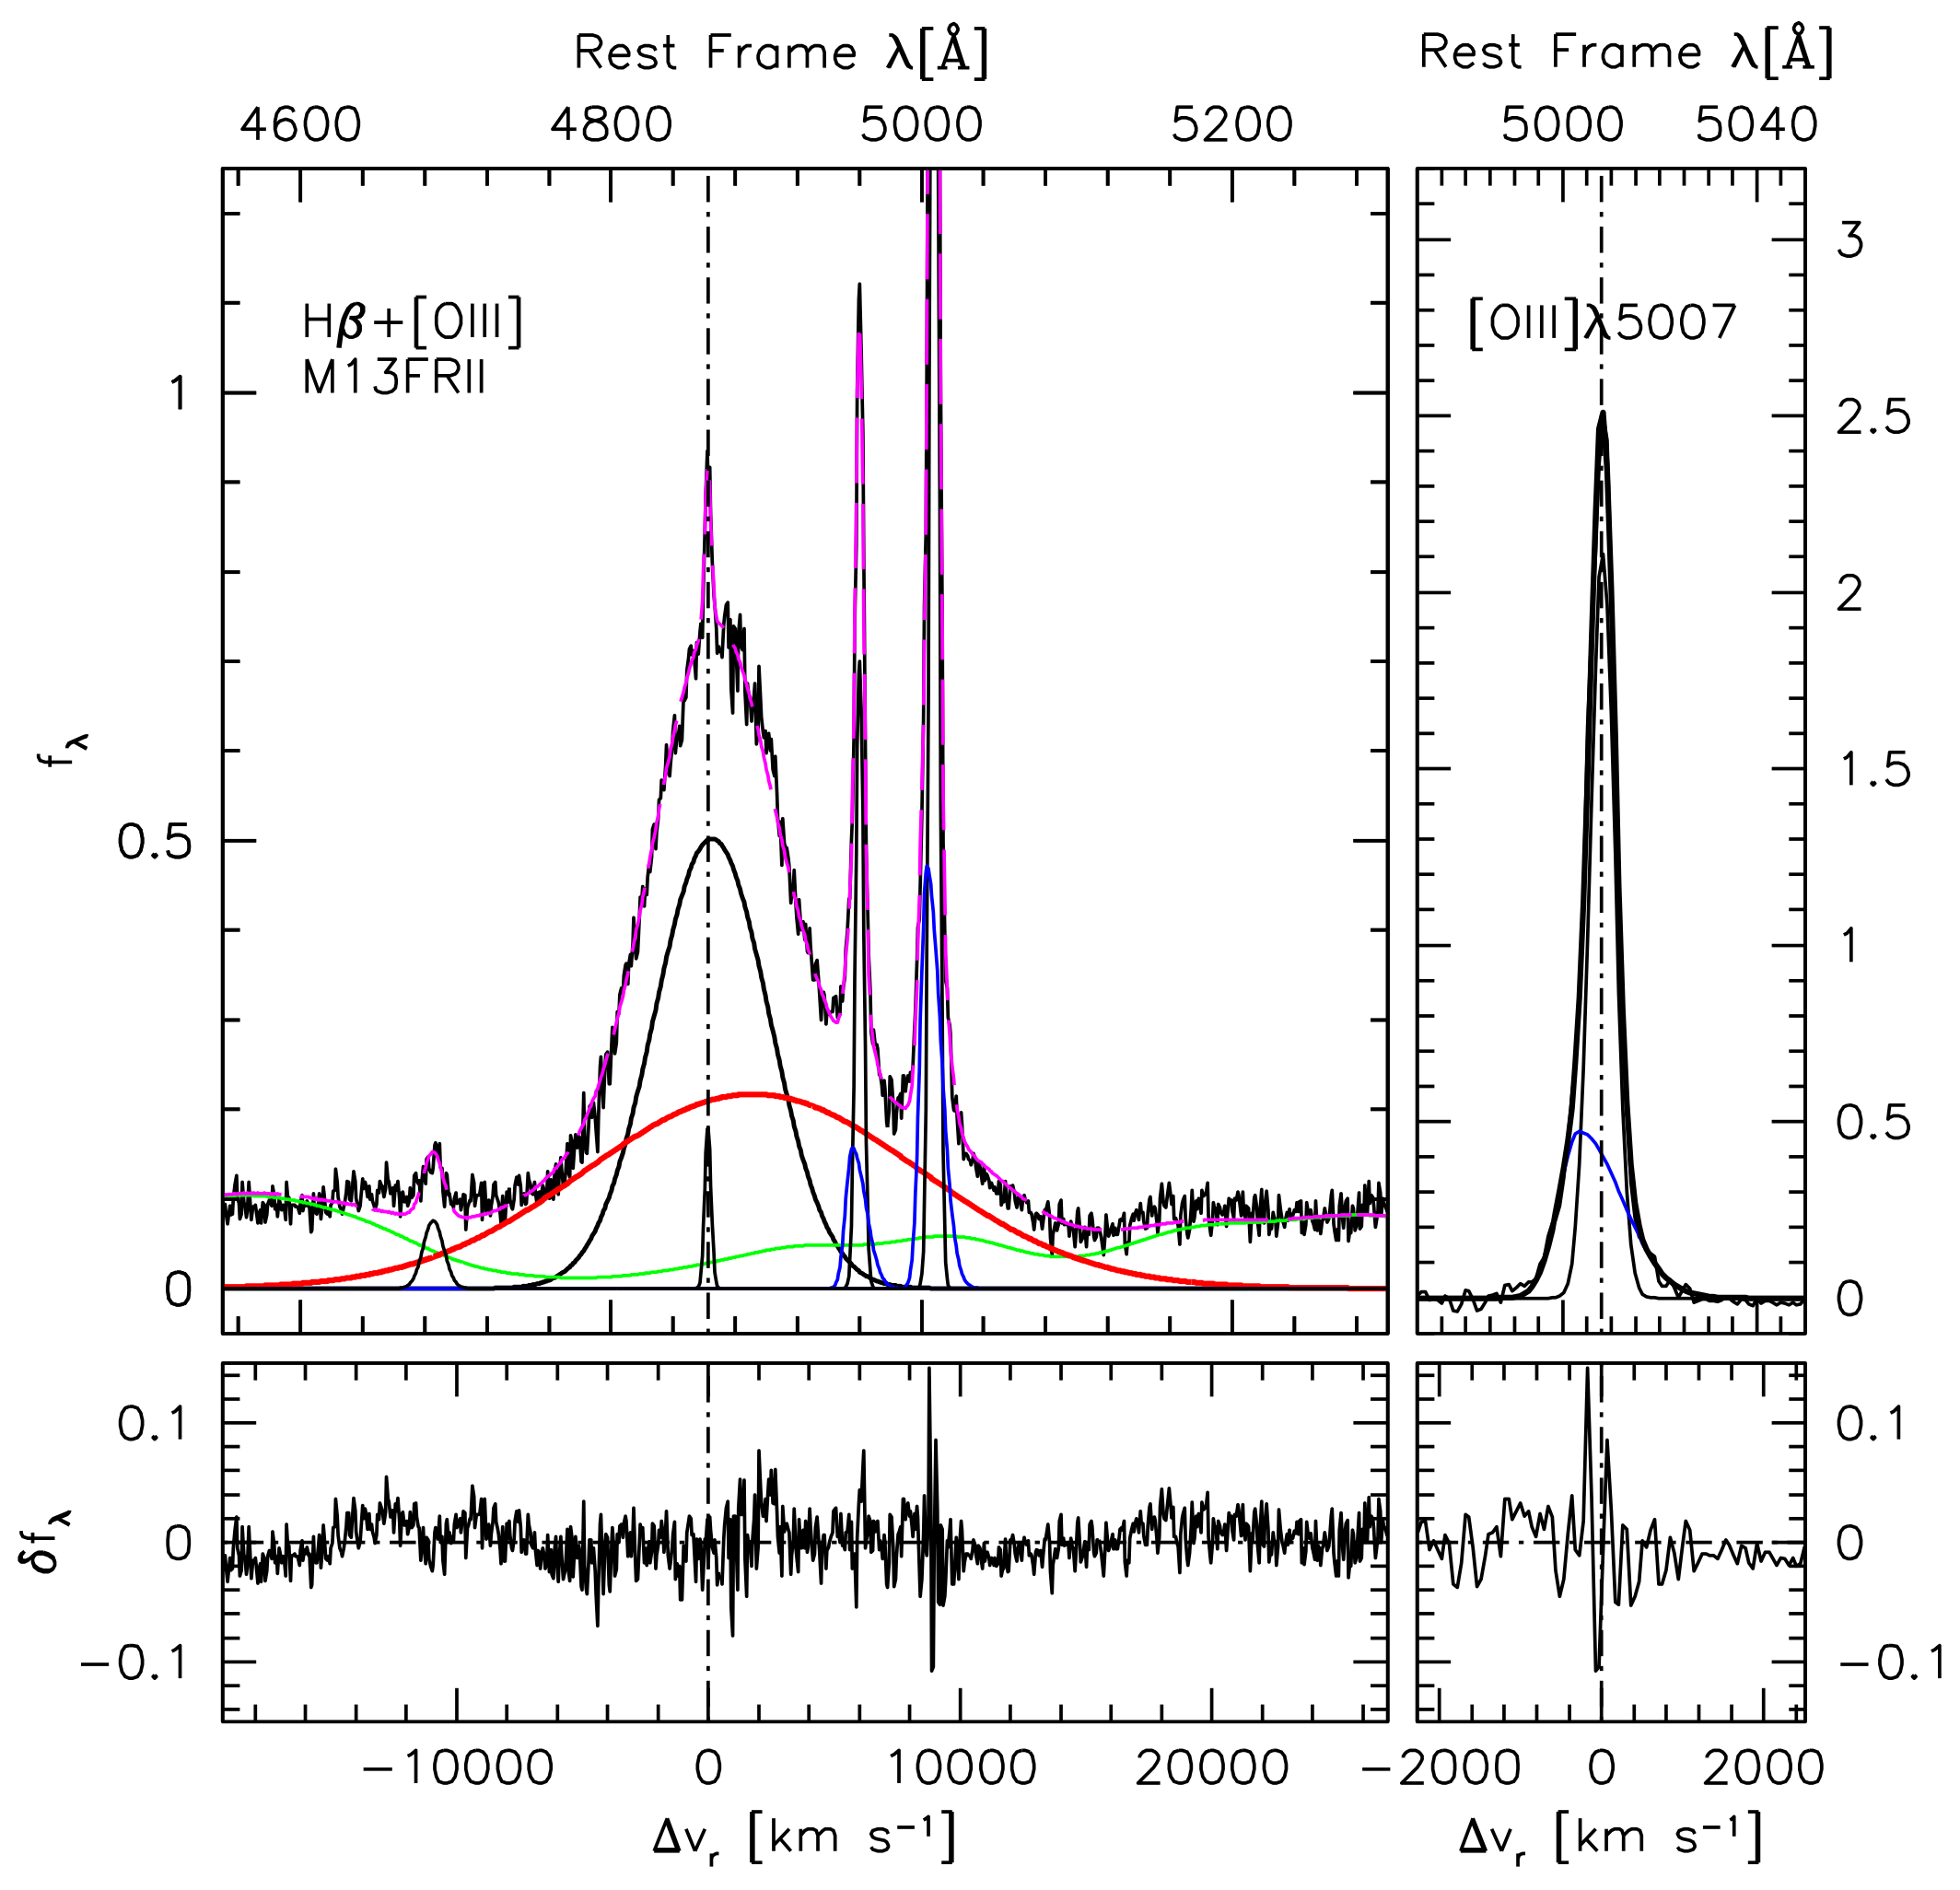
4.3. Jetted Sources
5. Discussion
5.1. How Important Is the Outflow Component?
5.2. Identifying an Outflow Component
- No significant centroid blueshift in the broad profile of H and symmetric appearance at the interface between H and H, with the peak of the broad profile showing no shift or a slight redshift: no evidence of outflow.
- No significant centroid blueshift in the broad profile of H and “goiter’’ appearance at the interface between H and H: If the [Oiii]5007 line shows a significant blueward asymmetry and a model of the [Oiii]5007 line profile with a core and semi-broad component is applicable to the H profile, then it is likely that the outflow is mainly associated with NLR emission.
- Even modest centroid blueshift in the broad profile of H at fractional intensity or 0.9, the outflow might involve BLR emission. In this case, H corresponds to the prominent blueshifted emission of the Civ line observed at high luminosity [56]. The detection of H is made more difficult by the Civ/H ratio expected to be .
5.3. Location and Physical Nature of the Outflow
5.4. The Fate of the Outflowing Gas: No Feedback Effects at Low L
6. Summary and Conclusions
Author Contributions
Funding
Institutional Review Board Statement
Informed Consent Statement
Data Availability Statement
Acknowledgments
Conflicts of Interest
Abbreviations
| AGN | Active Galactic Nucleus/i; |
| BLR | Broad Line Region; |
| BC | Broad Component; |
| CD | Core Dominated; |
| FR-II | Fanaroff-Riley II; |
| FWHM | Full Width Half-Maximum; |
| HE | Hamburg-ESO; |
| ISAAC | Infrared Spectrometer And Array Camera; |
| IR | Infrared; |
| LOC | Locally Optimized Cloud; |
| MDPI | Multidisciplinary Digital Publishing Institute; |
| MS | Main Sequence; |
| NC | Narrow Component; |
| NGC | New General Catalogue; |
| NLR | Narrow Line Region; |
| RL | Radio loud; |
| RQ | Radio quiet; |
| SBC | Semi-Broad Component; |
| SDSS | Sloan Digital Sky Survey; |
| UV | Ultra-violet; |
| VBC | Very Broad Component; |
| VBLR | Very Broad Line Region. |
| 1 | In flux limited samples, Pop. A and B may have similar luminosity distributions. If this is the case, Pop. B sources are expected to host more massive black holes, considering the systematic differences in the Eddington ratio. |
| 2 | |
| 3 | Note that the filling factor is not appearing explicitly because, by using line luminosity, we already are considering the volume of the line-emitting gas. The fraction of volume that is actually occupied by the line emitting gas then depends on its density. |
References
- Sulentic, J.W.; Marziani, P.; Dultzin-Hacyan, D. Phenomenology of Broad Emission Lines in Active Galactic Nuclei. Annu. Rev. Astron. Astrophys. 2000, 38, 521–571. [Google Scholar] [CrossRef]
- Osterbrock, D.E.; Mathews, W.G. Emission-line regions of active galaxies and QSOs. Annu. Rev. Astron. Astrophys. 1986, 24, 171–203. [Google Scholar] [CrossRef]
- Netzer, H. AGN emission lines. In Active Galactic Nuclei; Blandford, R.D., Netzer, H., Woltjer, L., Courvoisier, T.J.-L., Mayor, M., Eds.; Springer: Berlin/Heidelberg, Germany, 1990; pp. 57–160. [Google Scholar]
- Peterson, B.M. An Introduction to Active Galactic Nuclei; Cambridge University Press: Cambridge, UK, 1997. [Google Scholar]
- Osterbrock, D.E.; Ferland, G.J. Astrophysics of Gaseous Nebulae and Active Galactic Nuclei; University Science Books: Mill Valley, CA, USA, 2006. [Google Scholar]
- Marziani, P.; Dultzin-Hacyan, D.; Sulentic, J.W. Accretion onto Supermassive Black Holes in Quasars: Learning from Optical/UV Observations. In New Developments in Black Hole Research; Kreitler, P.V., Ed.; Nova Press: New York, NY, USA, 2006; p. 123. [Google Scholar]
- Sulentic, J.W. Toward a classification scheme for broad-line profiles in active galactic nuclei. Astrophys. J. 1989, 343, 54–65. [Google Scholar] [CrossRef]
- Shen, Y.; Ho, L.C. The diversity of quasars unified by accretion and orientation. Nature 2014, 513, 210–213. [Google Scholar] [CrossRef]
- Panda, S.; Czerny, B.; Adhikari, T.P.; Hryniewicz, K.; Wildy, C.; Kuraszkiewicz, J.; Śniegowska, M. Modeling of the Quasar Main Sequence in the Optical Plane. Astrophys. J. 2018, 866, 115. [Google Scholar] [CrossRef]
- Sulentic, J.; Marziani, P.; Zamfir, S. The Case for Two Quasar Populations. Balt. Astron. 2011, 20, 427–434. [Google Scholar]
- Marziani, P.; Zamanov, R.K.; Sulentic, J.W.; Calvani, M. Searching for the physical drivers of eigenvector 1: Influence of black hole mass and Eddington ratio. Mon. Not. R. Astron. Soc. 2003, 345, 1133–1144. [Google Scholar] [CrossRef]
- Marziani, P.; Sulentic, J.W. Highly accreting quasars: Sample definition and possible cosmological implications. Mon. Not. R. Astron. Soc. 2014, 442, 1211–1229. [Google Scholar] [CrossRef]
- Abramowicz, M.A.; Czerny, B.; Lasota, J.P.; Szuszkiewicz, E. Slim accretion disks. Astrophys. J. 1988, 332, 646–658. [Google Scholar] [CrossRef]
- Mineshige, S.; Kawaguchi, T.; Takeuchi, M.; Hayashida, K. Slim-Disk Model for Soft X-Ray Excess and Variability of Narrow-Line Seyfert 1 Galaxies. Publ. Astron. Soc. Jpn. 2000, 52, 499–508. [Google Scholar]
- Sadowski, A. Slim accretion disks around black holes. arXiv 2011, arXiv:1108.0396. [Google Scholar]
- Sun, J.; Shen, Y. Dissecting the Quasar Main Sequence: Insight from Host Galaxy Properties. Astrophys. J. Lett. 2015, 804, L15. [Google Scholar] [CrossRef]
- Panda, S.; Marziani, P.; Czerny, B. The Quasar Main Sequence Explained by the Combination of Eddington Ratio, Metallicity, and Orientation. Astrophys. J. 2019, 882, 79. [Google Scholar] [CrossRef]
- Peterson, B.M.; Ferland, G.J. An accretion event in the Seyfert galaxy NGC 5548. Nature 1986, 324, 345–347. [Google Scholar] [CrossRef]
- Marziani, P.; Sulentic, J.W. Evidence for a very broad line region in PG 1138+222. Astrophys. J. 1993, 409, 612–616. [Google Scholar] [CrossRef][Green Version]
- Sulentic, J.W.; Zwitter, T.; Marziani, P.; Dultzin-Hacyan, D. Eigenvector 1: An Optimal Correlation Space for Active Galactic Nuclei. Astrophys. J. 2000, 536, L5–L9. [Google Scholar] [CrossRef]
- Wang, J.; Li, Y. Strong Response of the Very Broad Hβ Emission Line in the Luminous Radio-quiet Quasar PG 1416-129. Astrophys. J. Lett. 2011, 742, L12. [Google Scholar] [CrossRef]
- Punsly, B. Multi-epoch Observations of the Red Wing Excess in the Spectrum of 3C 279. Astrophys. J. Lett. 2013, 762, L25. [Google Scholar] [CrossRef]
- Wolf, J.; Salvato, M.; Coffey, D.; Merloni, A.; Buchner, J.; Arcodia, R.; Baron, D.; Carrera, F.J.; Comparat, J.; Schneider, D.P.; et al. Exploring the diversity of Type 1 active galactic nuclei identified in SDSS-IV/SPIDERS. Mon. Not. R. Astron. Soc. 2020, 492, 3580–3601. [Google Scholar] [CrossRef]
- Snedden, S.A.; Gaskell, C.M. The Case for Optically Thick High-Velocity Broad-Line Region Gas in Active Galactic Nuclei. Astrophys. J. 2007, 669, 126–134. [Google Scholar] [CrossRef][Green Version]
- Peterson, B.M.; Wandel, A. Keplerian Motion of Broad-Line Region Gas as Evidence for Supermassive Black Holes in Active Galactic Nuclei. Astrophys. J. 1999, 521, L95–L98. [Google Scholar] [CrossRef]
- Peterson, B.M.; Ferrarese, L.; Gilbert, K.M.; Kaspi, S.; Malkan, M.A.; Maoz, D.; Merritt, D.; Netzer, H.; Onken, C.A.; Pogge, R.W.; et al. Central Masses and Broad-Line Region Sizes of Active Galactic Nuclei. II. A Homogeneous Analysis of a Large Reverberation-Mapping Database. Astrophys. J. 2004, 613, 682–699. [Google Scholar] [CrossRef]
- Punsly, B.; Marziani, P.; Berton, M.; Kharb, P. The Extreme Red Excess in Blazar Ultraviolet Broad Emission Lines. Astrophys. J. 2020, 903, 44. [Google Scholar] [CrossRef]
- Wang, J.M.; Du, P.; Brotherton, M.S.; Hu, C.; Songsheng, Y.Y.; Li, Y.R.; Shi, Y.; Zhang, Z.X. Tidally disrupted dusty clumps as the origin of broad emission lines in active galactic nuclei. Nat. Astron. 2017, 1, 775–783. [Google Scholar] [CrossRef]
- Gaskell, C.M. Direct evidence for gravitational domination of the motion of gas within one light-week of the central object in NGC 4151 and the determination of the mass of the probable black hole. Astrophys. J. 1988, 325, 114–118. [Google Scholar] [CrossRef]
- Corbin, M.R. QSO Broad Emission Line Asymmetries: Evidence of Gravitational Redshift? Astrophys. J. 1995, 447, 496. [Google Scholar] [CrossRef]
- Popovic, L.C.; Vince, I.; Atanackovic-Vukmanovic, O.; Kubicela, A. Contribution of gravitational redshift to spectral line profiles of Seyfert galaxies and quasars. Astron. Astrophys. 1995, 293, 309–314. [Google Scholar]
- Gavrilović, N.; Popović, L.Č.; Kollatschny, W. The gravitational redshift in the broad line region of the active galactic nucleus Mrk 110. In IAU Symposium; Karas, V., Matt, G., Eds.; Cambridge University Press: Cambridge, UK, 2007; Volume 238, pp. 369–370. [Google Scholar] [CrossRef]
- Bon, N.; Bon, E.; Marziani, P.; Jovanović, P. Gravitational redshift of emission lines in the AGN spectra. Astrophys. Space Sci. 2015, 360, 7. [Google Scholar] [CrossRef]
- Marziani, P.; Sulentic, J.W. Quasar Outflows in the 4D Eigenvector 1 Context. Astron. Rev. 2012, 7, 33–57. [Google Scholar]
- Marziani, P.; Sulentic, J.W.; Stirpe, G.M.; Dultzin, D.; Del Olmo, A.; Martínez-Carballo, M.A. Blue outliers among intermediate redshift quasars. Astrophys. Space Sci. 2016, 361, 3. [Google Scholar] [CrossRef]
- Leighly, K.M.; Moore, J.R. Hubble Space Telescope STIS Ultraviolet Spectral Evidence of Outflow in Extreme Narrow-Line Seyfert 1 Galaxies. I. Data and Analysis. Astrophys. J. 2004, 611, 107–124. [Google Scholar] [CrossRef]
- Kaastra, J.S.; Kriss, G.A.; Cappi, M.; Mehdipour, M.; Petrucci, P.O.; Steenbrugge, K.C.; Arav, N.; Behar, E.; Bianchi, S.; Boissay, R.; et al. A fast and long-lived outflow from the supermassive black hole in NGC 5548. Science 2014, 345, 64–68. [Google Scholar] [CrossRef] [PubMed]
- Fine, S.; Croom, S.M.; Bland-Hawthorn, J.; Pimbblet, K.A.; Ross, N.P.; Schneider, D.P.; Shanks, T. The CIV linewidth distribution for quasars and its implications for broad-line region dynamics and virial mass estimation. Mon. Not. R. Astron. Soc. 2010, 409, 591–610. [Google Scholar] [CrossRef]
- Whittle, M. The Narrowline Region of Active Galaxies-Part Two-Relations Between OIII Profile Shape and Other Properties. Mon. Not. R. Astron. Soc. 1985, 213, 33. [Google Scholar]
- Bennert, N.; Falcke, H.; Schulz, H.; Wilson, A.S.; Wills, B.J. Size and Structure of the Narrow-Line Region of Quasars. Astrophys. J. 2002, 574, L105–L109. [Google Scholar] [CrossRef]
- Komossa, S.; Xu, D.; Zhou, H.; Storchi-Bergmann, T.; Binette, L. On the Nature of Seyfert Galaxies with High [O III] λ5007 Blueshifts. Astrophys. J. 2008, 680, 926–938. [Google Scholar] [CrossRef]
- Zamanov, R.; Marziani, P.; Sulentic, J.W.; Calvani, M.; Dultzin-Hacyan, D.; Bachev, R. Kinematic Linkage between the Broad- and Narrow-Line-emitting Gas in Active Galactic Nuclei. Astrophys. J. 2002, 576, L9–L13. [Google Scholar] [CrossRef]
- Marziani, P.; Martínez Carballo, M.A.; Sulentic, J.W.; Del Olmo, A.; Stirpe, G.M.; Dultzin, D. The most powerful quasar outflows as revealed by the Civ λ1549 resonance line. Astrophys. Space Sci. 2016, 361, 29. [Google Scholar] [CrossRef]
- Sulentic, J.W.; Marziani, P.; Zamanov, R.; Bachev, R.; Calvani, M.; Dultzin-Hacyan, D. Average Quasar Spectra in the Context of Eigenvector 1. Astrophys. J. 2002, 566, L71–L75. [Google Scholar] [CrossRef]
- Marziani, P.; Sulentic, J.W.; Plauchu-Frayn, I.; del Olmo, A. Is Mg II 2800 a Reliable Virial Broadening Estimator for Quasars? Astron. Astrophys. 2013, 555, 89. [Google Scholar]
- Marziani, P.; Sulentic, J.W.; Stirpe, G.M.; Zamfir, S.; Calvani, M. VLT/ISAAC spectra of the Hβ region in intermediate-redshift quasars. III. Hβ broad-line profile analysis and inferences about BLR structure. Astron. Astrophys. 2009, 495, 83–112. [Google Scholar] [CrossRef]
- Marziani, P.; Sulentic, J.W.; Zamanov, R.; Calvani, M.; Dultzin-Hacyan, D.; Bachev, R.; Zwitter, T. An Optical Spectroscopic Atlas of Low-Redshift Active Galactic Nuclei. Astrophys. J. Suppl. Ser. 2003, 145, 199–211. [Google Scholar] [CrossRef]
- Bon, N.; Marziani, P.; Bon, E.; Negrete, C.A.; Dultzin, D.; del Olmo, A.; D’Onofrio, M.; Martínez-Aldama, M.L. Selection of highly-accreting quasars. Spectral properties of Fe IIopt emitters not belonging to extreme Population A. Astron. Astrophys. 2020, 635, A151. [Google Scholar] [CrossRef]
- Padovani, P. The faint radio sky: Radio astronomy becomes mainstream. Astron. Astrophys. Rev. 2016, 24, 13. [Google Scholar] [CrossRef]
- Padovani, P. Active Galactic Nuclei at All Wavelengths and from All Angles. Front. Astron. Space Sci. 2017, 4, 35. [Google Scholar] [CrossRef]
- Sulentic, J.W.; Marziani, P.; del Olmo, A.; Dultzin, D.; Perea, J.; Alenka Negrete, C. GTC spectra of z ≈ 2.3 quasars: Comparison with local luminosity analogs. Astron. Astrophys. 2014, 570, A96. [Google Scholar] [CrossRef]
- Vestergaard, M.; Peterson, B.M. Determining Central Black Hole Masses in Distant Active Galaxies and Quasars. II. Improved Optical and UV Scaling Relationships. Astrophys. J. 2006, 641, 689–709. [Google Scholar] [CrossRef]
- Netzer, H. Bolometric correction factors for active galactic nuclei. Mon. Not. R. Astron. Soc. 2019, 488, 5185–5191. [Google Scholar] [CrossRef]
- Kriss, G. Fitting Models to UV and Optical Spectral Data. Astron. Data Anal. Softw. Syst. III 1994, 61, 437. [Google Scholar]
- Boroson, T.A.; Green, R.F. The Emission-Line Properties of Low-Redshift Quasi-stellar Objects. Astrophys. J. Suppl. Ser. 1992, 80, 109. [Google Scholar] [CrossRef]
- Sulentic, J.W.; del Olmo, A.; Marziani, P.; Martínez-Carballo, M.A.; D’Onofrio, M.; Dultzin, D.; Perea, J.; Martínez-Aldama, M.L.; Negrete, C.A.; Stirpe, G.M.; et al. What does CIVλ1549 tell us about the physical driver of the Eigenvector quasar sequence? Astron. Astrophys. 2017, 608, A122. [Google Scholar] [CrossRef]
- Marziani, P.; Dultzin-Hacyan, D.; D’Onofrio, M.; Sulentic, J.W. Arp 194: Evidence of Tidal Stripping of Gas and Cross-Fueling. Astron. J. 2003, 125, 1897–1907. [Google Scholar] [CrossRef][Green Version]
- Zamfir, S.; Sulentic, J.W.; Marziani, P.; Dultzin, D. Detailed characterization of Hβ emission line profile in low-z SDSS quasars. Mon. Not. R. Astron. Soc. 2010, 403, 1759. [Google Scholar] [CrossRef]
- Azzalini, A.; Regoli, G. Some properties of skew-symmetric distributions. Ann. Inst. Statist. Math. 2012, 64, 857–879. [Google Scholar] [CrossRef]
- Urry, C.M.; Padovani, P. Unified Schemes for Radio-Loud Active Galactic Nuclei. Publ. Astron. Soc. Pac. 1995, 107, 803. [Google Scholar] [CrossRef]
- Denney, K.D.; Peterson, B.M.; Pogge, R.W.; Adair, A.; Atlee, D.W.; Au-Yong, K.; Bentz, M.C.; Bird, J.C.; Brokofsky, D.J.; Chisholm, E.; et al. Diverse Kinematic Signatures from Reverberation Mapping of the Broad-Line Region in AGNs. Astrophys. J. 2009, 704, L80–L84. [Google Scholar] [CrossRef]
- Du, P.; Brotherton, M.S.; Wang, K.; Huang, Z.P.; Hu, C.; Kasper, D.H.; Chick, W.T.; Nguyen, M.L.; Maithil, J.; Hand, D.; et al. Monitoring AGNs with Hβ Asymmetry. I. First Results: Velocity-resolved Reverberation Mapping. Astrophys. J. 2018, 869, 142. [Google Scholar] [CrossRef]
- Barth, A.J.; Vogler, H.A.; Guo, H.; Treu, T.; Bennert, V.N.; Canalizo, G.; Filippenko, A.V.; Gates, E.; Hamann, F.; Joner, M.D.; et al. The Lick AGN Monitoring Project 2016: Velocity-resolved Hβ Lags in Luminous Seyfert Galaxies. Astrophys. J. 2022, 925, 52. [Google Scholar] [CrossRef]
- Sulentic, J.W.; Marziani, P. The Intermediate-Line Region in Active Galactic Nuclei: A Region “Præter Necessitatem”? Astrophys. J. 1999, 518, L9–L12. [Google Scholar] [CrossRef][Green Version]
- Netzer, H.; Marziani, P. The Effect of Radiation Pressure on Emission-line Profiles and Black Hole Mass Determination in Active Galactic Nuclei. Astrophys. J. 2010, 724, 318–328. [Google Scholar] [CrossRef]
- Ferland, G.J.; Hu, C.; Wang, J.; Baldwin, J.A.; Porter, R.L.; van Hoof, P.A.M.; Williams, R.J.R. Implications of Infalling Fe II-Emitting Clouds in Active Galactic Nuclei: Anisotropic Properties. Astrophys. J. 2009, 707, L82–L86. [Google Scholar] [CrossRef]
- Marziani, P.; Sulentic, J.W.; Negrete, C.A.; Dultzin, D.; Zamfir, S.; Bachev, R. Broad-line region physical conditions along the quasar eigenvector 1 sequence. Mon. Not. R. Astron. Soc. 2010, 409, 1033–1048. [Google Scholar] [CrossRef]
- Baldwin, J.; Ferland, G.; Korista, K.; Verner, D. Locally Optimally Emitting Clouds and the Origin of Quasar Emission Lines. Astrophys. J. 1995, 455, L119. [Google Scholar] [CrossRef]
- Korista, K.; Baldwin, J.; Ferland, G.; Verner, D. An Atlas of Computed Equivalent Widths of Quasar Broad Emission Lines. Astrophys. J. Suppl. Ser. 1997, 108, 401. [Google Scholar] [CrossRef]
- Murray, N.; Chiang, J. Disk Winds and Disk Emission Lines. Astrophys. J. 1997, 474, 91. [Google Scholar] [CrossRef]
- Proga, D.; Stone, J.M.; Drew, J.E. Radiation-driven winds from luminous accretion discs. Mon. Not. R. Astron. Soc. 1998, 295, 595–617. [Google Scholar] [CrossRef]
- Laor, A.; Brandt, W.N. The Luminosity Dependence of Ultraviolet Absorption in Active Galactic Nuclei. Astrophys. J. 2002, 569, 641–654. [Google Scholar] [CrossRef]
- Bischetti, M.; Piconcelli, E.; Vietri, G.; Bongiorno, A.; Fiore, F.; Sani, E.; Marconi, A.; Duras, F.; Zappacosta, L.; Brusa, M.; et al. The WISSH quasars project. I. Powerful ionised outflows in hyper-luminous quasars. Astron. Astrophys. 2017, 598, A122. [Google Scholar] [CrossRef]
- Vietri, G. The LBT/WISSH quasar survey: Revealing powerful winds in the most luminous AGN. American Astronomical Society Meeting Abstracts#. 2017, Volume 229. Available online: https://ui.adsabs.harvard.edu/abs/2017AAS...22930206V/abstract (accessed on 14 February 2022).
- Vietri, G.; Piconcelli, E.; Bischetti, M.; Duras, F.; Martocchia, S.; Bongiorno, A.; Marconi, A.; Zappacosta, L.; Bisogni, S.; Bruni, G.; et al. The WISSH quasars project. IV. Broad line region versus kiloparsec-scale winds. Astron. Astrophys. 2018, 617, A81. [Google Scholar] [CrossRef]
- Cano-Díaz, M.; Maiolino, R.; Marconi, A.; Netzer, H.; Shemmer, O.; Cresci, G. Observational evidence of quasar feedback quenching star formation at high redshift. Astron. Astrophys. 2012, 537, L8. [Google Scholar] [CrossRef]
- Monari, G.; Famaey, B.; Carrillo, I.; Piffl, T.; Steinmetz, M.; Wyse, R.F.G.; Anders, F.; Chiappini, C.; Janßen, K. The escape speed curve of the Galaxy obtained from Gaia DR2 implies a heavy Milky Way. Astron. Astrophys. 2018, 616, L9. [Google Scholar] [CrossRef]
- Ganci, V.; Marziani, P.; D’Onofrio, M.; del Olmo, A.; Bon, E.; Bon, N.; Negrete, C.A. Radio loudness along the quasar main sequence. Astron. Astrophys. 2019, 630, A110. [Google Scholar] [CrossRef]
- Del Olmo, A.; Marziani, P.; Ganci, V.; D’Onofrio, M.; Bon, E.; Bon, N.; Negrete, A.C. Optical spectral properties of radio loud quasars along the main sequence. In Nuclear Activity in Galaxies Across Cosmic Time; Pović, M., Marziani, P., Masegosa, J., Netzer, H., Negu, S.H., Tessema, S.B., Eds.; Cambridge University Press: Cambridge, UK, 2021; Volume 356, pp. 310–313. [Google Scholar] [CrossRef]
- D’Onofrio, M.; Marziani, P.; Chiosi, C. Past, present and Future of the Scaling Relations of Galaxies and Active Galactic Nuclei. arXiv 2021, arXiv:2109.06301. [Google Scholar]
- Kriss, G.A. Coordinated UV and X-ray Observations of AGN Outflows. American Astronomical Society Meeting Abstracts#. 2017, Volume 229. Available online: https://ui.adsabs.harvard.edu/abs/2017AAS...22920901K/abstract (accessed on 14 February 2022).


| Spectrum | z | log | log | |
|---|---|---|---|---|
| (erg s) | (M) | |||
| Composite spectra | ||||
| B1 [44] | 0–0.7 | 45.63 | 8.52 | −1.07 |
| B1 [45] | 0.4–0.7 | 46.31 | 9.19 | −1.06 |
| B1 [46] | 0.9–2.6 | 47.29 | 9.63 | −0.51 |
| Individual, high-L quasars | ||||
| HE0001–2340 | 2.2651 | 47.09 | 9.78 | −0.86 |
| Q0029+079 | 3.2798 | 47.43 | 9.95 | −0.70 |
| Composite spectra, jetted | ||||
| B1 [45] CD | 0.4–0.7 | 46.51 | 9.39 | −1.05 |
| B1 [45] FRII | 0.4–0.7 | 46.62 | 9.44 | −1.00 |
| Spectrum | H | H | H | H | Feii4570 | |||||
|---|---|---|---|---|---|---|---|---|---|---|
| F | W | F | F | F | Shift | FWHM | Skew | F | W | |
| Composite spectra | ||||||||||
| B1 [44] | 95.3 | 86.7 | 49.8 | 45.4 | … | … | … | … | 18.1 | 14.6 |
| B1 [45] | 122.3 | 126.5 | 52.5 | 69.8 | … | … | … | … | 47.8 | 43.0 |
| B1 [46] | 123.3 | 129.1 | 19.6 | 99.1 | 4.6 | −1535 | 3611 | 0.5 | 39.2 | 34.1 |
| Individual, high-L quasars | ||||||||||
| HE0001 | 99.3 | 95.1 | 26.7 | 72.7 | … | … | … | … | 20.6 | 16.3 |
| Q0029 | 69.8 | 66.4 | 13.9 | 32.2 | 23.7 | −2097 | 4711 | 1.2 | 25.8 | 21.4 |
| Composite spectra, jetted | ||||||||||
| B1 [45] CD | 113.8 | 118.5 | 42.9 | 70.9 | … | … | … | … | 35.6 | 32.7 |
| B1 [45] FRII | 129.8 | 131.1 | 57.5 | 72.3 | … | … | … | … | 24.6 | 21.9 |
| Spectrum | FWHM | AI | c(1/4) | c(1/2) | c(3/4) | c(0.9) |
|---|---|---|---|---|---|---|
| Composite spectra | ||||||
| B1 [44] | 5560 ± 170 | 0.12 ± 0.03 | 680 ± 230 | 250 ± 80 | 160 ± 70 | 130 ± 50 |
| B1 [45] | 6540 ± 210 | 0.12 ± 0.06 | 740 ± 340 | 150 ± 110 | 50 ± 90 | 40 ± 60 |
| B1 [46] | 6010 ± 450 | 0.28 ± 0.06 | 2120 ± 490 | −50 ± 220 | −230 ± 70 | −270 ± 50 |
| Individual, high-L quasars | ||||||
| HE0001 | 6510 ± 690 | 0.29 ± 0.09 | 2700 ± 560 | 1310 ± 340 | 900 ± 170 | 830 ± 110 |
| Q0029 | 6200 ± 380 | 0.18 ± 0.10 | 430 ± 500 | −380 ± 190 | −500 ± 160 | −500 ± 110 |
| Composite spectra, jetted | ||||||
| B1 [45] CD | 6880 ± 240 | 0.23 ± 0.06 | 1520 ± 380 | 270 ± 120 | 70 ± 90 | 20 ± 60 |
| B1 [45] FRII | 6790 ± 220 | 0.10 ± 0.06 | 820 ± 330 | 320 ± 110 | 240 ± 90 | 230 ± 60 |
| Spectrum | H | H | [Oiii] | [Oiii] | ||||||||||||||
|---|---|---|---|---|---|---|---|---|---|---|---|---|---|---|---|---|---|---|
| F | W | Shift | FWHM | F | W | Shift | FWHM | Skew | F | W | Shift | FWHM | F | W | Shift | FWHM | Skew | |
| Composite spectra | ||||||||||||||||||
| B1 [44] | 3.33 | 3.00 | −9 | 492 | 0.59 | 0.53 | −349 | 881 | … | 14.6 | 14.0 | 12 | 499 | 8.86 | 8.45 | −307 | 881 | 1.47 |
| B1 [45] | 1.45 | 1.45 | −8 | 450 | 0.83 | 0.85 | −480 | 1054 | 0.26 | 8.9 | 9.7 | 11 | 513 | 2.76 | 3.00 | −417 | 1054 | 0.26 |
| B1 [46] | 0.65 | 0.70 | −25 | 508 | 0.06 | 0.07 | −752 | 932 | 1.46 | 1.6 | 1.8 | −15 | 528 | 2.68 | 2.97 | −688 | 932 | 1.46 |
| Individual, high-L quasars | ||||||||||||||||||
| HE0001 | 0.11 | 0.10 | −25 | 2202 | 1.05 | 0.99 | −133 | 1301 | 0.41 | 2.6 | 2.7 | 239 | 592 | 4.39 | 4.43 | −69 | 1301 | 0.41 |
| Q0029 | 1.00 | 0.95 | −6 | 1181 | 0.00 | 0.00 | … | … | … | 4.9 | 4.9 | −728 | 1181 | 3.36 | 3.30 | −2051 | 1340 | 1.12 |
| Composite spectra, jetted | ||||||||||||||||||
| B1 [45] CD | 1.92 | 1.96 | −25 | 662 | 0.00 | 0.00 | … | … | … | 6.8 | 7.4 | 20 | 497 | 5.17 | 5.62 | 39 | 1439 | 0.10 |
| B1 [45] FRII | 0.94 | 0.98 | −25 | 300 | 0.00 | 0.00 | … | … | … | 13.5 | 13.0 | 11 | 360 | 7.65 | 8.11 | −279 | 585 | 2.12 |
| Spectrum | FWHM | AI | c(1/4) | c(1/2) | c(3/4) | c(0.9) |
|---|---|---|---|---|---|---|
| Composite spectra | ||||||
| B1S02 | 580 ± 30 | −0.10 ± 0.08 | −40 ± 40 | −10 ± 20 | 0 ± 20 | 0 ± 10 |
| B1M13 | 560 ± 40 | −0.23 ± 0.11 | −80 ± 50 | −20 ± 20 | 10 ± 10 | 30 ± 10 |
| B1M09 | 1100 ± 120 | −0.43 ± 0.05 | −380 ± 40 | −280 ± 60 | −60 ± 20 | −40 ± 10 |
| Individual, high−L quasars | ||||||
| HE0001 | 900 ± 70 | −0.26 ± 0.07 | −100 ± 40 | 0 ± 30 | 70 ± 30 | 80 ± 10 |
| Q0029 | 2120 ± 140 | −0.37 ± 0.04 | −1360 ± 60 | −1240 ± 70 | −860 ± 50 | −830 ± 30 |
| Composite spectra, jetted | ||||||
| B1M13CD | 490 ± 40 | −0.18 ± 0.12 | −90 ± 50 | −70 ± 20 | −10 ± 20 | −10 ± 10 |
| B1M13FRII | 440 ± 30 | −0.10 ± 0.09 | −20 ± 30 | 10 ± 10 | 10 ± 10 | 10 ± 10 |
Publisher’s Note: MDPI stays neutral with regard to jurisdictional claims in published maps and institutional affiliations. |
© 2022 by the authors. Licensee MDPI, Basel, Switzerland. This article is an open access article distributed under the terms and conditions of the Creative Commons Attribution (CC BY) license (https://creativecommons.org/licenses/by/4.0/).
Share and Cite
Marziani, P.; Deconto-Machado, A.; Del Olmo, A. Isolating an Outflow Component in Single-Epoch Spectra of Quasars. Galaxies 2022, 10, 54. https://doi.org/10.3390/galaxies10020054
Marziani P, Deconto-Machado A, Del Olmo A. Isolating an Outflow Component in Single-Epoch Spectra of Quasars. Galaxies. 2022; 10(2):54. https://doi.org/10.3390/galaxies10020054
Chicago/Turabian StyleMarziani, Paola, Alice Deconto-Machado, and Ascension Del Olmo. 2022. "Isolating an Outflow Component in Single-Epoch Spectra of Quasars" Galaxies 10, no. 2: 54. https://doi.org/10.3390/galaxies10020054
APA StyleMarziani, P., Deconto-Machado, A., & Del Olmo, A. (2022). Isolating an Outflow Component in Single-Epoch Spectra of Quasars. Galaxies, 10(2), 54. https://doi.org/10.3390/galaxies10020054