Review

The Blazar Sequence and Its Physical Understanding

by
Elisa Prandini
1,* and
Gabriele Ghisellini
2,*
1
Department of Physics and Astronomy, University of Padova, Via Marzolo 8, 35131 Padova, PD, Italy
2
INAF Osservatorio Astronomico di Brera, Via E. Bianchi 46, 23807 Merate, LC, Italy
*
Authors to whom correspondence should be addressed.
Galaxies 2022, 10(1), 35; https://doi.org/10.3390/galaxies10010035
Submission received: 25 January 2022 / Revised: 9 February 2022 / Accepted: 11 February 2022 / Published: 15 February 2022
(This article belongs to the Special Issue Extragalactic TeV Astronomy)

Abstract

:
Introduced in 1998 to attempt a first unified view of the broad-band emission properties of blazars, the blazar sequence has been extensively used in the past 25 years to guide observations as well as the physical interpretation of the overall emission from these galaxies. In this review, we describe the evolution of the sequence along with the tremendous advances in the observational field, in particular in the gamma-ray band. A new version of the sequence built on TeV-detected objects is also presented. Two extreme classes of objects (MeV and hard-TeV blazars) are included in the discussion, given their relevance for future observatories. Finally, the current physical understanding at the base of the sequence is presented along with the major criticisms to the blazar sequence.

1. Introduction: The Blazar Paradigm

In retrospect, we can identify the discovery of the first quasar, 3C 273 [1], as the discovery of the first blazar as well. The 3C 273 was in fact a variable radio source with an optical counterpart, whose detailed spectroscopic analysis revealed an extragalactic nature ( z = 0.158 ). It was 1963, and tremendous advancements in the multi-wavelength and, more recently, the multi-messenger observations of the Universe have taken place since then. Almost sixty years after this first identification, thousands of blazars now populate the extragalactic sky. Blazars are by far the most numerous class of persistent extragalactic sources in the gamma-ray band (e.g., see [2]). A blazar is also the first extragalactic source identified as a likely counterpart of high-energy neutrino emission [3].
In the past decades, the increase in the number and quality of observations from the radio to the gamma-ray band along with improved theoretical models and numerical simulations allowed for the establishment of a paradigm explaining the blazar as well as the AGN structure and many of the observed properties in general [4,5,6]. Still, a number of unknowns remain concerning the AGN phenomenon. The ones most relevant to the blazar case are: the physical driver of the relativistic jet and how it connects with the BH mass and the accretion rate; the rate of cosmic rays and neutrinos emitted in a blazar’s jet and how it connects with the gamma-ray emission mechanisms; the origin of the observed variability and how it is connected with the overall multi-wavelength and multi-messenger emission (e.g., see [7] for a recent review).
Blazars are jetted active galactic nuclei (AGNs) with a jet pointing at a small angle (<10 ) toward the observer. Roughly 10% of jetted AGNs are blazars [7]. Blazars come in two flavors: Flat Spectrum Radio Quasars (FSRQs) and BL Lac objects, depending on the width of their emission lines. FSRQs exhibit lines with an equivalent width of > 5 Å. In BL Lac objects, the lines are fainter or even absent.
The current paradigm, seen in Figure 1, foresees that blazars, and more generally jetted AGNs, are composed of:
  • A supermassive black hole with a mass between 10 7 to 10 10 M , located in the center of an elliptical galaxy;
  • A flow of mass feeding the black hole, named the accretion disk;
  • Two highly collimated jets arising from the proximity of the central object and extending to several kpcs. Within the jet, there are regions where particles are accelerated to ultra-relativistic energies;
  • In FSRQs, an obscuring torus of dust that surrounds the accretion disc.
In FSRQs, the analysis of optical-to-X-ray data has shown that the accretion occurs through a thin and hot accretion disc. This disc is surrounded by a hot thermal corona and by two regions filled with clouds of gas, a narrow line region (NLR), and a broad line region (BLR). In BL Lac objects, the absence of broad emission lines and of any sign of thermal emission produced by the accretion disk suggests that the two properties are related. In other words, the weakness of the accretion disk radiation may be due to the accretion occurring in the Advection Dominated Accretion Flow (ADAF) regime (e.g., see [8,9,10]). The ADAF regime is radiatively inefficient and characterized by a dramatic decrease in ionizing UV photons that are unable to photo-ionize the clouds of gas responsible for the broad lines (e.g., see [11]). This coarse division into BL Lac objects and FSRQs, however, is in some cases arbitrary as transitional objects displaying mixed properties exist (e.g., see [12]).
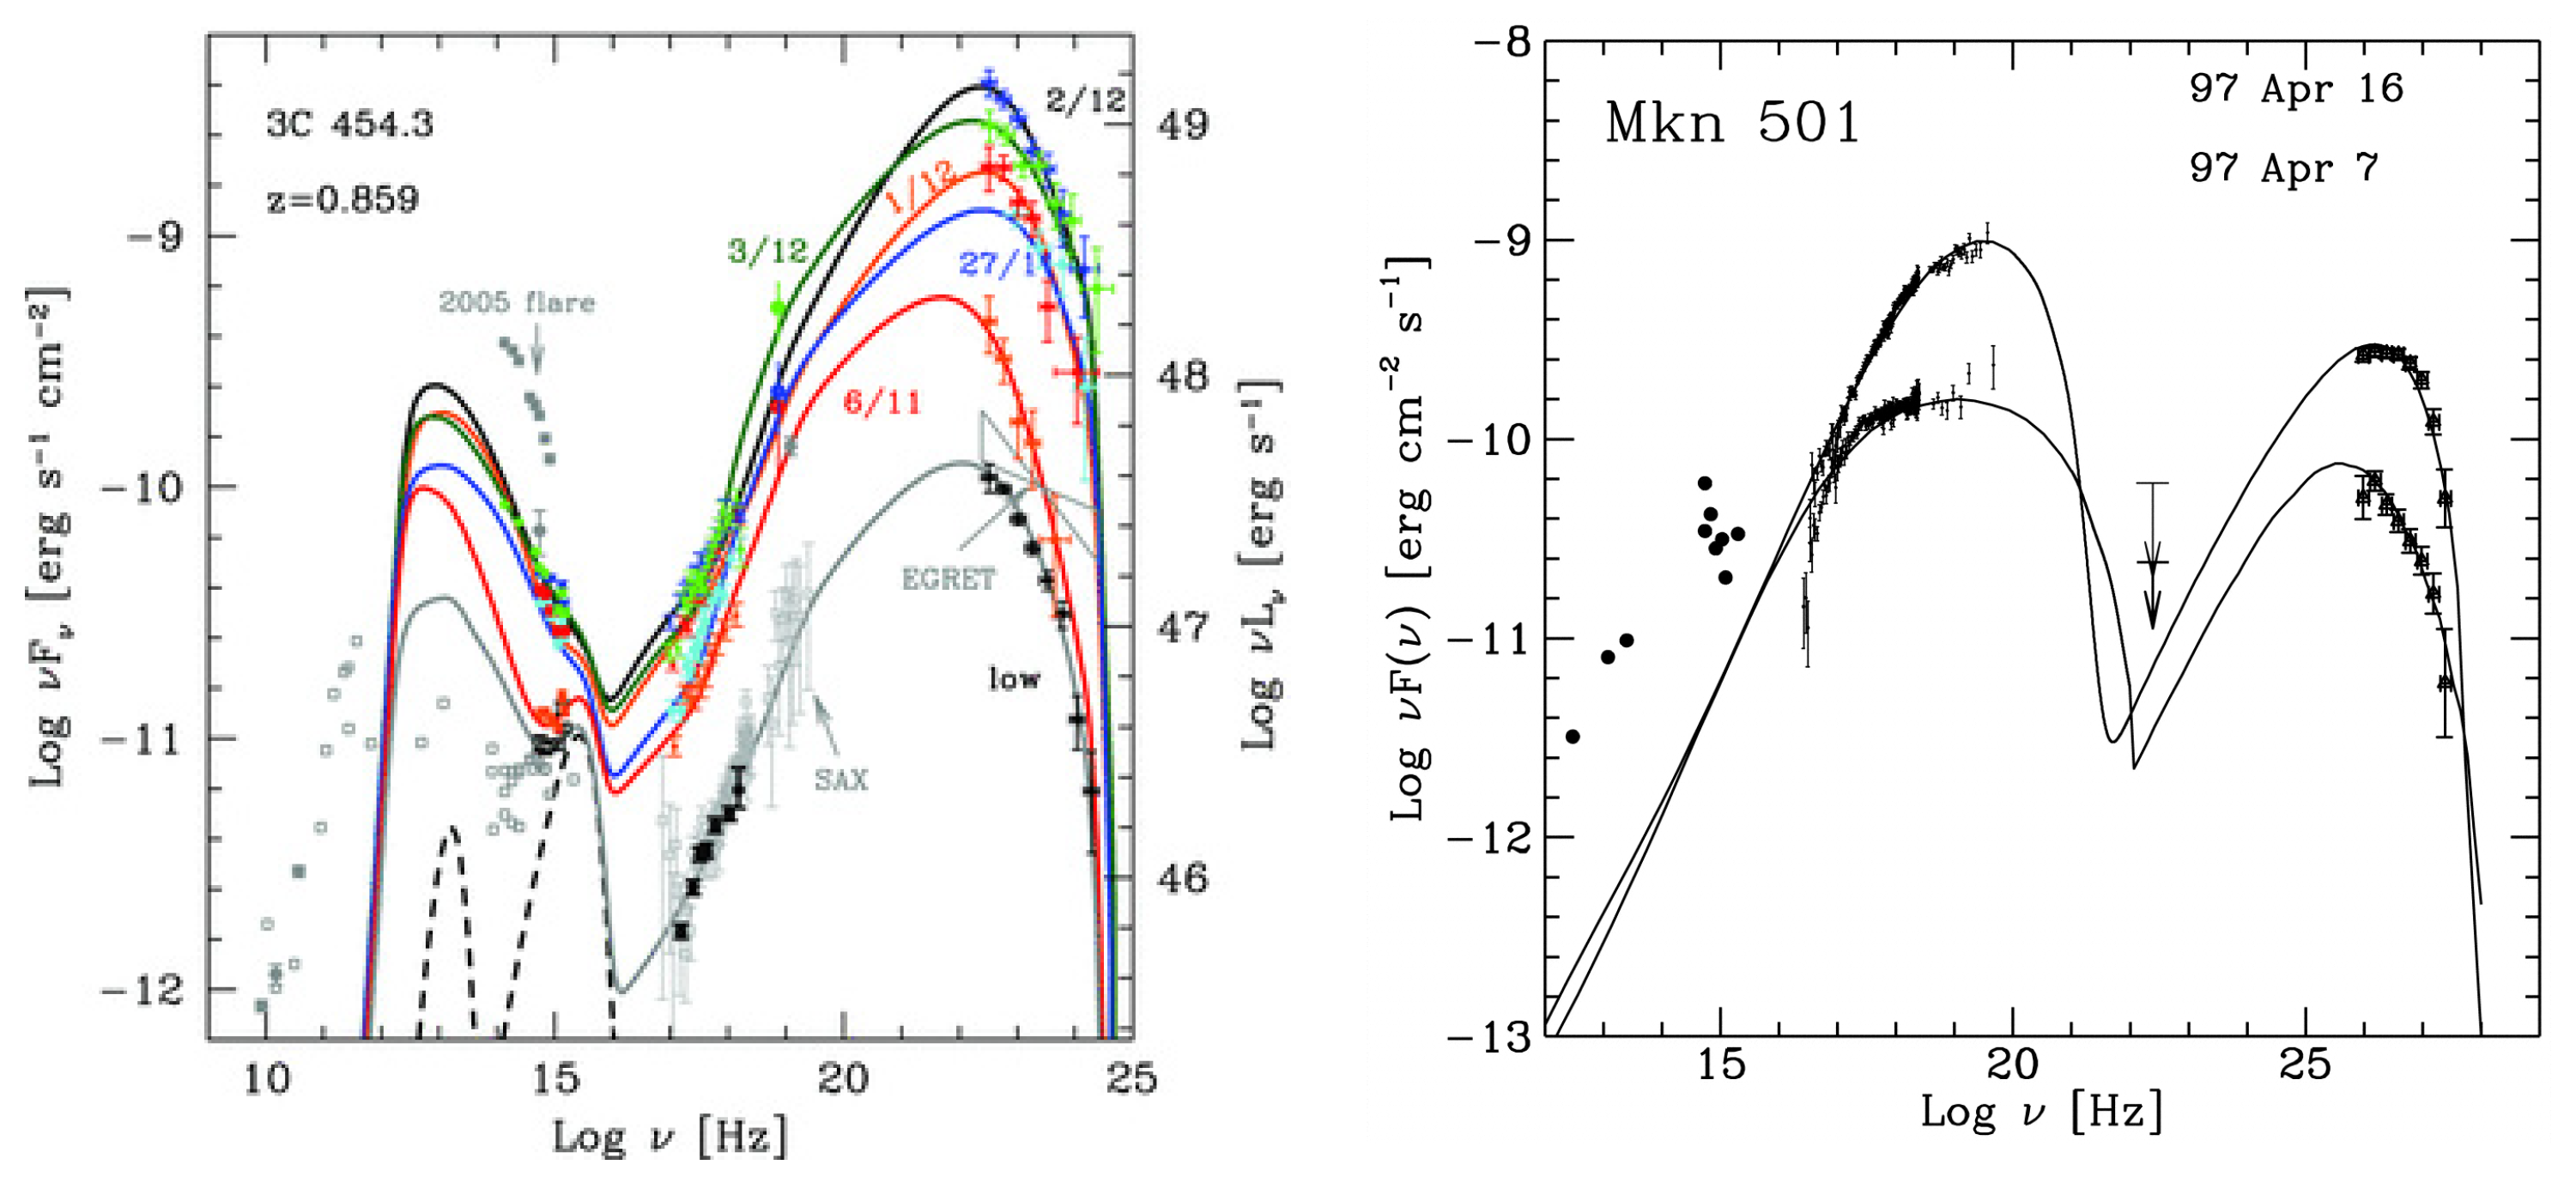
From the observational point of view, blazar emission covers more than 15 orders of magnitude in frequency, from radio to γ -rays. Blazars are in general highly variable objects, with variations ranging from months to minute timescales [13]. The complexity of the spectral energy distribution (SED) depends on the class of objects considered, with FSRQs showing a generally more articulated SED along with several superimposed contributions. As an example, the multi-epoch SEDs of two blazars, the FSRQ 3C 454.3 and the BL Lac object Mkn 501, are represented in Figure 2. The SED of 3C 454.3 is interpreted as the superposition of the jet emission (two broad bumps peaking at optical and gamma-ray energies), the IR torus, and the hot corona. Mkn 501 SED is instead fully characterized by the jet emission and a contribution of the host galaxy in the sub-optical spectral domain.
As usual in astronomy, classification based on experimental evidences helps to identify key features and pinpoint the physical mechanisms responsible for the broadband emission registered. Blazars make no exception to this rule. This review is devoted to the blazar sequence, a phenomenological sequence proposed by Fossati et al. [14] to describe the average properties of the SED of blazars. Since this first article, great advancements in the observations, particularly in the γ -ray band, have questioned and tested the sequence, which has been updated accordingly. Section 2 is devoted to an overview of the up-to-date observational properties of blazars complemented by a description of state-of-the-art emission models. In Section 3, we present the blazar sequence and its evolution through the years. We will also propose a new sequence based on TeV data. In Section 4, we discuss the extremes of the sequence, namely the MeV blazars and extreme blazars. In Section 5, we outline the physical interpretation of the sequence, while Section 6 is devoted to the main criticisms of the sequence. A discussion of future observations concludes this manuscript in Section 7.

2. Blazar Emission

Given their broadband and variable SED, coordinated and multi-wavelength observations are the key to accessing a reliable characterization of blazar emissions. From the observational point of view, the multi-wavelength approach only became accessible in the 1990s, when COMPTEL and EGRET in gamma rays [17,18] flanked several X-ray satellites (see [19] for a review) and opened the high-energy window. A few years later, this window was extended to the very high energy domain (VHE, E > 100 GeV) by ground-based Cherenkov telescopes (see [20] for a review). Starting in 2008, the Fermi satellite [21] together with the second generation of ground-based Cherenkov telescopes (H.E.S.S. [22], MAGIC [23], VERITAS [24]) have literally revolutionized our view and knowledge of the γ -ray universe.
One of the challenges that the blazar and the high-energy community in general is facing is that of collecting simultaneous, possibly strictly contemporaneous data in a broad range of frequencies. This often requires daily-scale human intervention (for target selection, request for observation, and coordination). An effort in this sense, focused on transient phenomena, is the Astrophysical Multi-messenger Observatory Network (AMON) [25] and, under development, a number of broker alert systems designed to handle the Vera C. Rubin Observatory Legacy Survey of Space and Time alert stream, such as the one discussed in Möller et al. [26].

2.1. Emission Models

The most popular models to interpret the blazar emission differ in particles and are:
-
One zone, leptonic [27], which considers that most (but not all) luminosity is produced in a well-defined zone at some distance R diss from the central engine by relativistic electrons;
-
One zone, hadronic (e.g., [28]), which assumes that the relativistic protons are responsible for the emission, even if not directly (except for the proton–synchrotron model). Proton–proton collisions, or more likely, photo-hadronic interactions, can produce electron positron relativistic pairs that can then radiate;
-
Multi zone, either leptonic or hadronic (e.g., [29]), assumes that the particles are accelerated and radiate all along the jet in a more or less continuous way. These models consider that the density of the emitting particles and the magnetic field are a (power–law) function of the distance from the black hole. In these models, the jet geometry (paraboloidal or conical) plays a crucial role.
Radiative processes: In all cases, the main radiation processes of the jet are the synchrotron mechanism for the low-energy part and the Inverse Compton (IC) for the high-energy part. If the seed photons for the IC scattering are the synchrotron photons produced by the same electrons producing the high-energy Compton component, the process is called Synchrotron–Self–Compton (SSC); if the main seeds are produced externally to the jet (disk radiation, BLR lines, torus, etc.), the process is called external Compton (EC).
Spine–layer structure: Observational evidence (e.g., [30]) and important γ –ray emission from misaligned sources (e.g., [31]) led to the suggestion that the blazar jet is structured. Ghisellini et al. [32] suggest that a high-velocity spine is surrounded by a slower layer ( Γ 13 and Γ 3 , respectively). The spine sees the layer radiation beamed, and this enhances its Compton emission. On the other hand, the layer also sees the radiation from the spine as beamed, and thus the Compton emission of the layer is also enhanced.
Thermal emission: BL Lacs. In BL Lacs, we see no sign of thermal emission, leading to the suggestion that:
  • The accretion regime is not radiatively efficient;
  • This corresponds to a paucity of ionizing radiation, corresponding to the absence of broad emission lines;
  • There is no molecular torus, as first suggested by Chiaberge et al. [33];
  • All these properties can be understood if the accretion luminosity, in units of the Eddington one, is smaller than some critical value ( L disk / L Edd 10 2 10 3 ).
Thermal emission: FSRQs. In powerful FSRQ, we do directly see the accretion disk radiation, besides the broad emission lines and the IR torus component. This therefore suggests that the high-energy emission of FSRQs is likely due to the EC process, while that of BL Lacs is due to the SSC (but possibly accounting for the spine–layer structure).

2.2. Energy Budget

The first duty of the jet is to bring mechanical energy to the extended structures (hot spots and radio lobes). Radiation corresponds to ∼10% of the total jet energy [34]. It is not easy to calculate the jet power directly from observations because the radiation is beamed. Nevertheless, if we know (i.e., from superluminal motion) the bulk Lorenrz factor Γ , then we can set a firm lower limit to the jet power that cannot be smaller than L o b s / Γ 2 [34]. Therefore, assuming 10% efficiency (e.g., [35]), we have a total jet power of the same order, but on average larger than the accretion disk luminosity [34]. Blazar jets are therefore the most efficient persistent engines in nature.

2.3. Key Observational Features

The key features of blazar emission in different bands can be interpreted in light of the above-mentioned emission models, as follows:
Radio: 
The radio emission of blazars is dominated by the beamed jet emission, and only at the sub-GHz frequency is there an emergence of radiation produced in the extended structures, such as hot spots and lobes. The radio spectrum is flat, i.e., F ( ν ) ν α with a spectral index α of around zero. This is due to the superposition of different jet zones self-absorbing at different frequencies. This was thought to be a “cosmic conspiracy” in the old days [36], but now it can be understood on the bases of simple conservation laws: the conservation of emitting particles along the jet demands that their density n R 2 (where R is the distance from the start of the jet), while the conservation of the Poynting flux demands that the magnetic field B R 1 . With these scalings, one derives a flat synchrotron radio spectrum and a self-absorption frequency ν t R 1 . This implies that at smaller frequencies, the emitting region is larger and the flux is less rapidly variable.
IR: 
In the IR band, we can have the contribution of the jet, and for FSRQs, of the molecular torus. For FSRQs, the sub-mm band is where the synchrotron peaks, and this corresponds to the self-absorption frequency of the innermost emitting region.
Optical: 
In the optical band, we have the contribution of the jet continuum, and for FSRQs, of the low-frequency part of the accretion disk. This component usually dilutes the polarization of the synchrotron component. For low-power BL Lacs, we also have the contribution of the host galaxy.
UV: 
For FSRQs in the UV band, we have the contribution of the steep tail of the synchrotron component and of the accretion disk, which becomes increasingly dominant as the total power increases. For BL Lacs, we only have the synchrotron emission: if the spectrum is rising (in ν F ν ) we call these objects High-frequency peak BL Lacs (HBLs) or “blue” BL Lacs; if the spectrum is decreasing, we have a Low-frequency peak BL Lac (LBL) or “red” BL Lac. We note, however, that both FSRQ and LBL classes hold transitional objects with mixed properties whose classification is somehow arbitrary.
X-ray: 
In FSRQs, the X-ray spectrum is increasing (in ν F ν ) with a spectral index α of around 0.5, generally flatter than what is expected for a thermal X-ray corona (for which α ∼0.7–1). For BL Lacs, we can have a rising spectrum for LBLs, while in the case of HBLs, the spectrum can peak in the X-ray band.
Gamma rays: 
In the γ -ray band, we have a contribution only from the non-thermal beamed component of the jet. In the sub-TeV band, the FSRQs usually show a steep (i.e., α > 1 ) spectrum, while HBLs can have their high-energy peak there or even at larger energies. In the latter case, we call these objects “extreme” BL Lacs. At these energies, the Extra-galactic IR and optical Background Light (EBL) can absorb (through photon–photon collisions producing electron–positron pairs (e.g., see [37]) high-energy photons, making the observed spectrum decrease almost exponentially. Since the level of the EBL is still uncertain [38], detailed observations of blazars can help to fix it.
Neutrinos: 
Neutrinos are the smoking-gun signature of hadronic interactions in blazars [39]. A single neutrino of energy 2 PeV detected by the IceCube Observatory has so far been associated with a blazar [3], the BL Lac object TXS 0506+056.

3. The Blazar Sequence: Observational Approach

3.1. The Original Blazar Sequence

The original blazar sequence was proposed in Fossati et al. [14] as an attempt to identify observational properties in the SED of blazars. The sequence was built using multi-wavelength data from 126 sources. It was the first systematic study of the SED of blazars, including γ -ray data above 30 MeV from EGRET [40]. For the compilation of the sequence, the sources were selected from the following samples:
  • X-ray-selected BL Lacs from the Einstein Slew survey [41];
  • Radio-selected BL Lacs from the catalog of extragalactic sources, with F 5 GHz 1 Jy [42]. For the selection, additional requirements were adopted based on radio flatness ( α R 0.5 ), optical brightness ( m v 20 ) , and the weakness of optical emission lines ( E W λ 5 Å ) ;
  • Radio-selected FSRQs proposed by Padovani and Urry [43] from the 2-Jy sample [44].
Table 1 summarizes the number of sources adopted from each catalog. We have also outlined the corresponding number of γ -ray-detected sources, both in the MeV-GeV and in the TeV range. Once it is considered that four sources were present in both BL Lac samples, and that one source of the X-ray sample was detected only at TeV, the net number of blazars selected for the study amounts to 126.
Once the source sample was defined, to build the sequence, the fluxes at seven well-sampled frequencies were collected from the NASA Extragalactic Database, NED (http://ned.ipac.caltech.edu/ (accessed on 24 January 2022)). When multiple observations were available, they were averaged logarithmically (magnitudes) in order to account for the large variability. The seven frequencies considered for the original blazar sequence are: radio at 5 GHz, millimeter at 230 GHz, far-infrared at 60 and 25 μm, near-infrared (K band) at 2.2 μ m, optical (V band) at 5500 Å, and soft X-ray at 1 keV. Additionally, information on γ -ray spectral properties were used when available. In particular, the EGRET detections were 32 (12 BL Lacs and 20 FSRQs), plus only one TeV-detected (Mkn 501) source belonging to the X-ray-selected sample. Out of the 32 EGRET -detected sources, 28 spectral determinations were accessible at the time of this study.
Before building the sequence, a number of checks were performed by the authors aimed at inspecting the differences between γ -ray detected and undetected source samples. The redshift, luminosity, and broad-band spectral indices were compared. No difference emerged between the γ -ray detected and undetected radio-selected BL Lacs and FSRQs. For the X-ray-selected sample, the analysis showed a tendency for γ -ray loud sources to have a larger radio luminosity and steeper radio and X-ray spectral indices. Indeed, the limited sensitivity of the EGRET instrument implies that only the γ -ray brightest sources were detected. Fossati et al. [14] underline that the average γ -ray luminosities reported in the sequence were necessarily overestimated. Twenty years later, the study of the properties of thousands of blazars detected in γ -rays with the Fermi satellite would confirm this limitation (Section 3.2).
As a second step toward a comprehensive characterization of the broadband emission from the sample, the authors determined the synchrotron peak frequency ν p e a k , s y n c with a simple fitting procedure in the ν L ν - ν plane. They then studied the relation between this frequency and several quantities, namely: luminosity in different bands, optical/radio and X-ray/radio flux ratios α R O and α R X , γ -dominance, i.e., the ratio between the luminosity in the γ -ray and that which corresponds to the synchrotron peak. The main results shown in Figure 3, representing the seeds of the blazar sequence, are:
-
The radio luminosity strongly correlates with ν p e a k , s y n c . In this study, the authors ruled out a possible bias due to z by performing detailed tests;
-
ν p e a k , s y n c correlates with both α R O and α R X , which means that knowledge of either of the two indices allows for a first estimate of ν p e a k , s y n c , at least in the range of 10 14 –10 16 Hz;
-
ν p e a k , s y n c also correlates strongly with the γ -ray dominance. This indicates that sources with a synchrotron peak at small frequencies are brighter γ -ray emitters.
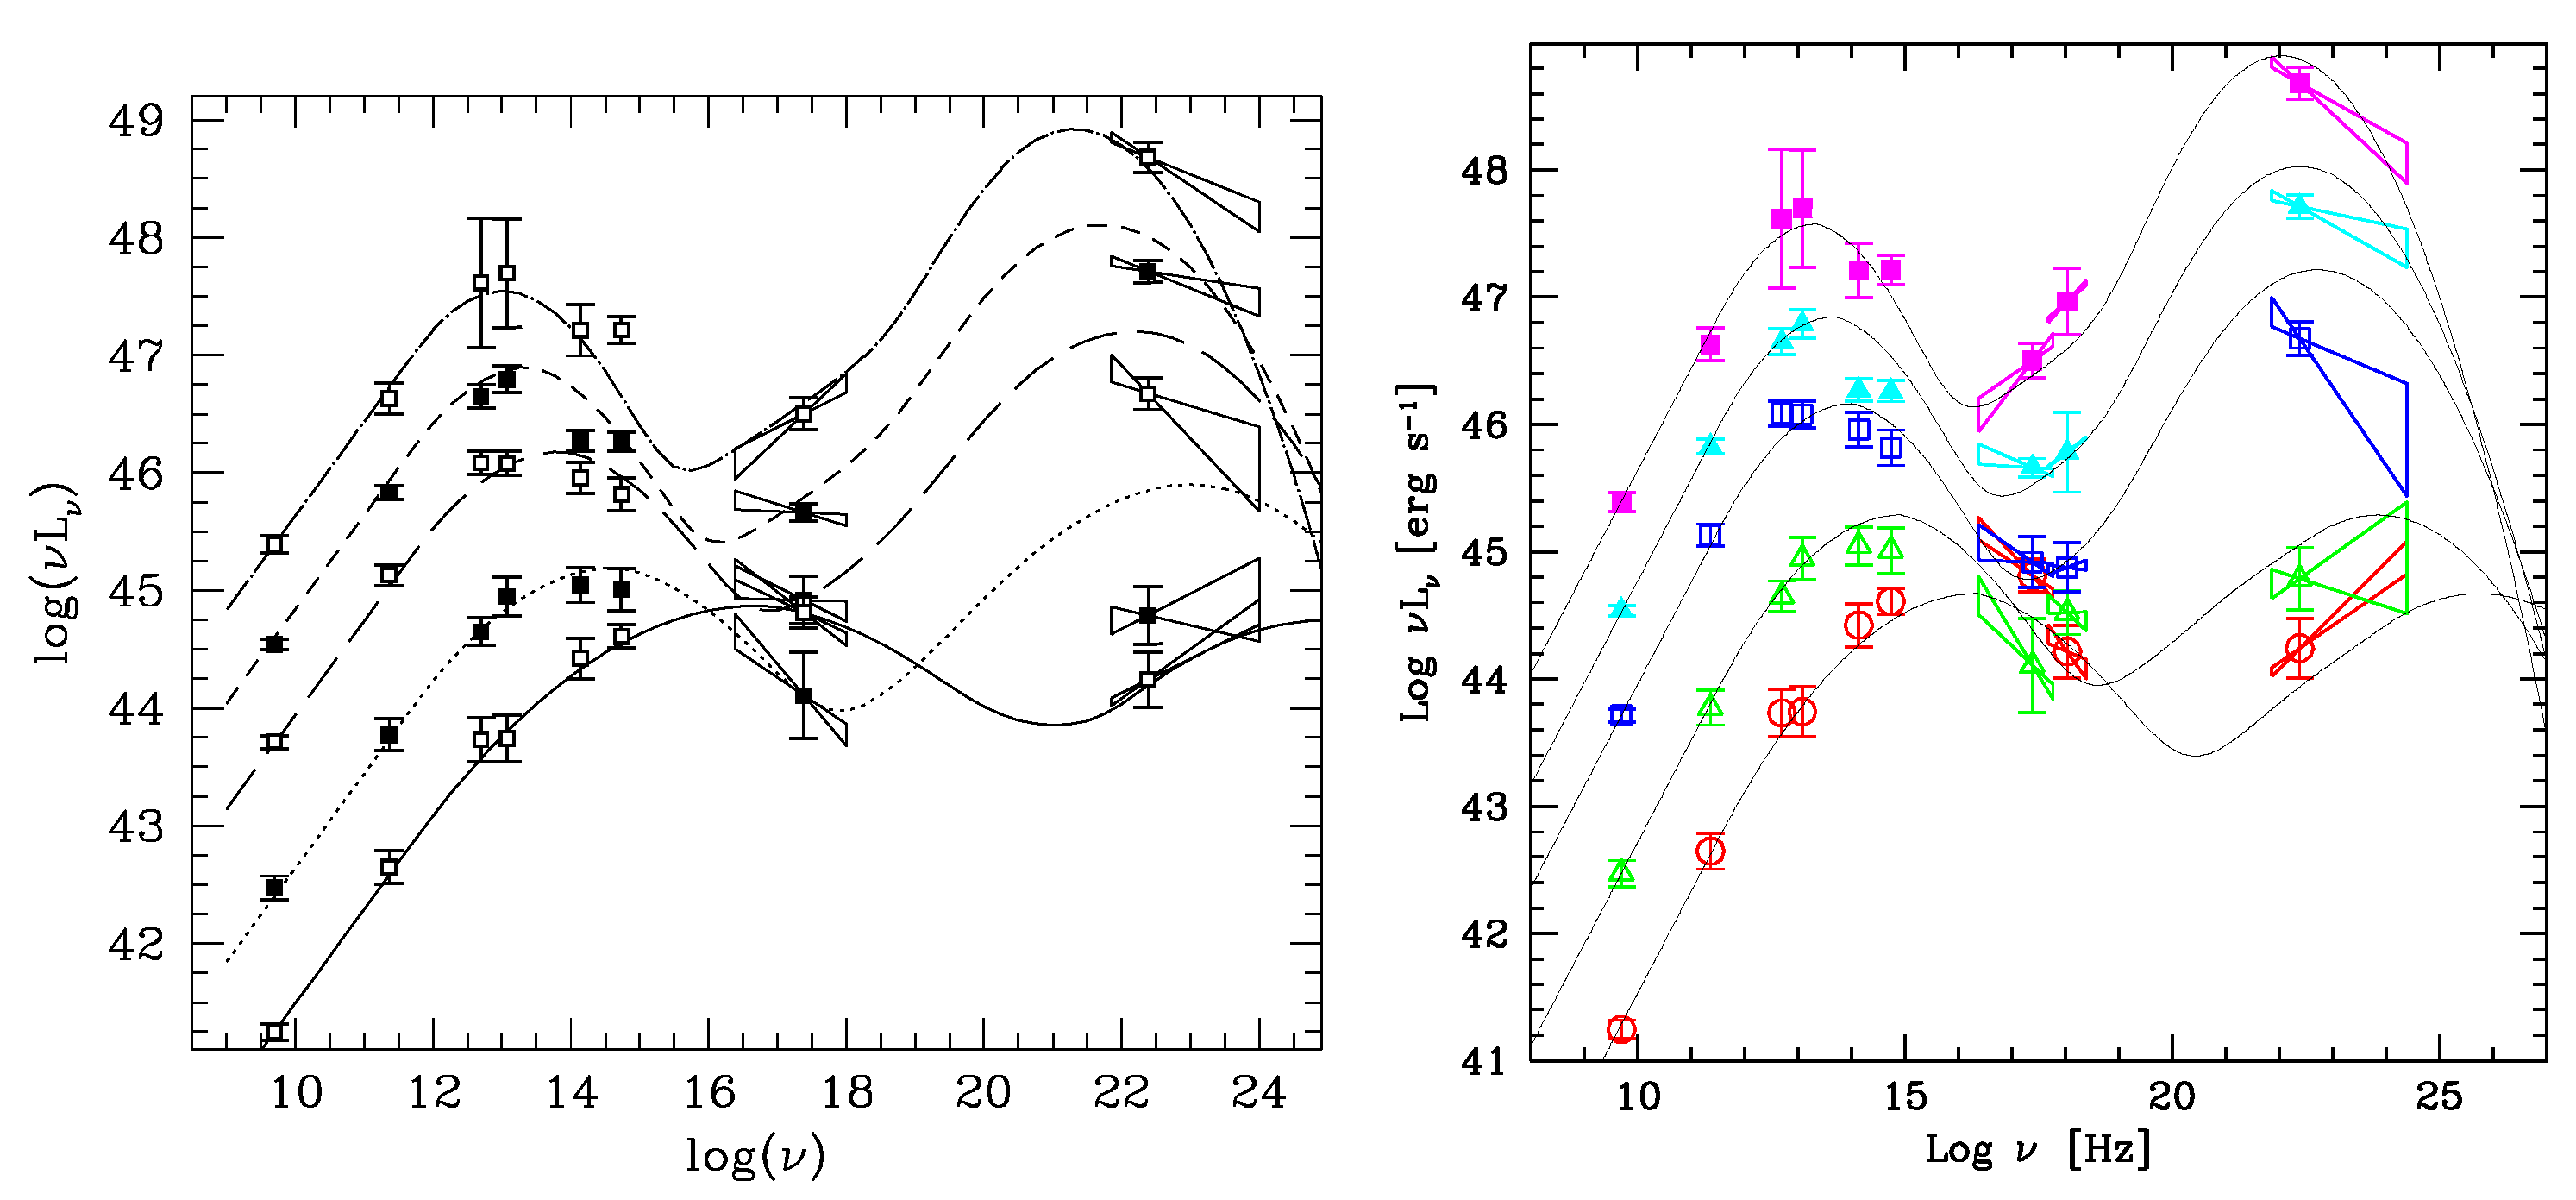
A clear picture emerged from this study: a smooth transition between different properties of the blazar SED appears when considering the synchrotron peak frequency. This becomes even more evident when five averaged broadband SEDs are built, adopting the radio luminosity as a bin criterion. This means that independently from the original classification of a blazar as FSRQ or radio/X-ray-selected BL Lac, the average SEDs were built taking into account only the luminosity of the source at 5 GHz, available for all objects. The result is the blazar sequence, displayed in Figure 4(left). The radio–bin log (L 5 GHz) intervals are: <42; 42–43; 43–44; 44–45; >45. A set of lines is superimposed onto the data, with the low-frequency part composed of a power law connected to a parabolic branch (synchrotron peak and successive steepening). A second power law connects this first peak to a second peak, approximated with another parabolic branch and built following some basic assumptions on the peak position and luminosities in different frequencies.
The analysis of the average data and their trends reveals that all SEDs present a two-peak structure. The frequency of the first peak is anti-correlated with the luminosity and moves from 10 13 14 Hz, for brighter sources, to 10 16 17 Hz, for fainter sources. A similar effect emerges in the high-energy peak despite the poor sampling and suggests that the frequencies of the two peaks are correlated. Another evidence is that sources with higher frequency peaks have a smaller γ -ray dominance (now called the Compton dominance).
Three years after the compilation of the original sequence, Donato et al. [45] updated it by adding the (2–10 keV) average spectral indices and fluxes for the same source sample introduced in [14]. The revised sequence is shown in Figure 4 (right), where only minor modifications were introduced in the parameterization of the SEDs. These modifications were physically driven and reflected the fact that for low-luminosity sources, there was growing evidence supporting the SSC scenario for BL Lacs. The work confirmed, on a statistical basis, that more powerful blazars emit X-rays by the inverse Compton process, while in less powerful objects, the dominant mechanism is the synchrotron. Thus, the shift in both peak positions proposed by the original sequence was confirmed.
The emergence of the blazar sequence was of uttermost importance in the experimental, phenomenological, and theoretical panorama. First, it suggested that a classification based on the synchrotron peak position—in particular for BL Lac objects classified into low-, intermediate-, and high-synchrotron peaked sources—must have a physical base, given the smooth evolution observed between the blazar classes. This explanation should also account for the Compton dominance behavior emerging at the highest energies. Moreover, it became evident that the common observational properties between the FSRQ and BL Lacs call for a common structure and underlying physical mechanisms.
From the experimental perspective, the sequence represented a challenge for the emerging VHE γ -ray instruments, whose low-energy detection threshold was around 10 26 Hz. It suggested that the brightest γ -ray objects had the bulk of their emission at frequencies well below the VHE γ -ray range.
However, this sequence was built with just a hundred sources, and in the case of the γ -ray band, only ∼30 sources were adopted to build the average SEDs. Moreover, the average SEDs were built without taking into account the simultaneity of the data in different bands. While the former criticism was overcome a few years ago (Section 3.2), the latter is still a matter of debate (Section 6).

3.2. The Fermi Blazar Sequence

Almost 20 years after the publication of the paper on the blazar sequence, and motivated by the detection of about 1500 blazars by the Fermi-LAT satellite in the γ -ray band, as reported in the 3LAC catalog [46], Ghisellini et al. [47] proposed a revised sequence called the Fermi sequence. This time, the authors explored the existence of an SED sequence on a sample of γ -ray-selected blazars, binned according to the luminosity in the MeV-GeV energy range.
The source sample was extracted from the 3LAC catalog, a complete, flux-limited sample built with 4 years of Fermi-LAT observations. The full catalog includes 1563 sources identified with AGNs at high galactic latitudes, with 98% blazar associations. After removing sources with no clear association, no redshift determination, and/or not associated with blazars, the authors built a sample of 747 sources (299 classified as BL Lacs and 448 as FSRQs).
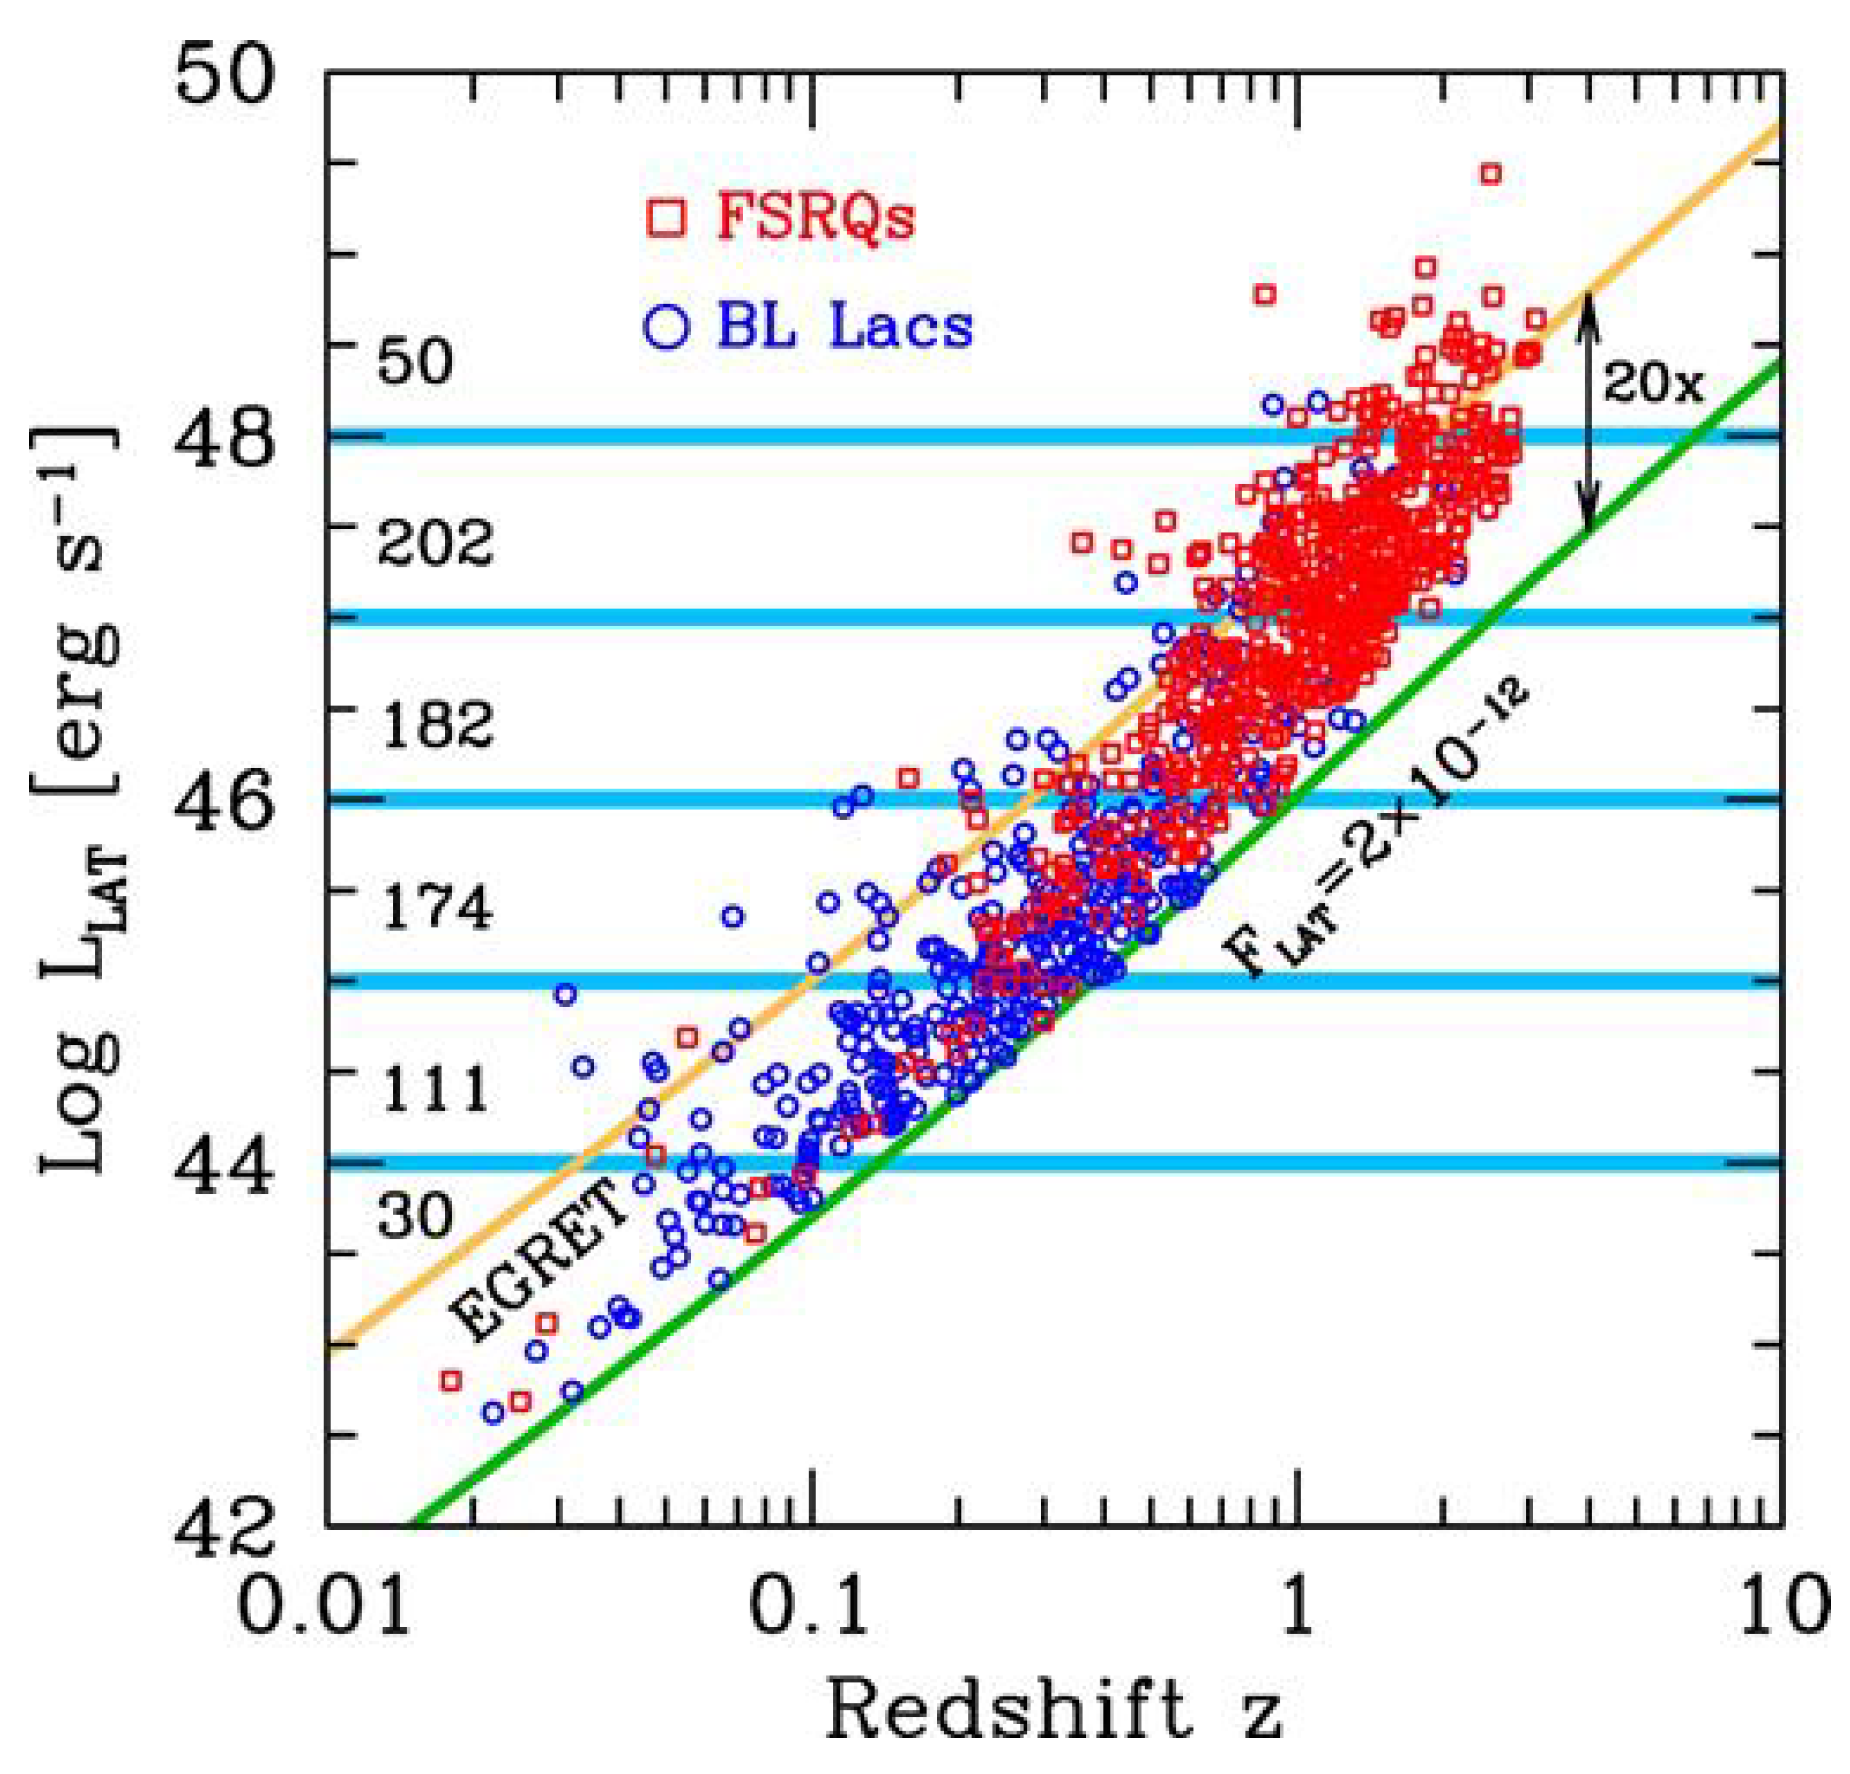
The 0.1–100 GeV band K-corrected luminosity as a function of the redshift is represented in Figure 5. The redshift distribution reaches z 3 and the luminosity range spans several orders of magnitude: from 10 42 to almost 10 50 erg/s. In general, BL Lac objects are located at a smaller z, mostly below z 1 , and exhibit lower average luminosity. FSRQs are, however, located at intermediate and large z and exhibit larger average luminosity.
For the construction of the revised sequence, the sample was divided into six luminosity bins, delimited by horizontal lines in the figure. In analogy with the original sequence, each luminosity bin spans a decade in gamma-ray luminosity. This allows for an easy comparison between the two sequences. Table 2 lists the luminosity bins adopted in the study. In the table, the main phenomenological parameters describing the average SED are reported, namely the synchrotron peak position ( ν S ), the inverse Compton peak position ( ν I C ), and the Compton dominance value (CD).
The last three columns of the table report the total number of objects in each bin, the fraction of FSRQs, and that of BL Lac objects, respectively. Above 10 45 erg/s, the sample is dominated by FSRQs, while at low-luminosity BL Lac, objects are dominant. Only two BL Lac objects display an average luminosity of > 10 48 erg/s. On the other hand, nine FSRQs belong to the < 10 44 erg/s luminosity bin, as can be seen in Figure 5. The Fermi sequence is illustrated in Figure 6: in the bottom panel, FSRQs and BL Lacs are shown together, while in the top and central panel, they are shown separately. This distinction allows for a comparison of the two source classes.
When divided into luminosity bins, the Fermi-selected blazars form a sequence with the same average properties as that of the original sequence. We notice a shift in both synchrotron and inverse Compton peak position with decreasing luminosity. A change in CD is also evident. When considering BL Lac objects and FSRQs separately, however, some additional features emerged in the study. The peak shift mostly affects BL Lac objects and not FSRQs. On the other hand, the increase in CD with increasing luminosity is only evident in the FSRQ sub-sample.
The more complex scenario that emerged in this study with respect to the original one might be explained in part by the presence of blazars with a wide range of black hole masses in this new sequence. While it is highly likely that the original sequence concerned only BL Lacs and FSRQs with black holes with large masses, the improved sensitivity at all frequencies allowed for the detection of objects with smaller masses. This is an effect particularly evident in the low-luminosity bins, where nearby intermediate mass FSRQs coexist with nearby BL Lacs with higher masses. The net result is a large dispersion of the points in the broadband SEDs of Figure 6.

3.3. The TeV Blazar Sequence

In recent years, the rapid development of Cherenkov telescopes allowed for the detection of a significant number of blazars in the TeV energy range. In the TeVCat catalog (http://tevcat2.uchicago.edu/) (accessed on 24 January 2022), there are now 81 blazars, and 67 of these have a measured redshift. Using the SSDC Sky Explorer facility (https://tools.ssdc.asi.it/) (accessed on 24 January 2022), we constructed the SED for each of these sources. We then divided the FSRQs and BL Lacs, and using SSDC data, we divided the latter into the same γ -ray luminosity bins adopted for the Fermi blazar sequence in order to allow for a direct comparison.
The result is shown in Figure 7, where the source data are compared with the 1- σ stripes corresponding to the average SED derived by Ghisellini et al. [47] for the same luminosity bin. We can see that there are no strong differences between the SED of the blazars detected by Fermi and the ones that were also detected in the TeV band. However, there is indeed an indication, for the brightest TeV BL Lacs, that their X-ray luminosity is generally larger than the average of the Fermi blazars with the same luminosity in the Fermi energy range.
A possible explanation of this effect is that some of the blazars in this luminosity bin are blue quasars. These sources would not contradict the proposed explanation for the sequence based on radiative cooling (Section 5) because they could be FSRQs that produce most of their power beyond the typical distance of the BLR. The deficit of seed photons for scattering in these sources implies reduced radiative losses and hence a large γ peak , resulting in a blue spectrum [48]. Alternatively, this could be simply due to a selection effect, and they might represent the few bright existing HBLs. Since the TeV sample is strongly biased toward sources with high X-ray luminosity (one of the criteria used for the identification of the best targets), it is natural that the first sources detected in these energy bins are the brightest in the X-ray range.
A third plausible option is that these are HBLs with a wrong (too large) redshift determination; hence, their bolometric luminosity is overestimated. Indeed, many of the redshifts determined for HBLs are debated due to the difficulty in detecting the host galaxy [49]. We will investigate this issue in a future paper (Prandini et al. in prep.).

4. At the Extremes of the Blazar Sequence

The most recent sequence proposed by Ghisellini et al. [47] includes 747 sources, a sample almost six times larger than the original one used by Fossati et al. [14]. Despite the large number of sources considered, however, two sub-classes of sources might still elude the study. These are the MeV blazars and the extreme-TeV blazars. The former have a powerful high-energy peak of up to a few MeV and could therefore remain undetected by the Fermi-LAT that observes in the energy range beyond 100 MeV. However, extreme-TeV blazars peak at a few TeV and are expected to have a steady but faint emission in the GeV-TeV range. Thus, the fainter or more distant objects might easily remain below the sensitivity limit of the Fermi. These sub-classes represent the two extremes of the sequence, and their detection by future experiments in the MeV and TeV range is of great importance for testing the current understanding of the blazar sequence.

4.1. Extreme TeV Blazars

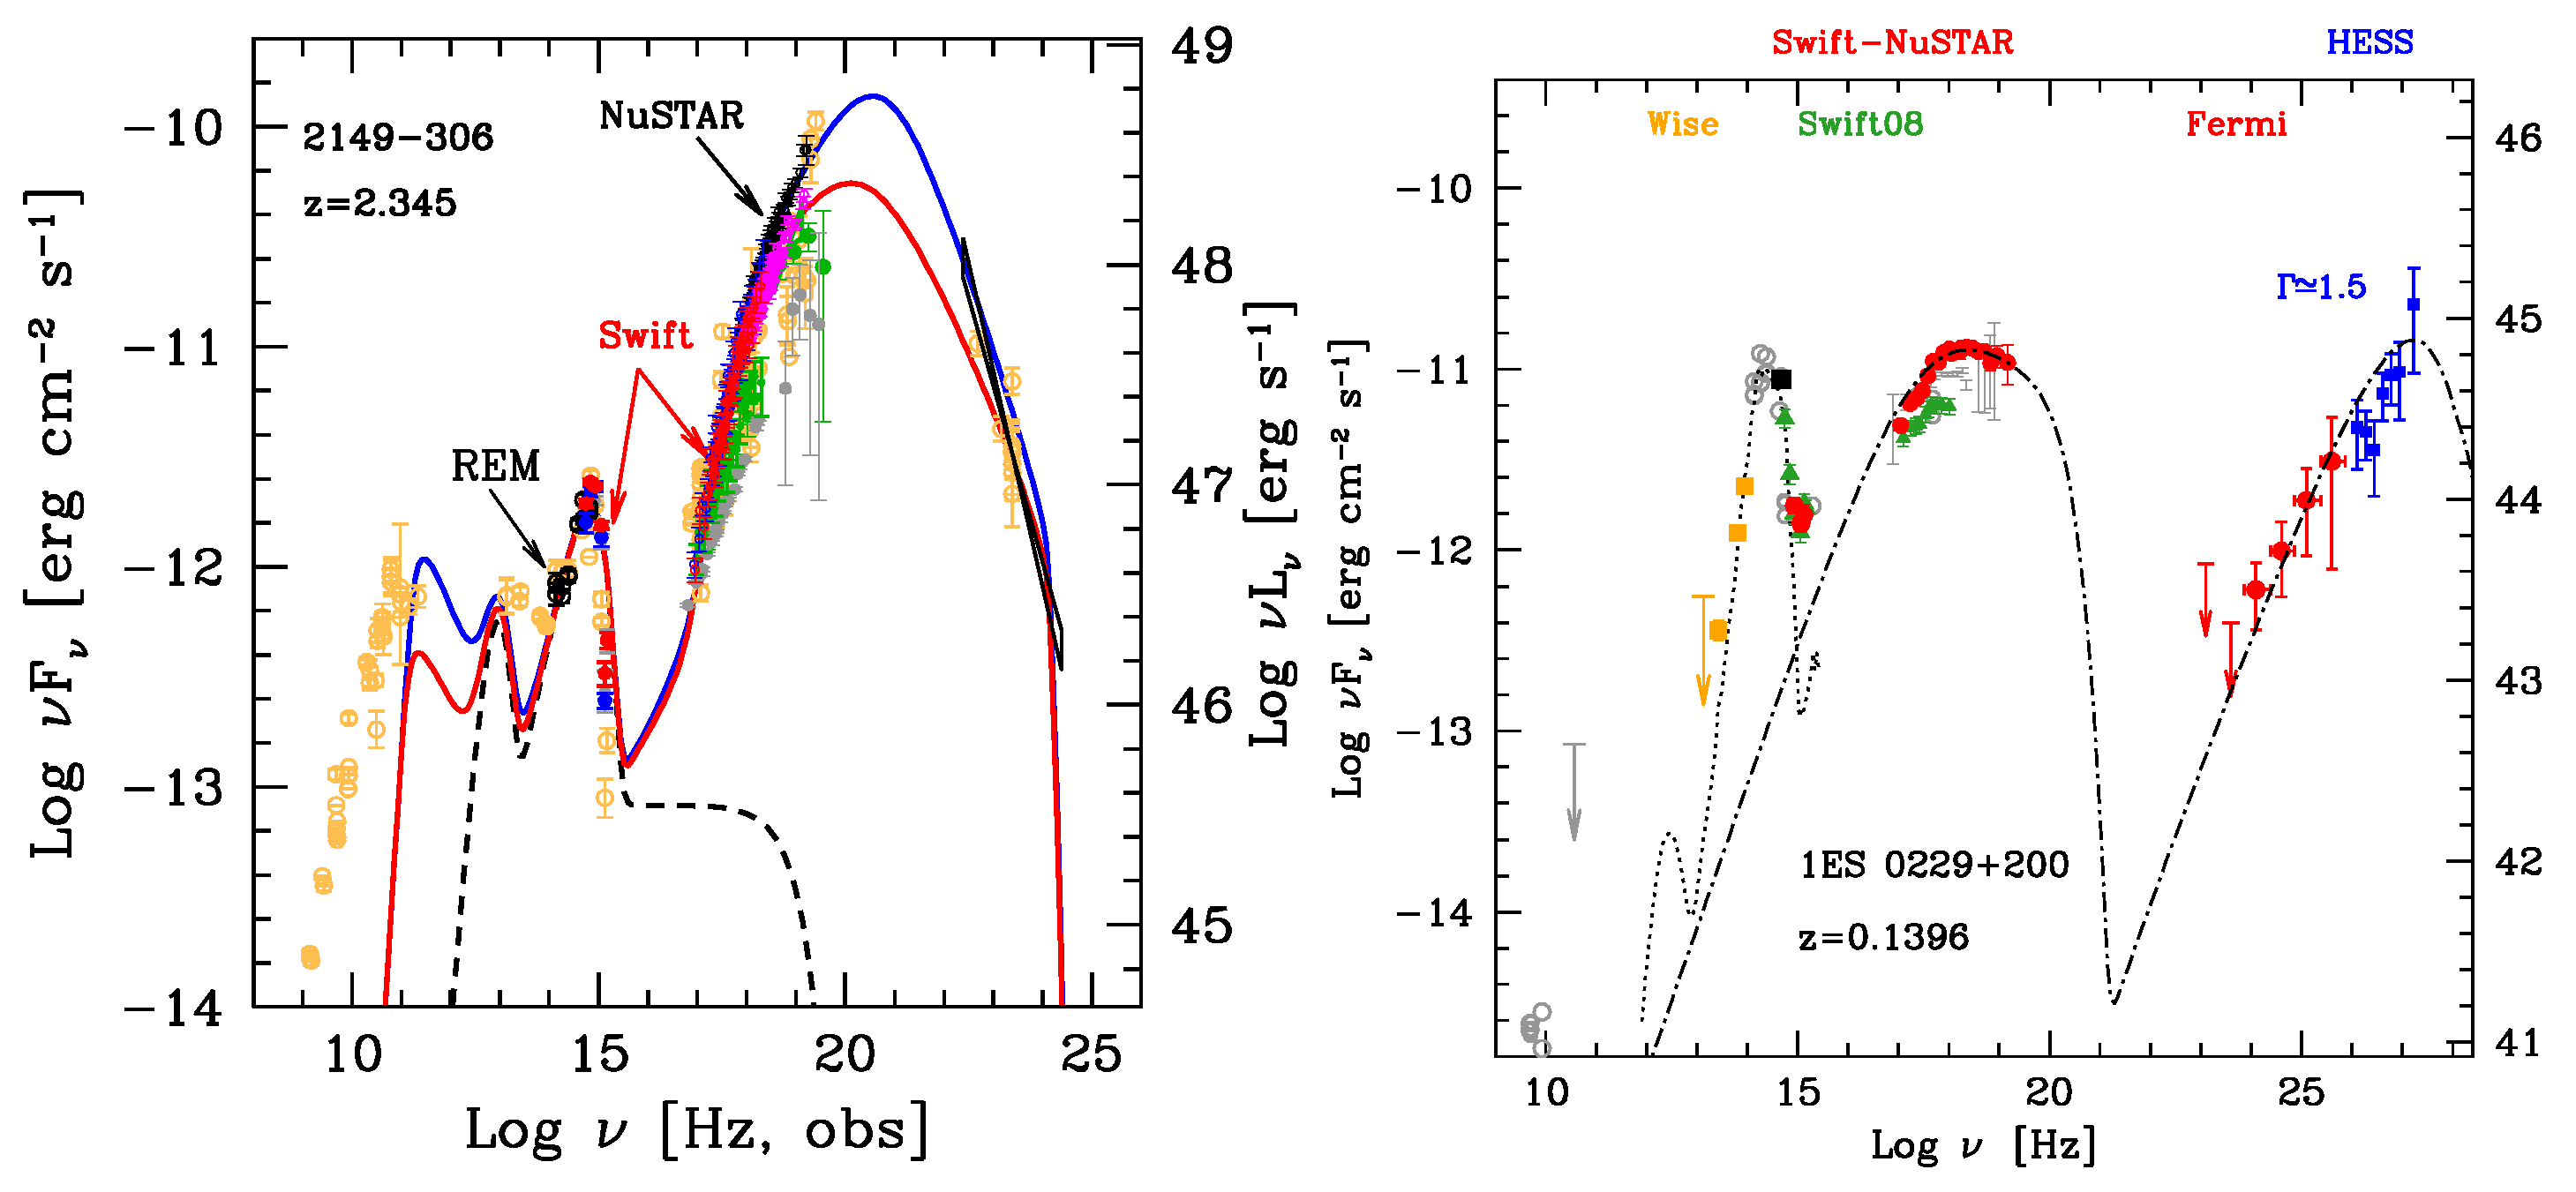
Out of the several tens of VHE gamma-ray emitting blazars discovered so far, roughly 1/4 are classified as extreme blazars (see [50] and references therein). These extreme blazars come in two flavors: extreme synchrotron and extreme TeV sources. The former are characterized by a synchrotron peak beyond 1 keV, while the latter exhibit a γ -ray peak energy above 1 TeV. The prototypical extreme TeV blazar is 1ES 0229+200, as seen in Figure 8(right). Located at redshift 0.14, this blazar holds the record for the highest γ -ray peak frequency, exceeding 10 TeV. As reported by Biteau et al. [50], all 14 known extreme TeV blazars but one are also extreme synchrotron sources. This suggests that reaching >TeV peak energy also requires >keV synchrotron peak frequencies, hence an efficient electron acceleration up to high energies. Another key characteristic of this class of sources is their faint luminosity. For the known extreme TeV blazars, the luminosity measured barely exceeds the Fermi-LAT sensitivity limit in the gamma-ray range. This might suggest that the extreme TeV blazars identified so far are only the tip of the (faint) iceberg of the extreme TeV blazar population. The bias is due to the selection effect in the VHE energy range, where the observations in the last 15 years have been driven by the Fermi-LAT properties reported in the published catalogs.
In the context of the Fermi blazar sequence, these still missing extreme TeV blazars would populate the lowest luminosity bin. Future gamma-ray instruments such as LHAASO [52], SWGO [53], ASTRI [54], and CTA [55] will be the key to probe this expected trend. Wide field-of-view instruments such as LHAASO and SWGO will have the advantage of a wide field of view but a limited sensitivity at sub-TeV energies, limiting the survey to nearby objects ( z 0.2 ). Future IACTs, however, will access a parameter space (GeV-TeV energy, entailing a large distance z > 1 and low luminosity) still not explored by the current generation of gamma-ray instruments with a limited field of view. Therefore, targeted observations on promising objects (e.g., [56]) will be performed in this case.

4.2. MeV Blazars

If we now focus our attention on the opposite side of the sequence, we might wonder if there are missing objects peaking at low frequencies. Following the main trend of the sequence, these would most likely be very powerful FSRQs peaking in the ∼meV and MeV energies, respectively. The Fermi-LAT non-detection is due to the fact that the high-energy emission does not reach the LAT energy band.
Interestingly, a number of recent studies in the hard X-ray band have consolidated the existence of ultra-luminous FSRQs, located at a large redshift ( z > 2 ). In addition to the large distance, these objects are characterized by an extremely massive central black hole, estimated to be among the largest known (e.g., see [57]). The main factor limiting the Fermi-LAT detection of this subclass of objects is their distance, which affects the observed flux. An example of a powerful MeV blazar is the 2149–306, whose SED is shown in Figure 8(left). The source is located at redshift 2.354. de Angelis et al. [58] show that if this blazar were located at z = 7 , it would be out of reach for the current generation of γ -ray telescopes. Nevertheless, it would be detected in the MeV range by future generations of MeV satellites such as the e A S T R O G A M [58], A M E G O [59], or COSI [60].

5. The Blazar Sequence: Theoretical Approach

The original blazar sequence was soon [61] interpreted as a sequence of radiative cooling. The main idea is that the emitting electrons cannot achieve high energies if their radiative cooling (by the synchrotron, Self Compton, and External Compton processes) is severe. According to this idea, the broad line region and the molecular torus in FSRQs are essential sources of seed photons for the External Compton process, and this implies that the random Lorentz factor of the electrons emitting at the peaks of the SED, γ peak , is relatively small. Therefore, the peak of their synchrotron emission occurs in the sub-mm band, while their high-energy peak is in the MeV band. Another important consequence is that the inverse Compton process becomes dominant with respect to the synchrotron one, implying a large Compton dominance. In BL Lacs, the absence of an important thermal source implies the paucity of seed photons for Compton scattering. The radiative cooling is less severe, allowing electrons to achieve a large γ peak . Thus, the synchrotron peaks in the UV–X-ray band, and the high-energy hump peaks in the GeV and sometimes even in the TeV band. The lack of ambient seed photons implies that only the SSC process contributes to the high-energy emission. As a result, the high-energy component in BL Lacs is usually not dominant.

Physical Parameters

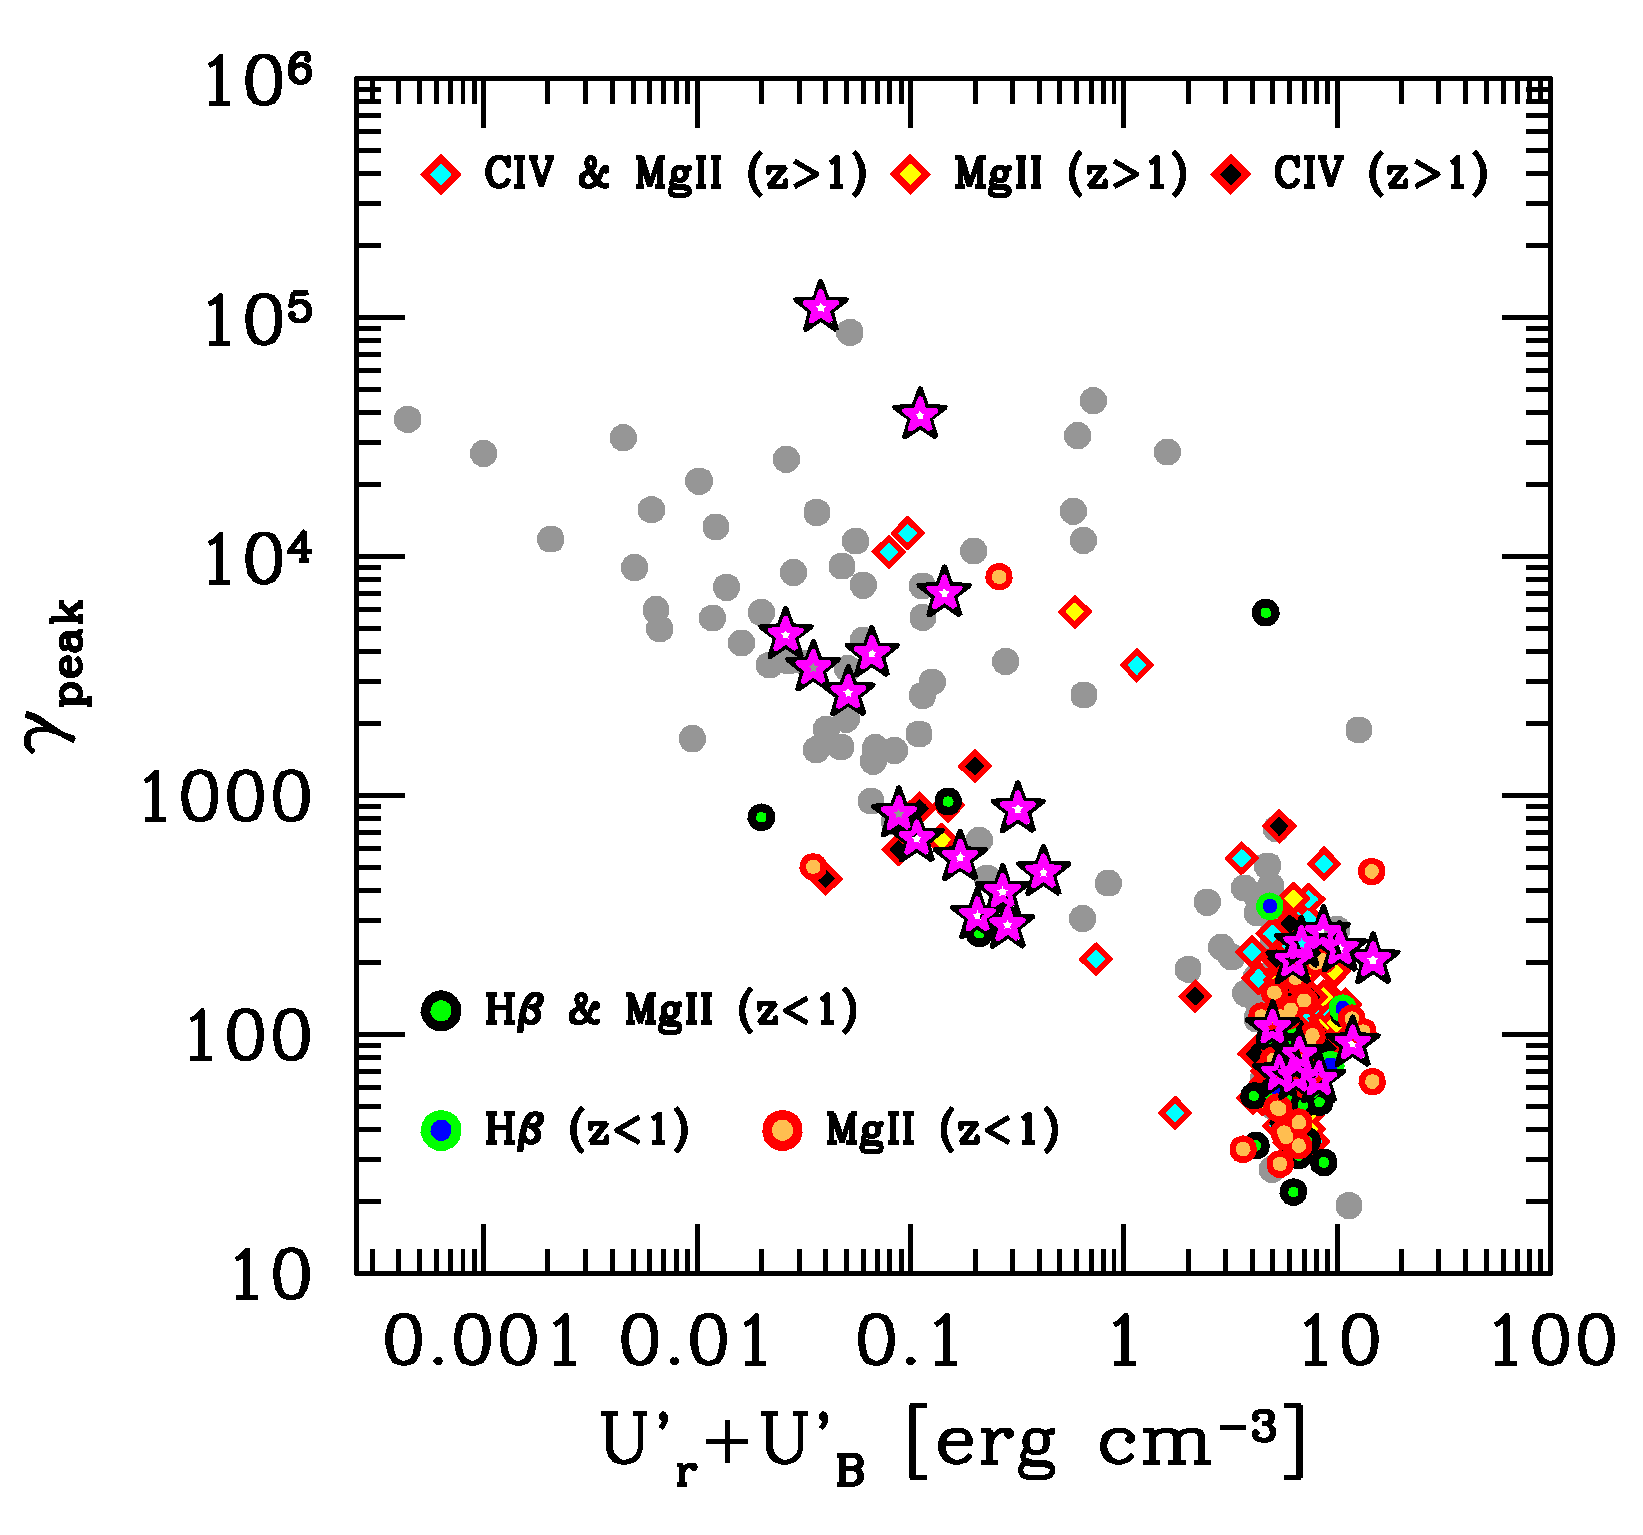
This idea can be checked by applying a leptonic one-zone model, which allows for the postulation of the physical parameters of the different classes of sources. Figure 9 shows the random Lorentz factor γ peak of the electrons contributing to the peaks of the SED as a function of the total (magnetic plus radiative) energy density, as measured in the co-moving frame [62,63,64]. There is a clear trend: the largest electron energies are possible only for small values of U B + U r .
We also know that the presence or absence of broad emitting lines is associated with the luminosity of the accretion disk and its accretion regime. Furthermore, there is a relation between the jet power and the disk luminosity. Therefore, the blazar sequence can be thought of as also being a sequence whose main parameter is the jet power, or equivalently, the disk luminosity. On the other hand, we must also consider the mass of the central black hole, since the accretion regime changes when the disk luminosity is of the order of 10 3 10 2 of the Eddington one.
The fact that there is no trend between luminosity and the location of the peak frequencies for FSRQs can be readily explained if the emission occurs within the distance of influence of the BLR and/or the molecular torus. In fact, the BLR radius is proportional to L disk 1 / 2 : this implies that the radiation energy density of the line photons ( U BLR 0.1 L disk / ( 4 π R BLR 2 c ) is constant as long as the emission site is within R BLR : U BLR 1 / ( 12 π ) . A similar conclusion also holds for the energy density of the torus radiation, once the torus is approximated as a portion of a sphere of radius R T intercepting and re-emitting a fraction f of L disk : U T 0.07 f / ( 12 π ) [64]. Both U BLR and U T are seen to be boosted by a Γ 2 factor in the co-moving frame.
We note that Costamante et al. [65] argued that the fingerprint of the γ γ e + e process due to the presence of emission line photons is not visible in the Fermi-LAT spectra of blazars (see [66]). With the aim of explaining the sequence in terms of different radiative cooling, the fact that the location of the emitting region is inside the BLR sphere or outside of it, but within the torus, is not very important. Within the BLR, the corresponding radiation energy density is larger, and timescales are shorter. Within the torus, the external radiation energy density is smaller, but the size of the source is probably larger, so that the ratio between the dynamical and the cooling timescales in the two zones are not very different.
For BL Lacs, the absence of these structures implies that the radiation energy density is of synchrotron origin alone, and therefore associated with the jet power and luminosity; additionally, we do see a trend of larger γ peak for smaller ( U B + U r ) .

6. Criticisms of the Blazar Sequence

Since its birth in 1998, the blazar sequence has been and still is a matter of active debate. We can divide the main criticisms roughly into two categories: in the first, the validity of the observed sequence is accepted, but the interpretation is different from the original one (which assumes that what drives the sequence is the difference in radiative cooling); for the second category, the sequence is not real, and it is only the result of observational biases.
Under the first category, there is a paper by Fan et al. [67] that extends the work of Nieppola et al. [68]. They explain the observed blazar sequence as a sequence of Doppler factors, which boosts the intrinsic luminosity and the intrinsic peak frequencies. They claim that in the co-moving frame, the sequence should have just the opposite trend. Consider that the method of deriving the beaming factor uses the brightness temperature compared with the equipartition value of 5 × 10 10 K [69] and the minimum variability timescale observed in the radio. This implies that sources that are not varying during the observation periods are bound to have very small Doppler factors, and that they in fact range from ∼1 to ∼30. It is thus possible that some sources are under-corrected. It must also be considered that the beaming in the radio band may be different from the beaming of the more compact and innermost regions producing the bulk of the emission.
Alternatively, the sequence has been interpreted by Potter and Cotter [70] in their inhomogeneous jet model as a consequence of the different location of the dissipation region: in BL Lacs, this is closer to the central engine than in FSRQs, resulting in stronger magnetic fields, a smaller Compton dominance, and larger peak frequencies with respect to FSRQs.
In the second category, we find, among others, the study of Keenan et al. [71], which considers more than a thousand blazars of both the FSRQ and BL Lac type. They conclude that FSRQs, while spanning a large range of observed luminosity, are all low-peaked blazars. More importantly, there is no luminosity–peak frequency trend in BL Lacs. Figure 4 illustrates this point, wherein one indeed notices a very large spread of peak frequency for any luminosity of BL Lacs, but there is still a trend of larger synchrotron peaks for smaller luminosities.
A detailed proposal questioning the reality of the sequence was put forward by Giommi et al. [72], proposing what they call a “simplified scenario” for blazars. According to these authors, the blazar sequence is a result of selection effects with no physical link between the luminosity and the overall blazar SED. At both high and low luminosities, we have both red and blue blazars. In this scenario, the distribution of the γ peak is assumed to peak at ∼10 3 , and it is asymmetric, with a high-energy tail broader than the low-energy one (see Figure 4 of [72]). Furthermore, the radio luminosity function is N ( L ) L 3 , the magnetic field is assumed to be B = 0.15 G for all blazars, and the mean Doppler factor distribution is < δ > = 15 ± 2 . The immediate consequence is that there exist many BL Lacs of low power with a “red” SED. These are the ones with a γ peak ∼10 3 or smaller. We do not see them yet as they are at low luminosity, and we do not have a survey deep enough that would allow them to emerge. These objects should have a high-energy, synchrotron self-Compton spectrum peaking in the 1–10 keV band (see Figure 11 of [47] for an illustration of this point). According to this idea, BL Lacs should already be detected in the radio, at moderate (but still unknown) redshifts, with no X-ray detection. On the other hand, with the advent of e R O S I T A [73], and further in time with A t h e n a , these objects would be detected in X-rays, helping to probe their BL Lac nature.

7. Future Perspectives

After more than 20 years from its proposition, the blazar sequence is still alive and spiritedly discussed. It has been deeply investigated from both the experimental and theoretical points of view. The original trend has been confirmed by recent, extensive data in γ rays; even if BL Lac objects and FSRQs seem to behave differently, they remain consistent with the theoretical expectations. The emerging sample of TeV-detected blazars, despite a strong selection bias, offers a new interesting perspective that will be further investigated.
Interestingly, Rodrigues et al. [74] studied the neutrino and ultra-high energy cosmic ray (UHECR) emission based on the model [75] in the context of the blazar sequence. A strong connection has been reported, with HBLs tending to produce UHECRs, while FSRQs are more efficient neutrino emitters. In [76], the blazar sequence was used to estimate the gamma-ray background.
From the theoretical side, the sequence has been interpreted as an effect of the efficiency of the cooling mechanism on accelerated electrons. In FSRQs, the cooling is efficient, hence preventing electrons from reaching high energies and causing a large Compton dominance. In BL Lacs, however, the cooling is less effective, allowing electrons to reach the highest energies. Remarkably, this efficiency has turned out to be intimately connected with the accretion regime. In this perspective, the blazar sequence is the result of a change in the accretion regime: efficient accretion (high disk luminosity) is the cause of efficient cooling. Alternative theoretical interpretations have been proposed, invoking changes in the Doppler factor [67,68] or in the location of the dissipation region [70] as possible explanations for the observed sequence.
The very existence of the sequence is the target of criticisms, mostly based on arguments concerning the selection effect [71,72]. Recent and near-future observations represent a unique opportunity to solve the dispute and probe (or reject) the validity of the sequence. Moreover, future observations will contribute to solving the main open points about the sequence, namely: (i) evaluate the existence of a population of MeV blazars and, in contrast, that of extreme blazars; (ii) probe the properties of the accretion disk, particularly in the BL Lac object case (e.g., ADAF); (iii) evaluate the effect of cosmic evolution.
The advent of X-ray and γ -ray surveys, with e R O S I T A , LHAASO, and SWGO in the current decade, and later on, that of A t h e n a [77], will provide an unbiased census of blazars. This will complement very deep observations in other bands (e.g., SKA and JWST [78,79]). Finally, the recently launched I X P E mission [80] is going to characterize the X-ray polarized emission from some bright selected sources for the first time, significantly improving our understanding of the blazar phenomena. Despite all these exciting advancements foreseen in the near future, we point out that the lack of a successor to Fermi-LAT full-sky monitoring and that of Swift-XRT and UVOT fast reactions to transients and ToOs will strongly affect these observations.
A complementary approach to the study of the sequence that might become accessible thanks to the improved sensitivity of future instruments is the study of misaligned blazars, i.e., radio galaxies. However, the emerging evidence of composite jets in blazars (internal, fast spine and external, slow layer) represents a non-trivial aspect to be taken into account when trying to connect blazars and radio galaxies.

Funding

E.P. acknowledges funding from the Italian Ministry of Education, University and Research (MIUR) through the “Dipartimenti di eccellenza” project, Science of the Universe.

Institutional Review Board Statement

Not applicable.

Informed Consent Statement

Not applicable.

Data Availability Statement

For the study presented in Section 3.3, we used the following public archives: - TeVCAT online catalog for TeV Astronomy, http://tevcat2.uchicago.edu/, accessed on 30 August 2021. - SSDC Sky Explorer facility, https://tools.ssdc.asi.it/, accessed on 1 September 2021.

Acknowledgments

We would like to thank L. Costamante for re-adapting Figure 8 for this manuscript. We are grateful to the reviewers for their constructive feedback on the manuscript.

Conflicts of Interest

The authors declare no conflict of interest.

References

  1. Schmidt, M. 3C 273: A Star-Like Object with Large Red-Shift. Nature 1963, 197, 1040. [Google Scholar] [CrossRef]
  2. Abdollahi, S.; Acero, F.; Ackermann, M.; Ajello, M.; Atwood, W.B.; Axelsson, M.; Baldini, L.; Ballet, J.; Barbiellini, G.; Bastieri, D.; et al. Fermi Large Area Telescope Fourth Source Catalog. Astrophys. J. Suppl. 2020, 247, 33. [Google Scholar] [CrossRef] [Green Version]
  3. IceCube Collaboration. Multimessenger observations of a flaring blazar coincident with high-energy neutrino IceCube-170922A. Science 2018, 361, eaat1378. [Google Scholar] [CrossRef] [Green Version]
  4. Antonucci, R. Unified models for active galactic nuclei and quasars. Annu. Rev. Astron Astrophys 1993, 31, 473–521. [Google Scholar] [CrossRef]
  5. Urry, C.M.; Padovani, P. Unified Schemes for Radio-Loud Active Galactic Nuclei. Publ. ASP 1995, 107, 803. [Google Scholar] [CrossRef] [Green Version]
  6. Heckman, T.M.; Best, P.N. The Coevolution of Galaxies and Supermassive Black Holes: Insights from Surveys of the Contemporary Universe. Annu. Rev. Astron Astrophys. 2014, 52, 589–660. [Google Scholar] [CrossRef] [Green Version]
  7. Padovani, P.; Alexander, D.M.; Assef, R.J.; De Marco, B.; Giommi, P.; Hickox, R.C.; Richards, G.T.; Smolčić, V.; Hatziminaoglou, E.; Mainieri, V.; et al. Active galactic nuclei: What’s in a name? Astron. Astrophys. Rev. 2017, 25, 2. [Google Scholar] [CrossRef] [Green Version]
  8. Narayan, R.; Igumenshchev, I.V.; Abramowicz, M.A. Self-similar Accretion Flows with Convection. Astrophys. J. 2000, 539, 798–808. [Google Scholar] [CrossRef] [Green Version]
  9. Blandford, R.D.; Begelman, M.C. On the fate of gas accreting at a low rate on to a black hole. Mon. Not. RAS 1999, 303, L1–L5. [Google Scholar] [CrossRef] [Green Version]
  10. Narayan, R.; Garcia, M.R.; McClintock, J.E. Advection-dominated Accretion and Black Hole Event Horizons. Astrophys. J. Lett. 1997, 478, L79–L82. [Google Scholar] [CrossRef]
  11. Mahadevan, R. Scaling Laws for Advection-dominated Flows: Applications to Low-Luminosity Galactic Nuclei. Astrophys. J. 1997, 477, 585–601. [Google Scholar] [CrossRef] [Green Version]
  12. MAGIC Collaboration; Ahnen, M.L.; Ansoldi, S.; Antonelli, L.A.; Arcaro, C.; Baack, D.; Babić, A.; Banerjee, B.; Bangale, P.; Barres de Almeida, U.; et al. Detection of the blazar S4 0954+65 at very-high-energy with the MAGIC telescopes during an exceptionally high optical state. Astron. Astrophys. 2018, 617, A30. [Google Scholar] [CrossRef] [Green Version]
  13. Rieger, F. Gamma-Ray Astrophysics in the Time Domain. Galaxies 2019, 7, 28. [Google Scholar] [CrossRef] [Green Version]
  14. Fossati, G.; Maraschi, L.; Celotti, A.; Comastri, A.; Ghisellini, G. A unifying view of the spectral energy distributions of blazars. Mon. Not. RAS 1998, 299, 433–448. [Google Scholar] [CrossRef]
  15. Bonnoli, G.; Ghisellini, G.; Foschini, L.; Tavecchio, F.; Ghirlanda, G. The γ-ray brightest days of the blazar 3C 454.3. Mon. Not. RAS 2011, 410, 368–380. [Google Scholar] [CrossRef]
  16. Tavecchio, F.; Maraschi, L.; Pian, E.; Chiappetti, L.; Celotti, A.; Fossati, G.; Ghisellini, G.; Palazzi, E.; Raiteri, C.M.; Sambruna, R.M.; et al. Theoretical Implications from the Spectral Evolution of Markarian 501 Observed with BeppoSAX. Astrophys. J. 2001, 554, 725–733. [Google Scholar] [CrossRef]
  17. Schonfelder, V.; Aarts, H.; Bennett, K.; Deboer, H.; Clear, J.; Collmar, W.; Connors, A.; Deerenberg, A.; Diehl, R.; Von Dordrecht, A.; et al. Instrument Description and Performance of the Imaging Gamma-Ray Telescope COMPTEL aboard the Compton Gamma-Ray Observatory. Astrophys. J. Suppl. 1993, 86, 657. [Google Scholar] [CrossRef]
  18. Thompson, D.J.; Bertsch, D.L.; Fichtel, C.E.; Hartman, R.C.; Hofstadter, R.; Hughes, E.B.; Hunter, S.D.; Hughlock, B.W.; Kanbach, G.; Kniffen, D.A.; et al. Calibration of the Energetic Gamma-Ray Experiment Telescope (EGRET) for the Compton Gamma-Ray Observatory. Astrophys. J. Suppl. 1993, 86, 629. [Google Scholar] [CrossRef]
  19. Giacconi, R. History of X-ray telescopes and astronomy. Exp. Astron. 2009, 25, 143–156. [Google Scholar] [CrossRef]
  20. Chadwick, P. 35 Years of Ground-Based Gamma-ray Astronomy. Universe 2021, 7, 432. [Google Scholar] [CrossRef]
  21. Atwood, W.B.; Abdo, A.A.; Ackermann, M.; Althouse, W.; Anderson, B.; Axelsson, M.; Baldini, L.; Ballet, J.; Band, D.L.; Barbiellini, G.; et al. The Large Area Telescope on the Fermi Gamma-Ray Space Telescope Mission. Astrophys. J. 2009, 697, 1071–1102. [Google Scholar] [CrossRef] [Green Version]
  22. Bernlöhr, K.; Carrol, O.; Cornils, R.; Elfahem, S.; Espigat, P.; Gillessen, S.; Heinzelmann, G.; Hermann, G.; Hofmann, W.; Horns, D.; et al. The optical system of the H.E.S.S. imaging atmospheric Cherenkov telescopes. Part I: Layout and components of the system. Astropart. Phys. 2003, 20, 111–128. [Google Scholar] [CrossRef]
  23. Aleksić, J.; Ansoldi, S.; Antonelli, L.A.; Antoranz, P.; Babic, A.; Bangale, P.; Barcelo, M.; Barrio, J.A.; González, J.B.; Bednarek, W.; et al. The major upgrade of the MAGIC telescopes, Part I: The hardware improvements and the commissioning of the system. Astropart. Phys. 2016, 72, 61–75. [Google Scholar] [CrossRef] [Green Version]
  24. Holder, J.; Atkins, R.W.; Badran, H.M.; Blaylock, G.; Bradbury, S.M.; Buckley, J.H.; Byrum, K.L.; Carter-Lewis, D.A.; Celik, O.; Chow, Y.C.; et al. The first VERITAS telescope. Astropart. Phys. 2006, 25, 391–401. [Google Scholar] [CrossRef] [Green Version]
  25. Smith, M.W.E.; Fox, D.B.; Cowen, D.F.; Mészáros, P.; Tešić, G.; Fixelle, J.; Bartos, I.; Sommers, P.; Ashtekar, A.; Jogesh Babu, G.; et al. The Astrophysical Multimessenger Observatory Network (AMON). Astropart. Phys. 2013, 45, 56–70. [Google Scholar] [CrossRef] [Green Version]
  26. Möller, A.; Peloton, J.; Ishida, E.E.; Arnault, C.; Bachelet, E.; Blaineau, T.; Boutigny, D.; Chauhan, A.; Gangler, E.; Hernandez, F.; et al. FINK, a new generation of broker for the LSST community. Mon. Not. RAS 2021, 501, 3272–3288. [Google Scholar] [CrossRef]
  27. Ghisellini, G.; Maraschi, L.; Treves, A. Inhomogeneous synchrotron-self-compton models and the problem of relativistic beaming of BL Lac objects. Astron. Astrophys. 1985, 146, 204–212. [Google Scholar]
  28. Böttcher, M.; Reimer, A.; Sweeney, K.; Prakash, A. Leptonic and Hadronic Modeling of Fermi-detected Blazars. Astrophys. J. 2013, 768, 54. [Google Scholar] [CrossRef] [Green Version]
  29. Potter, W.J.; Cotter, G. Synchrotron and inverse-Compton emission from blazar jets - IV. BL Lac type blazars and the physical basis for the blazar sequence. Mon. Not. RAS 2013, 436, 304–314. [Google Scholar] [CrossRef] [Green Version]
  30. Giroletti, M.; Giovannini, G.; Feretti, L.; Cotton, W.D.; Edwards, P.G.; Lara, L.; Marscher, A.P.; Mattox, J.R.; Piner, B.G.; Venturi, T. Parsec-Scale Properties of Markarian 501. Astrophys. J. 2004, 600, 127–140. [Google Scholar] [CrossRef] [Green Version]
  31. Grandi, P.; Torresi, E.; Stanghellini, C. The γ-Ray Emission Region in the Fanaroff-Riley II Radio Galaxy 3C 111. Astrophys. J. Lett. 2012, 751, L3. [Google Scholar] [CrossRef] [Green Version]
  32. Ghisellini, G.; Tavecchio, F.; Chiaberge, M. Structured jets in TeV BL Lac objects and radiogalaxies. Implications for the observed properties. Astron. Astrophys. 2005, 432, 401–410. [Google Scholar] [CrossRef] [Green Version]
  33. Chiaberge, M.; Capetti, A.; Celotti, A. The HST view of FR I radio galaxies: Evidence for non-thermal nuclear sources. Astron. Astrophys. 1999, 349, 77–87. [Google Scholar]
  34. Ghisellini, G.; Tavecchio, F.; Maraschi, L.; Celotti, A.; Sbarrato, T. The power of relativistic jets is larger than the luminosity of their accretion disks. Nature 2014, 515, 376–378. [Google Scholar] [CrossRef] [PubMed] [Green Version]
  35. Nemmen, R.S.; Georganopoulos, M.; Guiriec, S.; Meyer, E.T.; Gehrels, N.; Sambruna, R.M. A Universal Scaling for the Energetics of Relativistic Jets from Black Hole Systems. Science 2012, 338, 1445. [Google Scholar] [CrossRef] [Green Version]
  36. Cotton, W.D.; Wittels, J.J.; Shapiro, I.I.; Marcaide, J.; Owen, F.N.; Spangler, S.R.; Rius, A.; Angulo, C.; Clark, T.A.; Knight, C.A. The very flat radio spectrum of 0735 plus 178—A cosmic conspiracy. Astrophys. J. Lett. 1980, 238, L123–L128. [Google Scholar] [CrossRef]
  37. Stecker, F.W.; de Jager, O.C.; Salamon, M.H. TeV Gamma Rays from 3C 279: A Possible Probe of Origin and Intergalactic Infrared Radiation Fields. Astrophys. J. Lett. 1992, 390, L49. [Google Scholar] [CrossRef]
  38. Franceschini, A.; Rodighiero, G. The extragalactic background light revisited and the cosmic photon-photon opacity. Astron. Astrophys. 2017, 603, A34. [Google Scholar] [CrossRef]
  39. Stecker, F.W.; Done, C.; Salamon, M.H.; Sommers, P. High-energy neutrinos from active galactic nuclei. Phys. Rev. Lett. 1991, 66, 2697–2700. [Google Scholar] [CrossRef]
  40. Hughes, E.B.; Hofstadter, R.; Johansson, A.; Rolfe, J.; Bertsch, D.L.; Cruickshank, W.J.; Ehrmann, C.H.; Fichtel, C.E.; Hartman, R.C.; Kniffen, D.A. Characteristics of the telescope for high energy gamma-ray astronomy selected for definition studies on the Gamma Ray Observatory. IEEE Trans. Nucl. Sci. 1980, 27, 364–369. [Google Scholar] [CrossRef]
  41. Elvis, M.; Plummer, D.; Schachter, J.; Fabbiano, G. The Einstein Slew Survey. Astrophys. J. Suppl. 1992, 80, 257. [Google Scholar] [CrossRef]
  42. Kuehr, H.; Witzel, A.; Pauliny-Toth, I.I.K.; Nauber, U. A catalogue of extragalactic radio sources having flux densities greater than 1 Jy at 5 GHz. Astrophys. J. Suppl. 1981, 45, 367–430. [Google Scholar]
  43. Padovani, P.; Urry, C.M. Luminosity Functions, Relativistic Beaming, and Unified Theories of High-Luminosity Radio Sources. Astrophys. J. 1992, 387, 449. [Google Scholar] [CrossRef]
  44. Wall, J.V.; Peacock, J.A. Bright extragalactic radio sources at 2.7 GHz- III. The all-sky catalogue. Mon. Not. RAS 1985, 216, 173–192. [Google Scholar] [CrossRef] [Green Version]
  45. Donato, D.; Ghisellini, G.; Tagliaferri, G.; Fossati, G. Hard X-ray properties of blazars. Astron. Astrophys. 2001, 375, 739–751. [Google Scholar] [CrossRef]
  46. Ackermann, M.; Ajello, M.; Atwood, W.B.; Baldini, L.; Ballet, J.; Barbiellini, G.; Bastieri, D.; Gonzalez, J.B.; Bellazzini, R.; Bissaldi, E.; et al. The Third Catalog of Active Galactic Nuclei Detected by the Fermi Large Area Telescope. Astrophys. J. 2015, 810, 14. [Google Scholar] [CrossRef] [Green Version]
  47. Ghisellini, G.; Righi, C.; Costamante, L.; Tavecchio, F. The Fermi blazar sequence. Mon. Not. RAS 2017, 469, 255–266. [Google Scholar] [CrossRef]
  48. Ghisellini, G.; Tavecchio, F. The blazar sequence: A new perspective. Mon. Not. RAS 2008, 387, 1669–1680. [Google Scholar] [CrossRef]
  49. Paiano, S.; Landoni, M.; Falomo, R.; Treves, A.; Scarpa, R.; Righi, C. On the Redshift of TeV BL Lac Objects. Astrophys. J. 2017, 837, 144. [Google Scholar] [CrossRef]
  50. Biteau, J.; Prandini, E.; Costamante, L.; Lemoine, M.; Padovani, P.; Pueschel, E.; Resconi, E.; Tavecchio, F.; Taylor, A.; Zech, A. Progress in unveiling extreme particle acceleration in persistent astrophysical jets. Nat. Astron. 2020, 4, 124–131. [Google Scholar] [CrossRef] [Green Version]
  51. Tagliaferri, G.; Ghisellini, G.; Perri, M.; Hayashida, M.; Balokovic, M.; Covino, S.; Giommi, P.; Madejski, G.M.; Puccetti, S.; Sbarrato, T.; et al. NuSTAR and Multifrequency Study of the Two High-redshift Blazars S5 0836+710 and PKS 2149-306. Astrophys. J. 2015, 807, 167. [Google Scholar] [CrossRef] [Green Version]
  52. Bai, X.; Bi, B.Y.; Bi, X.J.; Cao, Z.; Chen, S.Z.; Chen, Y.; Chiavassa, A.; Cui, X.H.; Dai, Z.G.; della Volpe, D.; et al. The Large High Altitude Air Shower Observatory (LHAASO) Science White Paper—2021 Edition. arXiv 2019, arXiv:1905.02773. [Google Scholar]
  53. Albert, A.; Alfaro, R.; Ashkar, H.; Alvarez, C.; Álvarez, J.; Arteaga-Velázquez, J.C.; Solares, H.A.; Arceo, R.; Bellido, J.A.; BenZvi, S.; et al. Science Case for a Wide Field-of-View Very-High-Energy Gamma-Ray Observatory in the Southern Hemisphere. arXiv 2019, arXiv:1902.08429. [Google Scholar]
  54. Pintore, F.; Giuliani, A.N.; Belfiore, A.; Paizis, A.D.; Mereghetti, S.; La Palombara, N.I.; Crestan, S.; Sidoli, L.; Lombardi, S.; D’Aì, A.N.; et al. Scientific prospects for a mini-array of ASTRI telescopes: A γ-ray TeV data challenge. J. High Energy Astrophys. 2020, 26, 83–94. [Google Scholar] [CrossRef]
  55. Cherenkov Telescope Array Consortium. Science with the Cherenkov Telescope Array; World Scientific. 2019. Available online: https://www.worldscientific.com/doi/pdf/10.1142/10986 (accessed on 5 December 2021).
  56. Costamante, L. TeV-peaked candidate BL Lac objects. Mon. Not. RAS 2020, 491, 2771–2778. [Google Scholar] [CrossRef] [Green Version]
  57. Sbarrato, T.; Ghisellini, G.; Giovannini, G.; Giroletti, M. Jetted radio-quiet quasars at z > 5. arXiv 2021, arXiv:2109.08156. [Google Scholar] [CrossRef]
  58. De Angelis, A.; Tatischeff, V.; Grenier, I.A.; McEnery, J.; Mallamaci, M.; Tavani, M.A.; Oberlack, U.; Hanlon, L.; Walter, R.; Argan, A.N.; et al. Science with e-ASTROGAM. A space mission for MeV-GeV gamma-ray astrophysics. J. High Energy Astrophys. 2018, 19, 1–106. [Google Scholar] [CrossRef]
  59. McEnery, J.; Barrio, J.A.; Agudo, I.; Ajello, M.; Álvarez, J.M.; Ansoldi, S.; Anton, S.; Auricchio, N.; Stephen, J.B.; Baldini, L.; et al. All-sky Medium Energy Gamma-ray Observatory: Exploring the Extreme Multimessenger Universe. Bull. Am. Astron. Soc. 2019, 51, 245. [Google Scholar]
  60. Tomsick, J.; Zoglauer, A.; Sleator, C.; Lazar, H.; Beechert, J.; Boggs, S.; Roberts, J.; Siegert, T.; Lowell, A.; Wulf, E.; et al. The Compton Spectrometer and Imager. Bull. Am. Astron. Soc. 2019, 51, 98. [Google Scholar]
  61. Ghisellini, G.; Celotti, A.; Fossati, G.; Maraschi, L.; Comastri, A. A theoretical unifying scheme for gamma-ray bright blazars. Mon. Not. RAS 1998, 301, 451–468. [Google Scholar] [CrossRef] [Green Version]
  62. Celotti, A.; Ghisellini, G. The power of blazar jets. Mon. Not. RAS 2008, 385, 283–300. [Google Scholar] [CrossRef] [Green Version]
  63. Ghisellini, G.; Tavecchio, F.; Foschini, L.; Ghirlanda, G.; Maraschi, L.; Celotti, A. General physical properties of bright Fermi blazars. Mon. Not. RAS 2010, 402, 497–518. [Google Scholar] [CrossRef]
  64. Ghisellini, G.; Tavecchio, F. Fermi/LAT broad emission line blazars. Mon. Not. RAS 2015, 448, 1060–1077. [Google Scholar] [CrossRef]
  65. Costamante, L.; Cutini, S.; Tosti, G.; Antolini, E.; Tramacere, A. On the origin of gamma-rays in Fermi blazars: Beyond the broad-line region. Mon. Not. RAS 2018, 477, 4749–4767. [Google Scholar] [CrossRef]
  66. Poutanen, J.; Stern, B. GeV Breaks in Blazars as a Result of Gamma-ray Absorption within the Broad-line Region. Astrophys. J. Lett. 2010, 717, L118–L121. [Google Scholar] [CrossRef]
  67. Fan, J.H.; Yang, J.H.; Xiao, H.B.; Lin, C.; Constantin, D.; Luo, G.Y.; Pei, Z.Y.; Hao, J.M.; Mao, Y.W. Intrinsic Correlations for Flaring Blazars Detected by Fermi. Astrophys. J. Lett. 2017, 835, L38. [Google Scholar] [CrossRef] [Green Version]
  68. Nieppola, E.; Valtaoja, E.; Tornikoski, M.; Hovatta, T.; Kotiranta, M. Blazar sequence—An artefact of Doppler boosting. Astron. Astrophys. 2008, 488, 867–872. [Google Scholar] [CrossRef]
  69. Readhead, A.C.S. Equipartition Brightness Temperature and the Inverse Compton Catastrophe. Astrophys. J. 1994, 426, 51. [Google Scholar] [CrossRef]
  70. Potter, W.J.; Cotter, G. New constraints on the structure and dynamics of black hole jets. Mon. Not. RAS 2015, 453, 4070–4088. [Google Scholar] [CrossRef] [Green Version]
  71. Keenan, M.; Meyer, E.T.; Georganopoulos, M.; Reddy, K.; French, O.J. The relativistic jet dichotomy and the end of the blazar sequence. Mon. Not. RAS 2021, 505, 4726–4745. [Google Scholar] [CrossRef]
  72. Giommi, P.; Padovani, P.; Polenta, G.; Turriziani, S.; D’Elia, V.; Piranomonte, S. A simplified view of blazars: Clearing the fog around long-standing selection effects. Mon. Not. RAS 2012, 420, 2899–2911. [Google Scholar] [CrossRef]
  73. Merloni, A.; Predehl, P.; Becker, W.; Böhringer, H.; Boller, T.; Brunner, H.; Brusa, M.; Dennerl, K.; Freyberg, M.; Friedrich, P.; et al. eROSITA Science Book: Mapping the Structure of the Energetic Universe. arXiv 2012, arXiv:1209.3114. [Google Scholar]
  74. Rodrigues, X.; Fedynitch, A.; Gao, S.; Boncioli, D.; Winter, W. Neutrinos and Ultra-high-energy Cosmic-ray Nuclei from Blazars. Astrophys. J. 2018, 854, 54. [Google Scholar] [CrossRef]
  75. Murase, K.; Inoue, Y.; Dermer, C.D. Diffuse neutrino intensity from the inner jets of active galactic nuclei: Impacts of external photon fields and the blazar sequence. Phys. Rev. D 2014, 90, 023007. [Google Scholar] [CrossRef] [Green Version]
  76. Inoue, Y.; Totani, T. The Blazar Sequence and the Cosmic Gamma-ray Background Radiation in the Fermi Era. Astrophys. J. 2009, 702, 523–536. [Google Scholar] [CrossRef] [Green Version]
  77. Nandra, K.; Barret, D.; Barcons, X.; Fabian, A.; Herder, J.W.; Piro, L.; Watson, M.; Adami, C.; Aird, J.; Afonso, J.M.; et al. The Hot and Energetic Universe: A White Paper presenting the science theme motivating the Athena+ mission. arXiv 2013, arXiv:1306.2307. [Google Scholar]
  78. Braun, R.; Bourke, T.; Green, J.A.; Keane, E.; Wagg, J. Advancing Astrophysics with the Square Kilometre Array. In Proceedings of the Advancing Astrophysics with the Square Kilometre Array (AASKA14), Giardini Naxos, Italy, 9–13 June 2014; p. 174. [Google Scholar]
  79. Gardner, J.P.; Mather, J.C.; Clampin, M.; Doyon, R.; Greenhouse, M.A.; Hammel, H.B.; Hutchings, J.B.; Jakobsen, P.; Lilly, S.J.; Long, K.S.; et al. The James Webb Space Telescope. Space Sci. Rev. 2006, 123, 485–606. [Google Scholar] [CrossRef] [Green Version]
  80. Weisskopf, M.C.; Ramsey, B.; O’Dell, S.L.; Tennant, A.; Elsner, R.; Soffita, P.; Bellazzini, R.; Costa, E.; Kolodziejczak, J.; Kaspi, V.; et al. The Imaging X-ray Polarimetry Explorer (IXPE). In Proceedings of the Space Telescopes and Instrumentation 2016: Ultraviolet to Gamma Ray, Edinburgh, UK, 1–26 June 2016; Society of Photo-Optical Instrumentation Engineers (SPIE) Conference Series. den Herder, J.W.A., Takahashi, T., Bautz, M., Eds.; Volume 9905, p. 990517. [Google Scholar] [CrossRef] [Green Version]
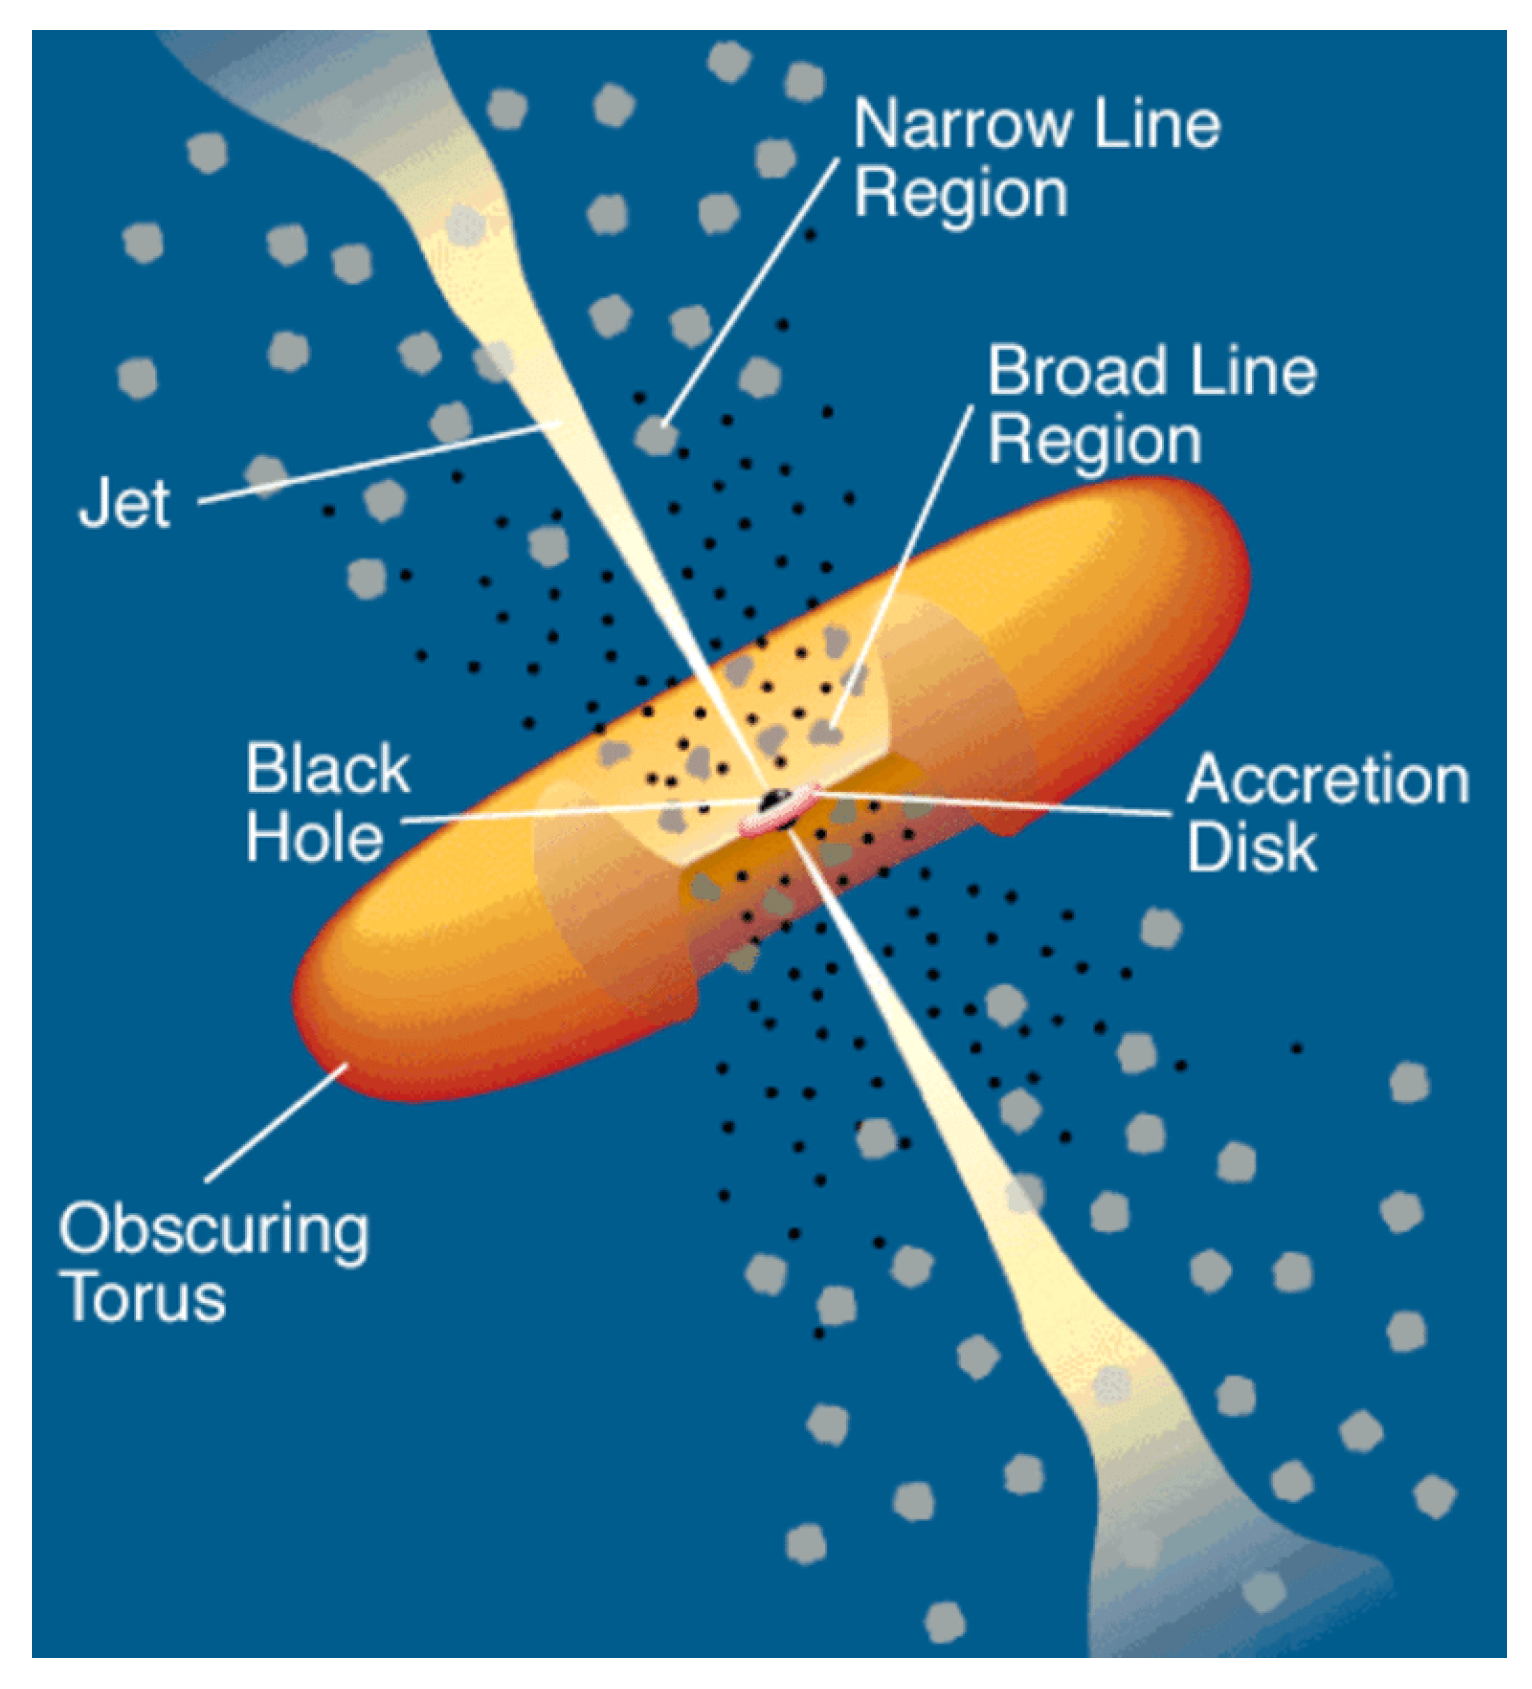
Figure 1. Jetted AGN—simplified scheme from Urry and Padovani [5].
Galaxies 10 00035 g001
Figure 2. Examples of the spectral energy distributions (SEDs) of an FSRQ (right, 3C 454.3) and a BL Lac object (left, Mkn 501) from multi-epoch observations. In the SED of 3C 454.3, in addition to the jet emission, we can identify an accretion disc component, the X-ray corona contribution, and the IR emission from the torus (dashed black lines); taken from Bonnoli et al. [15]. In Mkn 501, only the contributions from the jet and host galaxy are evident; taken from Tavecchio et al. [16], ©AAS. Reproduced with permission.
Galaxies 10 00035 g002
Figure 3. Dependence of the synchrotron peak frequency with the radio luminosity (left), spectral indices α R O and α R X (center), and γ -ray dominance (right). Figures from Fossati et al. [14].
Galaxies 10 00035 g003
Figure 4. (Left): The original blazar sequence, from Fossati et al. [14]. (Right): the updated sequence, from Donato et al. [45], reproduced with permission ©ESO, built with additional (2–10 keV) average spectral indices.
Galaxies 10 00035 g004
Figure 5. Luminosity in the 0.1–100 GeV band as a function of the redshift for the Fermi sequence sample, from Ghisellini et al. [47]. The solid lines represent the EGRET sensitivity limit and Fermi-LAT sensitivity after 4 years of observations. Horizontal lines delimit the luminosity bins adopted in the study.
Galaxies 10 00035 g005
Figure 6. The Fermi blazar sequence from Ghisellini et al. [47]. FSRQs (top panel) of different luminosity classes show an increasing Compton dominance with increasing luminosity, but not the trend of decreasing peak frequencies. This behavior is evident when considering BL Lac objects (central panel) and also when considering all blazars, without dividing them into FSRQs and BL Lacs.
Galaxies 10 00035 g006
Figure 7. The TeV blazar sequence. The SED of all TeV-detected blazars with known redshift were collected and divided into the luminosity bins adopted in the Fermi blazar sequence [47]. The stripes are the 1 σ dispersion from [47].
Galaxies 10 00035 g007
Figure 8. Extremes of the blazar sequence: SED of a MeV blazar (left) and a TeV blazar (right). The MeV blazar is the FSRQ 2149–306, located at z = 2.354 , from Tagliaferri et al. [51], ©AAS. Reproduced with permission. The TeV blazar is 1ES 0229+200, at z = 0.14 . Adapted from Biteau et al. [50].
Galaxies 10 00035 g008
Figure 9. The energy γ peak of the electrons emitting at the peaks of the SED as a function of the energy density (magnetic plus radiative), as seen in the co-moving frame. Grey symbols refer to blazars studied previously by Celotti and Ghisellini [62], Ghisellini et al. [63]. The stars are objects with weak and very weak broad emission lines that can be classified as BL Lacs or transitional objects. Adapted from Ghisellini and Tavecchio [64].
Galaxies 10 00035 g009
Table 1. Sample of sources adopted for the original blazar sequence [14]. The last two columns highlight the number of sources also detected in γ -rays, at MeV-GeV and TeV energies, respectively.
CatalogSampleMeV-GeVTeV
DetectedDetected
X-ray BL Lac4872
Radio BL Lac3491
Radio FSRQ50200
Table 2. Main parameters characterizing the Fermi blazar sequence [47].
log  L γ [log(erg/s)] ν S [Hz] ν IC [Hz]CDNAllNFSRQNBL Lac
>48 2.5 × 10 12 9 × 10 20 154947 (96%)2
47–48 2.5 × 10 12 2 × 10 21 4.8202177 (88%)25
46–47 5 × 10 12 2 × 10 21 2182144 (79%)38
45–46 5 × 10 12 1 × 10 22 0.617452 (30%)122
44–45 1 × 10 16 8 × 10 24 0.3511119 (17%)92
<44 4 × 10 16 3 × 10 25 0.25299 (31%)20
Publisher’s Note: MDPI stays neutral with regard to jurisdictional claims in published maps and institutional affiliations.