1. Introduction
Planetary nebulae (PNe) are the descendants of low-to-intermediate mass stars (1–8 M). The illumination of the material expelled during the asymptotic giant branch (AGB) stage by the exposed hot and luminous core causes the nebula to glow. The strong UV radiation field from their central stars (CS) is the dominant source of highly energetic photons, leading first to the dissociation of the cold AGB molecular gas and then to the ionization of the atomic gas.
PNe display a variety of shapes, such as round, elliptical, bipolar/multipolar, and point symmetric with different components, such as shells, rims, halos, knots, and filaments, among others. This polymorphism of PNe is attributed to complex post-AGB mass-loss events and/or mass transfer between components in a binary system, the presence or not of a dense equatorial structure (disk or torus), formation of jets and clumps, etc.
This structural complexity of PNe in conjunction with the UV radiation from the central stars results in an even more complex ionization and density stratification. Long-slit spectroscopic results are limited to specific directions or distinct components/features, such as low-ionization structures (LISs: knots, jets, and filaments; e.g., [
1,
2,
3]) or bipolar outflows (e.g., [
4,
5,
6]) due to the slit positioning.
The development of state-of-the-art spectrographs equipped with integral field units (IFU) overcome this limitation. Integral field spectroscopy (IFS) has changed the way we approach and study extended ionized nebulae, such as PNe, e.g., [
7,
8], H II regions [
9], galaxies [
10], and supernova remnants [
11], simultaneously providing spectroscopic characterization in both spatial directions. However, the results from IFUs are not directly comparable with the results from the traditional long-slit spectroscopy or the predictions from 1D photoionization and shock modelling.
A new Python software called “
satellite: Spectroscopic Analysis Tool for Integral Field Init Datacubes”(Akras et al., 2021, submitted) has been developed to carry out a 1D and 2D analysis of extended nebulae. We present here a summary of some results from the application of the
satellite code to four Galactic PNe. A brief description of
satellite is given in
Section 2. The results are presented in
Section 3, and we finish with conclusions in
Section 4.
2. Methodology
The satellite code (v1.3) was developed in Python 3, and four modules were available: (A) rotation analysis, (B) radial analysis, (C) specific slits analysis and (D) 2D analysis. A summary of the code is given below. A detailed description and discussion of its performance are presented in Akras et al., 2021 (submitted).
The 2D flux maps of emission lines extracted from the datacubes of any IFU are provided to the code as the input data
1. The first three modules perform a 1D spectroscopic analysis through pseudo-slits or rectangular apertures spectra that simulate/resemble real long-slit spectra, summing up the values of the individual spaxels within the aperture defined by the width and length of the pseudo-slits that the user provides. The fourth module (D) carries out a 2D spectroscopic analysis through a spaxel-by-spaxel approach.
The following two criteria, (i) F(H) > 0 and F(H) > 0 and (ii) F(H) > 2.85*F(H), are taken into account to exclude problematic spaxels or those with low signal-to-noise (S/N < 2) ratio and avoid unrealistic values for the interstellar extinction coefficient (c(H)).
The physical parameters of the nebula, such as c(H
), line fluxes and intensities, electron temperatures (
) and densities (
) for all possible line diagnostics, ionic and total abundances, and ionization correction factors (ICFs), are computed using the
pyneb package [
12]
2.
The current version of
satellite mimics the orientation of the pseudo-slits (position angle (PA)) by rotating the entire line flux maps instead of the slits themselves.
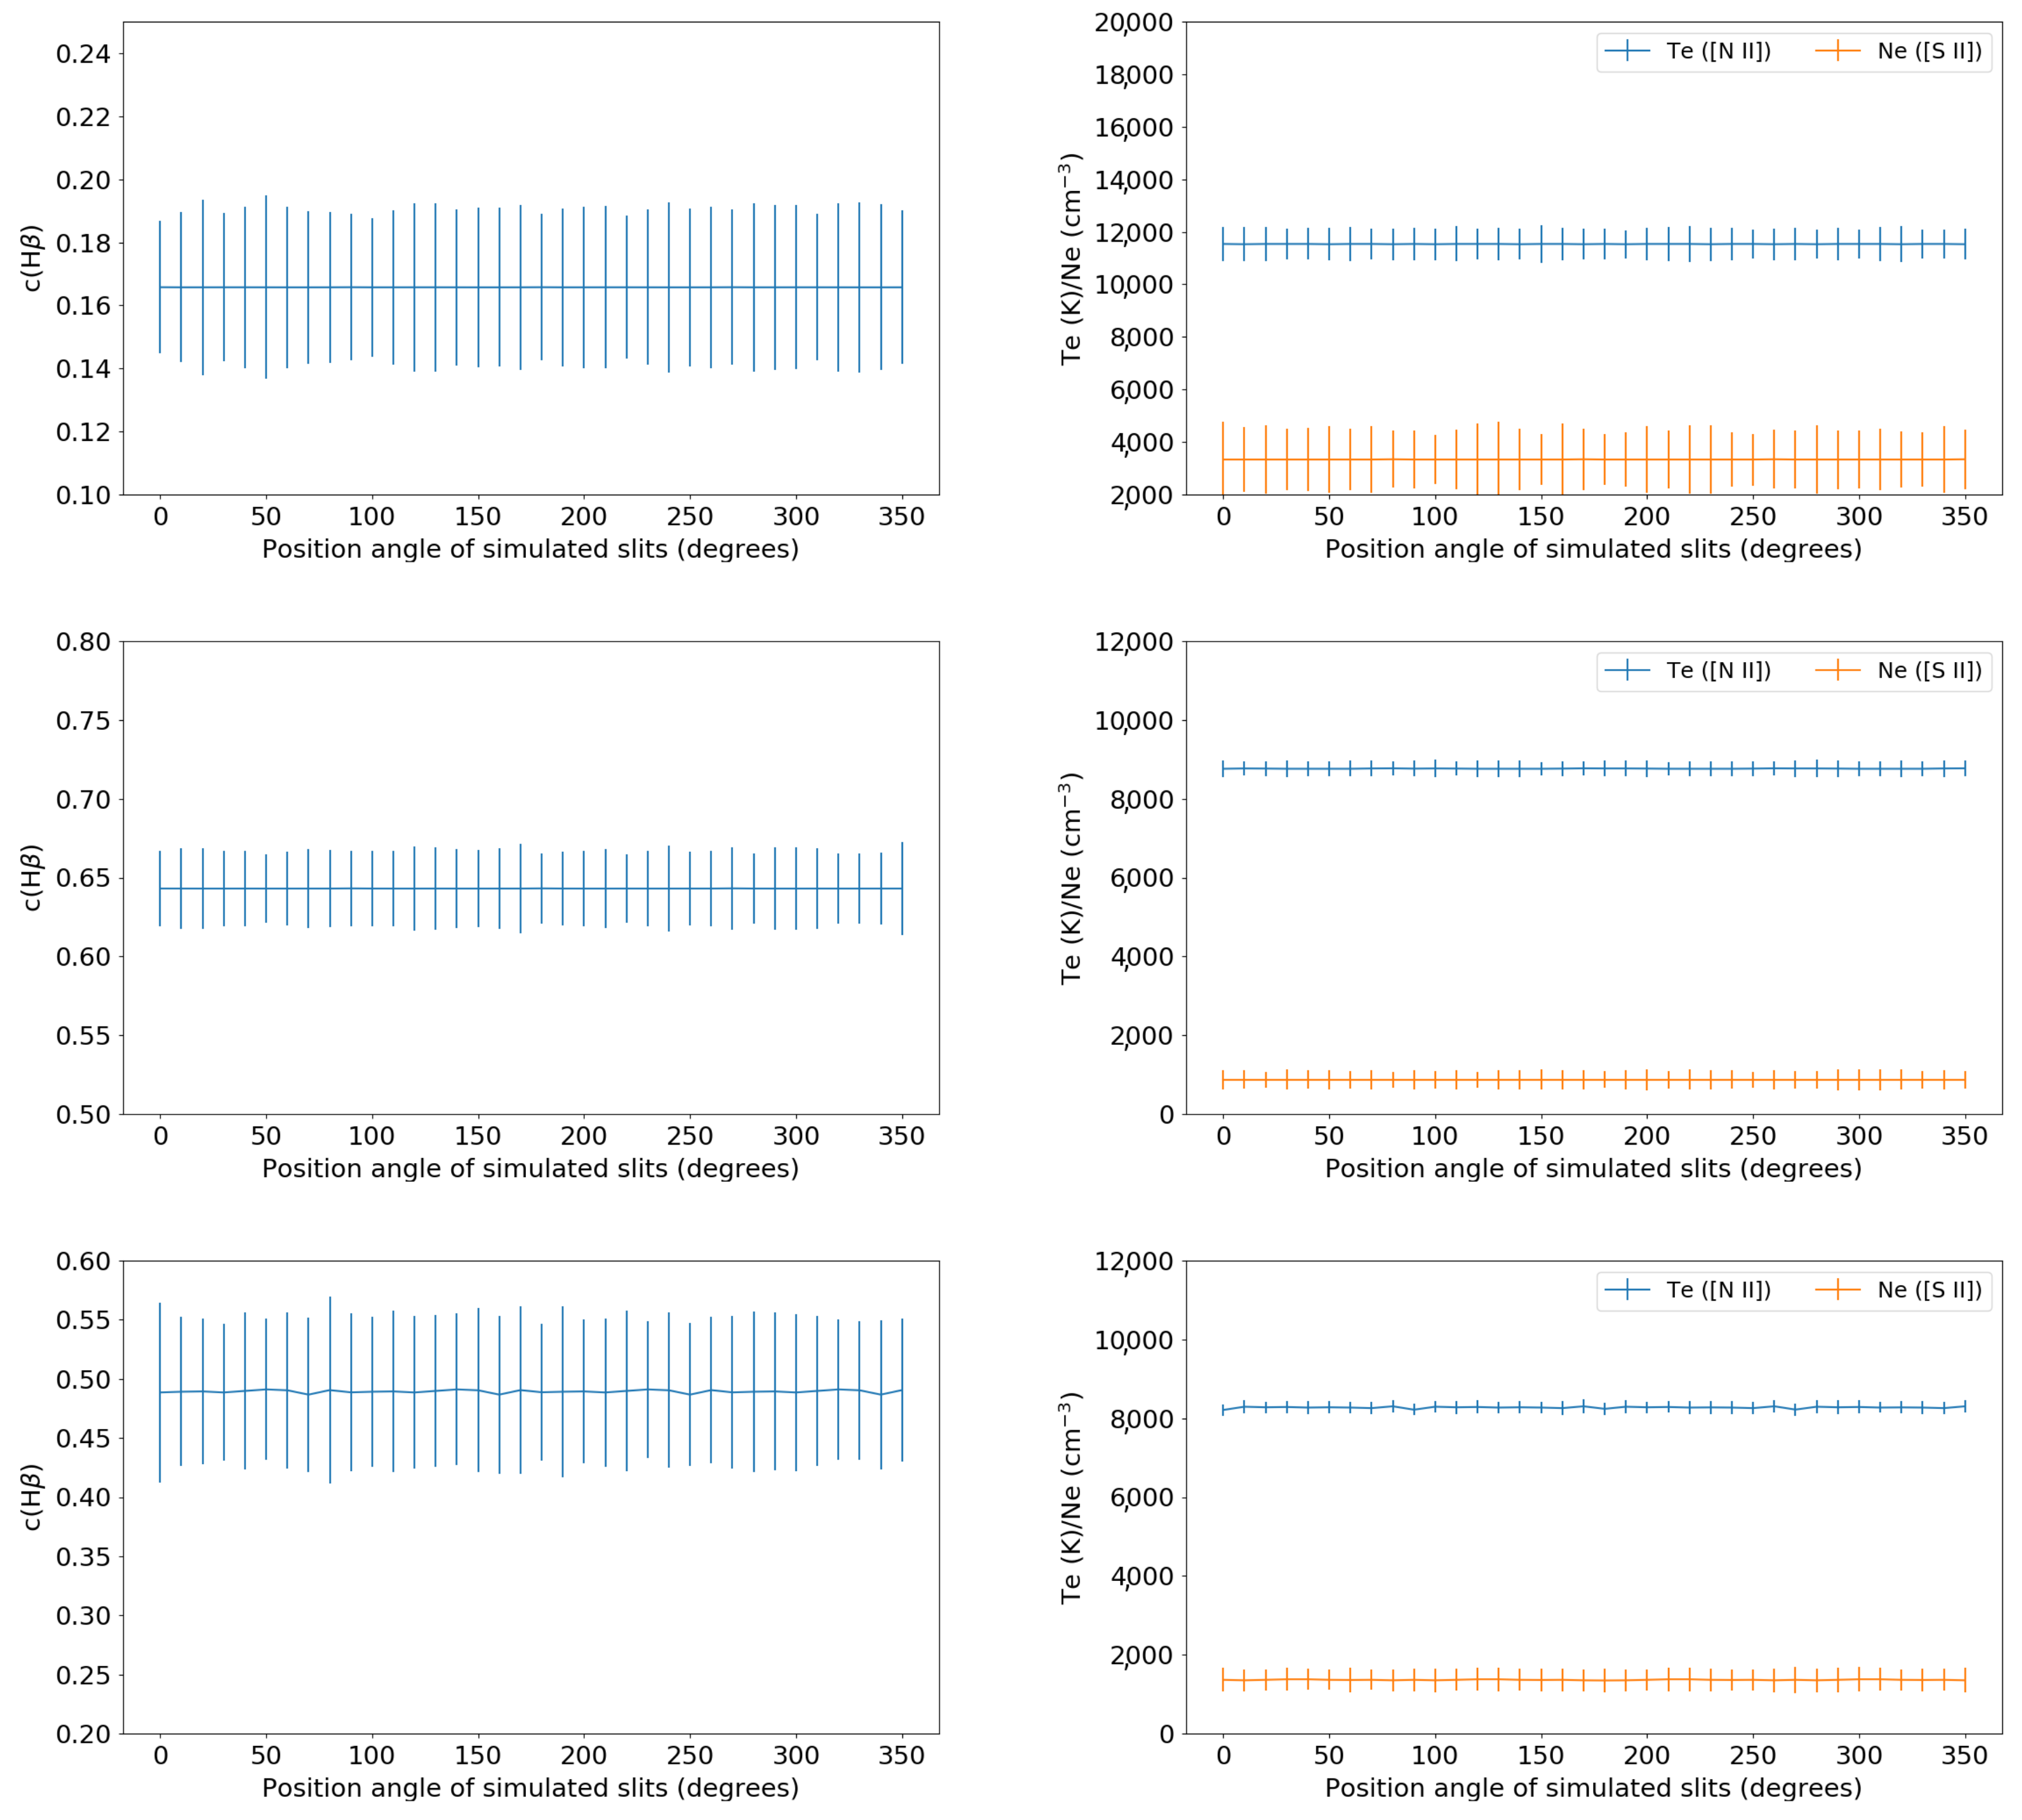
Figure 1 shows the variation in c(H
),
[N
ii], and
[S
ii] for NGC 7009 (upper panels), NGC 6778 (middle panels), and Hen 2-108 (lower panels) as a function of the PA of a rectangular aperture that covers the whole nebulae or, in other words, the entire line maps (integrated spectrum) of 64 × 64 arcsec, 67 × 67 arcsec, and 40 × 40 arcsec, respectively. The angular sizes of the PNe are: 56 × 24 arcsec NGC 7009, 60 × 20 arcsec NGC 6778, and 13–14 arcsec Hen 2-108, respectively.
The rotation of the flux maps does not have any impact on the integrated light across the nebulae. The SATELLITE benchmark tests verified, as expected, that all physical parameters (the ionic and elemental abundances and ionization correction factors (not shown here)) are invariant with the rotation of the input line flux maps.
3. Results
satellite was used in the analysis of four Galactic PNe so far: Abell 14 (VIMOS, [
7]), Hen 2-108 (VIMOS, Miranda-Marques et al., 2021 submitted), NGC 7009, and NGC 6778 (MUSE, Akras et al., 2021 submitted). Below, we briefly present some of the results obtained for each one.
3.1. Abell 14
The first (beta) version of
satellite was applied to the VIMOS@ESO [
13] IFU data of the planetary nebula Abell 14 (PI: S. Akras; ID:098.D-0436(A)). Unexpectedly strong [N
i]
5200 and [O
i]
6300 emission lines were reported for this PN by [
14,
15], respectively. The detection of only one of these two lines in each study above is likely related to the different slit positions (0 and 100 °C, respectively). 3D photo-ionization modelling of Abell 14 has shown that the intensity of the aforementioned auroral lines cannot be reproduced considering only the UV radiation field from its CS, and an additional thermal mechanism is needed [
16].
Therefore, Abell 14 was an ideal nebula to apply and test the
satellite code and in the end explore the line ratios in both spatial directions through the 2D analysis module, as well as for the specific slit orientations through the specific slits analysis module in the code (see, [
7]). [N
i]
5200/H
ratio was found to be in agreement with the result reported by [
14]. On the contrary, the [O
i]
6300/H
line ratio was almost not measurable in 1D pseudo-slits at any PA. For the entire nebula (integrated spectrum), the measured ratio is half of the value reported by [
15].
3.2. Hen 2-108
The first IFU data of Hen 2-108 are presented in Miranda-Marques et al. (2021, submitted), which describes the application of SATELLITE (v1.3) to the VLT/VIMOS data of this nebula (PI: H. Schwarz, ID:079.D-0117A).
Despite its nearly round shape, the radial analysis module in satellite revealed a sharp drop in c(H) by ∼30% at a position angle of ∼50 °C, while [N ii] and [S ii] are nearly constant with average values of 8230 K and 1390 cm and standard deviations of 180 K and 215 cm, respectively. Homogeneity was also found for the ionic and total chemical abundances in this nebula.
The results from the radial analysis module also demonstrated that c(H
) is lower in the inner part of the nebula and increases to 0.5 (towards eastern part) and 0.8 (towards southern part) at larger distances from the CS (
Figure 2). Based on the 2D analysis module and a spaxel-by-spaxel approach, c(H
),
[N
ii], and
[S
ii] vary in a wide range of values from 0.25 to 2, with a peak at 0.5, from 5000 to 15,000 K, with a peak at 8500 K, and from 500 to 5000 cm
, with a peak at 1000 cm
.
The comparison of results between the 1D and 2D spectroscopic analyses illustrates the disparity of the two approaches due to the different S/N ratios. Specifically, the S/N ratios of individual spaxels in the 2D analysis can be as low as 2 (at the outer part of the nebula) while the S/N ratios are higher in the 1D analysis as emission from several spaxels is summed up. Note that the peak values from the 2D analysis agree with the results from the 1D analysis.
3.3. NGC 7009
From a morphological point of view, NGC 7009 is among the richest nebulae, composed of an inner ellipsoidal structure, two pairs of knots (inner and outer), a pair of seemingly-jet structures, and an elliptical halo. The pairs of knots or LISs in this nebula [
17,
18]) are substantially brighter in the low-ionization lines (e.g., [N
ii]
6548,6584, [S
ii]
6716,6731, [O
i]
6300,6363, [N
i]
5200, among others) than their surrounding gas (see also, [
1,
19]). Moreover, the recent detection of a H
v = 1–0 2.12
m S(1) ro-vibrational line emanating from the LISs in NGC 7009 [
20] or generally in PNe [
21,
22] has shown a strong link between the emission from low-ionization lines and molecular hydrogen. Possible explanations to this link are either a low velocity shock interaction with the nebular shell or the photo-evaporation of dense molecular knots resembling the spectrum of mini-photodissociation regions (PDRs, see [
23]).
Hence, spatially resolved line ratio maps are essential in order to study the structure of the nebula in both directions, as well as in different components. IFS is the ideal tool for such studies. NGC 7009 was observed with MUSE@ESO [
24] during the Science Verification phase. The first results from this MUSE dataset are presented in [
25,
26]. The same set of emission line maps was used as input to
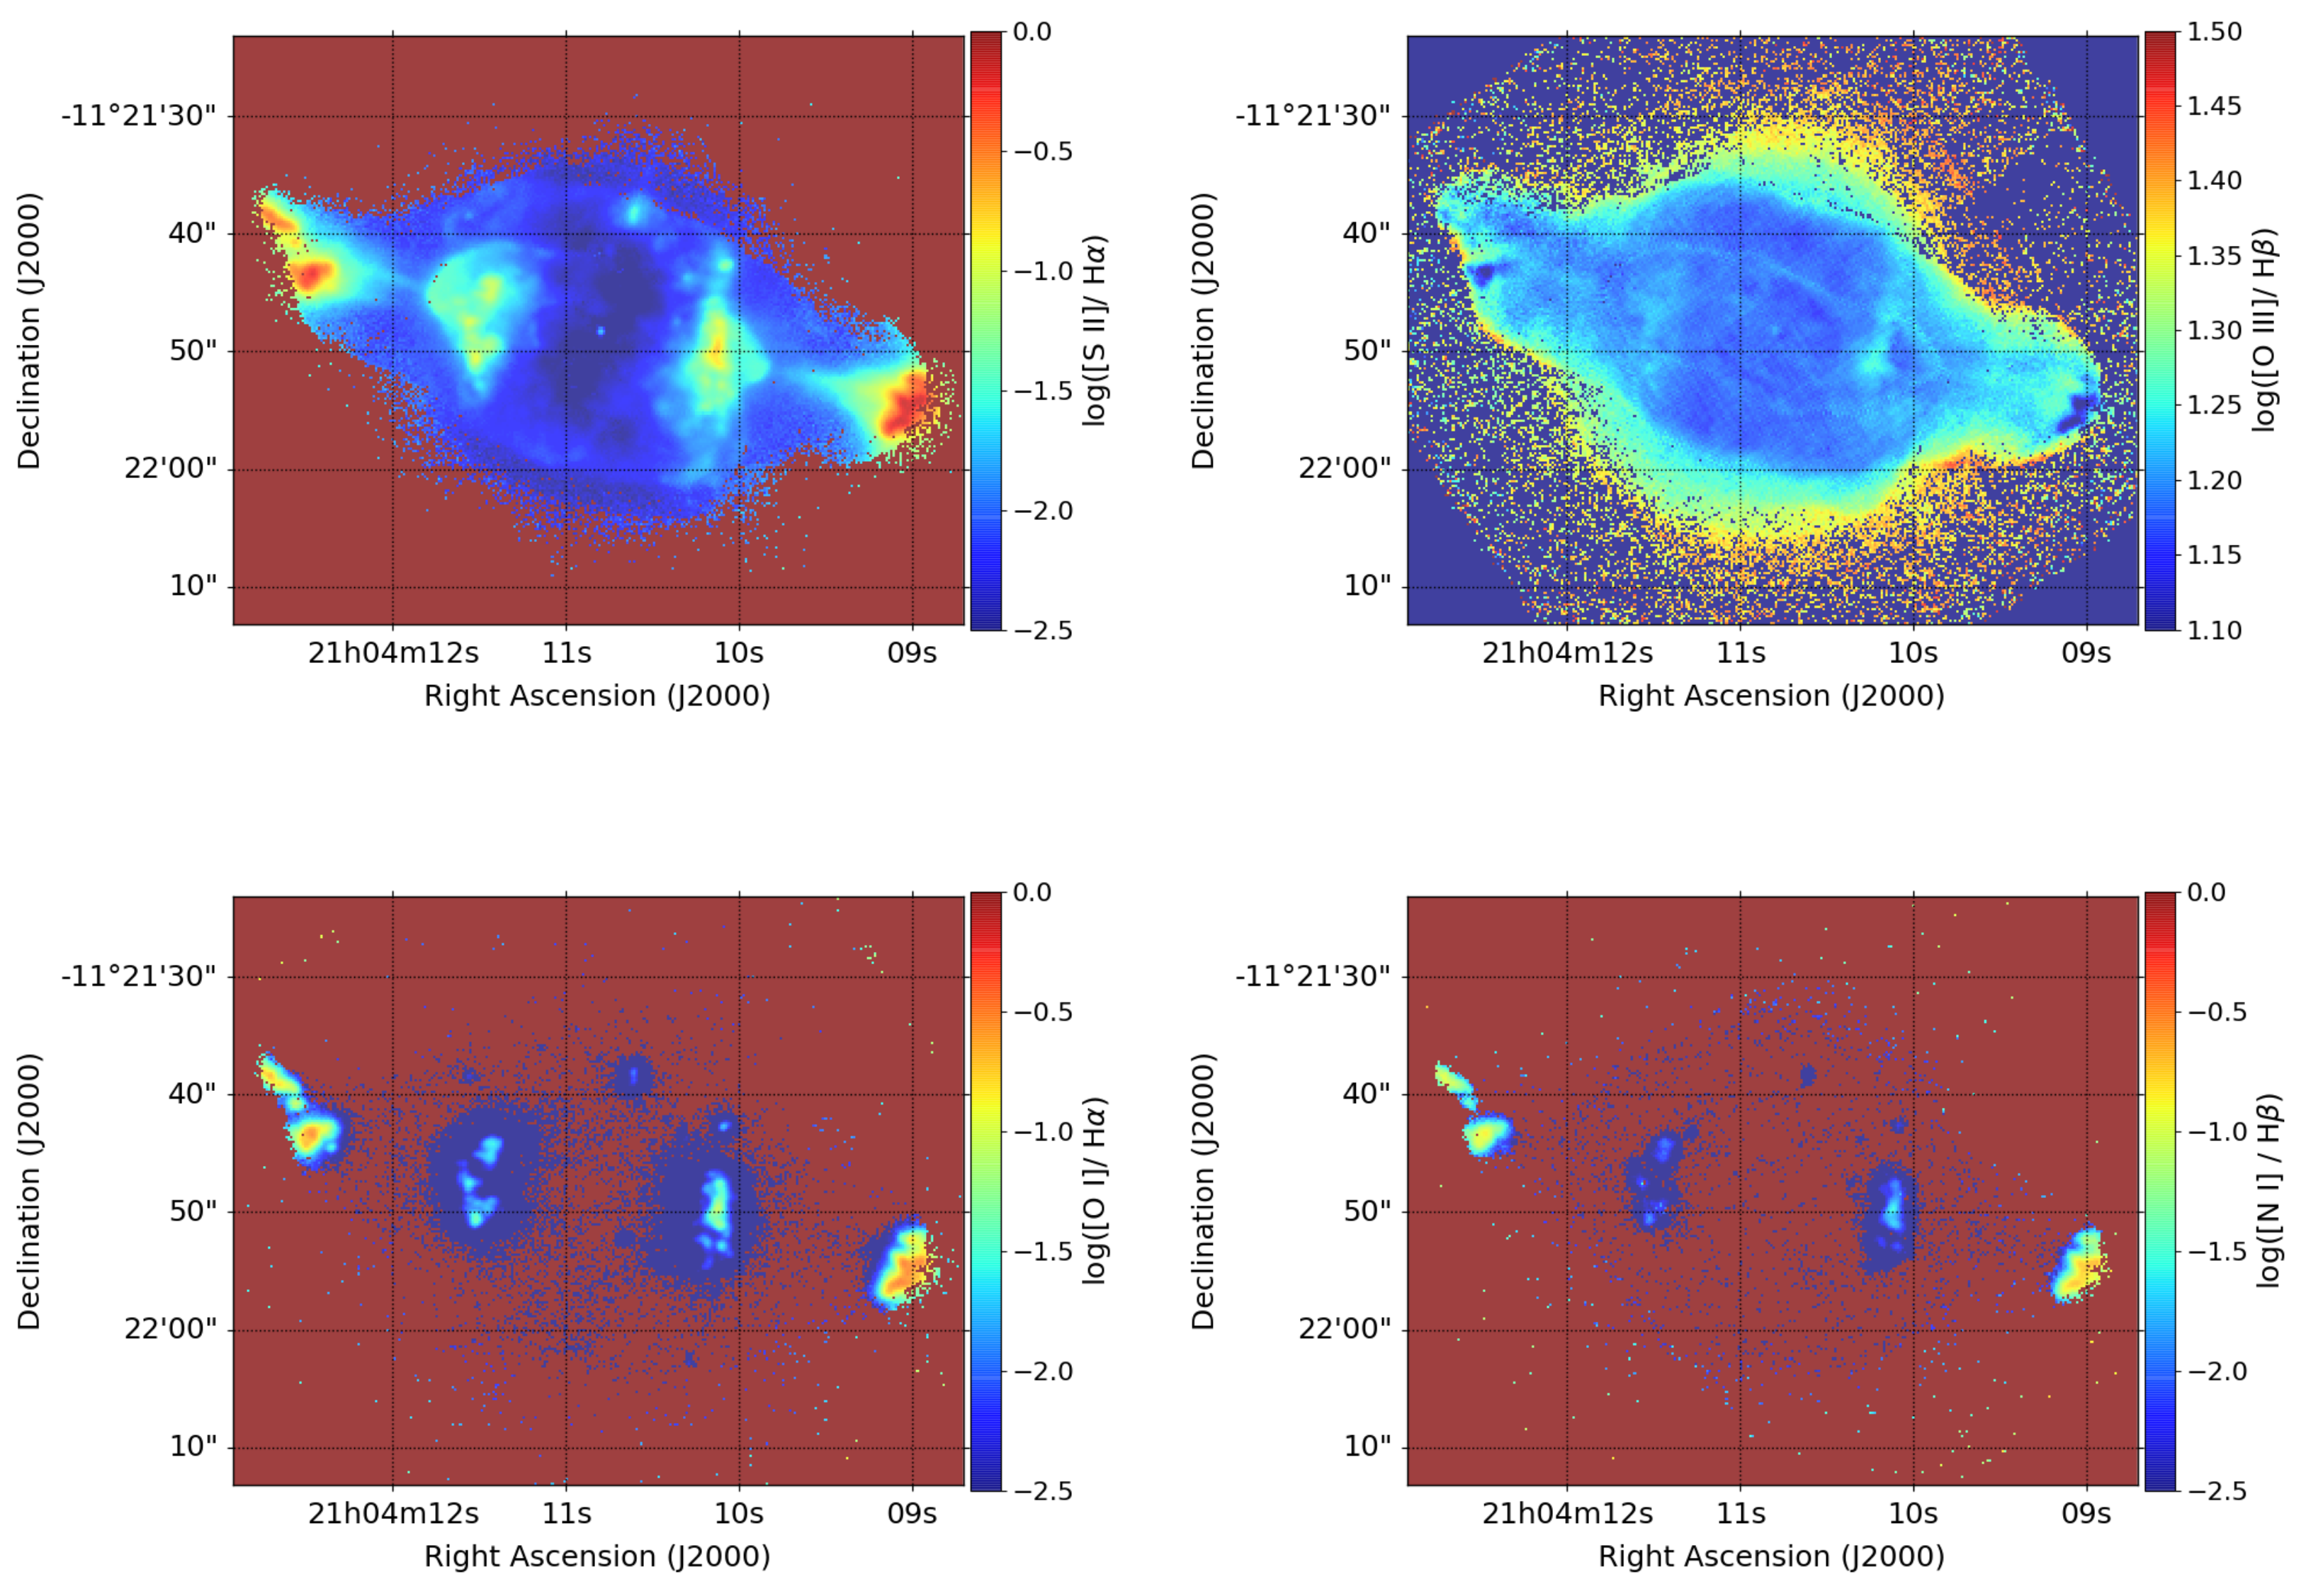
satellite to test and validate the code. The [S
ii]
6716+
6731/H
, [O
iii]
4959+
5007/H
, [O
i]
6300/H
, and [N
i]
5200/H
line ratio maps of NGC 7009, corrected for interstellar extinction, obtained with
satellite are shown in
Figure 3. The current version of
satellite provides 36 different combinations of emission line ratios.
The pairs of LISs are easily perceptible in the low-ionization line ratio maps with significantly higher values than the surrounding gas, whilst they also have lower [O iii]/H values. Note that [O i] 6300 and [N i] 5200 line are mainly detected at the two pairs of knots, while they are absent or very weak in the main ellipsoidal nebula. This signifies that all O and N of the main nebula is ionized. The detection of these two low-ionization lines at the pair of knots indicates the presence of nebular components with distinct ionization states and density structures. This is consistent with the discovery of H gas, which requires high densities (>10 cm) to be self-shielded from the dissociating radiation of the CS.
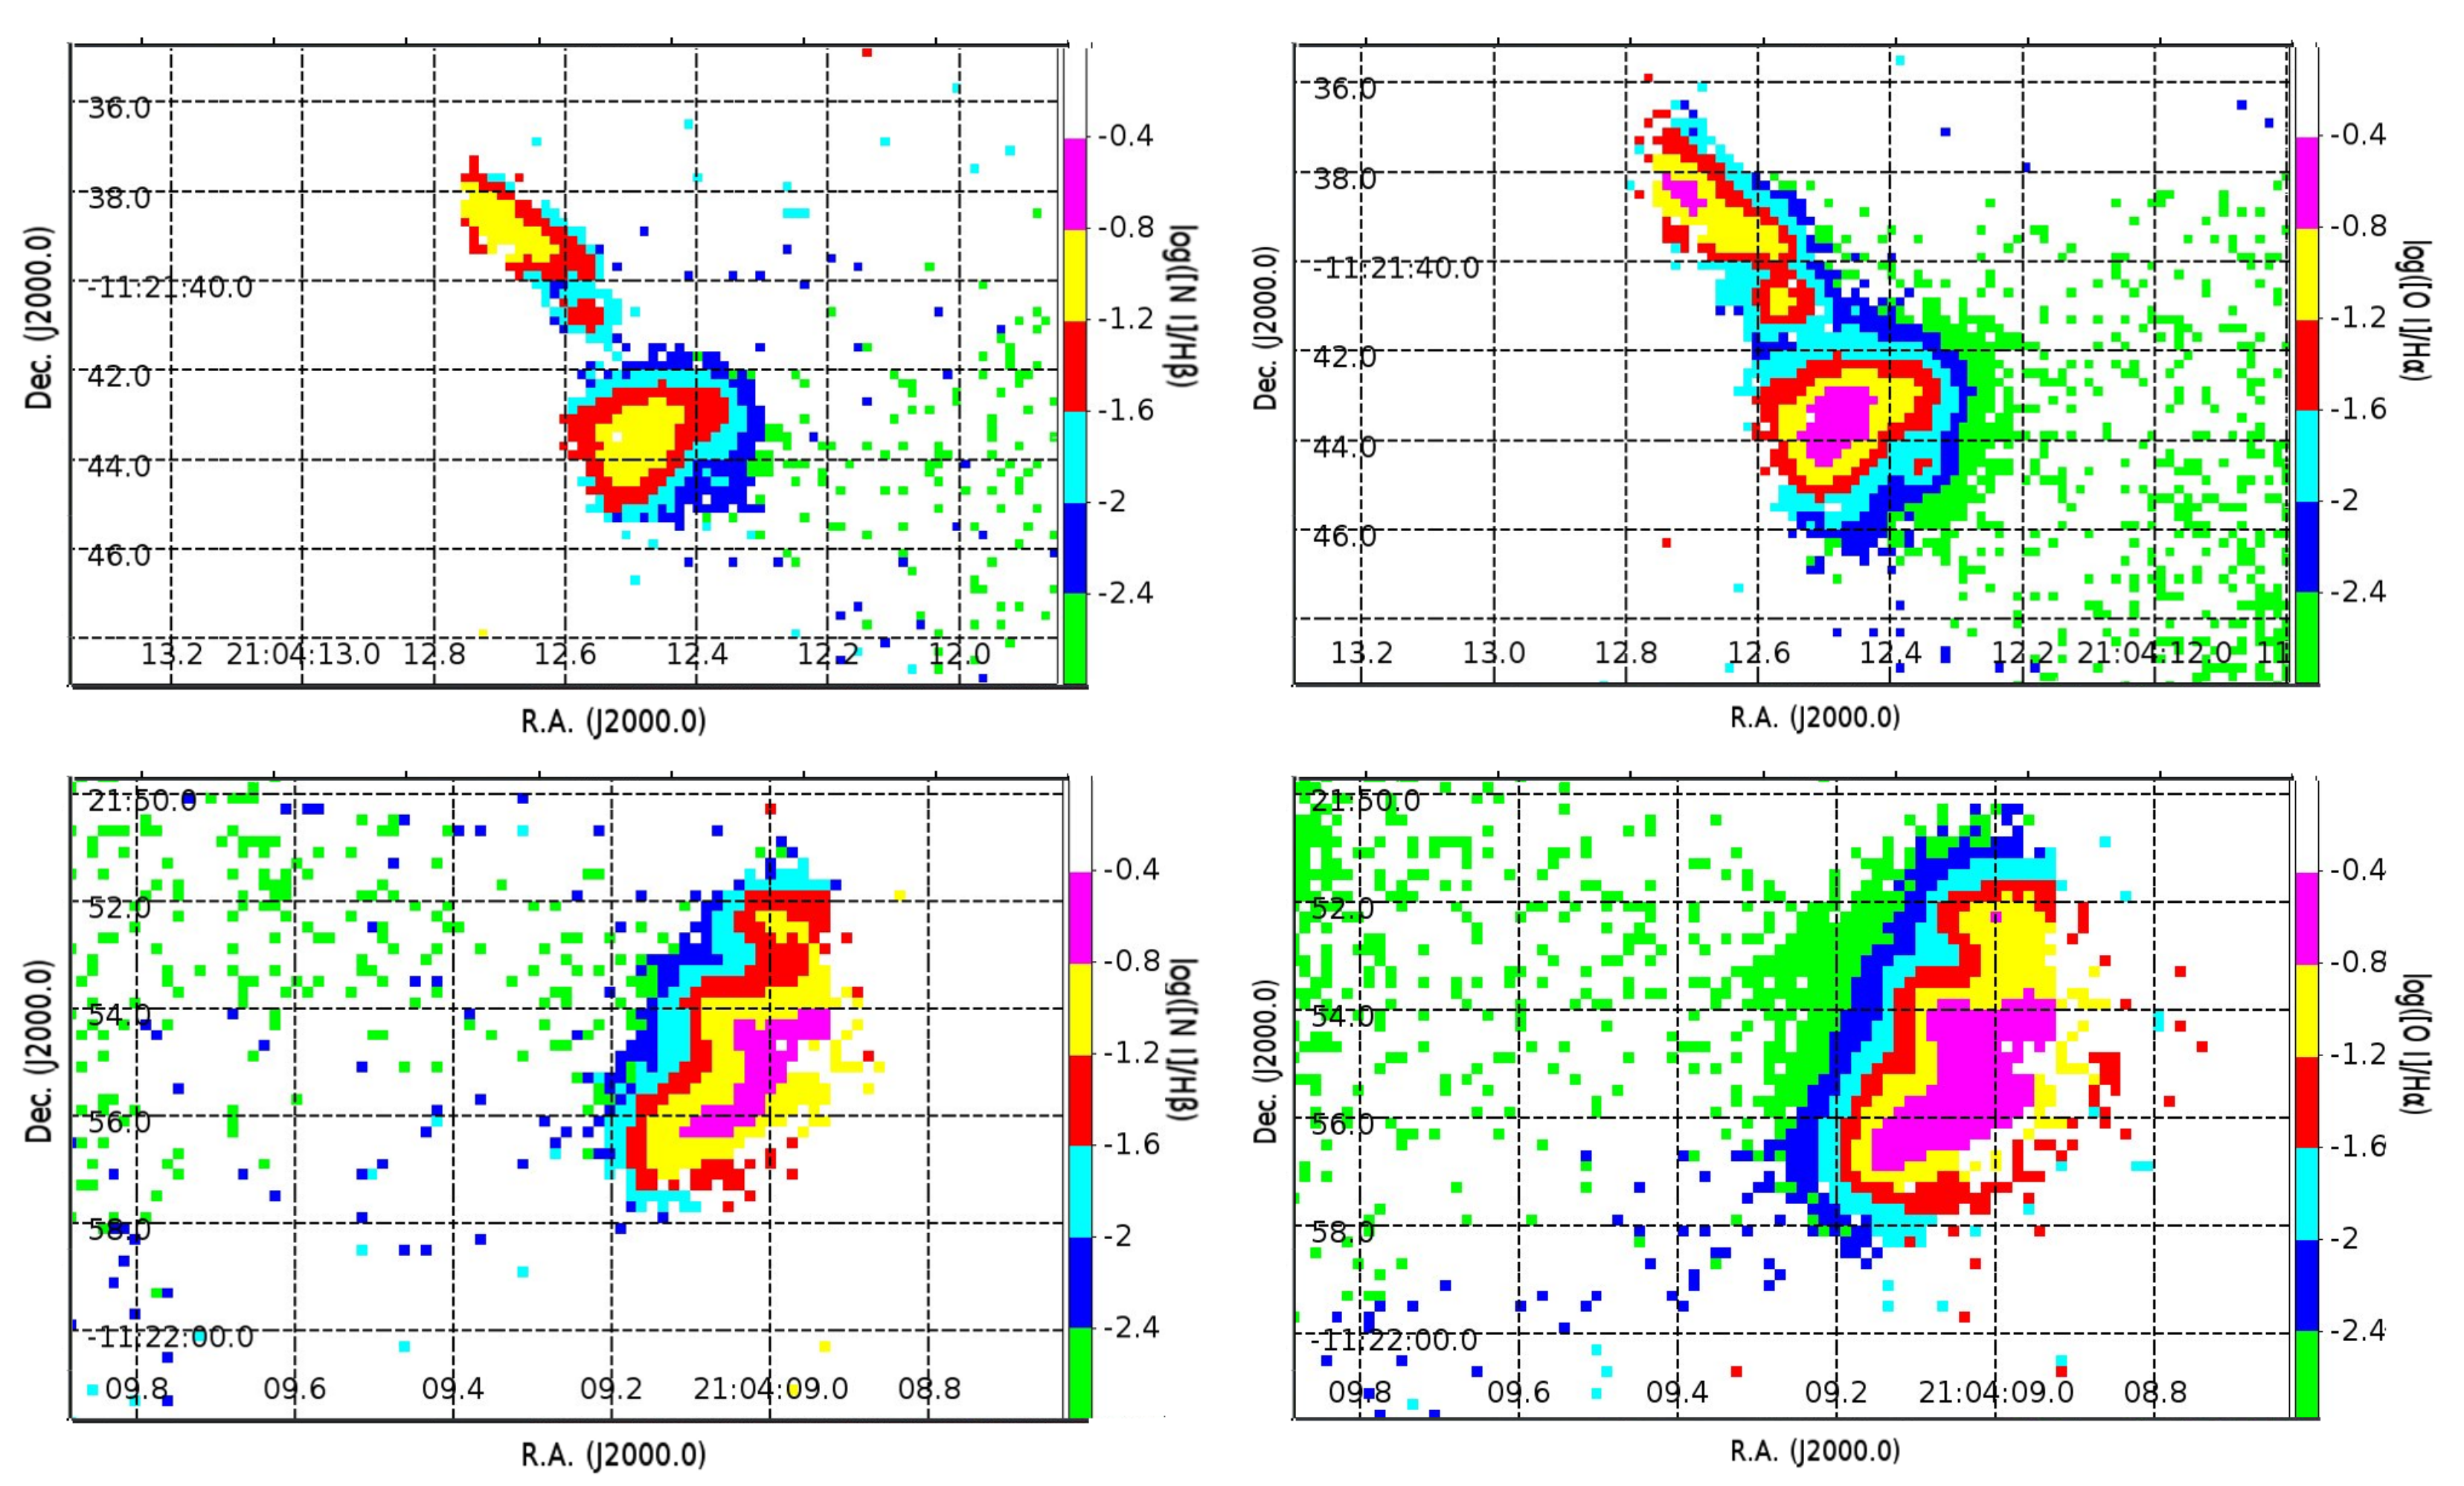
Moreover, a clear stratification in the knots was also observed. Both line ratios, [O
i]
6300/H
and [N
i]
5200/H
, had low values (>−2.5) closer to the CS and increased to higher distances or deeper into the knots up to −0.5 (see
Figure 4). On the other hand, the [O
iii]/H
line ratio was higher at the outer parts of the knots and became lower deeper in the structures or at a higher distance from the CS (not shown here). This stratification in the knots is also verified by the radial analysis module, which provides the peak of each emission along the radial direction. This result agrees with the prediction from the photo-evaporation of dense molecular clumps [
23].
The outer edges of the nebula are characterized by the highest [O
iii]/H
ratio >1.35 (upper right panel in
Figure 3). This augmentation in the [O
iii]/H
ratio was also found in other PNe and attributed to potential shock interactions with the ISM [
4].
3.4. NGC 6778
NGC 6778 displays a complex morphology characterized by a bright waist and a number of collimated outflows and knots [
27].
satellite was applied to the MUSE IFU data of this nebula (PI: R. L. M. Corradi; ID: 097.D-0241(A)) to carry out a 1D and 2D spectroscopic studies. A more detailed analysis of the nebula, including several optical recombination lines (ORLs), is presented by [
8].
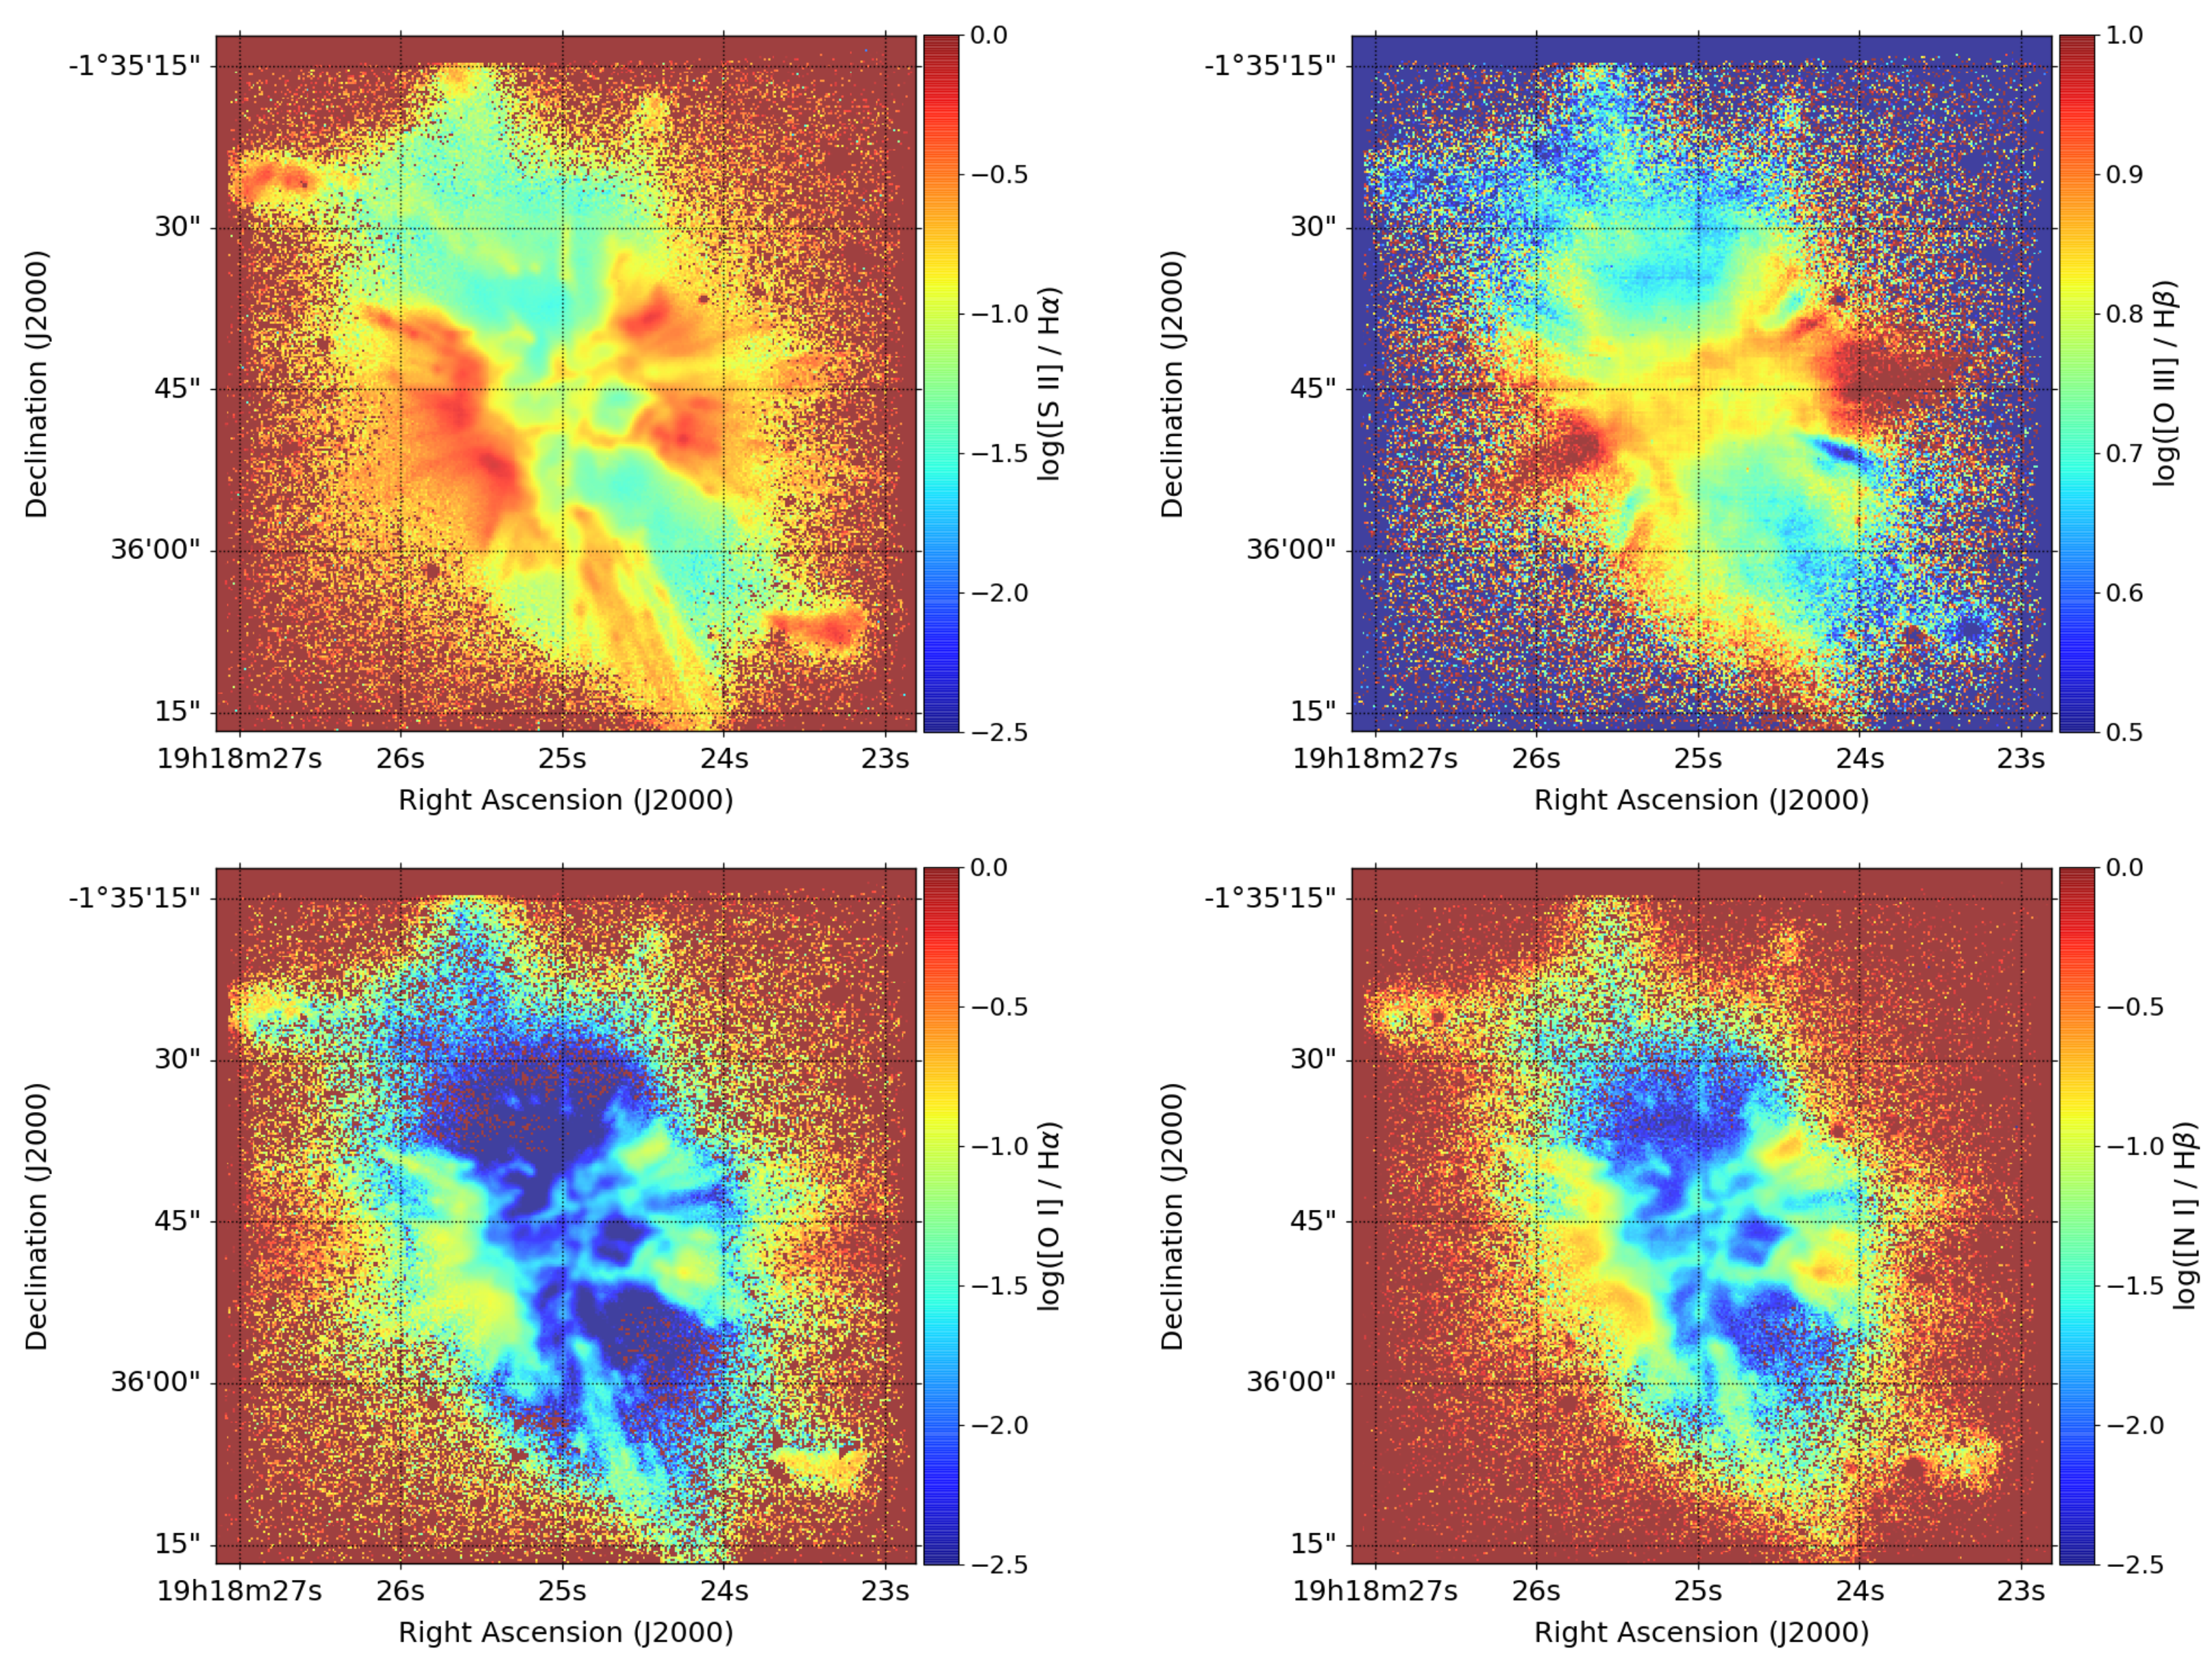
Figure 5 displays the [S
ii]
6716 +
6731/H
, [O
iii]
4959 +
5007/H
, [O
i]
6300/H
, and [N
i]
5200/H
line ratio maps of NGC 6778. The waist of the nebula seems to be fragmented into several filaments and knots. All these micro-structures exhibit higher low-ionization line ratios, as well as higher [O
iii]/H
ratio relative to the surrounding gas, contrary to the outer isolated knots at the edges of the collimated outflows, which are characterized by higher low-ionization line ratios and lower [O
iii]/H
ratio. The same hypothesis of nebular components with different ionization states and density structures is also applicable to NGC 6778.
4. Conclusions
Integral field spectroscopy has changed the way we study extended ionized nebulae, such as PNe galaxies or H II regions. However, the comparison between the spaxel-by-spaxel analysis of IFU and the traditional long-slit spectroscopy or 1D modelling is not straightforward [
7,
28]. A new Python code, namely
satellite, was recently developed (Akras et al. 2021, submitted) to carry out 1D (pseudo-slits) and 2D (spaxel-by-spaxel) spectroscopic analyses of the line maps provide by IFUs.
The results from the application of satellite to the VIMOS and MUSE IFU data of four PNe are discussed in this contribution and are summarised below.
The orientation or position angle of the pseudo-slits in satellite is simulated by rotating the entire line flux maps. This rotation has no impact on the calculations of any physico-chemical parameter.
The 1D spectroscopic analysis of the VIMOS datacubes of Abell 14 through the specific slit module has confirmed the high [N i] 5200/H ratio reported in the literature, but not the high [O i] 6300/H ratio, which is not measurable in the 1D pseudo-slits from any PA.
Hen 2-108 is characterized by a low c(H) in the inner part of the nebula that increases towards the outer parts based on the results from the radial analysis module. Interestingly, the rotation analysis module has also revealed a non-negligible reduction of c(H) at the position angle of ∼50 °C.
The analysis of the 2D emission line ratio maps of NGC 7009 has displayed a significantly different ionization state among the different nebular features. Neutral gas is found mainly in the pairs of knots.
NGC 6778 shows a knotty and filamentary waist, together with some knots at the edges of the collimated outflows. All knots have log([N i] 5200/H)> −1 and log([O i] 6300/H)> −1, while the main nebula exhibits ratios <−2.
The variation in the ionization state between the knots and the main nebular components may indicate structures with significant density contrast. The photo-evaporation process is likely responsible for the emission from the dense molecular knots.
The use of satellite makes the quantitative evaluation of the physic-chemical (c(H), , , X/H, etc) variations far easier, giving the extended nebulae a great opportunity to dive in on the exploration and interpretation of these variation behaviours for a more complete understanding of these ionized nebulae. The code itself will also be upgraded by improving its capabilities and implementing additional modules and tasks.
Author Contributions
Methodology, software, validation, S.A.; writing—original draft preparation, S.A., H.M., J.R.W., I.A., D.R.G. and P.B.; writing—review and editing, S.A., H.M., J.R.W., I.A., D.R.G. and P.B. All authors have read and agreed to the published version of the manuscript.
Funding
S.A. acknowledges support under the grant 5077 (The EXPANSE project), financed by IAASARS/NOA. D.R.G. is partially supported by the CNPq grants 428330/2018-5 and 313016/2020-8.
Data Availability Statement
Conflicts of Interest
The authors declare no conflict of interest.
Abbreviations
The following abbreviations are used in this manuscript:
| PN | Planetary Nebula |
| AGB | Asymptotic giant branch |
| IFU | Integral Field Unit |
| MUSE | Multi-Unit Spectroscopic Explorer |
| VIMOS | VIsible MultiObject Spectrograph |
| ESO | European Southern Observatory |
| ORLs | Optical Recombination Lines |
| IFS | Integral field spectroscopy |
| PDRs | Photodissociation regions |
| ICF | Ionization correction factor |
| LISs | Low ionization structures |
| PA | Position angle |
| CS | Central star |
Notes
| 1 | satellite does not extract the 2D flux maps from IFU data cubes. These maps are provided by the user and they can be derived either by the spectral fitting of an emission line (this is the case for all four PNe presented in this work) or summing up the flux density over a given wavelength range. |
| 2 | The pyneb versions 1.1.13 and 1.1.15 were tested. The latest version of pyneb was implemented in the current version of satellite (v1.3). |
References
- Akras, S.; Gonçalves, D.R. Low-ionization structures in planetary nebulae - I. Physical, kinematic and excitation properties. Mon. Not. R. Astron. Soc. 2016, 455, 930–961. [Google Scholar] [CrossRef]
- Derlopa, S.; Akras, S.; Boumis, P.; Steffen, W. High-velocity string of knots in the outburst of the planetary nebula Hb4. Mon. Not. R. Astron. Soc. 2019, 484, 3746–3754. [Google Scholar] [CrossRef]
- Balick, B.; Perinotto, M.; Maccioni, A.; Terzian, Y.; Hajian, A. FLIERs and Other Microstructures in Planetary Nebulae. II. Astrophys. J. 2015, 424, 800. [Google Scholar] [CrossRef]
- Guerrero, M.A.; Toalá, J.A.; Medina, J.J.; Luridiana, V.; Miranda, L.F.; Riera, A.; Velázquez, P.F. Unveiling shocks in planetary nebulae. Astron. Astrophys. 2015, 557, A121. [Google Scholar] [CrossRef]
- Akras, S.; Boumis, P.; Meaburn, J.; Alikakos, J.; López, J.A.; Gonçalves, D.R. Evidence for a [WR] or WEL-type binary nucleus in the bipolar planetary nebula Vy 1-2. Mon. Not. R. Astron. Soc. 2015, 452, 2911–2929. [Google Scholar] [CrossRef][Green Version]
- Ramos-Larios, G.; Guerrero, M.A.; Nigoche-Netro, A.; Olguín, L.; Gómez-Muñoz, M.A.; Sabin, L.; Vázquez, R.; Akras, S.; Ramírez Vélez, J.C.; Chávez, M. The interaction of the halo around the butterfly planetary nebula NGC 650-1 with the interstellar medium. Mon. Not. R. Astron. Soc. 2018, 475, 932–941. [Google Scholar] [CrossRef]
- Akras, S.; Monteiro, H.; Aleman, I.; Farias, M.A.F.; May, D.; Pereira, C.B. Exploring the differences of integrated and spatially resolved analysis using integral field unit data: The case of Abell 14. Mon. Not. R. Astron. Soc. 2020, 493, 2238–2252. [Google Scholar] [CrossRef]
- García-Rojas, J.; Morisset, C.; Jones, D.; Wesson, R.; Boffin, H.M.J.; Monteiro, H.; Corradi, R.L.M.; Rodríguez-Gil, P. MUSE spectroscopy of planetary nebulae with high abundance discrepancies. Mon. Not. R. Astron. Soc. 2022, 510, 5444–5463. [Google Scholar] [CrossRef]
- Kumari, N.; James, B.L.; Irwin, M.J. A GMOS-N IFU study of the central H II region in the blue compact dwarf galaxy NGC 4449: Kinematics, nebular metallicity and star formation. Mon. Not. R. Astron. Soc. 2017, 470, 4618–4637. [Google Scholar] [CrossRef]
- Telles, E.; Thuan, T.X.; Izotov, Y.I.; Carrasco, E.R. A Gemini/GMOS study of the physical conditions and kinematics of the blue compact dwarf galaxy Mrk 996. Astron. Astrophys. 2014, 561, A64. [Google Scholar] [CrossRef]
- Seitenzahl, I.R.; Vogt, F.P.A.; Terry, J.P.; Ghavamian, P.; Dopita, M.A.; Ruiter, A.J.; Sukhbold, T. Integral Field Spectroscopy of Supernova Remnant 1E0102-7219 Reveals Fast-moving Hydrogen and Sulfur-rich Ejecta. Astrophys. J. 2018, 853, L32. [Google Scholar] [CrossRef]
- Luridiana, V.; Morisset, C.; Shaw, R.A. PyNeb: A new tool for analyzing emission lines. I. Code description and validation of results. Astron. Astrophys. 2015, 573, A42. [Google Scholar] [CrossRef]
- Le Fèvre, O.; Saisse, M.; Mancini, D.; Brau-Nogue, S.; Caputi, O.; Castinel, L.; D’Odorico, S.; Garilli, B.; Kissler-Patig, M.; Lucuix, C.; et al. Commissioning and performances of the VLT-VIMOS instrument. In Proceedings of the Astronomical Telescopes and Instrumentation, Waikoloa, HI, USA, 22–28 August 2002; Volume 4841, pp. 1670–1681. [Google Scholar]
- Bohigas, J. Infrared Imaging and Optical Imaging and Spectroscopy of (mostly) Type I Planetary Nebulae. II. Rev. Mex. Astron. Astrofis. 2003, 39, 149–170. [Google Scholar]
- Henry, R.B.C.; Kwitter, K.B.; Jaskot, A.E.; Balick, B.; Morrison, M.A.; Milingo, J.B. Abundances of Galactic Anticenter Planetary Nebulae and the Oxygen Abundance Gradient in the Galactic Disk. Astrophys. J. 2010, 724, 748–761. [Google Scholar] [CrossRef]
- Akras, S.; Clyne, N.; Boumis, P.; Monteiro, H.; Gonçalves, D.R.; Redman, M.P.; Williams, S. Deciphering the bipolar planetary nebula Abell 14 with 3D ionization and morphological studies. Mon. Not. R. Astron. Soc. 2016, 457, 3409–3419. [Google Scholar] [CrossRef][Green Version]
- Gonçalves, D.R.; Corradi, R.L.M.; Mampaso, A.; Perinotto, M. The Physical Parameters, Excitation, and Chemistry of the Rim, Jets, and Knots of the Planetary Nebula NGC 7009. Astrophys. J. 2003, 597, 975–985. [Google Scholar] [CrossRef][Green Version]
- Gonçalves, D.R.; Ercolano, B.; Carnero, A.; Mampaso, A.; Corradi, R.L.M. On the nitrogen abundance of fast, low-ionization emission regions: The outer knots of the planetary nebula NGC 7009. Mon. Not. R. Astron. Soc. 2006, 365, 1039–1049. [Google Scholar] [CrossRef]
- Gonçalves, D.R.; Corradi, R.L.M.; Mampaso, A. Low-Ionization Structures in Planetary Nebulae: Confronting Models with Observations. Astrophys. J. 2001, 547, 302–310. [Google Scholar] [CrossRef]
- Akras, S.; Gonçalves, D.R.; Ramos-Larios, G.; Aleman, I. H2 emission in the low-ionization structures of the planetary nebulae NGC 7009 and NGC 6543. Mon. Not. R. Astron. Soc. 2020, 493, 3800–3810. [Google Scholar] [CrossRef]
- Akras, S.; Gonçalves, D.R.; Ramos-Larios, G. H2 in low-ionization structures of planetary nebulae. Mon. Not. R. Astron. Soc. 2017, 465, 1289–1296. [Google Scholar] [CrossRef]
- Fang, X.; Zhang, Y.; Kwok, S.; Hsia, C.-H.; Chau, W.; Ramos-Larios, G.; Guerrero, M.A. Extended Structures of Planetary Nebulae Detected in H2 Emission. Astrophys. J. 2017, 859, 92. [Google Scholar] [CrossRef]
- Mellema, G.; Raga, A.C.; Canto, J.; Lundqvist, P.; Balick, B.; Steffen, W.; Noriega-Crespo, A. Photo-evaporation of clumps in planetary nebulae. Astron. Astrophys. 1998, 331, 335–346. [Google Scholar]
- Bacon, R.; Accardo, M.; Adjali, L.; Anwand, H.; Bauer, S.; Biswas, I.; Blaizot, J.; Boudon, D.; Brau-Nogue, S.; Brinchmann, J.; et al. The MUSE second-generation VLT instrument. Ground-based and Airborne Instrumentation for Astronomy III. Proc. SPIE 2010, 7735, 773508. [Google Scholar]
- Walsh, J.R.; Monreal-Ibero, A.; Barlow, M.J.; Ueta, T.; Wesson, R.; Zijlstra, A.A. The extinction and dust-to-gas structure of the planetary nebula NGC 7009 observed with MUSE. Astron. Astrophys. 2016, 588, A106. [Google Scholar] [CrossRef]
- Walsh, J.R.; Monreal-Ibero, A.; Barlow, M.J.; Ueta, T.; Wesson, R.; Zijlstra, A.A. An imaging spectroscopic survey of the planetary nebula NGC 7009 with MUSE. Astron. Astrophys. 2018, 620, A169. [Google Scholar] [CrossRef]
- Guerrero, M.A.; Miranda, L.F. NGC 6778: A disrupted planetary nebula around a binary central star. Astron. Astrophys. 2012, 539, A47. [Google Scholar] [CrossRef]
- Ercolano, B.; Dale, J.E.; Gritschneder, M.; Westmoquette, M. Synthetic observations of simulated Pillars of Creation. Mon. Not. R. Astron. Soc. 2020, 420, 141–146. [Google Scholar] [CrossRef][Green Version]
| Publisher’s Note: MDPI stays neutral with regard to jurisdictional claims in published maps and institutional affiliations. |
© 2022 by the authors. Licensee MDPI, Basel, Switzerland. This article is an open access article distributed under the terms and conditions of the Creative Commons Attribution (CC BY) license (https://creativecommons.org/licenses/by/4.0/).


