Article

Lessons from the Ionised and Molecular Mass of Post-CE PNe

1
Observatorio Astronómico Nacional (OAN-IGN), Alfonso XII, 3, 28014 Madrid, Spain
2
Instituto de Astrofísica de Canarias, 38205 La Laguna, Spain
3
Departamento de Astrofísica, Universidad de La Laguna, 38206 La Laguna, Spain
4
Observatorio Astronómico Nacional (OAN-IGN), Apartado 112, 28803 Alcalá de Henares, Spain
5
Department of Physics and Astronomy, University College London, Gower St., London WC1E 6BT, UK
*
Author to whom correspondence should be addressed.
Galaxies 2022, 10(1), 26; https://doi.org/10.3390/galaxies10010026
Submission received: 26 December 2021 / Revised: 20 January 2022 / Accepted: 22 January 2022 / Published: 1 February 2022
(This article belongs to the Special Issue Asymmetric Planetary Nebulae 8e)

Abstract

:
Close binary evolution is widely invoked to explain the formation of axisymmetric planetary nebulae after a brief common envelope phase. The evolution of the primary would be interrupted abruptly, its still quite massive envelope being fully ejected to form the PN, which should be more massive than a planetary nebula coming from the same star, were it single. We test this hypothesis by investigating the ionised and molecular masses of a sample consisting of 21 post-common-envelope planetary nebulae, roughly one-fifth of their known total population, and comparing them to a large sample of regular planetary nebulae (not known to host close-binaries). We find that post-common-envelope planetary nebulae arising from single-degenerate systems are, on average, neither more nor less massive than regular planetary nebulae, whereas post-common-envelope planetary nebulae arising from double-degenerate systems are considerably more massive and show substantially larger linear momenta and kinetic energy than the rest. The reconstruction of the common envelope of four objects further suggests that the mass of single-degenerate nebulae actually amounts to a very small fraction of the envelope of their progenitor stars. This leads to the uncomfortable question of where the rest of the envelope is, raising serious doubts on our understanding of these intriguing objects.

1. Introduction

Planetary nebulae (PNe) display beautiful, complex morphologies often showing high degrees of symmetry, mostly elliptical or bipolar. Among the mechanisms usually invoked to explain their intriguing shaping [1], angular momentum transfer from a companion is currently considered a key ingredient [2,3]. In the case of a sufficiently close companion, the system undergoes a common envelope (CE) event when the primary star evolves along the giant branch(es), expanding before eventually overflowing its Roche lobe and engulfing its companion [4]. In this very brief stage (∼1 year), the orbit of the secondary star quickly shrinks due to drag forces, providing an angular momentum for the system to eject the CE, which we will observe as a PN.
From an observational point of view, the number of confirmed post-CE PNe has been quickly growing in recent decades, amounting to around 100 objects so far (see updated list with references to discovery papers in http://www.drdjones.net/bcspn/ (accesed on 15 January 2022). On theoretical grounds, nevertheless, the mechanism of CE ejection remains elusive, with most hydrodynamic models unable to gravitationally unbind the whole envelope without recurring to additional energy reservoirs, such as recombination energy from the ionised regions, e.g., [5,6,7,8,9]. Furthermore, it has long been known that CE ejection have problems explaining PNe evolution as the ejection will likely leave too large a mass above the C-O core, and the central star will remain on the AGB and not evolve to the left on the H-R diagram (see, e.g., Section 9 of [10]). To sum up, simulations collectively show that the CE has a major role in shaping PNe, but we are far from fully understanding the physics behind the death of a significant fraction of stars in the Universe.
Carefully estimating the actual mass of post-CE PNe could help us gain a better understanding of the physics of CE ejection. In this respect, it can be helpful to establish comparisons between these objects and the general population of PNe, encompassing nebulae arising not only from close binaries but also from single stars and longer period binary stars that did not experience a CE. The only existing previous work covering this topic studied the ionised mass of a sample of post-CE PNe, suggesting these objects are slightly less massive, on average, than the general population of PNe [11].
In this work, we systematise the analysis of the mass of post-CE PNe, extending it to cover molecular masses as well as ionised ones, applying it over a sample comprising 21 post-CE PNe (roughly one-fifth of the total known population of these objects), and putting it into context by comparing it to a larger sample of 97 ‘regular’ PNe (nebulae not known to arise from close-binary systems). This proceeding summarises the main results of our study. Please consult the main publication for additional details, information on the methods followed, and general discussion on the mass of post-CE PNe [12].

2. Sample and Observations

We used the IRAM 30 m radiotelescope to carry out mm-wavelength observations in order to probe the molecular content of an initial sample of nine post-CE PNe of the northern sky which were previously unobserved in 12 CO and 13 CO J = 1−0 and J = 2−1. Only one of them, NGC 6778, was detected, and its molecular emission profiles were indicative of the presence of a thin ring-like structure along the equator of the nebula, located outwards from the equatorial ionised, broken ring visible in optical images [13]. See [12] for a spatiokinematical model of this structure including radiative-transfer of CO species.
The sample was later extended to 21 post-CE PNe, including objects with molecular observations published in the literature [14,15,16,17]. Note that only 3 of these 21 objects, NGC 6778, NGC 2346, and NGC 7293, show molecular emission at all; hence, the molecular masses computed below are upper limits in most cases.
In addition to the molecular data, we also gathered dereddenned H α fluxes and optical sizes from [18], as well as literature-based values of the densities and electronic temperatures of every object in the sample.

3. The Mass of Post-CE PNe

We computed the ionised and molecular masses of the whole sample of post-CE PNe in a systematic way. We here describe the analyses performed, present our results on the masses, and compare them to the masses of a large sample of ‘regular’ PNe estimated in the same way.

3.1. Ionised Masses

The total ionised masses of the PNe were calculated as:
M ion = 4 π D 2 F ( H β ) m p h ν H β n e α H β eff ,
where D is the distance, F ( H β ) is the dereddened, spatially integrated H β flux, m p is the mass of the proton, h ν H β is the energy of an H β photon, n e is the electron density, and α H β eff is the effective recombination coefficient of H β [19].
For the results to be as standardised as possible, we only utilised H β fluxes derived from the dereddened H α surface brightness tabulated by [18] integrated over the ellipse defined by the minor and major axes tabulated in the same work. With respect to electron temperatures, we used T[O III] determinations when possible and assumed T e = 10,000 K in those objects where no determination was available. Similarly, we used [S ii] line doublet determinations of the electron densities, except for NGC 246, where only an estimate based on [O ii] was available. As for distances, we prioritised GAIA eDR3 determinations by [20], and their associated errors were <33%. In the absence of these, we used distances by [18].

3.2. Molecular Masses
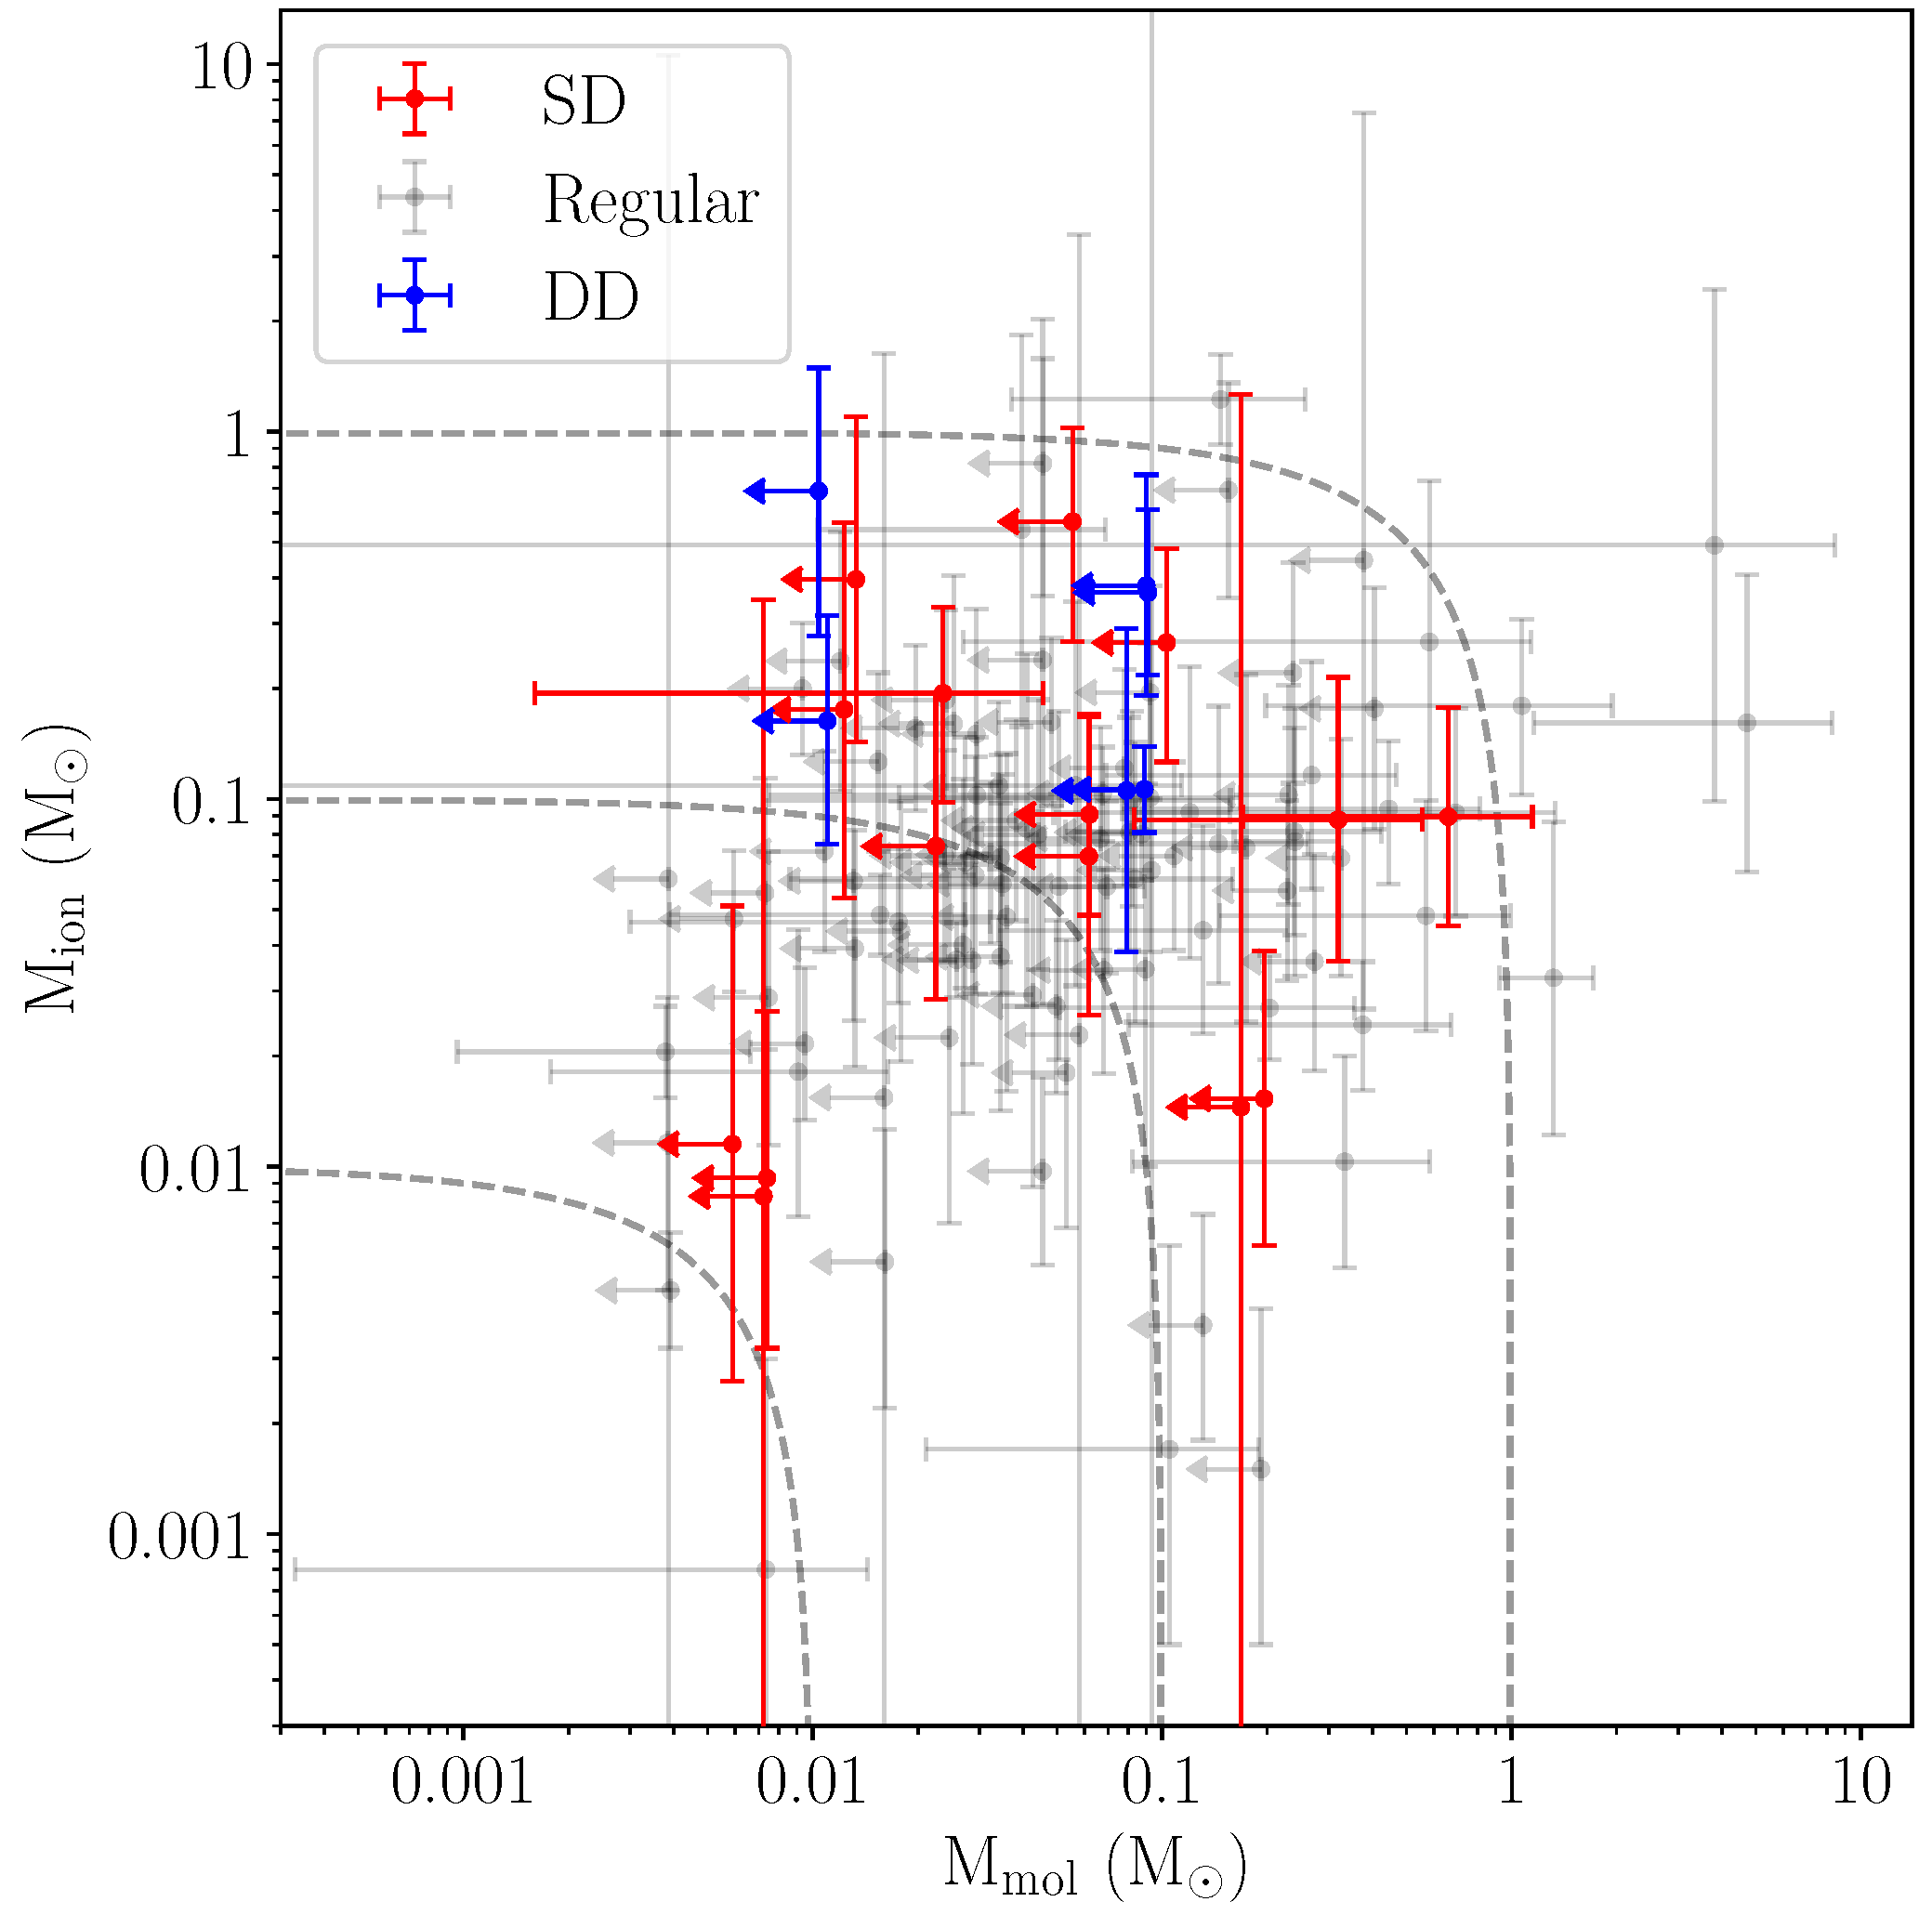
We computed the molecular mass for the three objects in our sample that show molecular emission and conservative (3- σ ) upper limits to the molecular mass of the rest of the objects in the sample. We assume that: (i) the CO level populations are in local thermodynamic equilibrium (LTE) and are characterised by an excitation temperature T ex ; (ii) the CO abundance X relative to molecular hydrogen is constant throughout the nebula; and (iii) the selected CO transition is optically thin. Under these conditions, the molecular mass M mol of the nebula is:
M mol = 4 π m H 2 D 2 A ul X h ν g u e h ν k T ex Z ( T ex ) f He S ν ,
where m H 2 is the mass of the hydrogen molecule, h and k are the Planck and Boltzmann constants, ν is the frequency of the transition, A ul its Einstein coefficient, g u the degeneracy of its upper state, Z the partition function, D the distance to the nebula, f He the correction factor to account for helium abundance (assumed to be He/H = 0.1 and thus resulting in f He = 1.2 because we also assume the majority of particles to be of molecular hydrogen), and S ν the flux density:
S ν = 2 k ν 2 F c 2 ,
where c is the speed of light in vacuum and F the total flux of the nebula in the given transition, integrated both spatially and spectrally. We assumed an excitation temperature of T ex = 50 K and a CO abundance X = 2 × 10 4 for every object in our calculations and primarily used the 12 CO J = 2−1 transition, which is more ubiquous and better detected in the literature. In order to overcome the clear limitation that this transition (as well as the 12 CO J = 3−2 one) is usually not optically thin, we introduce a correction factor for the underestimated masses resulting from J = 2−1 (and J = 3−2) transitions in order to match masses found via the J = 1−0 transition in a sample of PNe in which both transitions are available in the literature [14,15,16,17]. These resulted in a factor of 3.65 to calculations using 12 CO J = 2−1 and a factor 5.0 for those using 12 CO J = 3−2. We recall that the best correction factor will vary from nebula to nebula and that this method is meant to be statistically meaningful in order to allow for comparisons with the ionised mass of these objects and among subclasses of post-CE PNe.

3.3. Results

The resulting masses of the studied post-CE PNe are displayed in Table 1. Interestingly, a trend arises when we divide the sample into the categories of single-degenerate (SD) and double-degenerate (DD) systems according to one or both components of the binary pair being a post-AGB star: PNe hosting DD systems are considerably more massive, on average, than their SD counterparts. Thus, the geometric mean of the ionised+molecular mass for the SD sample is 0.15 M , with a geometric standard deviation (GSD) factor of 3.4, whereas for the DD sample, the geometric mean is substantially larger, 0.31 M , with a narrower GSD of 1.7.
The linear momenta and kinetic energies of these objects can provide additional insight. We gathered the expansion velocities from systematic works, such as [21]. These seem to follow a similar trend as ionised+molecular mass, with values somewhat larger in DD systems than in SD ones. The resulting linear momenta have substantially different geometric means of 6.3 × 10 38 g cm s 1 (GSD factor 3.5) and 2.2 × 10 39 g cm s 1 (GSD factor 2.3) for SD and DD systems, respectively. The kinetic energies differ in a more pronounced way, with SD systems having a geometric mean of 8.1 × 10 44 erg (GSD factor 3.7), whereas DD systems show a much larger 3.9 × 10 45 erg (GSD factor 4.2) for DD ones.

3.4. Comparison with Regular PNe

We can put these results in the context of the general population of PNe. Are post-CE PNe more or less massive on average than the general population of PNe? The answer to this question may have strong implications for theories of CE interaction and ejection.
We therefore reviewed the literature in order to derive the ionised and molecular masses of an additional sample of 97 ‘regular’ PNe (not known to arise from binary systems). All of them have dereddened H α flux and diameters, both obtained in a systematic way by [18], and they also have available 12 CO observations and precise distance determinations (either accurate GAIA eDR3 determinations or being listed as a ‘distance calibrator’ by [18]). Note that this sample is not limited by volume and is not exempt from selection biases, although the effect of those biases, once filtered by the inclusion criteria, is unclear and difficult to predict. In any case, we stress the intrinsic limitation of the comparison provided in this section, which should be taken with a pinch of salt for the the time being.
The resulting ionised+molecular masses (or their upper limits) of the ‘regular’ PNe are displayed in Figure 1 along with the results for the SD and DD post-CE PNe analysed in Section 3.3. The geometric mean of the mass is the same as that for SD systems, 0.15 M , with a geometric standard deviation (GSD) factor of 3.1. An analysis including the expansion velocities suggests that the characteristic linear momenta of the SD and regular sample are also very similar, although the slightly higher expansion velocities shown by post-CE systems make the kinetic energies of SD post-CE PNe somewhat higher than those of regular PNe. DD systems, on the other hand, seem to show substantially more massive and faster expanding nebulae (larger linear momenta and kinetic energy) than either SD systems and ‘regular’ PNe.
We stress that the statistics of the post-CE PNe sample are insufficient to draw general conclusions. Nevertheless, A k-sample Anderson–Darling test ([22]) on the ionised + (maximum) molecular masses of the different samples may provide additional insights: while the test is unable to ascertain whether the SD and DD mass distributions are different with a probability larger than 75%, the probability that the whole post-CE sample and the regular PNe sample actually represent different distributions is 80%, which increases to 92% if we consider only the DD and regular PNe samples.

4. Discussion and Conclusions

Our results indicate that post-CE PNe hosting SD systems seem, on average, neither more nor less massive than regular PNe, whereas post-CE PNe from DD systems seem considerably more massive than both groups. This discrepancy is further increased when considering the linear momentum and kinetic energy of these nebulae. In other words, DD systems seem more capable of unbinding and accelerating a larger amount of material than SD systems.
Furthermore, our work suggests a profound mismatch between observations and modelling. On the one hand, models of CE ejection tend to fail to unbind the whole AGB envelope. On the other hand, the observed ionised+molecular mass of these systems seem substantially lower than the expected mass of the AGB envelope at the time of CE occurence, especially in the case of SD systems. In order to quantitatively account for this discrepancy, at least on a first-order approximation, we attempted the reconstruction of the CE of two SD systems, Abell 63 and Hen 2-155, and two DD systems, Fg 1 and Hen 2-428. Following the methodology given in [23,24], we derived the percentage of the AGB envelope mass that the observed nebula accounts for and the percentage of the orbital shrinking energy budget actually spent on unbinding and accelerating the observed nebula. We find that the mass of the two SD nebulae are ∼1% and ∼22% of their respective AGB envelopes, while for the two DD systems, the corresponding figures are ∼64% and ∼61%. Given the large uncertainties, this suggests that DD systems could be unbinding the whole AGB envelope, whereas in the case of SD systems, it is hard to reconcile the idea that the observed nebulae is actually the AGB envelope at the time of CE. Examining the energy budget also procures a surprising conclusion: the four analysed systems seem to have spent only between ∼1% and ∼11% of their available orbital shrinking energy budget in unbinding and accelerating their nebulae.
This leads to some uncomfortable questions: If the primary star is a similar mass as normal post-AGB stars, and thus, the mass of the nebula amounts to just a tiny fraction of the star’s envelope, then where is the rest of the envelope? Why are we unable to detect it somewhere in the vicinity of the star?
Some possibilities can be considered from a theoretical perspective. A fraction of the ejected mass could fall back into a circumbinary disk. Material from this disk accreted by the central stars could be reprocessed, thus offering an explanation for the correlation between large abundance discrepancy factors and post-CE central stars in PNe [25]. CE itself could be not a unique, only-once process, but an episodic, long-lasting one, in line with models such as Grazing Envelope Evolution proposed by [26,27]. This interaction would need to last long enough for a significant fraction of the AGB envelope to become diluted in the ISM before the later ejection giving rise to the observed PN.
From an observational viewpoint, we note that we have not taken into account any potential mass that could be present in neutral, atomic form located in a photo-dissociation region (PDR) between the inner, ion-rich region and the outer, molecule-rich one. This is due to the lack of observations of spectral features suitable for determining low-excitation, neutral masses (e.g., the [C ii] 158 μ m line, unobservable with ground-based telescopes). In fact, the only existing observations of post-CE PNe at this wavelength are unpublished data of NGC 2392 by HERSCHEL/HIFI+PACS, which allows an estimate of the neutral mass of this nebula of a mere 2 × 10 3 M [28]. This is in line with the derived values of the neutral atomic mass in other studied PNe, which is almost always ≲0.1 M [29,30]. Given this, the possibility that the missing mass is hidden in low-excitation, neutral atomic form seems unlikely, although it merits a future observational campaign on this topic [28].

Author Contributions

Conceptualisation, M.S.-G. and D.J.; methodology, M.S.-G., D.J. and V.B.; software, M.S.-G., D.J., V.B. and R.W.; validation, V.B.; formal analysis, M.S.-G. and D.J.; investigation, M.S.-G., D.J. and J.A.; data curation, M.S.-G.; writing—original draft preparation, M.S.-G.; writing—review and editing, M.S.-G., D.J., J.A. and V.B.; visualisation, M.S.-G. and D.J.; supervision, V.B. and J.A.; project administration, J.A.; funding acquisition, J.A. All authors have read and agreed to the published version of the manuscript.

Funding

This research was funded by the Spanish Ministry of Science and Innovation (MICINN) through projects AxIN (grant AYA2016-78994-P) and EVENTs/Nebulae-Web (grant PID2019-105203GB-C21), and grant P/308614 and by the Erasmus+ programme of the European Union under grant number 2020-1-CZ01-KA203-078200.

Institutional Review Board Statement

Not applicable.

Informed Consent Statement

Not applicable.

Conflicts of Interest

The authors declare no conflict of interest.

References

  1. Balick, B.; Frank, A. Shapes and Shaping of Planetary Nebulae. Annu. Rev. Astron. Astrophys. 2002, 40, 439–486. [Google Scholar] [CrossRef]
  2. Jones, D.; Boffin, H.M.J. Binary stars as the key to understanding planetary nebulae. Nat. Astron. 2017, 1, 0117. [Google Scholar] [CrossRef]
  3. Decin, L.; Montargès, M.; Richards, A.M.S.; Gottlieb, C.A.; Homan, W.; Mcdonald, I.; El Mellah, I.; Danilovich, T.; Wallström, S.H.J.; Zijlstra, A.; et al. (Sub)stellar companions shape the winds of evolved stars. Science 2020, 369, 1497–1500. [Google Scholar] [CrossRef] [PubMed]
  4. Paczynski, B. Structure and Evolution of Close Binary Systems. In Proceedings of the IAU Symposium 73, Cambridge, UK, 28 June–1 October 1975; p. 75. [Google Scholar]
  5. Ricker, P.M.; Taam, R.E. An AMR Study of the Common-envelope Phase of Binary Evolution. Astrophys. J. 2012, 746, 74. [Google Scholar] [CrossRef] [Green Version]
  6. Jones, D. Observational Constraints on the Common Envelope Phase. In Reviews in Frontiers of Modern Astrophysics; From Space Debris to Cosmology; Springer: Berlin/Heidelberg, Germany, 2020; pp. 123–153. [Google Scholar]
  7. Ohlmann, S.T.; Röpke, F.K.; Pakmor, R.; Springel, V. Hydrodynamic Moving-mesh Simulations of the Common Envelope Phase in Binary Stellar Systems. Astrophys. J. Lett. 2016, 816, 90. [Google Scholar] [CrossRef] [Green Version]
  8. Ivanova, N. On the Use of Hydrogen Recombination Energy during Common Envelope Events. Astrophys. J. Lett. 2018, 858, 24. [Google Scholar] [CrossRef]
  9. Chamandy, L.; Blackman, E.G.; Frank, A.; Carroll-Nellenback, J.; Tu, Y. Common envelope evolution on the asymptotic giant branch: Unbinding within a decade? Mon. Not. R. Astron. Soc. 2020, 495, 4028–4039. [Google Scholar] [CrossRef]
  10. Kwok, S. Conference Summary. In Proceedings of the IAU Symp. 323, Planetary Nebulae: Multi-Wavelength Probes of Stellar and Galactic Evolution, Beijing, China, 10–14 October 2016; pp. 317–324. [Google Scholar]
  11. Frew, D.J.; Parker, Q.A. Do post-common envelope objects form a distinct subset of PNe? In Proceedings of the Asymmetrical Planetary Nebulae IV Conference, La Palma, Spain, 19–22 June 2007; pp. 475–482. [Google Scholar]
  12. Santander-García, M.; Jones, D.; Alcolea, J.; Bujarrabal, V.; Wesson, R. The ionised and molecular mass of post-common-envelope planetary nebulae. The missing mass problem. Astron. Astrophys. 2022; in press. [Google Scholar] [CrossRef]
  13. Guerrero, M.A.; Miranda, L.F. NGC 6778: A disrupted planetary nebula around a binary central star. Astron. Astrophys. 2012, 539, 47. [Google Scholar] [CrossRef] [Green Version]
  14. Huggins, P.J.; Healy, A.P. CO in planetary nebulae. Astrophys. J. 1989, 346, 201–211. [Google Scholar] [CrossRef]
  15. Huggins, P.J.; Bachiller, R.; Cox, P.; Forveille, T. The molecular envelopes of planetary nebulae. Astron. Astrophys. 1996, 315, 284–302. [Google Scholar]
  16. Huggins, P.J.; Bachiller, R.; Planesas, P.; Forveille, T.; Cox, P. A CO Survey of Young Planetary Nebulae. Astrophys. J. 2005, 160, 272–285. [Google Scholar] [CrossRef] [Green Version]
  17. Guzman-Ramirez, L.; Gómez-Ruíz, A.I.; Boffin, H.M.J.; Jones, D.; Wesson, R.; Zijlstra, A.A.; Smith, C.L.; Nyman, L.A. Opening PANDORA’s box: APEX observations of CO in PNe. Astron. Astrophys. 2018, 618, 91. [Google Scholar] [CrossRef]
  18. Frew, D.J.; Parker, Q.A.; Bojičić, I.S. The Hα surface brightness-radius relation: A robust statistical distance indicator for planetary nebulae. Mon. Not. R. Astron. Soc. 2016, 455, 1459–1488. [Google Scholar] [CrossRef] [Green Version]
  19. Corradi, R.L.; García-Rojas, J.; Jones, D.; Rodríguez-Gil, P. Binarity and the Abundance Discrepancy Problem in Planetary Nebulae. Astrophys. J. 2015, 803, 99. [Google Scholar] [CrossRef]
  20. Brown, A.G.; Vallenari, A.; Prusti, T.; De Bruijne, J.H.J.; Babusiaux, C.; Biermann, M.; Creevey, O.L.; Evans, D.W.; Eyer, L.; Hutton, A.; et al. Gaia Early Data Release 3. Summary of the contents and survey properties. Astron. Astrophys. 2020, 649, 1. [Google Scholar]
  21. Weinberger, R. A catalogue of expansion velocities of galactic planetary nebulae. Astron. Astrophys. Suppl. Ser. 1989, 78, 301–324. [Google Scholar]
  22. Scholz, F.W.; Stephens, M.A. K-Sample Anderson-Darling Tests. J. Am. Stat. Assoc. 1987, 399, 918–924. [Google Scholar]
  23. Iaconi, R.; De Marco, O. Speaking with one voice: Simulations and observations discuss the common envelope α parameter. Mon. Not. R. Astron. Soc. 2019, 450, 2550–2566. [Google Scholar] [CrossRef] [Green Version]
  24. De Marco, O.; Passy, J.C.; Moe, M.; Herwig, F.; Mac Low, M.M.; Paxton, B. On the α formalism for the common envelope interaction. Mon. Not. R. Astron. Soc. 2011, 411, 2277–2292. [Google Scholar] [CrossRef] [Green Version]
  25. Wesson, R.; Jones, D.; García-Rojas, J.; Boffin, H.M.J.; Corradi, R.L.M. Confirmation of the link between central star binarity and extreme abundance discrepancy factors in planetary nebulae. Mon. Not. R. Astron. Soc. 2018, 480, 4589–4613. [Google Scholar] [CrossRef]
  26. Soker, N. Close Stellar Binary Systems by Grazing Envelope Evolution. Astrophys. J. 2015, 800, 114. [Google Scholar] [CrossRef] [Green Version]
  27. Shiber, S.; Kashi, A.; Soker, N. Simulating the onset of grazing envelope evolution of binary stars. Mon. Not. R. Astron. Soc. Lett. 2017, 465, L54–L58. [Google Scholar] [CrossRef] [Green Version]
  28. Santander-García, M.; Jones, D.; Alcolea, J.; Bujarrabal, V.; Gómez-Garrido, M.; Aladro, R.; Verbena, J.L. The neutral atomic mass of post-common-envelope planetary nebulae. 2022; in preparation. [Google Scholar]
  29. Castro-Carrizo, A.; Bujarrabal, V.; Fong, D.; Meixner, M.; Tielens, A.G.G.M.; Latter, W.B.; Barlow, M.J. Low-excitation atomic gas around evolved stars. II. ISO observations of O-rich nebulae. Astron. Astrophys. 2001, 367, 674. [Google Scholar] [CrossRef] [Green Version]
  30. Fong, D.; Meixner, M.; Castro-Carrizo, A.; Bujarrabal, V.; Latter, W.B.; Tielens, A.G.G.M.; Kelly, D.M.; Sutton, E.C. Low-excitation atomic gas around evolved stars. I. ISO observations of C-rich nebulae. Astron. Astrophys. 2001, 367, 652. [Google Scholar] [CrossRef] [Green Version]
Figure 1. Ionised vs. molecular mass of our post-CE PNe sample and the comparison to the ‘regular’ PNe sample. The further to the top and to the right a nebula is, the more massive it is. Dashed lines represent ‘isomasses’, indicating equal ionised+molecular mass; if neutral atomic mass is neglected, individual nebulae run along these lines as their gas content is progressively ionised.
Galaxies 10 00026 g001
Table 1. Computed ionised and molecular masses of the post-CE sample.
PN GCommon NameD M ion M mol
(kpc)(M )(M )
Single-Degenerate post-CE PNe
G034.5-06.7NGC 67782.79 ± 0.790.19 0.10 + 0.14 0.02 ± 0.02
G036.1-57.1NGC 72930.200 ± 0.0020.09 0.05 + 0.13 0.3 ± 0.2
G053.8-03.0Abell 632.703 ± 0.2190.012 0.009 + 0.04 <0.006
G054.2-03.4Necklace4.6 ± 1.10.009 0.006 + 0.017 <0.007
G068.1+11.1ETHOS 14.2 ± 0.00.008 0.008 + 0.3 <0.007
G086.9-03.4Ou 55.0 ± 1.00.18 0.12 + 0.4 <0.012
G118.8-74.7NGC 2460.556 ± 0.0250.07 0.05 + 0.12 <0.02
G208.5+33.2Abell 302.222 ± 0.1480.015 0.009 + 0.02 <0.20
G215.6+03.6NGC 23461.389 ± 0.0390.09 0.04 + 0.09 0.7 ± 0.5
G221.8-04.2PM 1-235.2 ± 2.00.015 0.014 + 1.2 <0.17
G307.5-04.9MyCn 184.000 ± 1.2800.07 0.04 + 0.10 <0.06
G338.1-08.3NGC 63265.000 ± 1.5000.6 0.3 + 0.5 <0.06
G338.8+05.6Hen 2-1554.348 ± 1.3230.3 0.14 + 0.2 <0.10
G342.5-14.3Sp 32.22 0.48 + 0.61 0.09 0.04 + 0.08 <0.06
G349.3-04.2Lo 161.818 ± 0.1320.4 0.3 + 0.7 <0.013
Double-Degenerate post-CE PNe
G009.6+10.5Abell 414.89 ± 1.40.16 0.09 + 0.15 <0.011
G049.4+02.4Hen 2-4284.545 ± 1.4460.7 0.4 + 0.8 <0.010
G058.6-03.6V458 Vul12.5 ± 2.00.11 0.07 + 0.19 <0.08
G197.8+17.3NGC 23921.818 ± 0.1650.4 0.19 + 0.4 <0.09
G290.5+07.9Fg 12.564 ± 0.1970.4 0.15 + 0.2 <0.09
G307.2-03.4NGC 51891.471 ± 0.0430.11 0.03 + 0.03 <0.09
Publisher’s Note: MDPI stays neutral with regard to jurisdictional claims in published maps and institutional affiliations.

