Article

Pharmacogenetic Variants Associated with Fluoxetine Pharmacokinetics from a Bioequivalence Study in Healthy Subjects

by
Carlos Alejandro Díaz-Tufinio
1,2,
José Antonio Palma-Aguirre
2 and
Vanessa Gonzalez-Covarrubias
3,*
1
Tecnologico de Monterrey, School of Engineering and Sciences, Mexico City 14380, Mexico
2
Axis Clinicals Latina, Mexico City 07870, Mexico
3
Laboratorio de Farmacogenomica, Instituto Nacional de Medicina Genomica (INMEGEN), Mexico City 14610, Mexico
*
Author to whom correspondence should be addressed.
J. Pers. Med. 2023, 13(9), 1352; https://doi.org/10.3390/jpm13091352
Submission received: 26 July 2023 / Revised: 17 August 2023 / Accepted: 19 August 2023 / Published: 1 September 2023
(This article belongs to the Special Issue Pharmacogenetics and Pharmacogenomics in Personalized Medicine)

Abstract

:
Fluoxetine is one of the most prescribed antidepressants, yet it still faces challenges due to high intersubject variability in patient response. Mainly metabolized by the highly polymorphic gene CYP2D6, important differences in plasma concentrations after the same doses are found among individuals. This study investigated the association of fluoxetine pharmacokinetics (PK) with pharmacogenetic variants. A bioequivalence crossover trial (two sequences, two periods) was conducted with fluoxetine 20 mg capsules, in 24 healthy subjects. Blood samples for fluoxetine determination were collected up to 72 h post-dose. Subjects were genotyped and single nucleotide variants (SNV) were selected using a candidate gene approach, and then associated with the PK parameters. Bioequivalence was confirmed for the test formulation. We found 34 SNV on 10 genes with a quantifiable impact on the PK of fluoxetine in the randomized controlled trial. Out of those, 29 SNVs belong to 7 CYPs (CYP1A2, CYP2B6, CYP2C9, CYP2C19, CYP2D6, CYP3A4, CYP3A5), and 5 SNVs to 3 genes impacting the pharmacodynamics and efficacy of fluoxetine (SLC6A4, TPH1, ABCB1). Moreover, decreased/no function SNVs of CYP2D6 (rs1065852, rs28371703, rs1135840) and CYP2C19 (rs12769205) were confirmed phenotypically. Our research contributes to deepening the catalog of genotype-phenotype associations in pharmacokinetics, aiming to increase pharmacogenomics knowledge for rational treatment schemes of antidepressants.

1. Introduction

Depression is a common mental disorder, with 5.0% of adults affected worldwide and 5.7% among the elderly [1]. “Depression” references in scientific documents have increased exponentially since 1950, and documents mentioning “selective serotonin reuptake inhibitors (SSRIs)” have increased at a rate of approximately 41 per year in the past 40 years [2], being the most common therapeutic class for its treatment in early ages [3].
Fluoxetine is one of the SSRI-class antidepressants, with oral formulations ranging from 20 mg to 90 mg. Its metabolism is mainly performed in the liver by the highly polymorphic CYP2D6. The contribution from other CYPs, such as CYP2C19, CYP2C9, and CYP3A4, is relevant in subjects with chronic exposure to fluoxetine since the drug inhibits its metabolism [4]. The pharmacogenomics of antidepressants is of interest given 48% therapeutic failures, 40% remission rate, and 25% frequency of adverse events [3,5]. Understanding the pharmacokinetic and pharmacodynamic genes’ contribution to SSRI function is currently an active research area, with above 900 studies reported [3]. Some of these studies have found solid clinical evidence, enough to generate regulatory guidance for pharmacogenomic testing for treatment selection and dose adjustments, such as those of the Food and Drugs Administration (FDA) and European Medicines Agency (EMA).
International pharmacogenomics groups, such as the Clinical Pharmacogenetics Implementation Consortium (CPIC), have developed recommendations and calculator tools to predict the phenotype of actionable genes for CYP2D6 and CYP2C19, main cytochromes on the metabolism of antidepressants [6,7]. These tools, together with clinical evidence, allow clinicians to improve the therapeutics of antidepressants. Nevertheless, details and validation across different populations are advisable to strengthen the clinical evidence.
Bioequivalence trials can ensure quality to speed up the registration of generic medications by several regulatory agencies across the world, such as the FDA, EMA, and the Mexican regulatory agency, COFEPRIS [8]. In these studies, pharmacokinetic (PK) profiles are evaluated between test and reference formulations to compare their bioavailability, i.e., to test whether the geometric ratios of the PK parameters are—unless otherwise stated—inside an 80–125% confidence interval. Since two-sequence two-period two-formulation crossover trials are the most convenient designs for bioequivalence evaluation, intrasubject (within-subject) variability is required to estimate a sufficient sample size for assessing the confidence intervals with targeted error and statistical power.
In the world, there are 394 protocols reported in clinicaltrials.gov with the active principle fluoxetine, ranging from phase 1 to 4, 12 of them PK or bioequivalence studies [9]. In the Mexican National Registry of Clinical Trials (RNEC), there are 15 protocols registered with this drug [10]. Of those, 13 are bioequivalence/comparative bioavailability studies, the 20 mg capsule formulation being the most frequently studied. These studies, overall, had a crossover two-sequence two-period design, with a sample size ranging from 24 to 36 subjects.
In this work, we report a clinical trial with fluoxetine 20 mg capsules performed in 24 healthy Mexican volunteers, where the pharmacokinetics was evaluated in a crossover randomized study, exploring relationships with the genotype of the participants. We aimed to test bioequivalence between two fluoxetine formulations, and to associate the genotype of participant subjects with the metabolizing phenotypes (pharmacokinetics) of fluoxetine, quantifying the potential impact of selected CYPs in the metabolism of fluoxetine. So, the bioequivalence evaluation was independent from the pharmacogenetic analyses performed for exploratory purposes.

2. Methods

2.1. Bioequivalence Clinical Trial

The clinical trial was a randomized controlled, open-label, crossover 2 × 2 (two-sequences, two-periods) design, with a single administration per period in fasting conditions in healthy subjects. Products administered were fluoxetine hydrochloride 20 mg capsules, Apotex, Inc. Toronto, ON, Canada (test product), and Prozac® 20, Eli Lilly and Company (reference product). Blood sampling was performed up to 72 h after drug administration, with an 8-week washout between periods.
The sample size for the bioequivalence trial was based on an expected intrasubject variation of 18% for fluoxetine PK parameters [11], α of 0.05, and a power of 90% (β of 0.10), with 80–125% acceptance limits for the 90% confidence intervals, evaluated with Schuirmann’s two one-sided t-tests (TOST), in compliance with standard bioequivalence analysis methodology and national regulation [8,12]. This calculation resulted in a minimum sample size of 22 + 4 subjects due to potential dropouts.
Inclusion criteria were age from 18 to 55 years, body mass index (BMI) between 18 and 27 kg/m2, and clinical examination and laboratory data within normal ranges. Exclusion criteria were pregnancy or lactation; history of alcoholism, drug abuse, or heavy smoking; documented hypersensitivity to the study drug or to any drug in the same therapeutic group; receiving any medication within less than 14 days (or 7 half-lives) of the study starting date; subjects who had donated blood or had more than 450 mL of blood withdrawn 60 days before the study starting; history or evidence of medical conditions including, but not limited to, gastrointestinal, renal, hepatic, cardiovascular, and endocrine diseases; and consumption of grapefruit juice and/or xanthine-containing beverages, such as coffee, tea, chocolate, cola soft drinks, etc., 10 h before the study start-up.
The study was conducted in a bioequivalence laboratory facility in Mexico City, Axis Clinicals Latina, authorized as a clinical and bioanalytical unit for bioavailability and bioequivalence studies according to national requirements [8]. The clinical trial protocol was reviewed by an institutional review board (IRB) authorized by COFEPRIS and the National Commission of Bioethics (CONBIOETICA); then the protocol was submitted to the federal agency COFEPRIS for its approval.
All participant volunteers met the inclusion criteria and signed written informed consent. The study was conducted under NOM-177-SSA1-2013 [8], Good Clinical Practices (GCPs) [13], International Council for Harmonisation of Technical Requirements for Pharmaceuticals for Human Use (ICH) Guidelines [14], and followed the statutes of the Declaration of Helsinki and its amendments [15].

2.2. Plasma Fluoxetine Determination

The blood samples were collected in sodium heparin tubes at 0.0, 1.0, 2.0, 3.0, 4.0, 5.0, 6.0, 7.0, 8.0, 9.0, 10.0, 12.0, 24.0, 48.0, and 72.0 h post-dose. Once collected, samples were centrifuged at 3500 rpm for 10 min between 2 and 15 °C to separate plasma. Plasma was pipetted into labeled cryogenic tubes for fluoxetine determination. Liquid–liquid extraction and high-performance liquid chromatography coupled to mass/mass spectrometry (LC-MS/MS) with reverse phase column (Gemini, C18, 50 × 4.6 mm, 5 µm) was performed for fluoxetine quantification. Chromatographic conditions were 3 min run at 35 °C, with acetonitrile/ammonium formate 2 mM pH 3.5 (90:10 v/v) mobile phase, in turbo-electro spray ionization (ESI+) positive mode with multiple reaction monitoring (MRM), using paroxetine as internal standard.

2.3. Genetic and Pharmacogenomic Analyses

These analyses were funded and performed at the National Institute for Genomic Medicine (INMEGEN), with microarrays purchased from Código 46. The white blood cells’ buffy coat was pooled into a cryotube for DNA extraction for each subject, using Puregene blood kit (QIAGEN®), from 3 to 4 blood samples collected for PK to avoid low concentration of genetic material or poor quality. Quantity and quality were verified with spectrophotometry and agarose gel electrophoresis. Genotyping was performed using the Infinium® Global Screening Array (GSA) 24 v1.0 microarray, including 600,000 variants with more than 22,000 customized clinically relevant genetic variants related to drug response [16].

2.4. Pharmacokinetics and Statistical Analysis

After fluoxetine determination, the formulation administered in each period for each subject was decoded according to the study randomization. Blood sampling actual times were calculated based on time deviations reported to the planned nominal sampling times. Observed plasma profiles vs. actual times were plotted and their PK parameters were calculated using non-compartmental analysis (NCA) in Phoenix® WinNonlin® version 8.1 [17]. PK parameters included maximum drug concentration (Cmax), time to Cmax (tmax), area under the curve from pre-dose to last sampling time (AUC0–t), AUC from pre-dose extrapolated to infinite (AUC0–∞), elimination parameters such as elimination constant (Kel), half-life time (t1/2), and apparent distribution volume (Vd).
Statistical analysis for bioequivalence assessment was performed using Schuirmann’s two one-sided t-test (TOST) for test/reference geometric means ratios of Cmax and AUC, applying the conventional acceptance criteria of 80–125% [12]. Its 90% confidence intervals were calculated following NOM-177-SSA1-2013 regulation. Outlier analysis was performed to identify subjects with extreme values, based on the studentized intrasubject residuals using bear package, BE/BA for R [18]. Analysis of variance (ANOVA) with a general linear model (GLM) for bioequivalence crossover studies was performed [12] to evaluate period, sequence, and formulation effects.

2.5. Genotyping and Genotype-Phenotype Association

The pharmacogenetic analyses were performed for scientific research purposes, since bioequivalence was assessed for all the subjects who completed the clinical study, as described in the previous section in accordance with the national regulation [8]. Analysis of the genomic data was carried out with Illumina® GenomeStudio 2.0 software, performing quality control, normalization, and allelic discrimination of the variants of the 24 volunteers who concluded the bioequivalence study. Individual fluoxetine PK parameters were used as phenotypic variables. Multivariate association models were generated from data in plain text files with genetic information (.map and .ped), demographic variables (gender, age, weight, height, and BMI), and PK data (Cmax, AUC0–t, AUC0–∞, tmax, t1/2), using gPLINK vs2.050. Supporting analyses were performed with IBM SPSS® 25 [19] and Phoenix® WinNonlin® v.8.1, for the identification of the relevant genetic variants and their association with fluoxetine PK [20,21].

3. Results

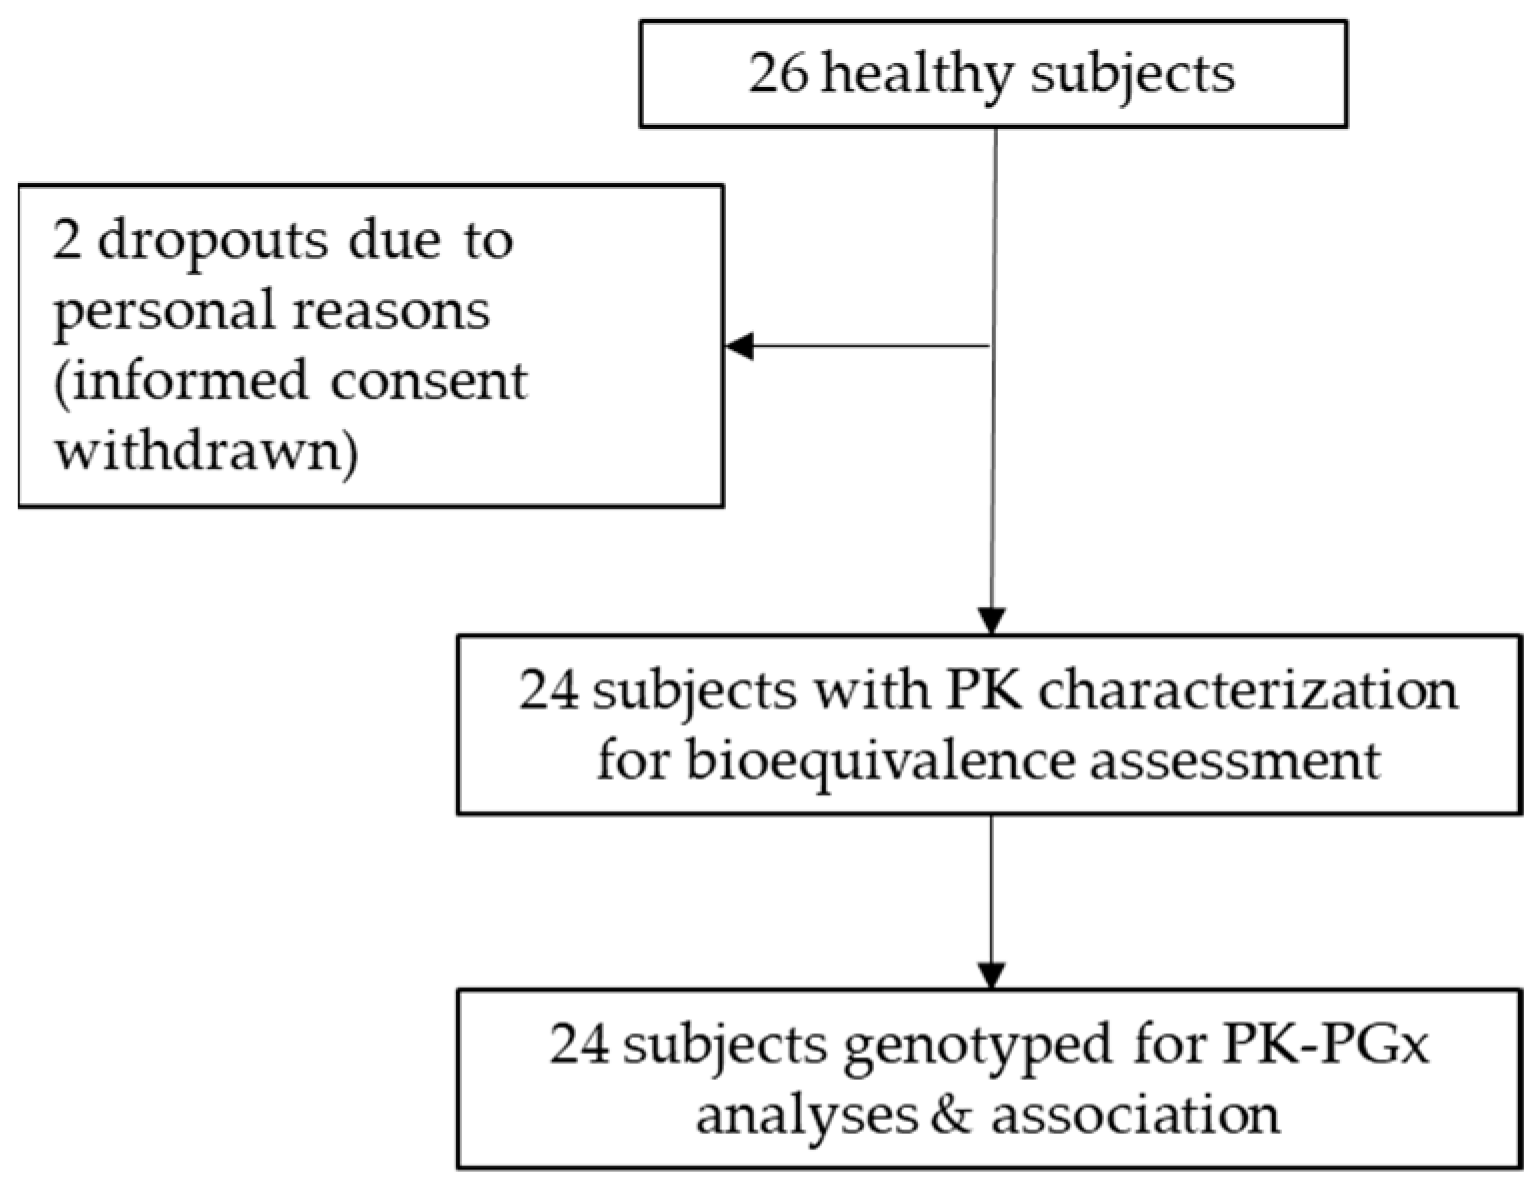
3.1. Bioequivalence Clinical Trial

Twenty-six healthy Mexican subjects were recruited, assessed as healthy by physical examination and blood test, and started the study. All enrolled volunteers were tested for abuse drugs and alcohol consumption before being checked into each of the study periods. Twenty-four of them completed the study because two subjects (ID numbers 6 and 21) dropped out due to personal decisions and withdrew their informed consent (Figure 1). Demographic characteristics of the 24 subjects, 20 males and 4 females, were 33.0 ± 11.1 years old (mean ± SD), ranging from 19 to 50 years. Height was 1.65 ± 0.09 m, weight 64.8 ± 9.1 kg, and BMI 23.8 ± 2.1 kg/m2. Between genders, there was no difference in age (p = 0.855) and BMI (p = 0.157), although differences in weight and height were found (p < 0.000). Among these four demographic variables (age, BMI, height, and weight), we found significant correlations between age and BMI, age and weight, BMI and weight, and height and weight (p < 0.05).
A total of six adverse events in five subjects were reported, from which five events occurred under reference product dosing and one with the test product dosing. All adverse events were assessed as mild or moderate in severity. Four were classified as probably related to the drug due to occurrence around fluoxetine tmax (dizziness, headache, sore throat, and pharyngitis). The other two adverse events were not related to the study drug (lumbar pain at the discharge of period 1 and headache at period 2 check-in).

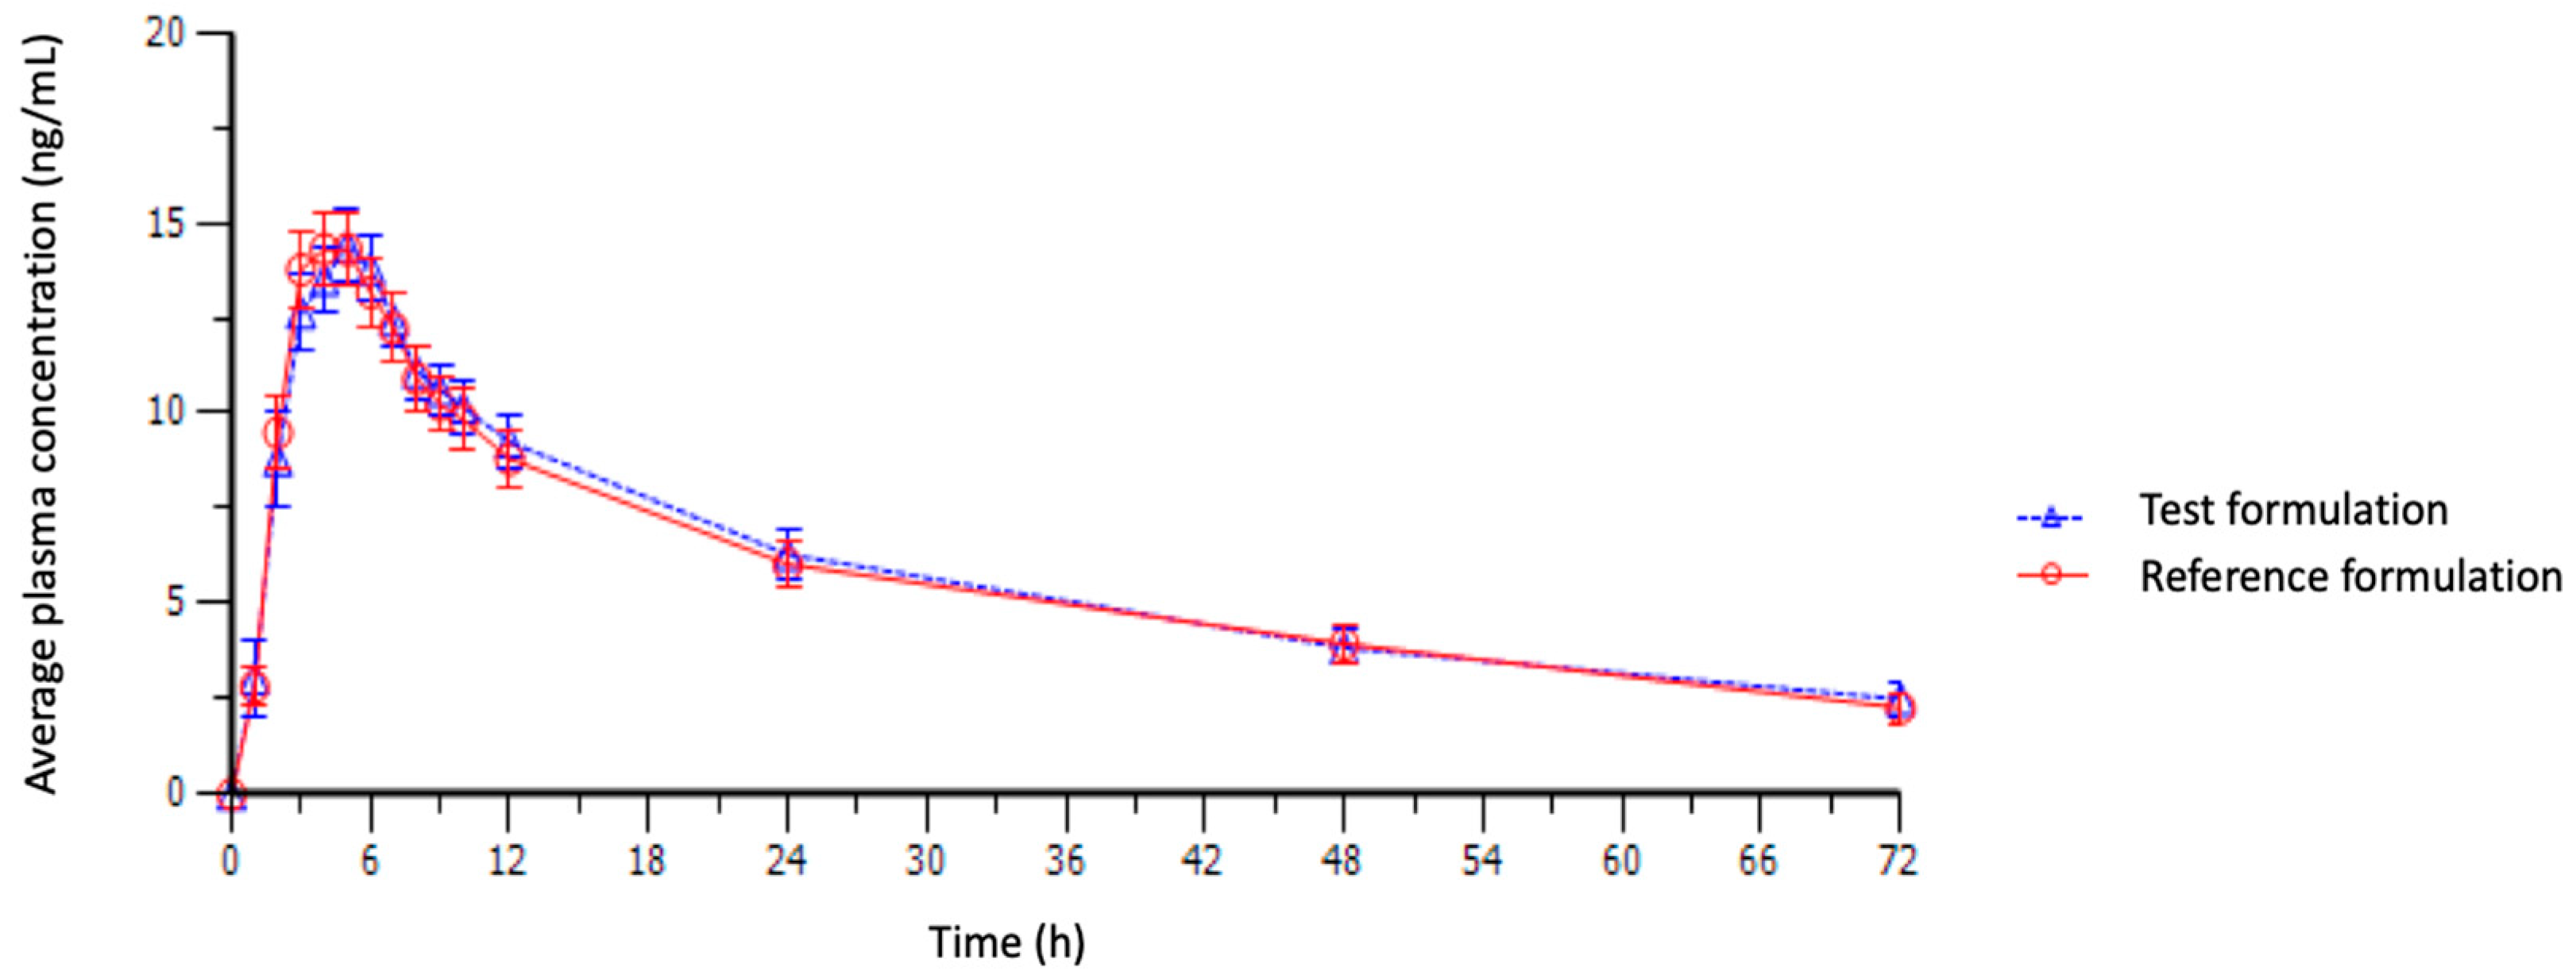
3.2. Plasma Fluoxetine Determination

The bioanalytical methodology for fluoxetine quantification was validated under the national regulatory agency criteria applicable to bioequivalence trials [8]. Validation parameters included accuracy, repeatability, reproducibility, robustness, selectivity, recovery, and stability, analyzed for both analyte (fluoxetine) and internal standard (paroxetine). The calibration curve of fluoxetine had a concentration range of 0.200–49.169 ng/mL (r = 0.99984), with low, medium, and high control samples at 0.598, 20.467, and 37.513 ng/mL. The coefficients of variation of the validation parameters were calculated within the acceptable regulatory values, all below 15%. The selectivity of the method was evaluated with common drugs, such as salicylic acid, metamizole, ketorolac, paracetamol, and ondansetron, demonstrating no interference with the analyte of interest.

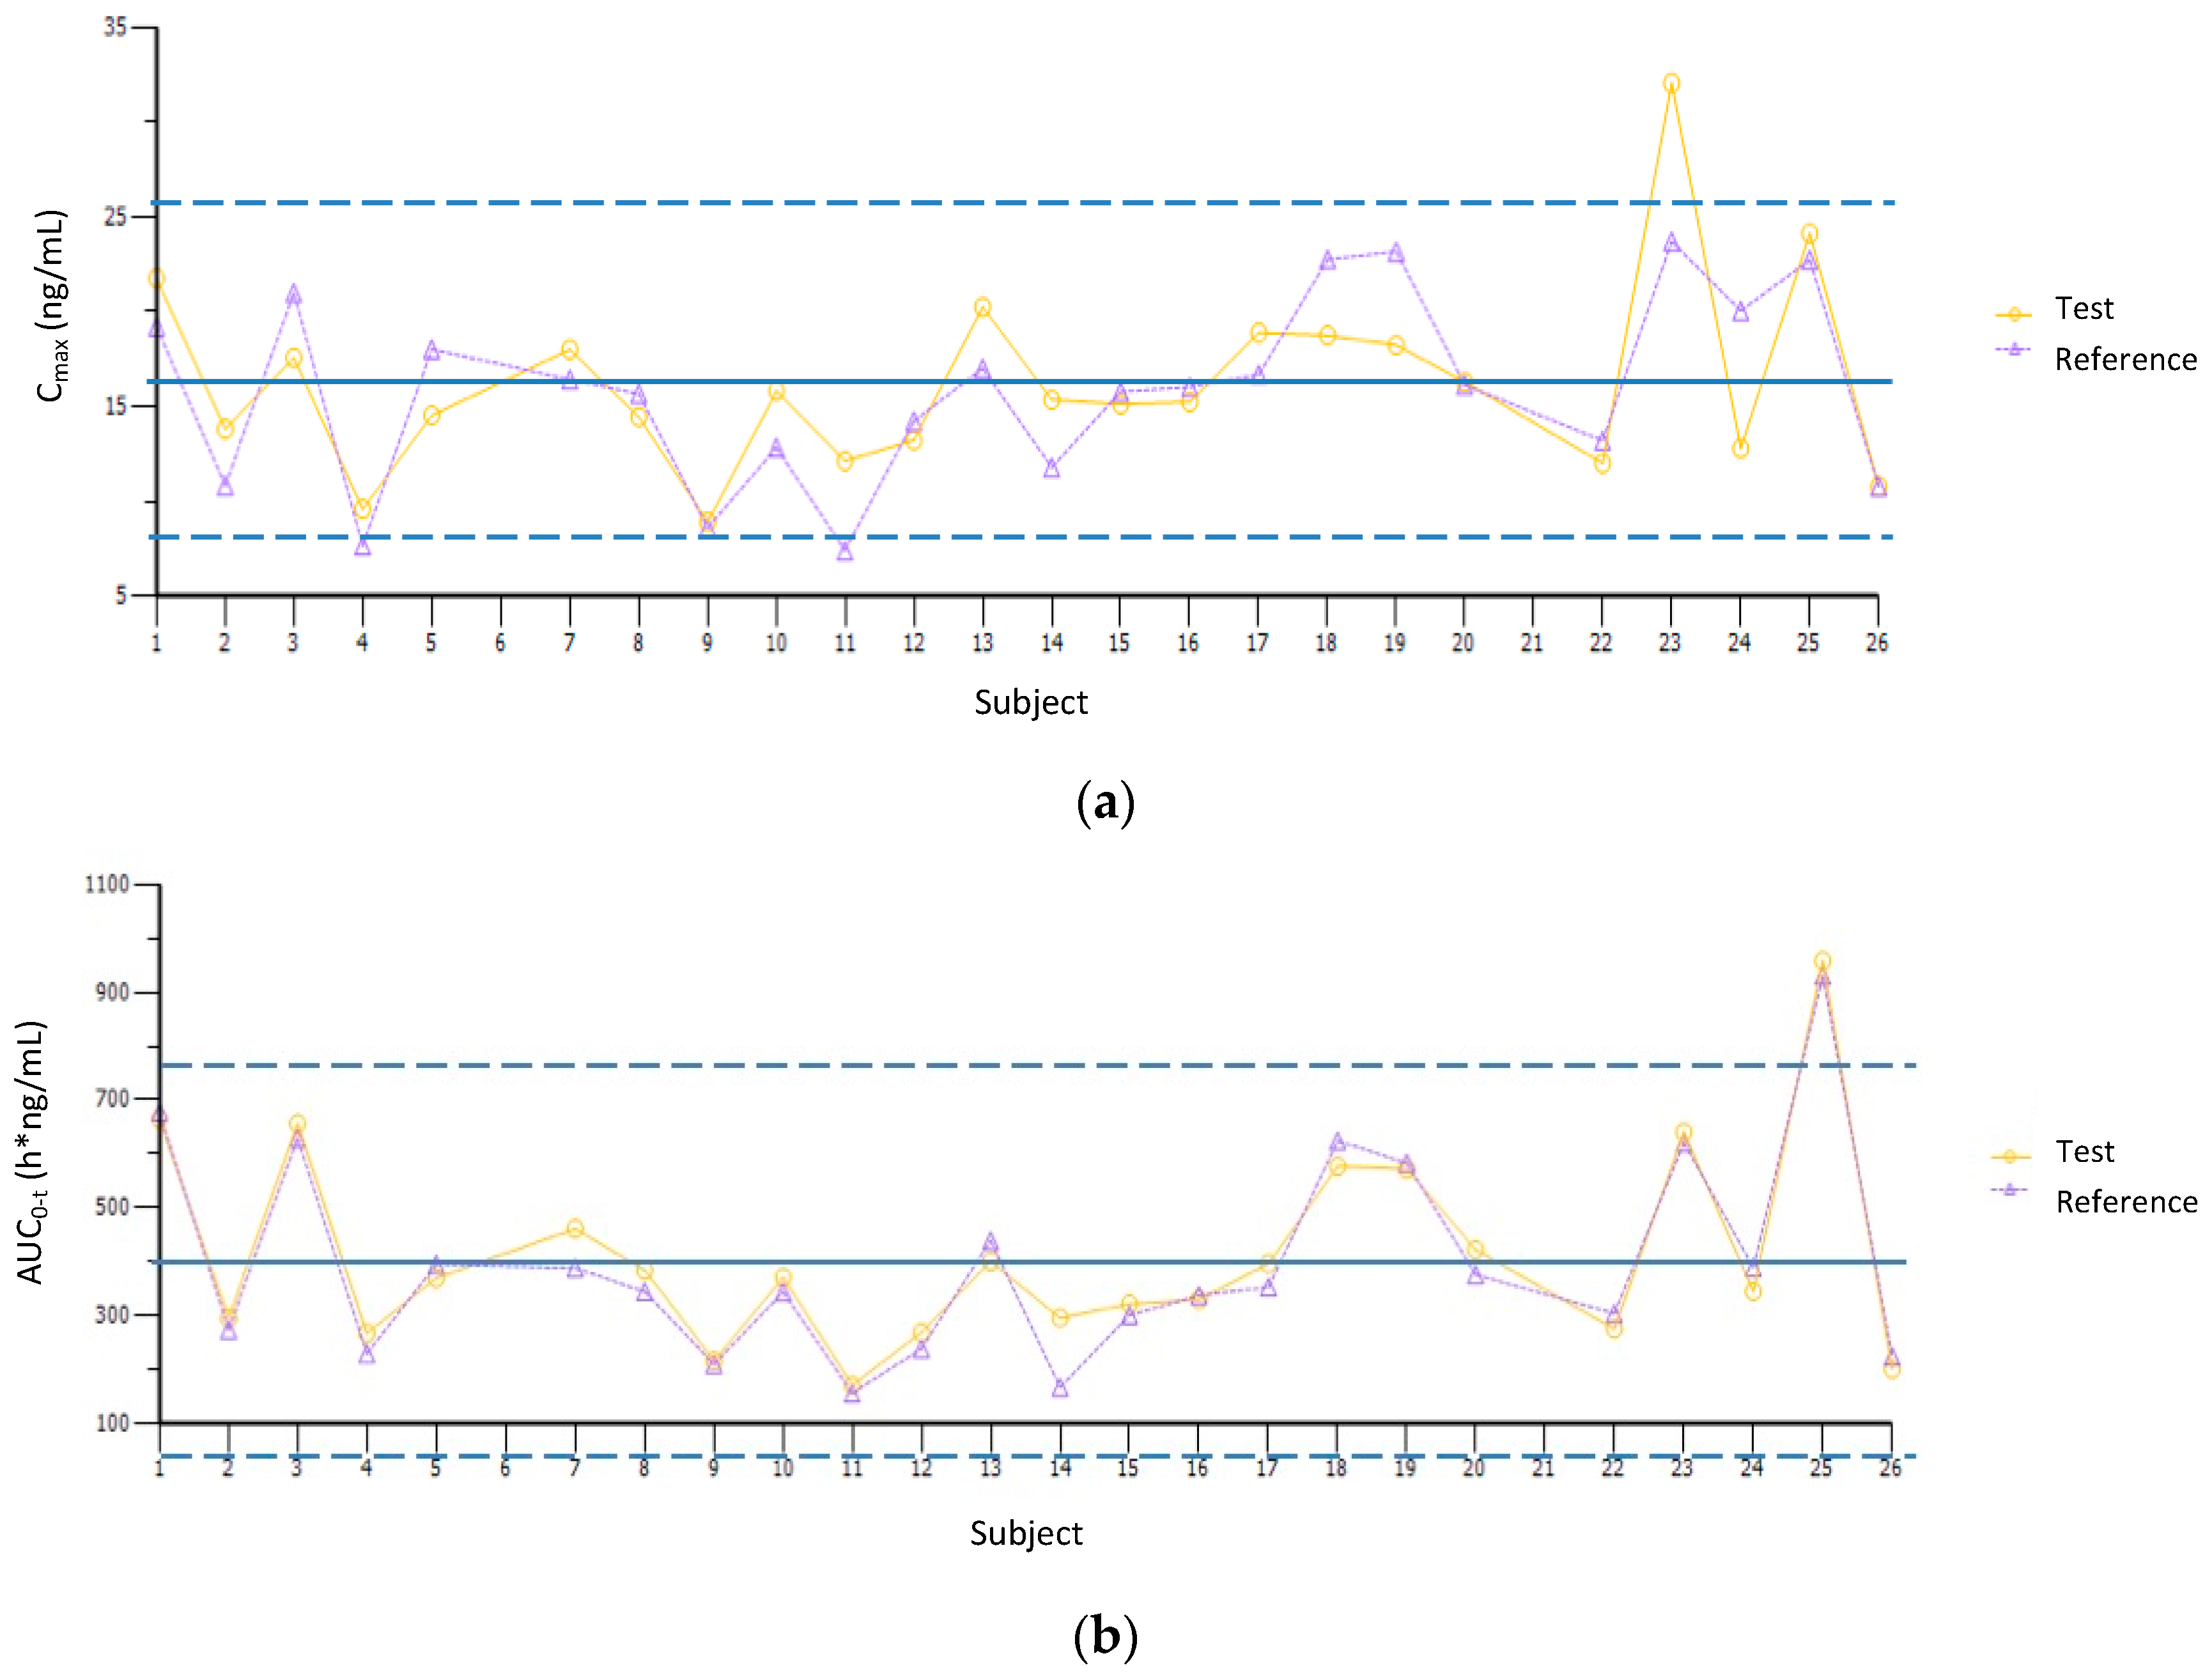
3.3. Pharmacokinetic Parameters and Bioequivalence Testing

The average pharmacokinetic profile for each product is shown in Figure 2. In the PK analysis of fluoxetine (Table 1), comparing test and reference products, the mean tmax was 4.42 h and 4.25 h (p = 0.75), while mean Cmax was 16.25 ng/mL and 15.92 ng/mL (p = 0.63). Half-life t1/2 was 30.71 h and 31.32 h (p = 0.42). The averages of AUC0–t and AUC0–∞ were not statistically different (p = 0.64, p = 0.56), nor were Vd and Cl elimination parameters (p = 0.26, p = 0.34).
Bioequivalence statistical assessment was performed with the PK data of the 24 volunteers who completed the study (Table 2), confirming bioequivalence between test and reference products, since the 90% confidence intervals of the PK parameters (Cmax, AUC0–t, and AUC0–∞) were within the 80–125% limits. No statistically significant effects of sequence (p > 0.42), period (p > 0.12), and formulation (p > 0.08) were found in the ANOVA.
Four subjects (IDs 7, 11, 14, and 24) were identified to have extreme values in the PK parameters, based on ±2 studentized intrasubject (within-subject) residual criteria. Regarding intersubject (between-subject) variability, four volunteers had Cmax values close to or above ±2 S.D. (IDs 4, 9, 11, and 23), as well as two subjects in the AUC parameters (subjects 11 and 25) (Figure 3). Phenotypically, 33% of the 24 subjects who concluded the bioequivalence study (IDs 4, 7, 9, 11, 14, 23, 24 and 25) were of interest given their high intra- and/or intersubject variability on fluoxetine PK parameters.
Mean PK profiles were different between male and female subjects, the PK parameters Cmax (p < 0.000), AUC0–t (p < 0.002), Vd (p < 0.001), and Cl (p < 0.006) being statistically different between genders. It is important to notice that the female population is underrepresented in this study due to recruitment, so gender differences should be taken as rough evidence. After analyzing the PK parameters (Cmax, AUC0–t, AUC0–∞, tmax, and t1/2) with demographic variables, significant correlations (p < 0.05) were found between age and Cmax, weight and Cmax, weight and AUC0–t, height and Cmax, and height and AUC0–t. No statistically significant correlation (p > 0.146) was obtained for BMI vs. any of the PK parameters. Correlation coefficients for all explored variables are shown in Table 3. Variables with the strongest correlation, Cmax vs. weight, are plotted in Figure 4, showing a negative trend for both genders and overall.

3.4. Pharmacogenomic Analyses

The 24 subjects that completed the study were genotyped. All studied single nucleotide variants (SNV) had a call rate > 0.99 and p10GC (gene call 10th percentile) > 0.30. Using a candidate gene approach [22], we selected SNVs of enzymes implicated in drug metabolism, especially those known to be involved in the metabolism of fluoxetine. A total of 423 potential variants of eight initial cytochromes of interest were investigated in PharmGKB (CYP1A2, CYP2B6, CYP2C8, CYP2C9, CYP2C19, CYP2D6, CYP3A4, and CYP3A5). From those, we found 169 coincidences in the customized microarray using a script developed in R and these were manually revised for duplicate removal. In total, 39 variants of 8 CYPs were studied: 5 for CYP1A2, 9 for CYP2B6, 1 for CYP2C8, 5 for CYP2C9, 6 for CYP2C19, 7 for CYP2D6, 5 for CYP3A4, and 1 for CYP3A5. Additionally, 15 pharmacodynamic and antidepressant response variants were explored in 4 genes: 3 for ABCB1, 3 for SLC6A4, 2 for TPH1, and 7 for COMT. Table 4 summarizes the genes and SNVs with clinical annotations and evidence levels available in the current literature [23,24].
Based on the sample of Mexican subjects participating in this trial, the minor allele frequencies (MAF) were similar to data reported for different populations in most of the SNVs studied. Excluding the SNV with MAF = 0% in our study, the following SNVs showed a difference greater than 10% with respect to the calculated populations’ mean (Table 5): ABCB1 rs2032582: 43% higher; CYP1A2 rs2069514: 20% higher, similar to Latino/admixed American (AMR) frequency; CYP2B6 rs4802101: 16% lower; CYP2D6 rs108098: 13% higher, similar to AMR frequency.

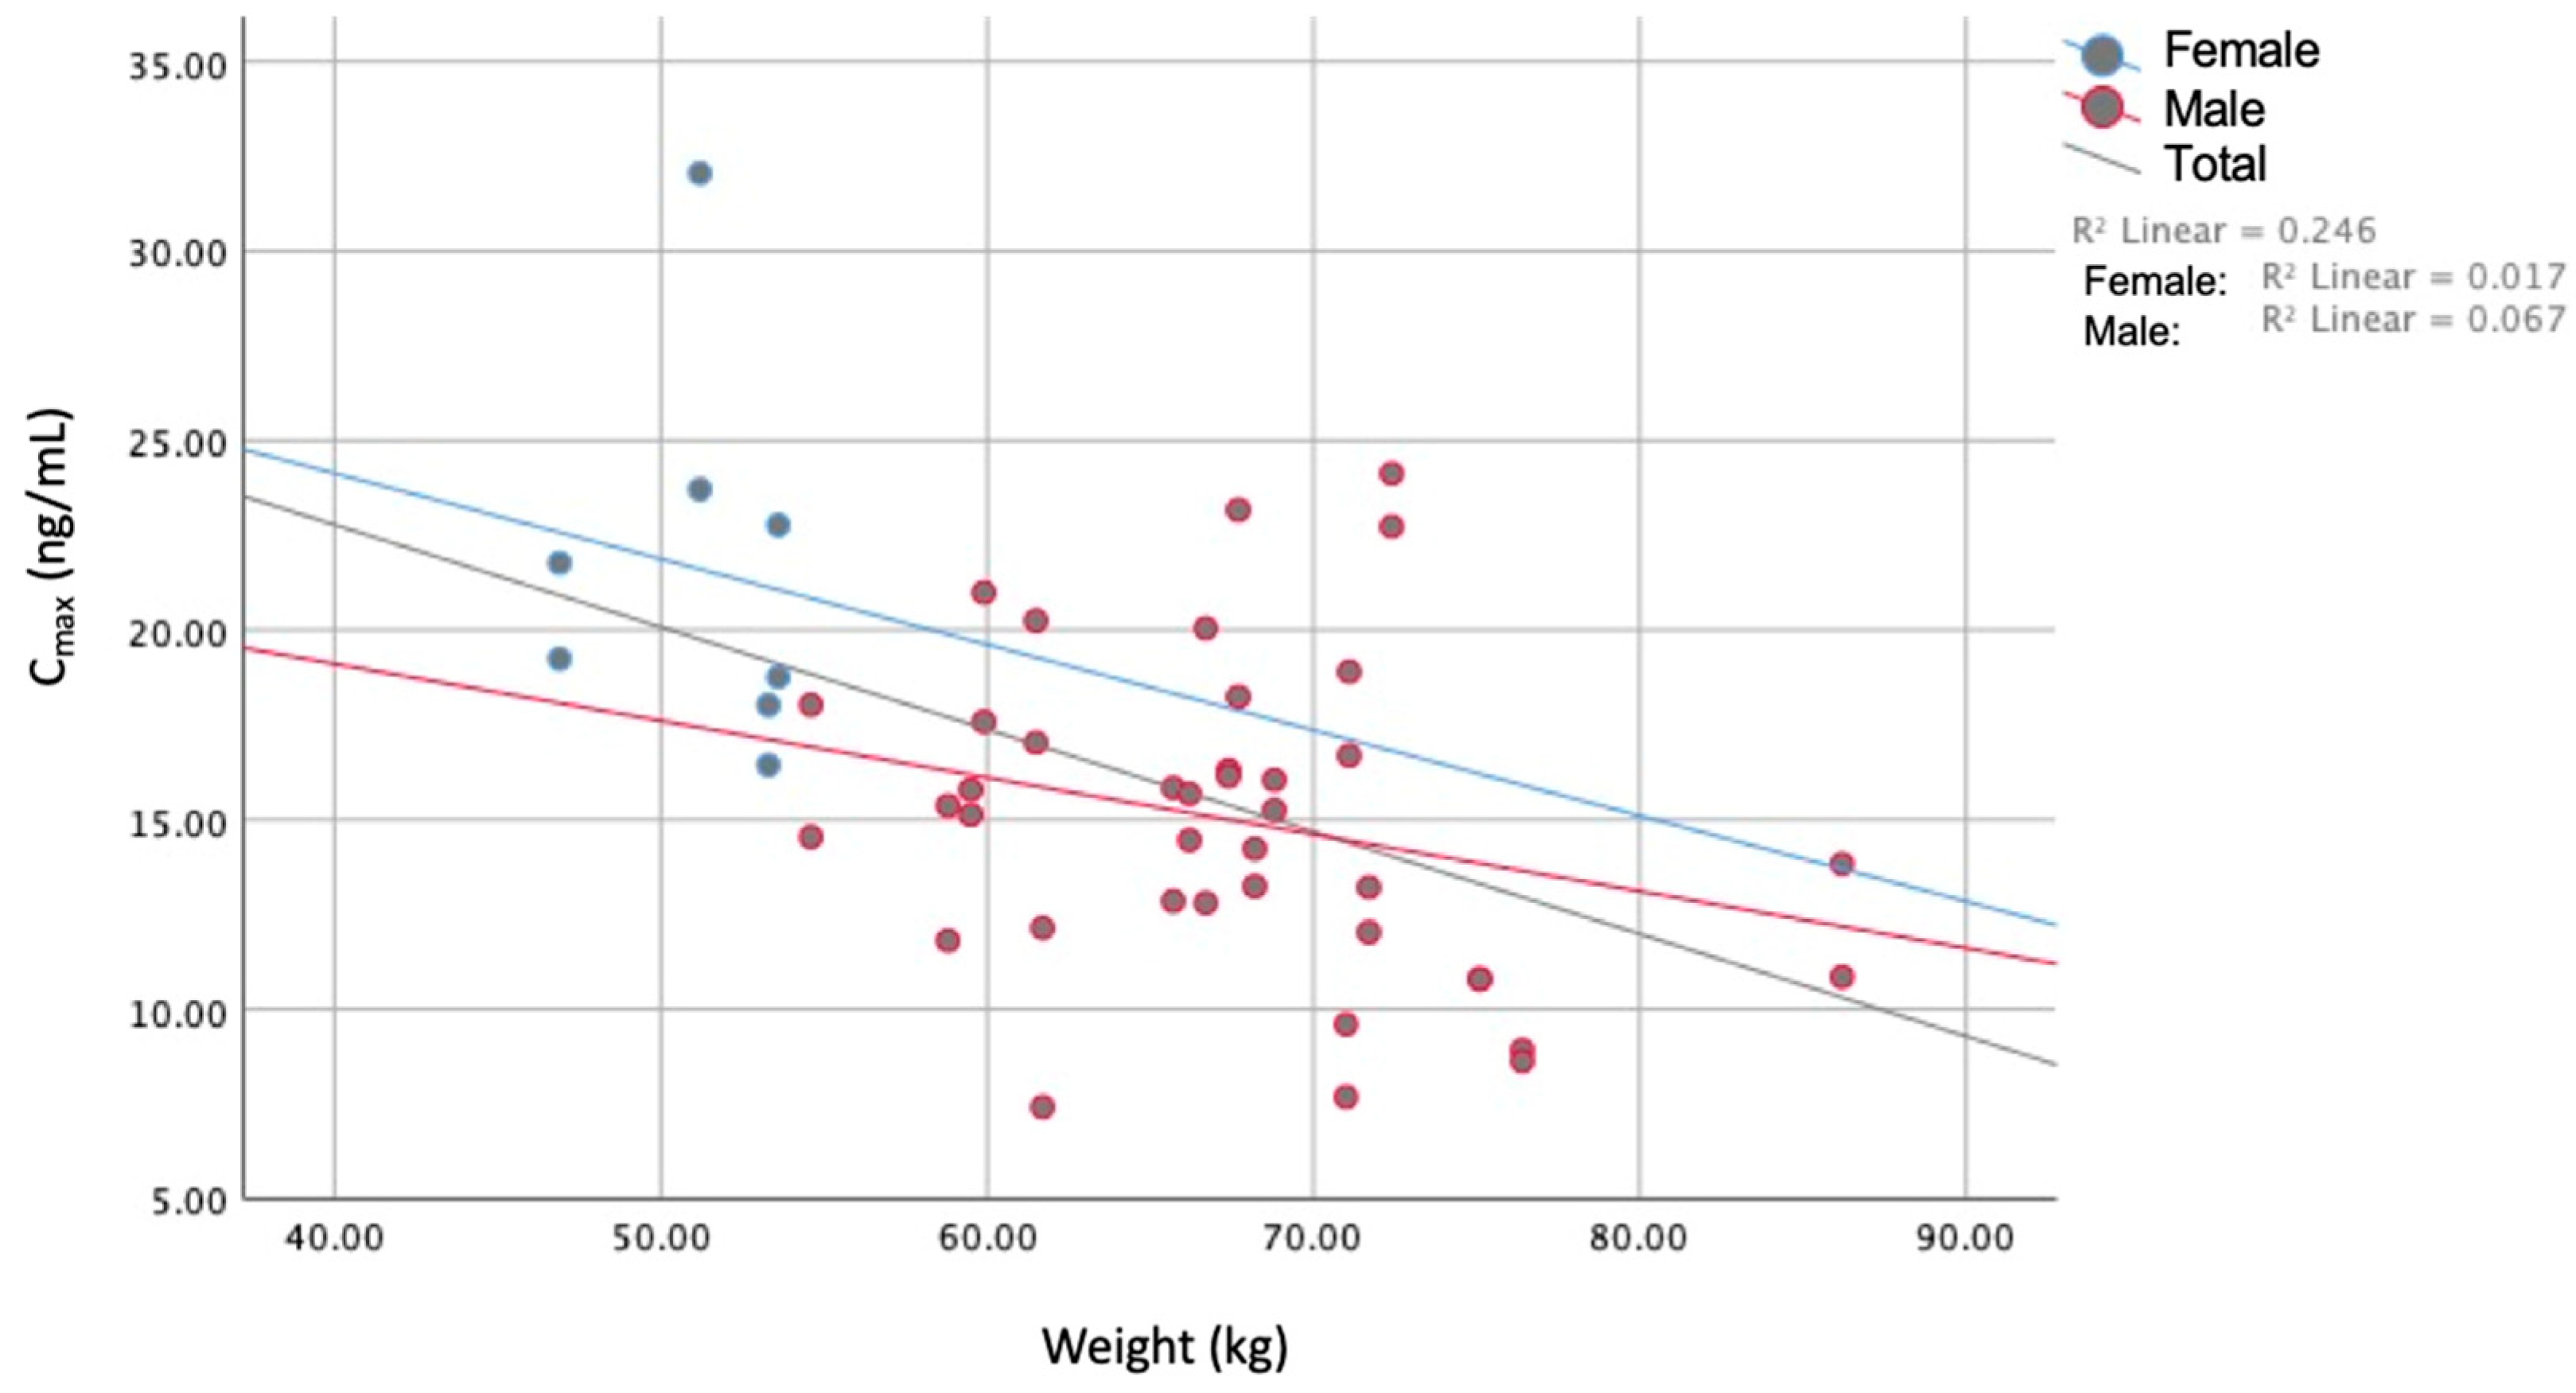
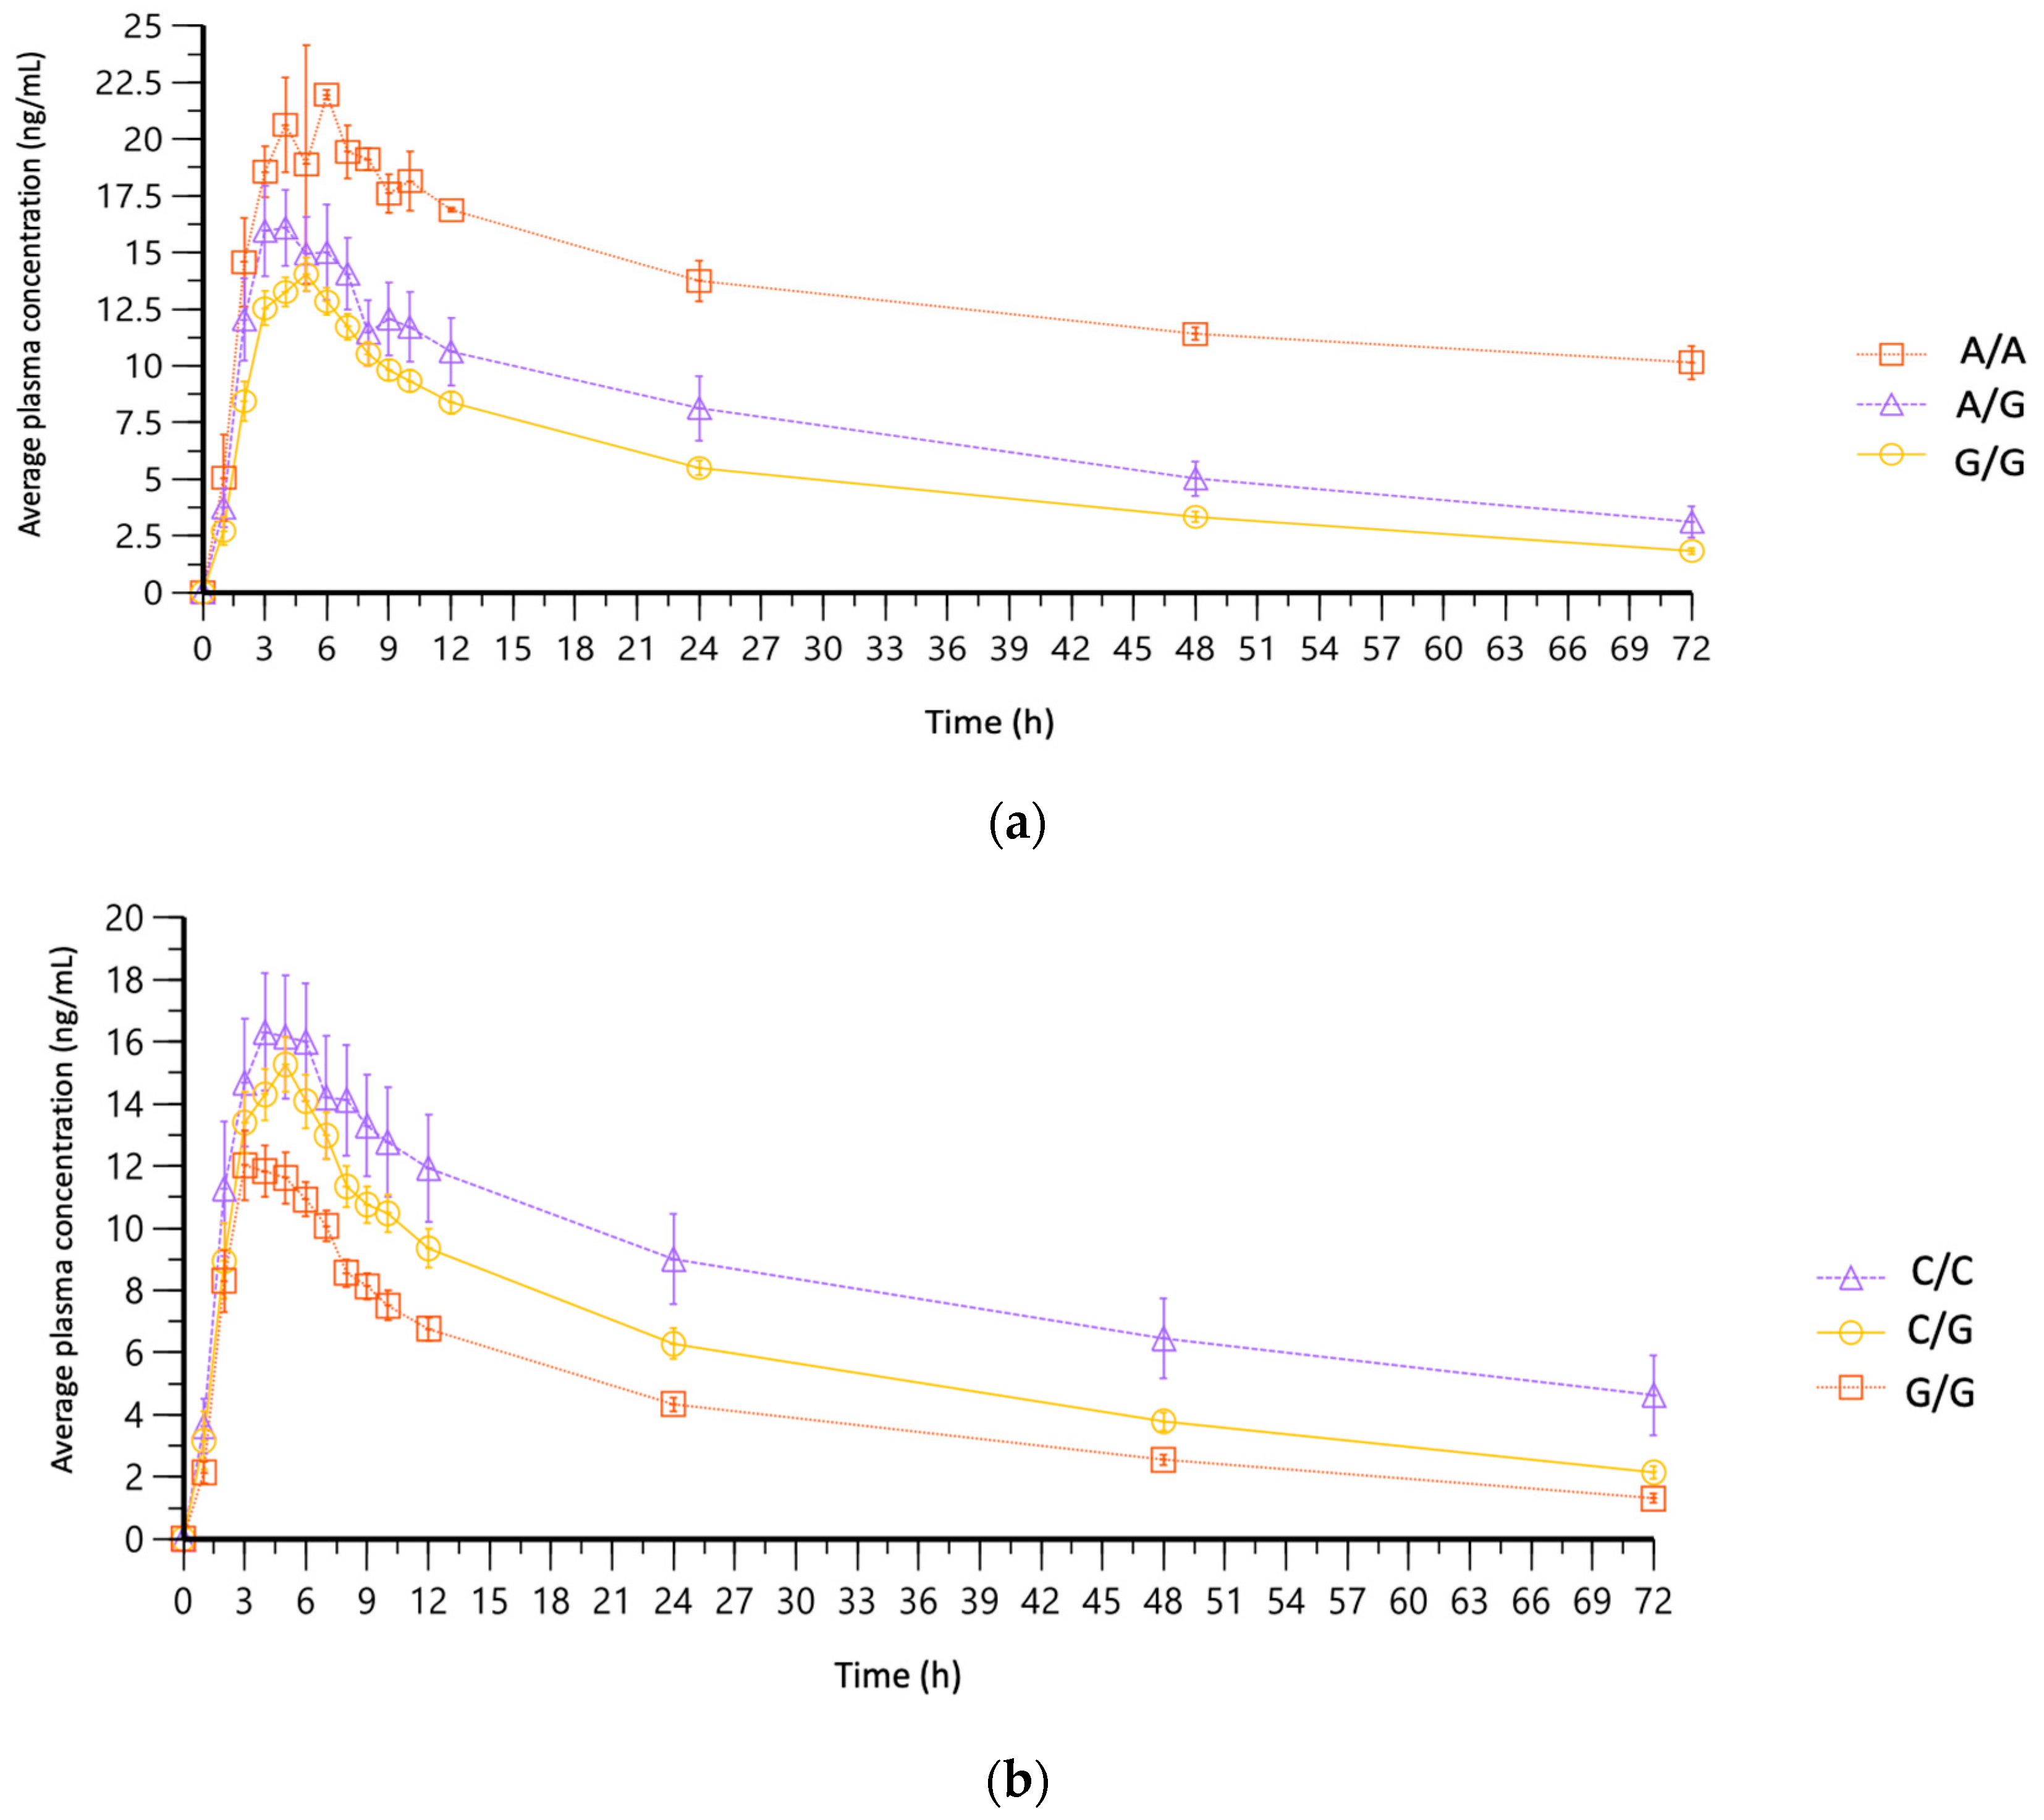
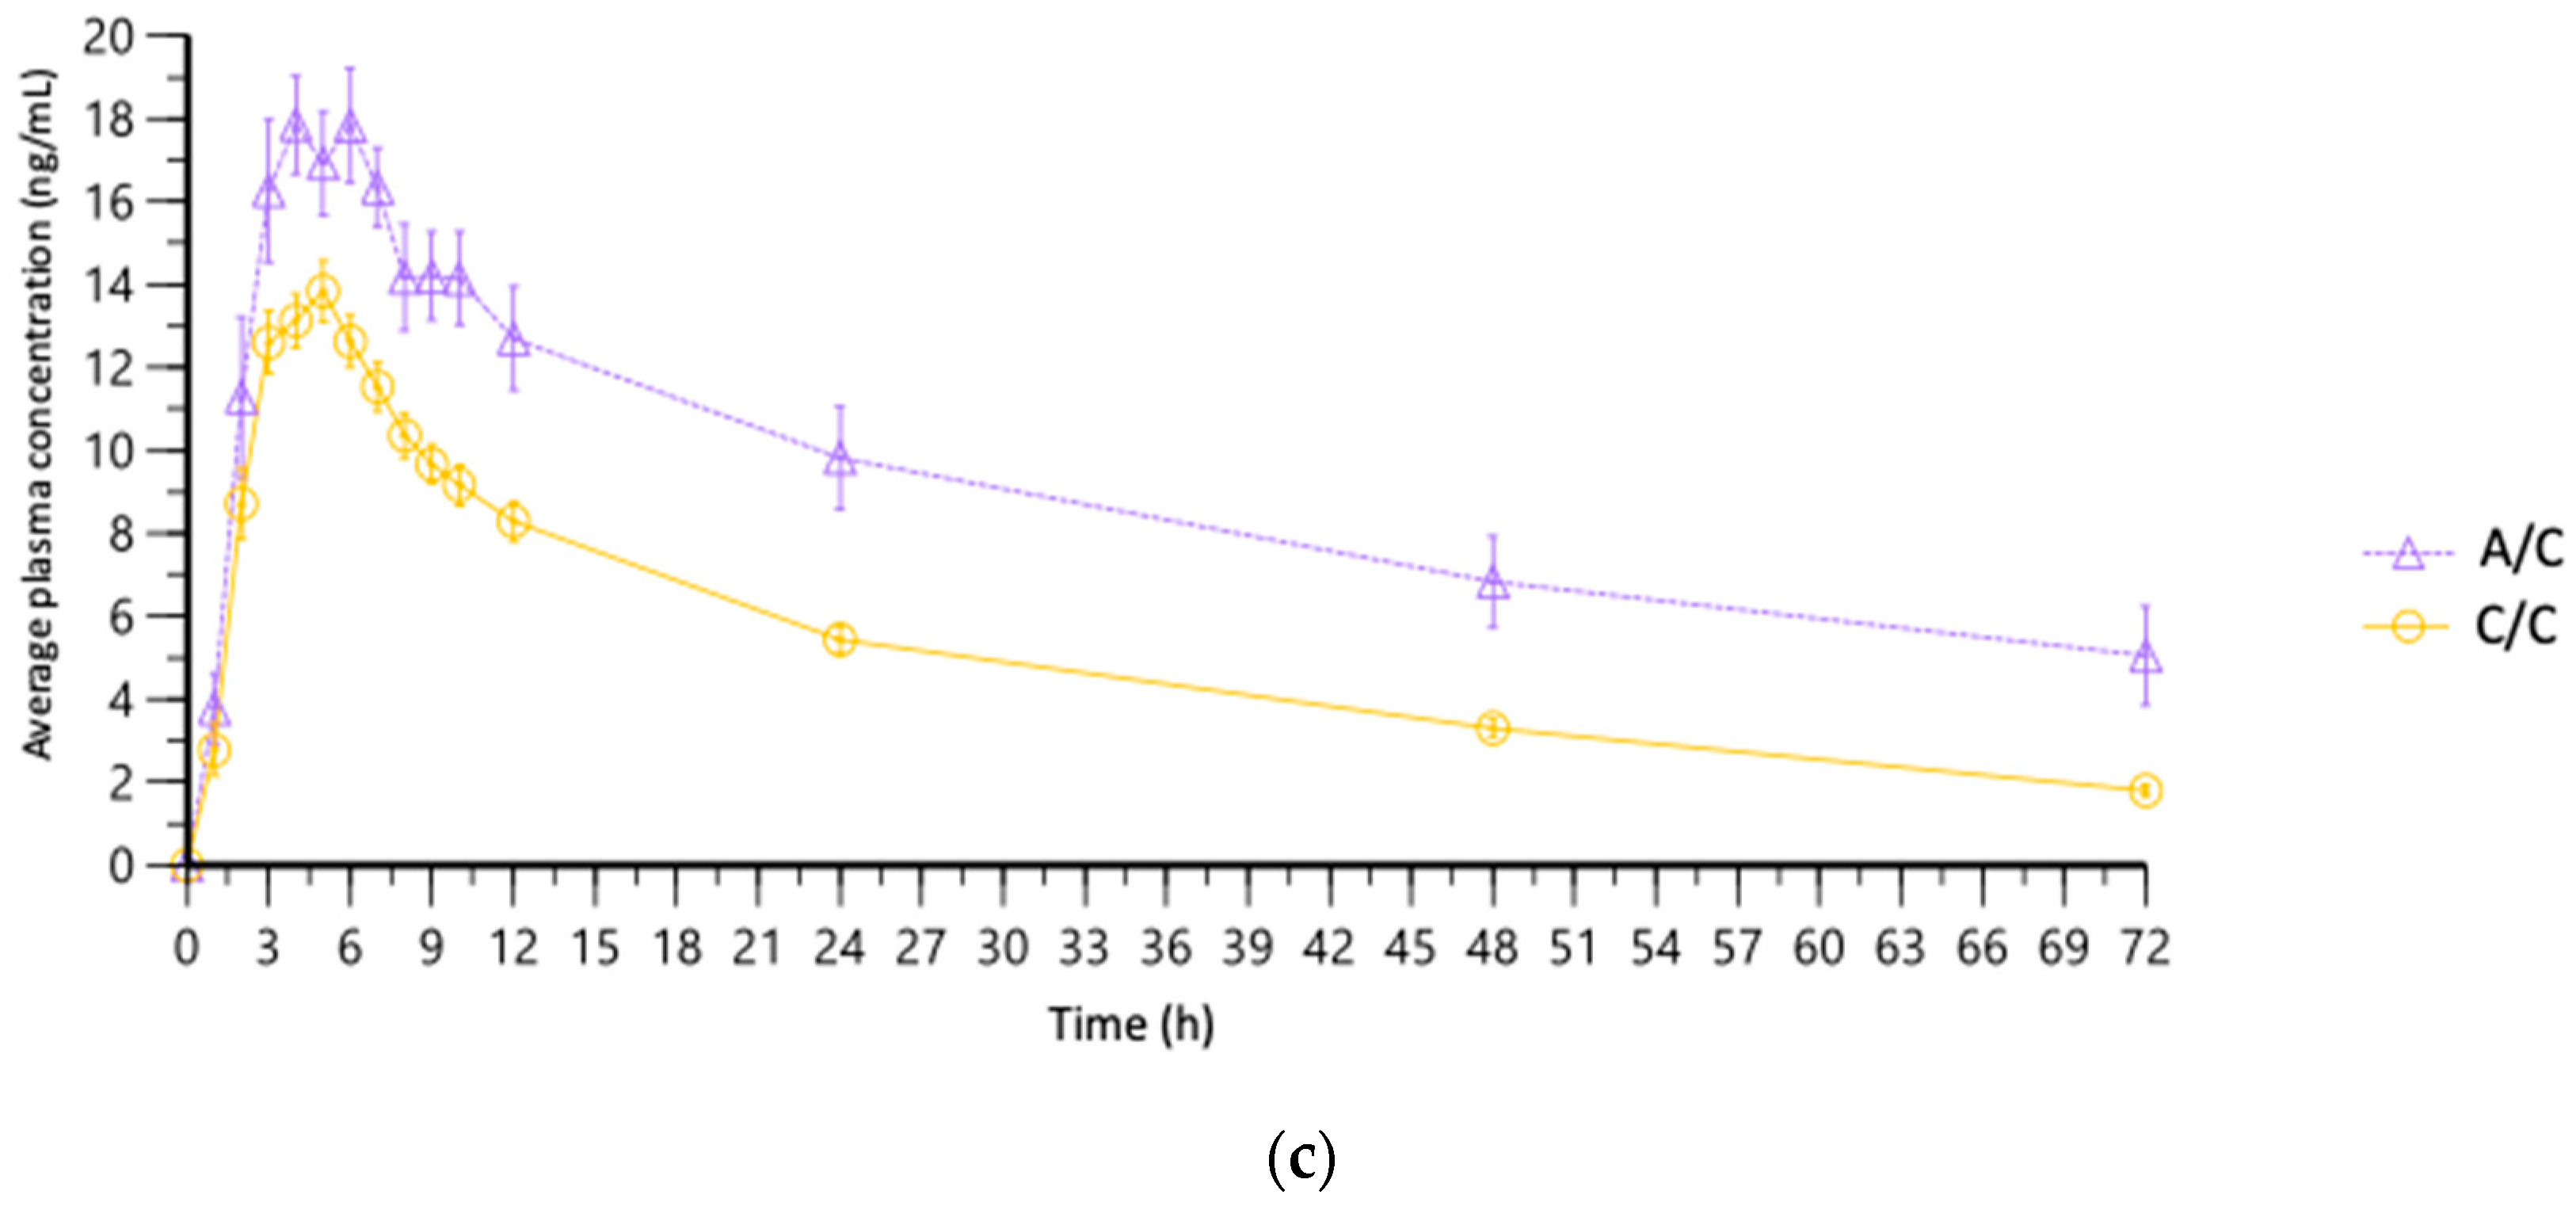
3.5. Association of PK Parameters with Pharmacogenomic Variants

Table 6 summarizes the individual variant significant additive allele effect (ADD) on the PK parameters as response variables. Covariates gender and age were significant (p < 0.05) in the models for Cmax in the SNVs for CYP2B6, CYP2D6, and ABCB1; age was significant (p < 0.05) for AUC0–t and AUC0–∞ in the CYP2B6 and CYP2D6 SNV models; and gender was significant (p < 0.05) in CYP2B6 SNVs for Cl, and AUC0–t in CYP2B6 and CYP2D6 SNVs. Only significant variants are shown in Table 6; some covariates might have significance, such as age and gender in Cmax for CYP2C19 and SLC6A4 SNVs, and gender in AUC0–t for CYP2C19, CYP1A2, and CYP3A4 SNVs.
We performed multiple linear regression analysis with response variables y = pharmacokinetic parameter vs. x, being multiple SNVs, including demographic covariables. Supplementary Material Table S2 displays the statistically significant models (p < 0.000), calculated using a stepwise method with the selected SNVs. CYP2D6 SNVs are present in all regression models, and the correlation was reduced with the inclusion of gender variable in the models for the Cl parameter, and with the introduction of height in the AUC0–t model. Significant CYP2D6 SNVs were rs1065852, rs1135840, rs28371706, and rs28371703, the latter being in all regression models with high coefficients. Four CYP2C19 SNVs were found significant: rs11188072, rs12769205, rs4244285, and rs4917623.
Other CYP SNVs such as CYP1A2 rs2470890 are significant in the regression models, as well as CYP2C9 SNVs rs1799853, rs28371686, and rs2256871. CYP3A4 variants also seem to be relevant for PK parameters, with five different associated variants. From all the statistical models executed, out of the total 54 SNVs initially explored from 12 genes, 39 SNVs resulted in significance for 10 genes: 3 for CYP1A2, 6 for CYP2B6, 3 for CYP2C9, 4 for CYP2C19, 6 for CYP2D6, 5 for CYP3A4, 1 for CYP3A5, 3 for ABCB1, 2 for SLC6A4, and 1 for TPH1.
The CYP2D6*10 haplotype, related to decreased CYP2D6 function (poor drug metabolism), was found in only one volunteer (subject 25), based on CYP2D6 rs1065852 (haplotype A/A) and rs11358490 (haplotype C/C). As shown in Table 2, t1/2 was three times higher (106.9 h) for this subject than the overall mean (31.02 h). AUCs and t1/2 were statistically different between genotypes of CYP2D6 rs1065852 (p < 0.001). Stratification of subjects based on CYP2D6 genotypes confirmed the difference in the PK profiles, based on the three SNVs found in this study (rs1065852, rs1135840, and rs28371703) (Figure 5).
After removing from the bioequivalence analysis the PK data of the subject with decreased CYP2D6 function based on CYP2D6 *10, which was an extreme outlier in the statistical analysis and identified phenotypically as a poor metabolizer of fluoxetine, there was a reduction of 4.22% in the intersubject variability in AUC0–t (44.97% vs. 40.75%) and of 13.66% in AUC0–∞ (57.12% vs. 43.46%) (Table 7).

4. Discussion

Despite having better therapeutic efficacy than first-generation and other third-generation antidepressants, the clinical response to fluoxetine is still highly variable, with 10.6% of patients discontinuing treatment for major depressive disorder due to a lack of therapeutic efficacy [28]. Because of that, pharmacological research on fluoxetine is relevant since the lack of therapeutic efficacy could derive from pharmacokinetic causes. Fluoxetine exhibits high intersubject PK variability, as confirmed in our study. Also, the exploration of different ethnicities is important for a better understanding of the pharmacogenomics of antidepressants, assessing both their pharmacokinetics and efficacy [29,30,31].
In this bioequivalence study in a Mexican sample, fluoxetine t1/2 was calculated as 30.7 h and 31.3 h for the test and reference formulations, respectively. These values are lower than those reported in the international literature for the drug, ranging between 4 and 6 days [32]. Nevertheless, our obtained values match with those reported for extensive metabolizers [33]. Maximum t1/2 values in our study sample were 88.9 and 106.9 h (3.7 and 4.5 days), corresponding to a subject with poor CYP2D6 metabolizer phenotype. Mean tmax was found around 1 h before the reported value, confirming a high proportion of extensive metabolizers in the sample studied, which has also been found by other researchers in the Mexican population [34].
Bioequivalence was concluded between test and reference formulations of fluoxetine 20 mg capsules with a 2 × 2 crossover design, in which each subject serves as its own control. Maximum intrasubject variability was 14.4% for Cmax, so the sample size of 24 subjects was enough to achieve the minimum acceptable statistical power of 80%. Nevertheless, intersubject variability was high, up to 57.1% for AUC0–∞, which is also well known [35]. It has been previously reported that drugs mainly metabolized by CYP3A4 tend to have higher intrasubject PK variability, while drugs primarily metabolized by CYP2D6 show high intersubject variability in general [36], which is confirmed for fluoxetine in this study.
The quantitative impact of CYP variants is reported in this study. CYP2D6 rs28371703 had the greatest impact on the PK parameters of fluoxetine in the regression models. One subject with homozygote allele A/A for SNV rs1065852, associated with decreased CYP2D6 function, was found in our study sample, and we confirmed that the plasmatic t1/2 increased about three times compared with A/G and G/G alleles. This SNV frequency in our study (1/24 = 4.2%) is consistent with reports in the literature, ranging from 2.8% and up to 4.3% in Caucasian, Hispanic, and Afro-American populations [37]. Together with CYP2D6 rs11358490, this SNV is part of the CYP2D6*10 haplotype [7], known to have decreased cytochrome function along with other gene variants [38]. Moreover, a phenotype–genotype relationship was identified for three CYP2D6 variants, confirming the relevance of this cytochrome in fluoxetine metabolism. CYP2C19 activity was found to be associated with differential exposure to the drug based on the genotype, as well as CYPs 1A2, 2C9, and 3A4, confirming previous findings [39]. Six CYP2B6 SNVs were found relevant in fluoxetine metabolism. CYP2B6 is also known to participate in antidepressant metabolism [40], so attention should be also pointed to this cytochrome when administering SSRI, as recently discussed in CPIC guidelines [41].
In this study, we identified 34 significant gene variants on 10 genes with quantifiable relevance in the pharmacokinetics of fluoxetine, with a candidate gene approach. Out of those, 29 SNVs belong to 7 CYPs (CYP1A2, CYP2B6, CYP2C9, CYP2C19, CYP2D6, CYP3A4, and CYP3A5), and 5 SNVs to 3 pharmacodynamics (PD)- and efficacy-related genes (SLC6A4, TPH1, ABCB1). These three genes encoding for the serotonin transporter 1, p-glycoprotein 1, and L-tryptophan hydroxylase 1, respectively, are directly involved in the PD of fluoxetine. These have been researched thoroughly in the past [42], aiming for a better understanding of the efficacy of antidepressants from the PD perspective. Even though they seem important in fluoxetine PK, the role of PK-related proteins in drug PD is multifactorial, and medication response still cannot be associated purely with single gene variations, as has been explored and evidenced in similar studies for other therapeutic classes [43].
Regarding the limitations of this study, it is important to note that the sample size required for bioequivalence studies is considerably smaller than that required for pharmacogenetic studies, so we recommend more research into pharmacogenetics in pharmacokinetic studies, considering pharmacogenetics as an exploratory objective. Also, further evidence should be gathered to confirm the differences in fluoxetine PK between genders, as the number of females in this study was considerably lower than males. Finally, this study was conducted in healthy volunteers to explore fluoxetine PK, without the intention of evaluating its efficacy.
With this clinical study with fluoxetine hydrochloride, we confirm that through genotyping participating subjects in bioequivalence studies, the drug exposure can be assessed, and significant reduction of the intersubject variability can be achieved in clinical trials. The latter was evidenced despite the limitation of the sample size for the pharmacogenetic analyses within the context of a bioequivalence study for determining interchangeability between two fluoxetine formulations.

Supplementary Materials

The following supporting information can be downloaded at: https://www.mdpi.com/article/10.3390/jpm13091352/s1: Table S1: Individual fluoxetine PK parameters; Table S2: SNVs and demographic characteristics as predictor variables of PK parameters.

Author Contributions

Conceptualization, C.A.D.-T., J.A.P.-A. and V.G.-C.; methodology, C.A.D.-T. and J.A.P.-A.; software, C.A.D.-T.; resources, C.A.D.-T., J.A.P.-A. and V.G.-C.; writing—original draft preparation, C.A.D.-T.; writing—review and editing, C.A.D.-T., J.A.P.-A. and V.G.-C.; supervision, J.A.P.-A. and V.G.-C.; project administration, J.A.P.-A. and V.G.-C.; funding acquisition, C.A.D.-T., J.A.P.-A. and V.G.-C. All authors have read and agreed to the published version of the manuscript.

Funding

Bioequivalence study was funded by PROTEIN, S.A. de C.V. (Apotex México), whose test formulation was evaluated. The pharmacogenomic part of this study was funded by projects granted to V.G.-C.: “Estudio farmacogenético y de biodisponibilidad comparativa para evaluación del efecto de polimorfismos relevantes en la farmacocinética de fluoxetina en voluntarios sanos mexicanos” (INMEGEN:CEI:2017/04) and “Variantes genéticas y su relación con la respuesta al tratamiento” (INMEGEN:CEI:2016/23).

Institutional Review Board Statement

The study was conducted in accordance with the Declaration of Helsinki, and approved by Ethics Committees at Axis Clinicals Latina (protocol code: ACL16-PC019; approval date: 25 August 2016), Mexican regulatory agency COFEPRIS (authorization code: 163300410B0384/2016; approval date: 27 September 2016), and Institutional Review Board at INMEGEN (approval code: CEI 2017/04; approval date: 30 March 2017), for the conduction of the bioequivalence and pharmacogenomic phases of this clinical trial with healthy subjects.

Informed Consent Statement

Informed consent was obtained from all subjects involved in the study, both for the bioequivalence and pharmacogenomic analyses.

Data Availability Statement

The authors declare that the data supporting the findings of this study are mostly available within the paper. Complementary data are available upon request via email to the authors.

Acknowledgments

C.A.D.-T. thanks the Mexico National Council of Humanities, Science and Technology (CONAHCYT) for the scholarship granted (CVU No. 439303) to complete the doctoral degree in Experimental Clinical Research in Health (Clinical Pharmacology), from the Medical, Dental, and Health Sciences Postgraduate Program (PMDCMOS) at the National Autonomous University of Mexico (UNAM). The authors greatly appreciate the work, support, and collaboration of the clinical and bioanalytical staff at Axis Clinicals Latina for the conduction and analysis of plasma concentrations of fluoxetine for the bioequivalence study. Thanks to Dulce Karina Rico-Amador and Cintia K. Guzmán-Cruz, from the Pharmacogenomics Lab, INMEGEN, for their support of the pharmacogenomic analysis in this project. The authors also thank Aurora de la Peña-Díaz for her contributions and comments to this project, and Patricia Segura-Medina for the critical review of the final version of this paper.

Conflicts of Interest

The sponsor of the bioequivalence trial had no role in the conduction of the study nor execution of this project, data collection, analysis, interpretation, or writing the paper. The authors declare no conflict of interest related to the analysis and interpretation of the results of this study.

References

  1. World Health Organization (WHO). Depressive Disorder (Depression). Available online: https://www.who.int/news-room/fact-sheets/detail/depression (accessed on 5 May 2023).
  2. Elsevier, B.V. Scopus. Available online: https://www.scopus.com/home.uri (accessed on 5 May 2023).
  3. Maruf, A.A.; Greenslade, A.; Arnold, P.D.; Bousman, C. Antidepressant Pharmacogenetics in Children and Young Adults: A Systematic Review. J. Affect. Disord. 2019, 254, 98–108. [Google Scholar] [CrossRef]
  4. PharmGKB Fluoxetine. Available online: https://www.pharmgkb.org/chemical/PA449673 (accessed on 5 July 2023).
  5. Iosifescu, D.V. Pharmacogenomic Testing for Next-Step Antidepressant Selection: Still a Work in Progress. JAMA 2022, 328, 146–148. [Google Scholar] [CrossRef] [PubMed]
  6. Cicali, E.J.; Elchynski, A.L.; Cook, K.J.; Houder, J.T.; Thomas, C.D.; Smith, D.M.; Elsey, A.; Johnson, J.A.; Cavallari, L.H.; Wiisanen, K. How to Integrate CYP2D6 Phenoconversion into Clinical Pharmacogenetics: A Tutorial. Clin. Pharmacol. Ther. 2021, 110, 677–687. [Google Scholar] [CrossRef] [PubMed]
  7. Hicks, J.K.; Sangkuhl, K.; Swen, J.J.; Ellingrod, V.L.; Müller, D.J.; Shimoda, K.; Bishop, J.R.; Kharasch, E.D.; Skaar, T.C.; Gaedigk, A.; et al. Clinical Pharmacogenetics Implementation Consortium Guideline (CPIC) for CYP2D6 and CYP2C19 Genotypes and Dosing of Tricyclic Antidepressants: 2016 Update. Clin. Pharmacol. Ther. 2017, 102, 37–44. [Google Scholar] [CrossRef] [PubMed]
  8. COFEPRIS. Norma Oficial Mexicana NOM-177-SSA1-2013; Que Establece las Pruebas y Procedimientos Para Demostrar Que un Medicamento es Intercambiable. Requisitos a Que Deben Sujetarse los Terceros Autorizados Que Realicen las Pruebas de Intercambiabilidad. Requisitos Para Realizar los Estudios de Biocomparabilidad. Requisitos a Que Deben Sujetarse los Terceros Autorizados, Centros de Investigación o Instituciones Hospitalarias Que Realicen las Pruebas de Biocomparabilidad; Diario Oficial de la Federación (DOF). Published on 20 September 2013. Available online: https://www.dof.gob.mx/nota_detalle.php?codigo=5314833&fecha=20/09/2013#gsc.tab=0 (accessed on 20 May 2023).
  9. Clinicaltrials.gov. Studies Found for: Fluoxetine, Prozac, Reconcile. Available online: https://www.clinicaltrials.gov/ct2/results/details?term=bioequivalence&intr=Prozac (accessed on 20 August 2023).
  10. COFEPRIS. Consultas de Ensayos Clínicos Registrados. Available online: http://siipris03.cofepris.gob.mx/Resoluciones/Consultas/ConWebRegEnsayosClinicos.asp (accessed on 20 August 2023).
  11. Moraes, M.O.; Lerner, F.E.; Corso, G.; Bezerra, F.A.F.; Moraes, M.E.A.; De Nucci, G. Fluoxetine Bioequivalence Study: Quantification of Fluoxetine and Norfluoxetine by Liquid Chromatography Coupled to Mass Spectrometry. J. Clin. Pharmacol. 1999, 39, 1053–1061. [Google Scholar] [CrossRef]
  12. Chow, S.-C.; Liu, J.-P. Design and Analysis of Bioavailability and Bioequivalence Studies, 3rd ed.; CRC Press: Boca Raton, FL, USA, 2008; 760p. [Google Scholar]
  13. ICH (International Council for Harmonisation). Integrated Addendum to ICH E6(R1): Guideline for Good Clinical Practice E6(R2). Published on 9 November 2016. Available online: https://database.ich.org/sites/default/files/E6_R2_Addendum.pdf (accessed on 20 May 2023).
  14. ICH (International Council for Harmonisation). International Council for Harmonisation of Technical Requirements for Pharmaceuticals for Human Use Guidelines. Available online: https://www.ich.org/products/guidelines.html (accessed on 15 May 2023).
  15. WMA. WMA Declaration of Helsinki—Ethical Principles for Medical Research Involving Human Subjects. Available online: https://www.wma.net/policies-post/wma-declaration-of-helsinki-ethical-principles-for-medical-research-involving-human-subjects/ (accessed on 5 July 2023).
  16. Illumina. Infinium® Global Screening Array-24. Available online: https://www.illumina.com/products/by-type/microarray-kits/infinium-global-screening.html (accessed on 2 May 2023).
  17. Certara. Phoenix WinNonlin. Available online: https://www.certara.com/software/phoenix-winnonlin/ (accessed on 5 May 2023).
  18. Lee, H.Y.; Lee, Y.J. The Data Analysis Tool for Average Bioequivalence (ABE) and Bioavailability (BA) (BEAR v2.7.7). Available online: http://pkpd.kmu.edu.tw/bear/ (accessed on 15 May 2023).
  19. IBM. SPSS Statistics. Available online: https://www.ibm.com/products/spss-statistics (accessed on 15 May 2023).
  20. Fan, J.; Liu, H. Statistical Analysis of Big Data on Pharmacogenomics. Adv. Drug Deliv. Rev. 2013, 65, 987–1000. [Google Scholar] [CrossRef]
  21. Cruz-Correa, O.F.; León-Cachón, R.B.R.; Barrera-Saldaña, H.A.; Soberón, X. Prediction of Atorvastatin Plasmatic Concentrations in Healthy Volunteers Using Integrated Pharmacogenetics Sequencing. Pharmacogenomics 2017, 18, 121–131. [Google Scholar] [CrossRef]
  22. Hodgson, K.; Mufti, S.J.; Uher, R.; McGuffin, P. Genome-Wide Approaches to Antidepressant Treatment: Working towards Understanding and Predicting Response. Genome Med. 2012, 4, 52. [Google Scholar] [CrossRef]
  23. PharmGKB. The Pharmacogenomics Knowledgebase. Available online: https://www.pharmgkb.org/ (accessed on 15 May 2023).
  24. Cariaso, M.; Lennon, G. SNPedia: A Wiki Supporting Personal Genome Annotation, Interpretation and Analysis. Nucleic Acids Res. 2012, 40, D1308–D1312. [Google Scholar] [CrossRef]
  25. Fairley, S.; Lowy-Gallego, E.; Perry, E.; Flicek, P. The International Genome Sample Resource (IGSR) Collection of Open Human Genomic Variation Resources. Nucleic Acids Res. 2020, 48, D941–D947. [Google Scholar] [CrossRef]
  26. Chen, S.; Francioli, L.C.; Goodrich, J.K.; Collins, R.L.; Kanai, M.; Wang, Q.; Alföldi, J.; Watts, N.A.; Vittal, C.; Gauthier, L.D.; et al. A Genome-Wide Mutational Constraint Map Quantified from Variation in 76,156 Human Genomes. bioRxiv 2022, 485034. [Google Scholar]
  27. Phan, J.; Yin, Y.; Zhang, H.; Qiang, W.; Shektman, E. Allele Frequency Aggregator (ALFA). Available online: www.ncbi.nlm.nih.gov/snp/docs/gsr/alfa/ (accessed on 5 May 2023).
  28. Hertzberg, M.; Feldman, M.; Beckham, J.; Kudler, H.; Davidson, J. Lack of Efficacy for Fluoxetine in PTSD: A Placebo Controlled Trial in Combat Veterans. Ann. Clin. Psychiatry 2000, 12, 101–105. [Google Scholar] [CrossRef] [PubMed]
  29. Hongkaew, Y.; Gaedigk, A.; Wilffert, B.; Ngamsamut, N.; Kittitharaphan, W.; Limsila, P.; Sukasem, C. Relationship between CYP2D6 Genotype, Activity Score and Phenotype in a Pediatric Thai Population Treated with Risperidone. Sci. Rep. 2021, 11, 4158. [Google Scholar] [CrossRef]
  30. Lesser, I.M.; Myers, H.F.; Lin, K.-M.; Bingham Mira, C.; Joseph, N.T.; Olmos, N.T.; Schettino, J.; Poland, R.E. Ethnic Differences in Antidepressant Response: A Prospective Multi-Site Clinical Trial. Depress. Anxiety 2010, 27, 56–62. [Google Scholar] [CrossRef] [PubMed]
  31. Wagner, G.J.; Maguen, S.; Rabkin, J.G. Ethnic Differences in Response to Fluoxetine in a Controlled Trial with Depressed HIV-Positive Patients. Psychiatr. Serv. 1998, 49, 239–240. [Google Scholar] [CrossRef] [PubMed]
  32. Micromedex. Fluoxetine Hydrochloride. Truven Health Analytics LLC. 2016. Available online: https://www.micromedexsolutions.com/ (accessed on 1 May 2023).
  33. PLM. PROZAC®20 (IPP). Diccionario de Especialidades Farmacéuticas. 2016. Available online: https://www.medicamentosplm.com/Home/productos/prozac_20_c%C3%A1psulas/50/101/9459/14 (accessed on 1 May 2023).
  34. Sagahón-Azúa, J.; Medellín-Garibay, S.E.; Chávez-Castillo, C.E.; González-Salinas, C.G.; Milán-Segovia, R.D.C.; Romano-Moreno, S. Factors Associated with Fluoxetine and Norfluoxetine Plasma Concentrations and Clinical Response in Mexican Patients with Mental Disorders. Pharmacol. Res. Perspect. 2021, 9, e00864. [Google Scholar] [CrossRef]
  35. Alfaro, C.L.; Lam, Y.W.F.; Simpson, J.; Ereshefsky, L. CYP2D6 Inhibition by Fluoxetine, Paroxetine, Sertraline, and Venlafaxine in a Crossover Study: Intraindividual Variability and Plasma Concentration Correlations. J. Clin. Pharmacol. 2000, 40, 58–66. [Google Scholar] [CrossRef]
  36. Sugihara, M.; Takeuchi, S.; Sugita, M.; Higaki, K.; Kataoka, M.; Yamashita, S. Analysis of Intra- and Intersubject Variability in Oral Drug Absorption in Human Bioequivalence Studies of 113 Generic Products. Mol. Pharm. 2015, 12, 4405–4413. [Google Scholar] [CrossRef]
  37. Reyes-Barron, C.; Tonarelli, S.; Delozier, A.; Briones, D.F.; Su, B.B.; Rubin, L.P.; Xu, C. Pharmacogenetics of Antidepressants, A Review of Significant Genetic Variants in Different Populations. Clin Depress. 2016, 2, 1000109. [Google Scholar] [CrossRef]
  38. Caudle, K.E.; Sangkuhl, K.; Whirl-Carrillo, M.; Swen, J.J.; Haidar, C.E.; Klein, T.E.; Gammal, R.S.; Relling, M.V.; Scott, S.A.; Hertz, D.L.; et al. Standardizing CYP 2D6 Genotype to Phenotype Translation: Consensus Recommendations from the Clinical Pharmacogenetics Implementation Consortium and Dutch Pharmacogenetics Working Group. Clin. Transl. Sci. 2020, 13, 116–124. [Google Scholar] [CrossRef]
  39. Deodhar, M.; Rihani, S.B.A.; Darakjian, L.; Turgeon, J.; Michaud, V. Assessing the Mechanism of Fluoxetine-Mediated CYP2D6 Inhibition. Pharmaceutics. 2021, 13, 148. [Google Scholar] [CrossRef]
  40. Hesse, L.M.; Venkatakrishnan, K.; Court, M.H.; von Moltke, L.L.; Duan, S.X.; Shader, R.I.; Greenblatt, D.J. CYP2B6 Mediates the in vitro Hydroxylation of Bupropion: Potential Drug Interactions with Other Antidepressants. Drug Metab. Dispos. 2000, 28, 1176–1183. [Google Scholar]
  41. Bousman, C.A.; Stevenson, J.M.; Ramsey, L.B.; Sangkuhl, K.; Hicks, J.K.; Strawn, J.R.; Singh, A.B.; Ruaño, G.; Mueller, D.J.; Tsermpini, E.E.; et al. Clinical Pharmacogenetics Implementation Consortium (CPIC) Guideline for CYP2D6, CYP2C19, CYP2B6, SLC6A4, and HTR2A Genotypes and Serotonin Reuptake Inhibitor Antidepressants. Clin. Pharmacol. Ther. 2023, 114, 51–68. [Google Scholar] [CrossRef]
  42. Niitsu, T.; Fabbri, C.; Bentini, F.; Serretti, A. Pharmacogenetics in Major Depression: A Comprehensive Meta-Analysis. Prog. Neuropsychopharmacol. Biol. Psychiatry 2013, 45, 183–194. [Google Scholar] [CrossRef]
  43. Abbas, B.; Sabri, N.A.; El-Khouly, A.A. Association between Food/UGT2B7 Polymorphisms and Pharmacokinetics/Pharmacodynamics Properties of Indapamide in Healthy Humans. Biomedicines 2023, 11, 1501. [Google Scholar] [CrossRef]
Figure 1. Study flow diagram.
Jpm 13 01352 g001
Figure 2. Mean plasma concentration–time curve of fluoxetine after an oral dose of 20 mg (n = 24).
Jpm 13 01352 g002
Figure 3. Individual fluoxetine PK parameters: (a) Cmax and (b) AUC0–t. The solid blue line indicates the overall mean for each parameter, while the dashed lines represent ±2 S.D.
Jpm 13 01352 g003
Figure 4. Weight vs. Cmax, stratified by gender and overall.
Jpm 13 01352 g004
Figure 5. Mean plasma concentration–time curve of fluoxetine, stratified by CYP2D6 genotypes: (a) rs1065852 (100C>T), associated with decreased function CYP2D6*10 allele (A/A n = 1; A/G n = 3; G/G n = 20); (b) rs1135840 (4180G>C), associated with decreased function CYP2D6*10 allele (C/C n = 4; C/G n = 13; G/G n = 7); (c) rs28371703 (974C>A), associated with no function CYP2D6*4 allele (A/C n = 4; C/C n = 20).
Jpm 13 01352 g005aJpm 13 01352 g005b
Table 1. Fluoxetine pharmacokinetics (PK) parameters.
Test ProductReference Product
CmaxAUC0–tAUC0–∞tmaxt1/2CmaxAUC0–tAUC0–∞tmaxt1/2
Mean16.25411.64556.064.4230.7115.92398.19542.434.2531.32
Geometric mean15.59377.86473.264.2528.9015.12360.06457.474.0729.02
Standard deviation (S.D.)5.02184.05429.461.1813.784.89189.55436.651.1917.21
Standard error of the mean (SEM)1.0237.5787.660.242.811.0038.6989.130.243.51
Minimum8.92171.86200.732.0015.427.42157.33171.142.0019.24
Median15.31371.42452.215.0027.0416.10349.68442.864.5027.60
Maximum32.05957.962351.796.0088.8623.71930.622383.396.00106.88
Coefficient of variation (%)30.9044.7077.2026.6044.9030.7047.6080.5028.0055.00
Units: Cmax [ng/mL], AUC0–t and AUC0–∞ [h*ng/mL], tmax and t1/2 [h].
Table 2. Fluoxetine bioequivalence assessment (n = 24).
ParameterGeometric MeanT/R Ratio (%)90% Confidence IntervalIntrasubject Variability (%)Intersubject Variability (%)Power (%)
Test (T) ProductReference (R) Product
Cmax15.5915.12103.1096.05–110.6714.4%29.27%100.0%
AUC0–t377.85360.05104.9499.87–110.2810.0%44.97%100.0%
AUC0–∞473.25457.47103.45100.23–106.776.4%57.12%100.0%
Table 3. Demographic and PK variables correlation matrix.
BMIAgeWeightHeightCmaxAUC0–tAUC0–∞tmaxt1/2
BMIPearson Correlation10.481 *0.665 **0.023−0.213−0.179−0.0200.1030.133
p 0.0170.0000.9130.1460.2230.8910.4840.368
AgePearson Correlation 10.323 *−0.014−0.344 *−0.250−0.2090.2520.015
p 0.1230.9500.0170.0870.1530.0840.921
WeightPearson Correlation 10.758 **−0.496 **−0.359 *−0.1130.0030.129
p 0.0000.0000.0120.4460.9810.380
HeightPearson Correlation 1−0.483 **−0.340 *−0.141−0.0780.056
p 0.0010.0180.3390.5980.705
CmaxPearson Correlation 10.825 **0.609 **−0.1580.301 *
p 0.0000.0000.2850.037
AUC0–tPearson Correlation 10.895 **0.0690.676 **
p 0.0000.6400.000
AUC0–∞Pearson Correlation 10.0860.902 **
p 0.5590.000
tmaxPearson Correlation 10.158
p 0.282
t1/2Pearson Correlation 1
p
* Correlation significance < 0.05 (two-tailed). ** Correlation significance < 0.01 (two-tailed).
Table 4. Genes and single nucleotide variants (SNVs) in the study with available annotations [23,24].
GeneSNVAssociated HaplotypeGenetic VariationAnnotated VariantsClinical AnnotationsEvidence Level (CPIC)ClassificationRelated DrugFunction
CYP1A2rs2069514* 1C3860G>A1723N/AAntipsychoticEfficacy
CYP1A2rs2069526* 1K739T>G713IntronicEscitalopramToxicity
CYP2B6rs4802101 750T>C3135′ endCyclophosphamideToxicity
CYP2C19rs11188072 823N/AEscitalopramDose
CYP2C8rs11572080* 3 58143MissenseRosiglitazone
CYP2C9rs28371686* 542619C>G2351AMissensePhenytoinMetabolism
CYP2D6rs1080985* 2A1496C>G3233′ endThioridazineEfficacy
CYP2D6rs1135840* 4, * 104180G>C828823MissenseFluoxetine
CYP2D6rs16947* 212851C>T643773MissenseFluoxetine
CYP2D6rs72549358* 28 214IntronicTamoxifen
CYP3A4rs2687116 C>A20N/AIntronic--
ABCB1rs1045642 G>A5801003MissenseSSRIEfficacy
ABCB1rs1128503 1236T>C216383Syno-nymMethadoneMetabolism/PK
ABCB1rs2032582 2677T>G/A315493MissenseFluoxetineEfficacy
SLC6A4rs1042173 A>C2233′ UTROndansetronEfficacy
SLC6A4rs2066713 G>A113IntronicEthanolToxicity
SLC6A4rs25532 123 N/A
TPH1rs1799913 G>T10N/AIntronicLithiumEfficacy
Table 5. Minor allele frequencies (MAF) of analyzed genes from all available (ALL), African American (AFR), East Asian (EAS), South Asian (SAS), European (EUR), Latino/admixed American (AMR) populations, from ALFA dbSNP, and the sample in this study (MXN) [25,26,27].
GenersAlleleALLAFREASSASEURAMRMXN
CYP1A2rs2069526G0.0710.1230.0840.0690.0240.0250.063
CYP1A2rs2069514A0.2090.3130.2810.0800.0200.3620.413
CYP2B6rs4802101T0.2460.0570.3400.2520.4140.2210.083
CYP2C19rs11188072T0.1560.2460.0150.1360.2240.1200.083
CYP2C8rs11572080T0.0460.0080.0010.0300.1180.0910.065
CYP2C9rs28371686G0.0050.0170.0000.0000.0000.0010.021
CYP2D6rs72549358T0.0010.0000.0000.0000.0050.0010.021
CYP2D6rs1080985°C0.1620.0510.1030.2400.2410.2390.292
CYP2D6rs16947°A0.3680.5680.1350.3570.3380.3320.326
CYP2D6rs1135840°C0.4040.3220.2920.4740.4600.5300.438
CYP3A4rs2687116C0.2200.7210.0050.0450.0300.1020.083
ABCB1rs1045642A0.3950.1500.3980.5750.5180.4280.438
ABCB1rs1128503A0.4160.1360.6270.5870.4160.4030.458
ABCB1rs2032582T0.0490.0010.1340.0500.0180.0590.479
SLC6A4rs2066713A0.2570.2540.0660.2890.3810.3140.292
SLC6A4rs1042173C0.4850.1850.8220.5520.4370.5420.375
TPH1rs1799913T0.3210.1630.4750.2690.3910.3720.354
Sample size 500813221008978100669424
Data from 1000Genomes_30x, with a global n = 6404 genomes (1786 AFR; 1170 EAS; 1202 SAS; 1266 EUR; 980 AMR).
Table 6. Additive allele effect (ADD) of SNVs associated with PK parameters.
PK
Parameter
GeneChromosomeSNVMinor AlleleCoefficient (ADD)p-Value
CmaxABCB17rs2032582C−2.270.033
ABCB17rs1128503G−2.110.042
CYP2B619rs4802101A5.380.009
CYP2B619rs4803418G−2.900.010
CYP2B619rs4803419A−2.900.010
CYP2B619rs2279344G4.940.005
CYP2D622rs28371703A4.870.016
AUC0–tCYP2B619rs4802101A219.300.022
CYP2B619rs4803418G−156.300.002
CYP2B619rs4803419A−156.300.002
CYP2B619rs2279344G180.500.033
CYP2D622rs1135840C142.000.005
CYP2D622rs28371703A291.800.001
CYP2D622rs1065852A249.800.001
AUC0–∞CYP2B619rs4802101A568.300.020
CYP2B619rs4803418G−336.900.010
CYP2B619rs4803419A−336.900.010
CYP2B619rs2279344G463.500.032
CYP2D622rs1135840C301.800.023
CYP2D622rs28371703A733.800.001
CYP2D622rs1065852A783.600.000
tmaxCYP2C910rs2256871G−1.990.047
t1/2SLC6A417rs1042173A9.890.049
CYP2B619rs4802101A18.430.045
CYP2B619rs2279344G16.820.035
CYP2D622rs28371703A23.540.006
CYP2D622rs1065852A28.640.000
ClABCB17rs2032582C14.200.018
ABCB17rs1128503G11.770.048
CYP2B619rs4802101A−24.280.047
CYP2B619rs4803418G14.000.035
CYP2B619rs4803419A14.000.035
CYP2B619rs2279344G−22.780.031
CYP2D622rs28371703A−26.790.022
CYP2D622rs1065852A−21.360.043
Only SNVs with p < 0.05 are summarized. SNVs with the lower p-value are written in bold text.
Table 7. Fluoxetine bioequivalence assessment after excluding the PK data of the slow-metabolizing subject (n = 23).
ParameterGeometric MeanT/R Ratio (%)90% Confidence IntervalIntrasubject Variability (%)Intersubject Variability (%)Power (%)
Test (T) ProductReference (R) Product
Cmax15.3214.83103.2895.89–111.2314.7%28.37%100.0%
AUC0–t363.16346.11104.9399.61–110.5310.3%40.75%100.0%
AUC0–∞441.64426.27103.61100.24–107.096.5%43.46%100.0%
Disclaimer/Publisher’s Note: The statements, opinions and data contained in all publications are solely those of the individual author(s) and contributor(s) and not of MDPI and/or the editor(s). MDPI and/or the editor(s) disclaim responsibility for any injury to people or property resulting from any ideas, methods, instructions or products referred to in the content.

