
Predicting Breast Cancer Risk Using Radiomics Features of Mammography Images

 , ,
, ,
Abstract
:1. Introduction
2. Materials and Methods
2.1. Dataset
2.2. Breast Mask Image
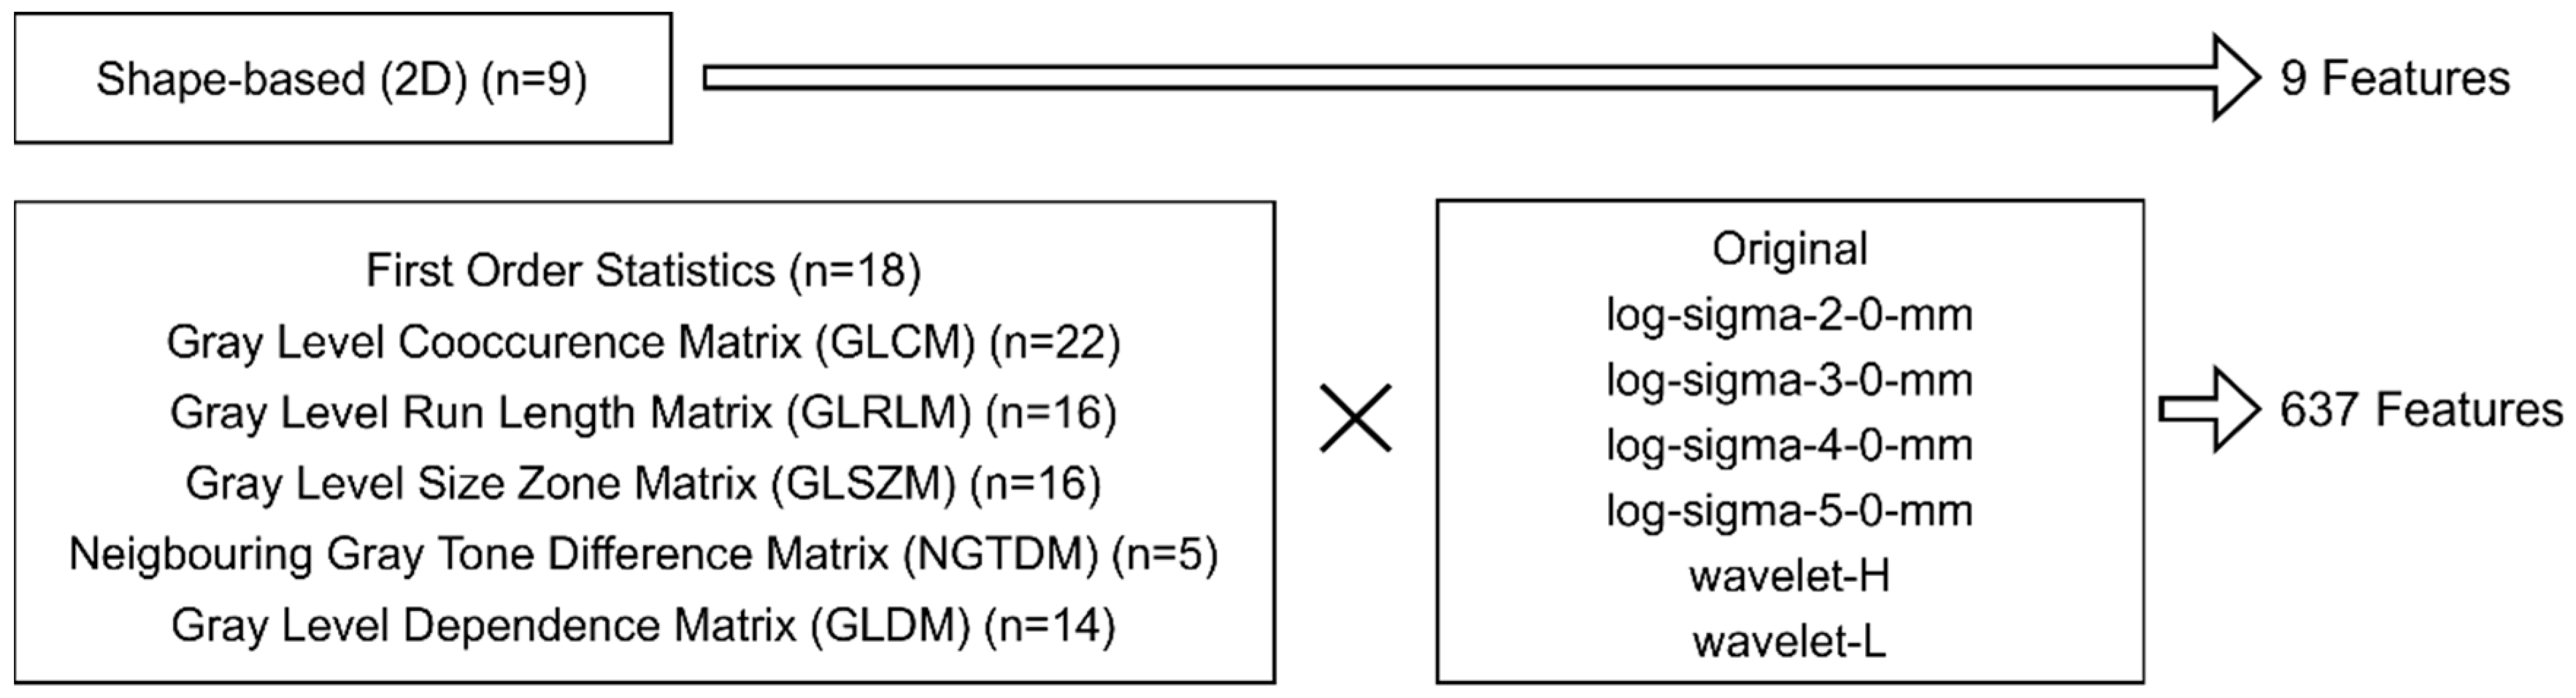
2.3. Radiomics Features
2.4. Analysis
3. Results
4. Discussion
5. Conclusions
Author Contributions
Funding
Institutional Review Board Statement
Informed Consent Statement
Data Availability Statement
Acknowledgments
Conflicts of Interest
References
- Sung, H.; Ferlay, J.; Siegel, R.L.; Laversanne, M.; Soerjomataram, I.; Jemal, A.; Bray, F. Global Cancer Statistics 2020: GLOBOCAN Estimates of Incidence and Mortality Worldwide for 36 Cancers in 185 Countries. CA Cancer J. Clin. 2021, 71, 209–249. [Google Scholar] [CrossRef] [PubMed]
- Nyström, L.; Andersson, I.; Bjurstam, N.; Frisell, J.; Nordenskjöld, B.; Rutqvist, L.E. Long-Term Effects of Mammography Screening: Updated Overview of the Swedish Randomised Trials. Lancet 2002, 359, 909–919. [Google Scholar] [CrossRef]
- Andersson, I.; Janzon, L. Reduced Breast Cancer Mortality in Women under Age 50: Updated Results from the Malmö Mammographic Screening Program. J. Natl. Cancer Inst. Monogr. 1997, 1997, 63–67. [Google Scholar] [CrossRef]
- Duffy, S.W.; Tabar, L.; Olsen, A.H.; Vitak, B.; Allgood, P.C.; Chen, T.H.H.; Yen, A.M.F.; Smith, R.A. Absolute Numbers of Lives Saved and Overdiagnosis in Breast Cancer Screening, from a Randomized Trial and from the Breast Screening Programme in England. J. Med. Screen. 2010, 17, 25–30. [Google Scholar] [CrossRef] [PubMed]
- Tabár, L.; Fagerberg, C.J.; Gad, A.; Baldetorp, L.; Holmberg, L.H.; Gröntoft, O.; Ljungquist, U.; Lundström, B.; Månson, J.C.; Eklund, G. Reduction in Mortality from Breast Cancer after Mass Screening with Mammography. Randomised Trial from the Breast Cancer Screening Working Group of the Swedish National Board of Health and Welfare. Lancet 1985, 1, 829–832. [Google Scholar] [CrossRef]
- Frisell, J.; Lidbrink, E.; Hellström, L.; Rutqvist, L.E. Followup after 11 Years--Update of Mortality Results in the Stockholm Mammographic Screening Trial. Breast Cancer Res. Treat. 1997, 45, 263–270. [Google Scholar] [CrossRef] [PubMed]
- Meeson, S.; Young, K.C.; Wallis, M.G.; Cooke, J.; Cummin, A.; Ramsdale, M.L. Image Features of True Positive and False Negative Cancers in Screening Mammograms. Br. J. Radiol. 2003, 76, 13–21. [Google Scholar] [CrossRef]
- Goergen, S.K.; Evans, J.; Cohen, G.P.; MacMillan, J.H. Characteristics of Breast Carcinomas Missed by Screening Radiologists. Radiology 1997, 204, 131–135. [Google Scholar] [CrossRef]
- Bird, R.E.; Wallace, T.W.; Yankaskas, B.C. Analysis of Cancers Missed at Screening Mammography. Radiology 1992, 184, 613–617. [Google Scholar] [CrossRef]
- Posso, M.; Louro, J.; Sánchez, M.; Román, M.; Vidal, C.; Sala, M.; Baré, M.; Castells, X.; BELE Study Group. Mammographic Breast Density: How It Affects Performance Indicators in Screening Programmes? Eur. J. Radiol. 2019, 110, 81–87. [Google Scholar] [CrossRef]
- Théberge, I.; Guertin, M.-H.; Vandal, N.; Côté, G.; Dufresne, M.-P.; Pelletier, É.; Brisson, J. Screening Sensitivity According to Breast Cancer Location. Can. Assoc. Radiol. J. 2019, 70, 186–192. [Google Scholar] [CrossRef] [PubMed]
- Martínez Miravete, P.; Etxano, J. Breast tomosynthesis: A new tool for diagnosing breast cancer. Radiologia 2015, 57, 3–8. [Google Scholar] [CrossRef]
- Scheel, J.R.; Lee, J.M.; Sprague, B.L.; Lee, C.I.; Lehman, C.D. Screening Ultrasound as an Adjunct to Mammography in Women with Mammographically Dense Breasts. Am. J. Obstet. Gynecol. 2015, 212, 9–17. [Google Scholar] [CrossRef]
- DeMartini, W.; Lehman, C.; Partridge, S. Breast MRI for Cancer Detection and Characterization: A Review of Evidence-Based Clinical Applications. Acad. Radiol. 2008, 15, 408–416. [Google Scholar] [CrossRef] [PubMed]
- Saslow, D.; Boetes, C.; Burke, W.; Harms, S.; Leach, M.O.; Lehman, C.D.; Morris, E.; Pisano, E.; Schnall, M.; Sener, S.; et al. American Cancer Society Guidelines for Breast Screening with MRI as an Adjunct to Mammography. CA Cancer J. Clin. 2007, 57, 75–89. [Google Scholar] [CrossRef] [PubMed]
- National Comprehensive Cancer Network. Genetic/Familial High-Risk Assessment: Breast, Ovarian, and Pancreatic Version 1.2024—28 August 2023. Available online: https://www.nccn.org/professionals/physician_gls/pdf/genetics_bop.pdf (accessed on 9 September 2023).
- Ohuchi, N.; Suzuki, A.; Sobue, T.; Kawai, M.; Yamamoto, S.; Zheng, Y.-F.; Shiono, Y.N.; Saito, H.; Kuriyama, S.; Tohno, E.; et al. Sensitivity and Specificity of Mammography and Adjunctive Ultrasonography to Screen for Breast Cancer in the Japan Strategic Anti-Cancer Randomized Trial (J-START): A Randomised Controlled Trial. Lancet 2016, 387, 341–348. [Google Scholar] [CrossRef] [PubMed]
- Gail, M.H.; Brinton, L.A.; Byar, D.P.; Corle, D.K.; Green, S.B.; Schairer, C.; Mulvihill, J.J. Projecting Individualized Probabilities of Developing Breast Cancer for White Females Who Are Being Examined Annually. J. Natl. Cancer Inst. 1989, 81, 1879–1886. [Google Scholar] [CrossRef]
- Mavaddat, N.; Michailidou, K.; Dennis, J.; Lush, M.; Fachal, L.; Lee, A.; Tyrer, J.P.; Chen, T.-H.; Wang, Q.; Bolla, M.K.; et al. Polygenic Risk Scores for Prediction of Breast Cancer and Breast Cancer Subtypes. Am. J. Hum. Genet. 2019, 104, 21–34. [Google Scholar] [CrossRef]
- Allman, R.; Mu, Y.; Dite, G.S.; Spaeth, E.; Hopper, J.L.; Rosner, B.A. Validation of a Breast Cancer Risk Prediction Model Based on the Key Risk Factors: Family History, Mammographic Density and Polygenic Risk. Breast Cancer Res. Treat. 2023, 198, 335–347. [Google Scholar] [CrossRef]
- Bodewes, F.T.H.; van Asselt, A.A.; Dorrius, M.D.; Greuter, M.J.W.; de Bock, G.H. Mammographic Breast Density and the Risk of Breast Cancer: A Systematic Review and Meta-Analysis. Breast 2022, 66, 62–68. [Google Scholar] [CrossRef]
- Wei, J.; Chan, H.P.; Wu, Y.T.; Zhou, C.; Helvie, M.A.; Tsodikov, A.; Hadjiiski, L.M.; Sahiner, B. Association of Computerized Mammographic Parenchymal Pattern Measure with Breast Cancer Risk: A Pilot Case-Control Study. Radiology 2011, 260, 42–49. [Google Scholar] [CrossRef] [PubMed]
- Wolf, I.; Sadetzki, S.; Catane, R.; Karasik, A.; Kaufman, B. Diabetes Mellitus and Breast Cancer. Lancet Oncol. 2005, 6, 103–111. [Google Scholar] [CrossRef] [PubMed]
- Soler, N.G.; Khardori, R. Fibrous Disease Of The Breast, Thyroiditis, And Cheiroarthropathy In Type I Diabetes Mellitus. Lancet 1984, 323, 193–195. [Google Scholar] [CrossRef] [PubMed]
- Kudva, Y.C.; Reynolds, C.A.; O’Brien, T.; Crotty, T.B. Mastopathy and Diabetes. Curr. Diab. Rep. 2003, 3, 56–59. [Google Scholar] [CrossRef]
- Vasileiou, G.; Costa, M.J.; Long, C.; Wetzler, I.R.; Hoyer, J.; Kraus, C.; Popp, B.; Emons, J.; Wunderle, M.; Wenkel, E.; et al. Breast MRI Texture Analysis for Prediction of BRCA-Associated Genetic Risk. BMC Med. Imaging 2020, 20, 86. [Google Scholar] [CrossRef]
- Lambin, P.; Rios-Velazquez, E.; Leijenaar, R.; Carvalho, S.; van Stiphout, R.G.P.M.; Granton, P.; Zegers, C.M.L.; Gillies, R.; Boellard, R.; Dekker, A.; et al. Radiomics: Extracting More Information from Medical Images Using Advanced Feature Analysis. Eur. J. Cancer 2012, 48, 441–446. [Google Scholar] [CrossRef]
- Conti, A.; Duggento, A.; Indovina, I.; Guerrisi, M.; Toschi, N. Radiomics in Breast Cancer Classification and Prediction. Semin. Cancer Biol. 2021, 72, 238–250. [Google Scholar] [CrossRef]
- Siviengphanom, S.; Gandomkar, Z.; Lewis, S.J.; Brennan, P.C. Mammography-Based Radiomics in Breast Cancer: A Scoping Review of Current Knowledge and Future Needs. Acad. Radiol. 2022, 29, 1228–1247. [Google Scholar] [CrossRef]
- Wang, G.; Shi, D.; Guo, Q.; Zhang, H.; Wang, S.; Ren, K. Radiomics Based on Digital Mammography Helps to Identify Mammographic Masses Suspicious for Cancer. Front. Oncol. 2022, 12, 843436. [Google Scholar] [CrossRef]
- Zhou, C.; Xie, H.; Zhu, F.; Yan, W.; Yu, R.; Wang, Y. Improving the Malignancy Prediction of Breast Cancer Based on the Integration of Radiomics Features from Dual-View Mammography and Clinical Parameters. Clin. Exp. Med. 2022, 23, 2357–2368. [Google Scholar] [CrossRef]
- Son, J.; Lee, S.E.; Kim, E.-K.; Kim, S. Prediction of Breast Cancer Molecular Subtypes Using Radiomics Signatures of Synthetic Mammography from Digital Breast Tomosynthesis. Sci. Rep. 2020, 10, 21566. [Google Scholar] [CrossRef] [PubMed]
- Ma, W.; Zhao, Y.; Ji, Y.; Guo, X.; Jian, X.; Liu, P.; Wu, S. Breast Cancer Molecular Subtype Prediction by Mammographic Radiomic Features. Acad. Radiol. 2019, 26, 196–201. [Google Scholar] [CrossRef] [PubMed]
- Tamez-Peña, J.-G.; Rodriguez-Rojas, J.-A.; Gomez-Rueda, H.; Celaya-Padilla, J.-M.; Rivera-Prieto, R.-A.; Palacios-Corona, R.; Garza-Montemayor, M.; Cardona-Huerta, S.; Treviño, V. Radiogenomics Analysis Identifies Correlations of Digital Mammography with Clinical Molecular Signatures in Breast Cancer. PLoS ONE 2018, 13, e0193871. [Google Scholar] [CrossRef]
- Jiang, X.; Zou, X.; Sun, J.; Zheng, A.; Su, C. A Nomogram Based on Radiomics with Mammography Texture Analysis for the Prognostic Prediction in Patients with Triple-Negative Breast Cancer. Contrast Media Mol. Imaging 2020, 2020, 5418364. [Google Scholar] [CrossRef]
- Onega, T.; Beaber, E.F.; Sprague, B.L.; Barlow, W.E.; Haas, J.S.; Tosteson, A.N.A.; Schnall, M.D.; Armstrong, K.; Schapira, M.M.; Geller, B.; et al. Breast Cancer Screening in an Era of Personalized Regimens: A Conceptual Model and National Cancer Institute Initiative for Risk-Based and Preference-Based Approaches at a Population Level. Cancer 2014, 120, 2955–2964. [Google Scholar] [CrossRef]
- Zheng, Y.; Keller, B.M.; Ray, S.; Wang, Y.; Conant, E.F.; Gee, J.C.; Kontos, D. Parenchymal Texture Analysis in Digital Mammography: A Fully Automated Pipeline for Breast Cancer Risk Assessment. Med. Phys. 2015, 42, 4149–4160. [Google Scholar] [CrossRef]
- Breast Cancer Association Consortium; Dorling, L.; Carvalho, S.; Allen, J.; González-Neira, A.; Luccarini, C.; Wahlström, C.; Pooley, K.A.; Parsons, M.T.; Fortuno, C.; et al. Breast Cancer Risk Genes—Association Analysis in More than 113,000 Women. N. Engl. J. Med. 2021, 384, 428–439. [Google Scholar] [CrossRef]
- Collaborative Group on Hormonal Factors in Breast Cancer. Menarche, Menopause, and Breast Cancer Risk: Individual Participant Meta-Analysis, Including 118 964 Women with Breast Cancer from 117 Epidemiological Studies. Lancet Oncol. 2012, 13, 1141–1151. [Google Scholar] [CrossRef]
- Lahmann, P.H.; Lissner, L.; Gullberg, B.; Olsson, H.; Berglund, G. A Prospective Study of Adiposity and Postmenopausal Breast Cancer Risk: The Malmö Diet and Cancer Study. Int. J. Cancer 2003, 103, 246–252. [Google Scholar] [CrossRef]
- Macacu, A.; Autier, P.; Boniol, M.; Boyle, P. Active and Passive Smoking and Risk of Breast Cancer: A Meta-Analysis. Breast Cancer Res. Treat. 2015, 154, 213–224. [Google Scholar] [CrossRef]
- Ragusi, M.A.A.; van der Velden, B.H.M.; Meeuwis, C.; Tetteroo, E.; Coerkamp, E.G.; van Nijnatten, T.J.A.; Jansen, F.H.; Wolters-van der Ben, E.J.M.; Jongen, L.; van Raamt, F.; et al. Long-Term Survival in Breast Cancer Patients Is Associated with Contralateral Parenchymal Enhancement at MRI: Outcomes of the SELECT Study. Radiology 2023, 307, e221922. [Google Scholar] [CrossRef]
- Halling-Brown, M.D.; Warren, L.M.; Ward, D.; Lewis, E.; Mackenzie, A.; Wallis, M.G.; Wilkinson, L.S.; Given-Wilson, R.M.; McAvinchey, R.; Young, K.C. OPTIMAM Mammography Image Database: A Large-Scale Resource of Mammography Images and Clinical Data. Radiol. Artif. Intell. 2021, 3, e200103. [Google Scholar] [CrossRef]
- Otsu, N. A Threshold Selection Method from Gray-Level Histograms. IEEE Trans. Syst. Man Cybern. 1979, 9, 62–66. [Google Scholar] [CrossRef]
- Tang, F.-H.; Xue, C.; Law, M.Y.; Wong, C.-Y.; Cho, T.-H.; Lai, C.-K. Prognostic Prediction of Cancer Based on Radiomics Features of Diagnostic Imaging: The Performance of Machine Learning Strategies. J. Digit. Imaging 2023, 36, 1081–1090. [Google Scholar] [CrossRef]
- Mao, Y.; Keller, E.T.; Garfield, D.H.; Shen, K.; Wang, J. Stromal Cells in Tumor Microenvironment and Breast Cancer. Cancer Metastasis Rev. 2013, 32, 303–315. [Google Scholar] [CrossRef] [PubMed]
- Dembrower, K.; Liu, Y.; Azizpour, H.; Eklund, M.; Smith, K.; Lindholm, P.; Strand, F. Comparison of a Deep Learning Risk Score and Standard Mammographic Density Score for Breast Cancer Risk Prediction. Radiology 2020, 294, 265–272. [Google Scholar] [CrossRef] [PubMed]
- Haralick, R.M.; Shanmugam, K.; Dinstein, I.H. Textural Features for Image Classification. IEEE Trans. Syst. Man Cybernitics 1973, SMC-3, 610–621. [Google Scholar] [CrossRef]
- Cuzick, J.; Sestak, I.; Forbes, J.F.; Dowsett, M.; Cawthorn, S.; Mansel, R.E.; Loibl, S.; Bonanni, B.; Evans, D.G.; Howell, A.; et al. Use of Anastrozole for Breast Cancer Prevention (IBIS-II): Long-Term Results of a Randomised Controlled Trial. Lancet 2020, 395, 117–122. [Google Scholar] [CrossRef]
- Li, X.; You, R.; Wang, X.; Liu, C.; Xu, Z.; Zhou, J.; Yu, B.; Xu, T.; Cai, H.; Zou, Q. Effectiveness of Prophylactic Surgeries in BRCA1 or BRCA2 Mutation Carriers: A Meta-Analysis and Systematic Review. Clin. Cancer Res. 2016, 22, 3971–3981. [Google Scholar] [CrossRef]
- Brentnall, A.R.; Harkness, E.F.; Astley, S.M.; Donnelly, L.S.; Stavrinos, P.; Sampson, S.; Fox, L.; Sergeant, J.C.; Harvie, M.N.; Wilson, M.; et al. Mammographic Density Adds Accuracy to Both the Tyrer-Cuzick and Gail Breast Cancer Risk Models in a Prospective UK Screening Cohort. Breast Cancer Res. 2015, 17, 147. [Google Scholar] [CrossRef]


| Manufacturer of Mammography | Malignant | Normal |
|---|---|---|
| Hologic | 3403 (85.1%) | 920 (92.0%) |
| GE | 128 (3.2%) | 43 (4.3%) |
| Philips | 341 (8.5%) | 13 (1.3%) |
| SIEMENS | 126 (3.2%) | 23 (2.3%) |
| Sectra Imtec | 0 (0.0%) | 1 (0.1%) |
| No image | 2 (0.1%) | 0 (0.0%) |
| All | 4000 | 1000 |
| Reasons for Exclusion of Cases | |
|---|---|
| Malignant Case (n = 785) | Normal Case (n = 104) |
| Not Hologic (n = 595) | Not Hologic (n = 80) |
| Incidence of bilateral breast cancer (n = 123) | Breast implant (n = 12) |
| No healthy side images (n = 39) | Inadequate follow-up period (n = 7) |
| Breast implant (n = 13) | Image only of one side (n = 4) |
| Large breast (n = 7) | Foreign body reaction (n = 1) |
| Surgical history (n = 4) | |
| Artificial object (n = 2) | |
| Malignant Group | Normal Group | |||||
|---|---|---|---|---|---|---|
| Age | Right | Left | All | Right | Left | All |
| <40 | 0 | 1 | 1 | 0 | 0 | 0 |
| 40≤, <50 | 117 | 110 | 227 | 101 | 101 | 202 |
| 50≤, <60 | 603 | 612 | 1215 | 457 | 457 | 914 |
| 60≤, <70 | 663 | 643 | 1306 | 312 | 312 | 624 |
| 70≤ | 240 | 227 | 467 | 26 | 26 | 52 |
| All cases | 1623 | 1592 | 3215 | 896 | 896 | 1792 |
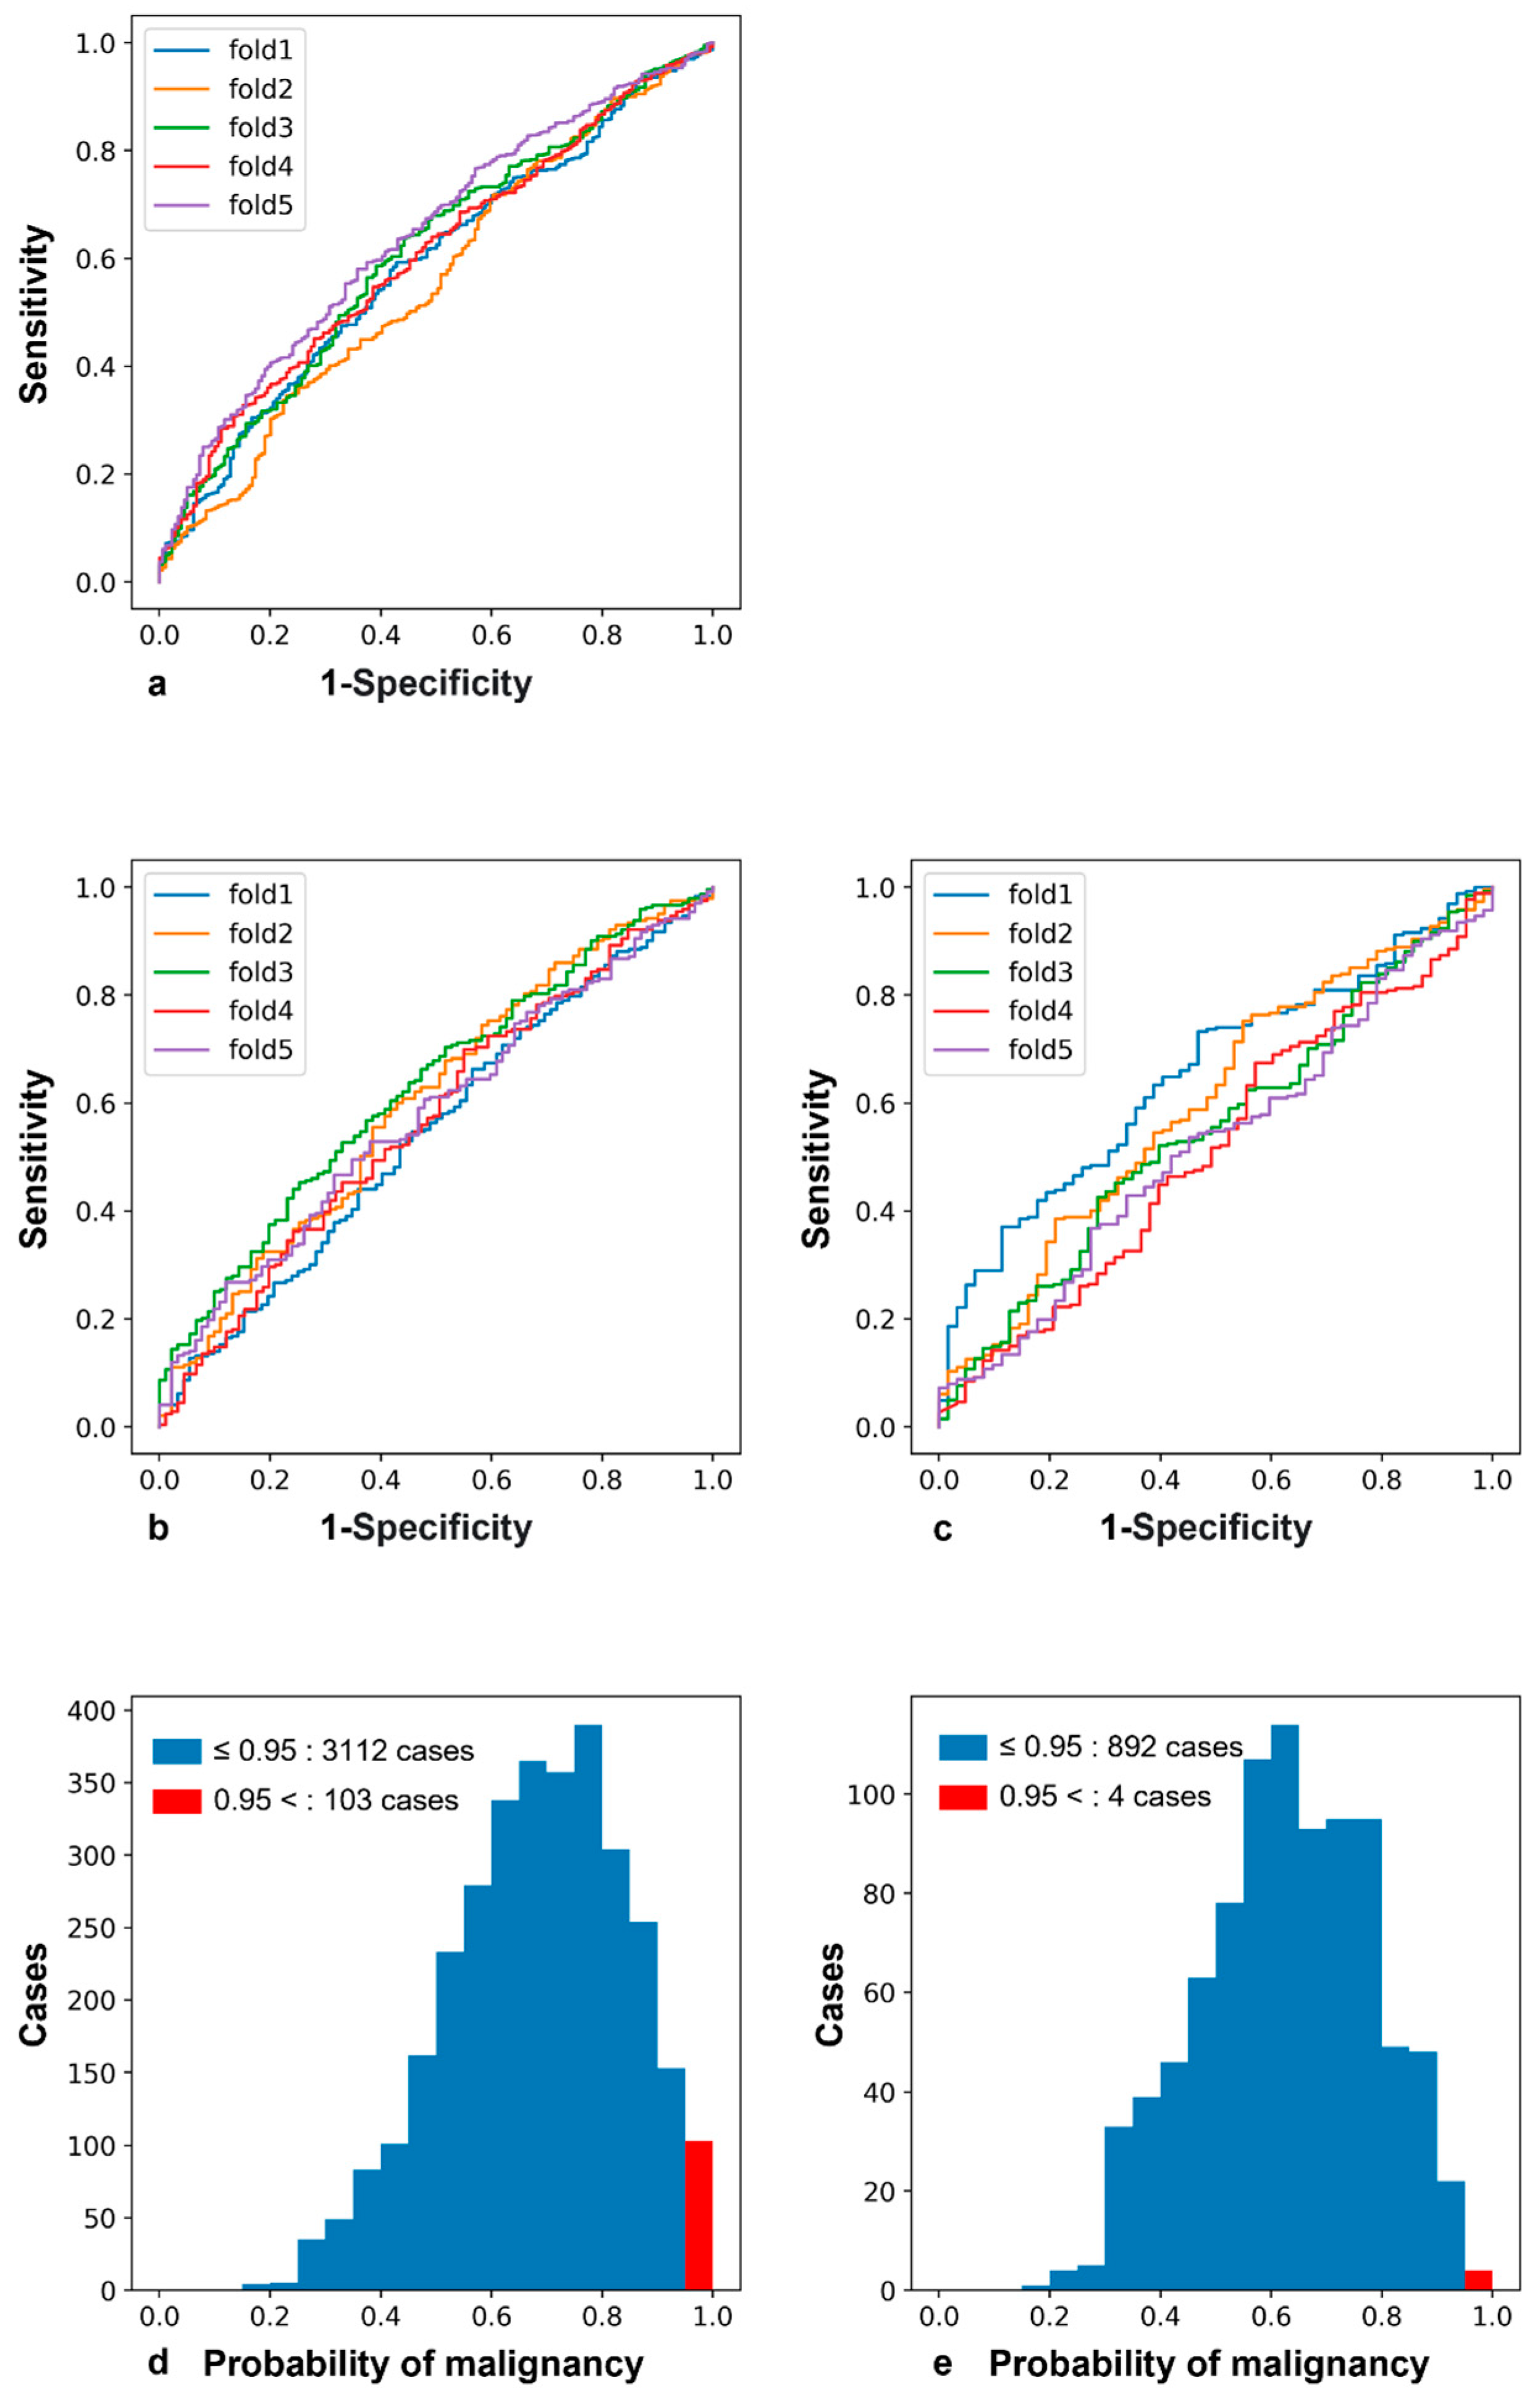
| Area under the Curve | Accuracy | |||||
|---|---|---|---|---|---|---|
| Fold | 50s | 60s | All Cases | 50s | 60s | All Cases |
| fold 1 | 0.54701 | 0.65452 | 0.58894 | 0.64478 | 0.72840 | 0.71203 |
| fold 2 | 0.60367 | 0.59813 | 0.55970 | 0.67365 | 0.75309 | 0.72384 |
| fold 3 | 0.62954 | 0.55099 | 0.60930 | 0.68862 | 0.75309 | 0.72141 |
| fold 4 | 0.56994 | 0.51286 | 0.60561 | 0.63174 | 0.68210 | 0.72384 |
| fold 5 | 0.57981 | 0.52274 | 0.64254 | 0.64072 | 0.75232 | 0.72749 |
| Average | 0.58599 | 0.56785 | 0.60122 | 0.65590 | 0.73380 | 0.72172 |
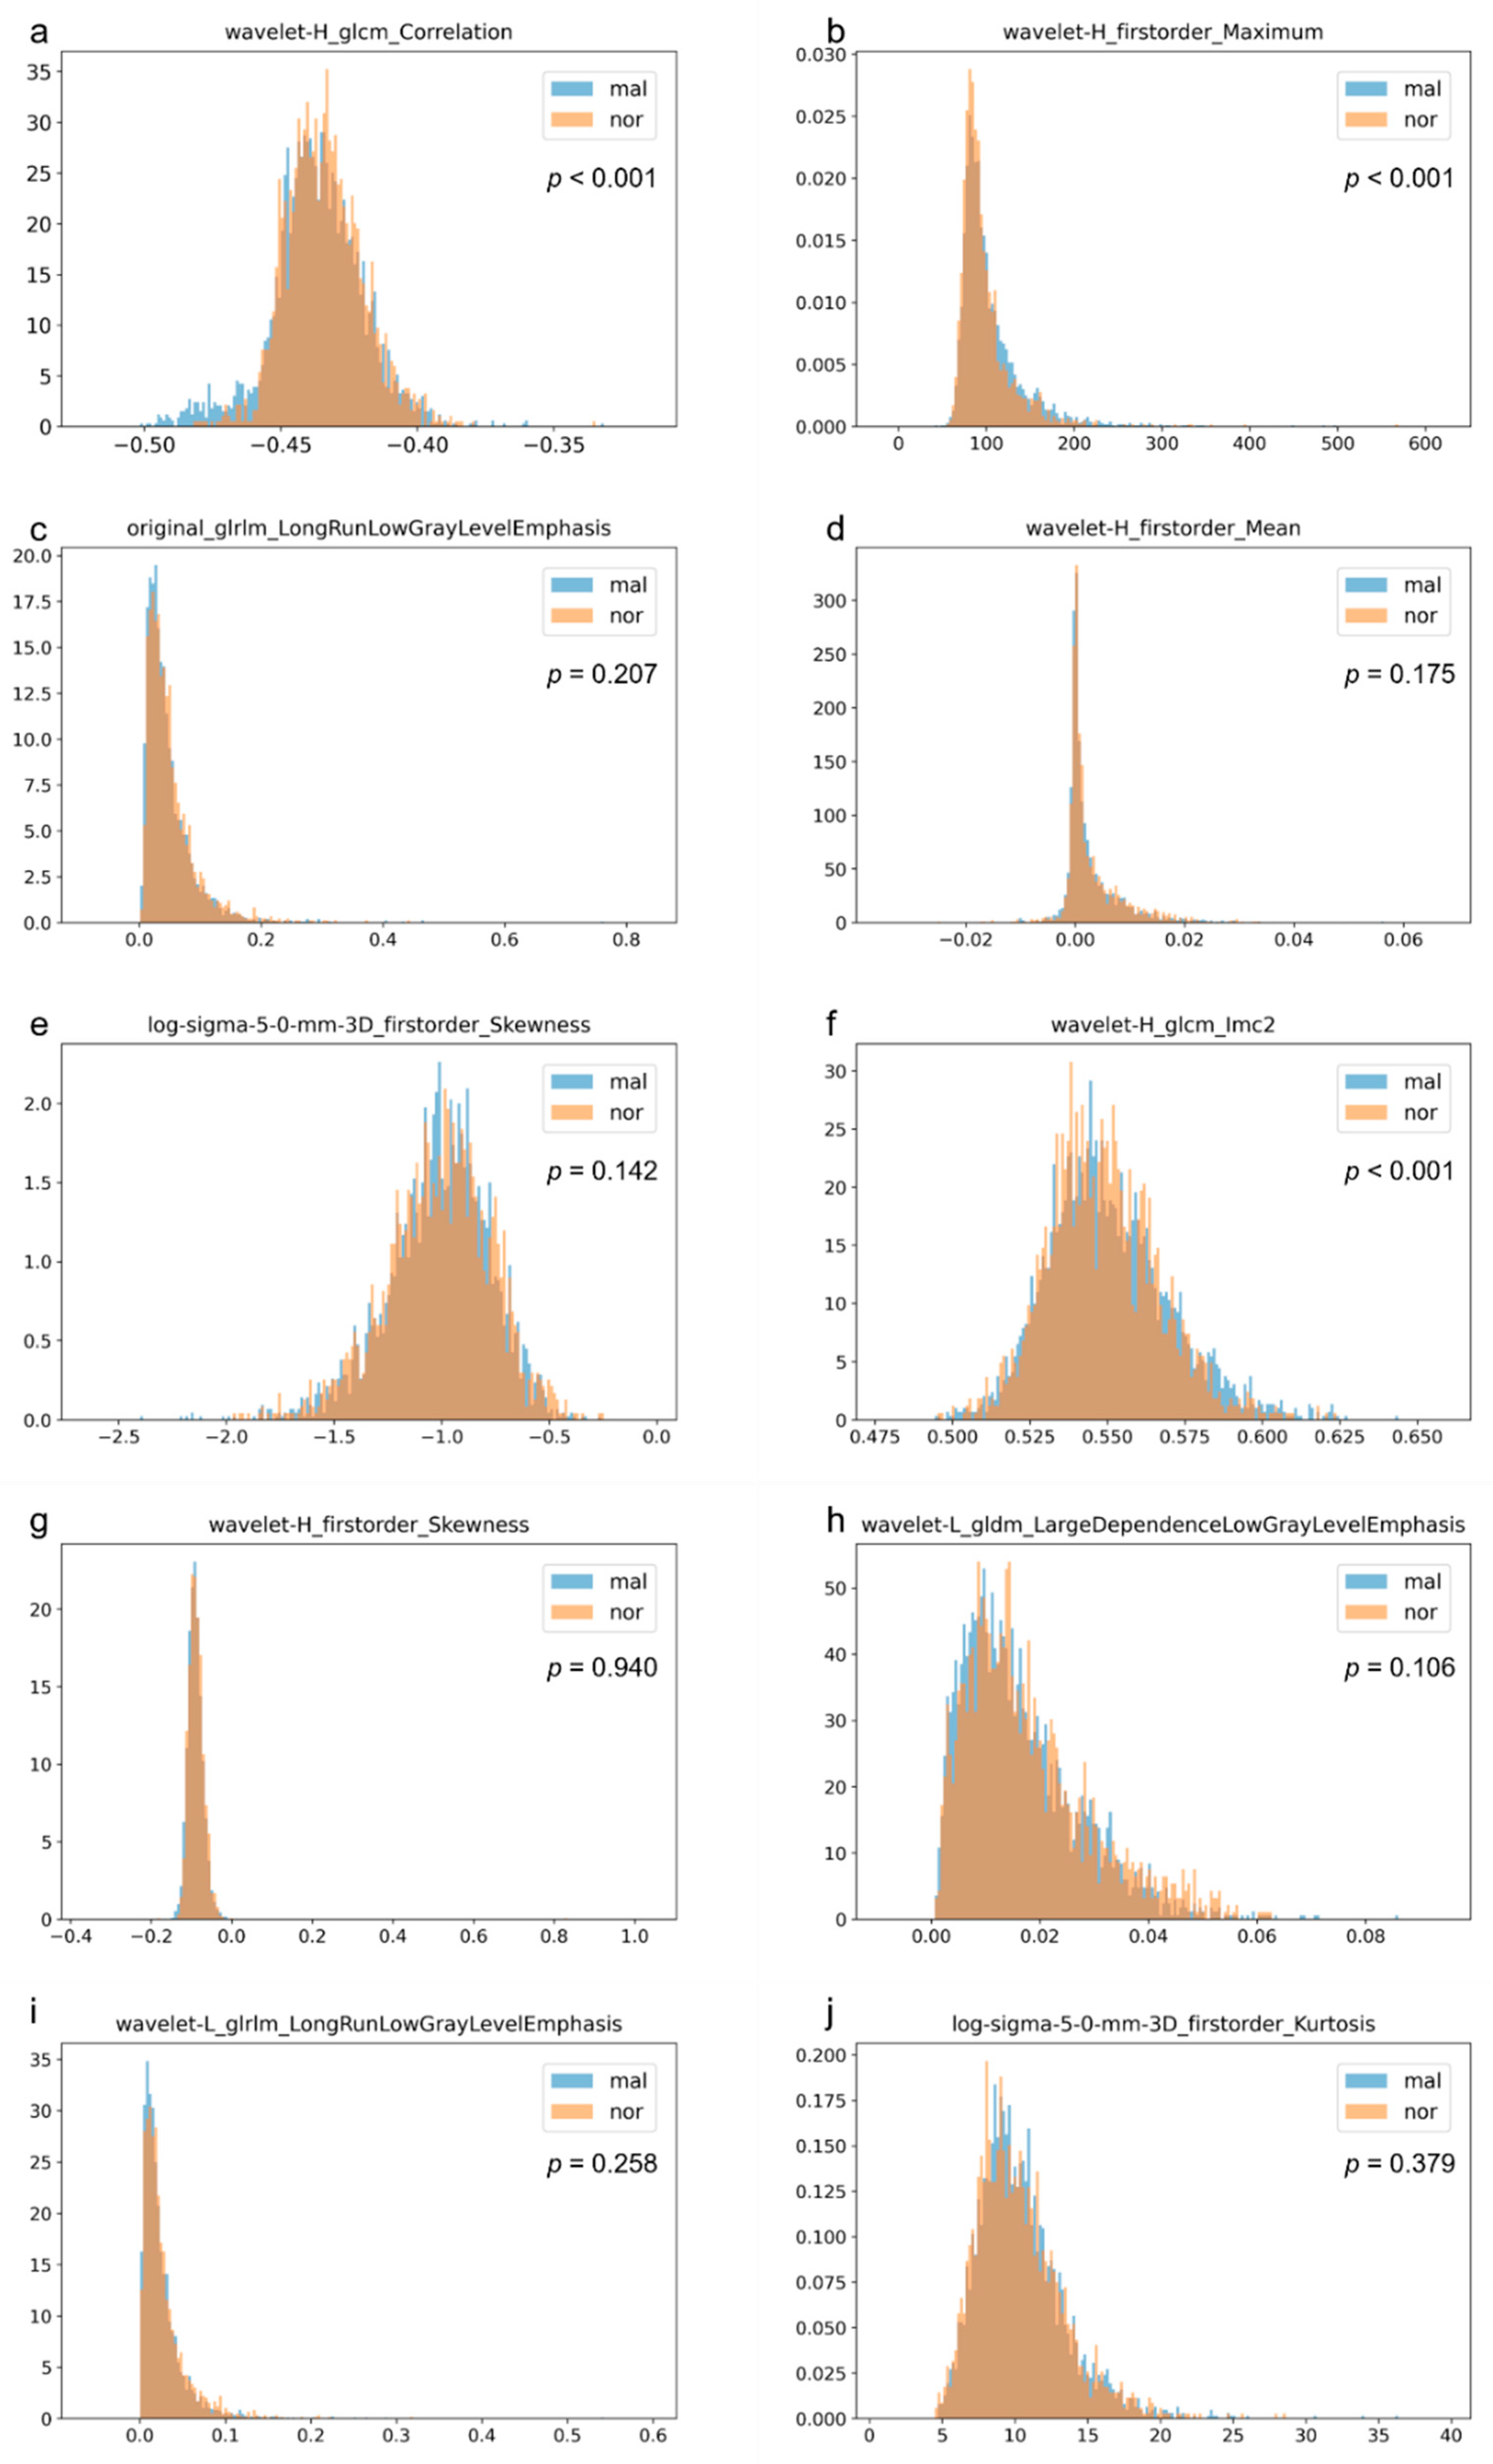
| Radiomics Features Name | ||
|---|---|---|
| fold 1 | fold 2 | |
| 1 | wavelet-H_firstorder_Mean | log-sigma-5-0-mm_firstorder_Skewness |
| 2 | wavelet-H_glcm_Correlation | wavelet-H_firstorder_Maximum |
| 3 | wavelet-H_firstorder_Maximum | original_glrlm_LongRunLowGrayLevelEmphasis |
| 4 | wavelet-H_glcm_Imc2 | wavelet-H_glcm_Correlation |
| 5 | log-sigma-2-0-mm_firstorder_Mean | original_glcm_Idmn |
| 6 | wavelet-L_gldm_LargeDependenceLowGrayLevelEmphasis | wavelet-H_firstorder_Mean |
| 7 | log-sigma-5-0-mm_firstorder_Kurtosis | wavelet-H_glrlm_RunVariance |
| 8 | wavelet-H_ngtdm_Complexity | log-sigma-5-0-mm_firstorder_Kurtosis |
| 9 | wavelet-H_ngtdm_Contrast | log-sigma-4-0-mm_firstorder_Mean |
| 10 | log-sigma-3-0-mm_firstorder_Maximum | log-sigma-5-0-mm_firstorder_Maximum |
| fold 3 | fold 4 | |
| 1 | wavelet-H_firstorder_Maximum | wavelet-H_glcm_Correlation |
| 2 | wavelet-H_glcm_Correlation | wavelet-H_firstorder_Mean |
| 3 | wavelet-H_firstorder_Skewness | original_glrlm_LongRunLowGrayLevelEmphasis |
| 4 | original_glrlm_LongRunLowGrayLevelEmphasis | log-sigma-5-0-mm_firstorder_Skewness |
| 5 | wavelet-H_glcm_ClusterShade | wavelet-L_glrlm_ShortRunLowGrayLevelEmphasis |
| 6 | original_glrlm_ShortRunLowGrayLevelEmphasis | wavelet-H_firstorder_Maximum |
| 7 | wavelet-L_glrlm_LongRunLowGrayLevelEmphasis | log-sigma-2-0-mm_firstorder_Mean |
| 8 | log-sigma-5-0-mm_firstorder_Skewness | wavelet-H_firstorder_Median |
| 9 | log-sigma-3-0-mm_firstorder_Median | wavelet-H_ngtdm_Contrast |
| 10 | log-sigma-2-0-mm_ngtdm_Strength | wavelet-L_glrlm_LongRunLowGrayLevelEmphasis |
| fold 5 | ||
| 1 | wavelet-H_glcm_Correlation | |
| 2 | original_glrlm_LongRunLowGrayLevelEmphasis | |
| 3 | wavelet-H_firstorder_Maximum | |
| 4 | wavelet-H_glcm_ClusterShade | |
| 5 | original_shape2D_MaximumDiameter | |
| 6 | wavelet-L_gldm_LargeDependenceLowGrayLevelEmphasis | |
| 7 | log-sigma-5-0-mm_firstorder_Maximum | |
| 8 | wavelet-H_glcm_Imc2 | |
| 9 | log-sigma-2-0-mm_firstorder_Skewness | |
| 10 | original_glcm_Idmn | |
Disclaimer/Publisher’s Note: The statements, opinions and data contained in all publications are solely those of the individual author(s) and contributor(s) and not of MDPI and/or the editor(s). MDPI and/or the editor(s) disclaim responsibility for any injury to people or property resulting from any ideas, methods, instructions or products referred to in the content. |
© 2023 by the authors. Licensee MDPI, Basel, Switzerland. This article is an open access article distributed under the terms and conditions of the Creative Commons Attribution (CC BY) license (https://creativecommons.org/licenses/by/4.0/).
Share and Cite
Suzuki, Y.; Hanaoka, S.; Tanabe, M.; Yoshikawa, T.; Seto, Y. Predicting Breast Cancer Risk Using Radiomics Features of Mammography Images. J. Pers. Med. 2023, 13, 1528. https://doi.org/10.3390/jpm13111528
Suzuki Y, Hanaoka S, Tanabe M, Yoshikawa T, Seto Y. Predicting Breast Cancer Risk Using Radiomics Features of Mammography Images. Journal of Personalized Medicine. 2023; 13(11):1528. https://doi.org/10.3390/jpm13111528
Chicago/Turabian StyleSuzuki, Yusuke, Shouhei Hanaoka, Masahiko Tanabe, Takeharu Yoshikawa, and Yasuyuki Seto. 2023. "Predicting Breast Cancer Risk Using Radiomics Features of Mammography Images" Journal of Personalized Medicine 13, no. 11: 1528. https://doi.org/10.3390/jpm13111528
APA StyleSuzuki, Y., Hanaoka, S., Tanabe, M., Yoshikawa, T., & Seto, Y. (2023). Predicting Breast Cancer Risk Using Radiomics Features of Mammography Images. Journal of Personalized Medicine, 13(11), 1528. https://doi.org/10.3390/jpm13111528