
The Strange Case of Orotic Acid: The Different Expression of Pyrimidines Biosynthesis in Healthy Males and Females


 , , , and
Abstract
:
1. Introduction
2. Methods
2.1. Materials and Analytes
2.2. Standard and Quality Controls
2.3. Standards, Quality Controls and Patients Samples Extraction
2.4. Chromatographic Conditions
2.5. Mass Spectrometry Conditions
2.6. Method Validation
2.6.1. Analytical Selectivity and Specificity
2.6.2. Calibration
2.6.3. Repeatability and Reproducibility
2.6.4. Precision Evaluation
2.6.5. Method Robustness ad Matrix Effect
2.6.6. Stability
2.7. Enrollment Patients
- Tabagism
- Active drug addiction, alcohol dependence and regular intake of psychodrugs
- Taking therapies within 30 days before the date of the estrogen and progestin collection even at low dosage
- Renal failure
- Liver failure
- Subjects undergoing transplantation of liver, kidneys, heart and lungs
- Subjects undergoing prosthetic limb surgery within the previous 24 months
- People with inherited metabolic disorders
- Sepsi in progress or recent
- Coagulation disorders or thrombophlebitis in progress
- Subjects suffering from dyslipidemic diseases, dismetabolic or other known diabetes
- Presence of abdominal surgery in the last 24 months
- Pregnant women
- Presence of acute and/or chronic inflammatory or inflammatory pathology in the presence or absence of treatment with NSAIDs (including acetaminophen), glucocorticoids, immunomodulators and antibiotics
- Taking supplements based on vitamins (group B, C, D, E, niacin) and omega-3
- Presence of known cardiovascular, hepatic, renal and pneumological pathologies
- Presence of oncological pathologies of any nature.
3. Results
4. Discussion
5. Conclusions
Author Contributions
Funding
Institutional Review Board Statement
Informed Consent Statement
Data Availability Statement
Conflicts of Interest
Abbreviations
| 5-FU | 5-Fluorouracil |
| ADP | Adenosindiphosphate |
| Asp | Aspartic Acid |
| ATP | Adenosintriphosphate |
| CA | Carbamoylaspartate |
| CAD | Carbamoyl-Phosphate Synthetase 2 |
| CP | Carbamoylphosphate |
| CV% | Coefficient of Variation |
| CYP | Cytochrome P450 |
| DHU | Dihydrouridine |
| DO | Dihydro-orotic Acid |
| EQA | External Quality Assessment |
| ESI | Electrospray Ionization |
| FMN | Flavinmononucleotide |
| FMNH2 | Flavinmononucleotide Reduced |
| GC | Gas Chromatography |
| Gln | Glutamine |
| Glu | Glutamic Acid |
| HETP | Height Equivalent to a Theoretical Plate |
| HPLC | High-Performance Liquid Chromatography |
| ICH | International Conference on Harmonization |
| IF | Confidence Interval |
| IQR | Interquartile Range |
| IS | Internal Standard |
| LC | Liquid Chromatography |
| LEV0 | Blank Sample |
| LLOQ | Lower Limit of Quantification |
| LOD | Limit of Quantification |
| LOQ | Limit of Detection |
| MS/MS | Tandem Mass Spectrometry |
| MS | Mass Spectrometry |
| NMR | Nuclear Magnetic Resonance |
| OA | Orotic Acid |
| OGA | 2-oxoglutaric Acid |
| OMP | Orotidine-5′- mono-phosphate |
| OMPdecase | Orotidine 5′-phosphate Decarboxylase |
| OPRTase | Orotate Phosphoribosyltransferase |
| Pi | Phosphate |
| PPi | Pyrophosphate |
| QC | Quality Control |
| R(%) | Recovery Percentage |
| R | Repeatability Coefficient |
| R2 | Determination Coefficient |
| RF | Response Factor |
| Rsdr | Relative Standard Deviation on Repeatability |
| RSDR | Relative Standard Deviation on Reproducibility |
| sR | Standard Deviation on Repeatability |
| STD | Standard |
| SUA | Succinic Acid |
| UGT | Uridine Diphosphate Glucuronosyltransferases |
| UHPLC | Ultra-High-Performance Liquid Chromatography |
| ULOQ | Upper Limit of Quantification |
| UMP | Uridine—5′—monophosphate |
| Xm | Mean Value of Calculated Concentration |
References
- Iwahana, H.; Fujimura, M.; Ii, S.; Kondo, M.; Moritani, M.; Takahashi, Y.; Yamaoka, T.; Yoshimoto, K.; Itakura, M. Molecular cloning of a human cDNA encoding a trifunctional enzyme of carbamoyl-phosphate synthetase-aspartate transcarbamoylase-dihydroorotase in de Novo pyrimidine synthesis. Biochem. Biophys. Res. Commun. 1996, 219, 249–255. [Google Scholar] [CrossRef] [PubMed]
- Li, G.; Li, D.; Wang, T.; He, S. Pyrimidine Biosynthetic Enzyme CAD: Its Function, Regulation, and Diagnostic Potential. Int. J. Mol. Sci. 2021, 22, 10253. [Google Scholar] [CrossRef] [PubMed]
- Traut, T.W.; Jones, M.E. Inhibitors of orotate phosphoribosyl-transferase and orotidine-5’-phosphate decarboxylase from mouse Ehrlich ascites cells: A procedure for analyzing the inhibition of a multi-enzyme complex. Biochem. Pharmacol. 1977, 26, 2291–2296. [Google Scholar] [CrossRef] [PubMed]
- Tanaka, T. Quantitative analysis of the enzymes associated with 5-fluorouracil metabolism in prostate cancer biopsies. Methods Mol. Biol. 2011, 755, 301–305. [Google Scholar] [CrossRef]
- Silverman, R.B.; Holladay, M.W. Enzyme Inhibition and Inactivation. In The Organic Chemistry of Drug Design and Drug Action, 3rd ed.; Academic Press: Cambridge, MA, USA, 2015; Chapter 5. [Google Scholar]
- Lotz, M.; Fallon, H.J.; Smith, L.H. Excretion of Orotic Acid and Orotidine in Heterozygotes of Congenital Orotic Aciduria. Nature 1963, 197, 194–195. [Google Scholar] [CrossRef]
- Al Absi, H.S.; Sacharow, S.; Al Zein, N.; Al Shamsi, A.; Al Teneiji, A. Hereditary orotic aciduria (HOA): A novel uridine-5-monophosphate synthase. Mol. Genet. Metab. Rep. 2021, 26, 100703. [Google Scholar] [CrossRef]
- Wortmann, S.B.; Chen, M.A.; Colombo, R.; Pontoglio, A.; Alhaddad, B.; Botto, L.D.; Yuzyuk, T.; Coughlin, C.R.; Descartes, M.; Grűnewald, S.; et al. Mild orotic aciduria in UMPS heterozygotes: A metabolic finding without clinical consequences. J. Inherit. Metab. Dis. 2017, 40, 423–431. [Google Scholar] [CrossRef]
- Monostori, P.; Klinke, G.; Hauke, J.; Richter, S.; Bierau, J.; Garbade, S.F.; Hoffmann, G.F.; Langhans, C.D.; Haas, D.; Okun, J.G. Extended diagnosis of purine and pyrimidine disorders from urine: LC MS/MS assay development and clinical validation. PLoS ONE 2019, 14, e0212458. [Google Scholar] [CrossRef]
- D’Apolito, O.; Garofalo, D.; Paglia, G.; Zuppaldi, A.; Corso, G. Orotic acid quantification in dried blood spots and biological fluids by hydrophilic interaction liquid chromatography tandem mass spectrometry. J. Sep. Sci. 2010, 33, 966–973. [Google Scholar] [CrossRef]
- Fu, D.; Liu, Y.; Shen, A.; Xiao, Y.; Yu, L.; Liang, X. Preparation of glutathione-functionalized zwitterionic silica material for efficient enrichment of sialylated N-glycopeptides. Anal. Bioanal. Chem. 2019, 411, 4131–4140. [Google Scholar] [CrossRef]
- Wang, X.; Cui, J.; Zhou, J.; Wang, S.; Gu, Y.; Liu, X. Preparation of polyacrylamide hydrophilic stationary phases with adjustable performance. J. Chromatogr. A 2023, 1702, 464065. [Google Scholar] [CrossRef] [PubMed]
- Ma, Y.R.; Xin, M.Y.; Li, K.; Wang, H.; Rao, Z.; Liu, T.X.; Wu, X.A. An LC-MS/MS analytical method for the determination of uremic toxins in patients with end-stage renal disease. J. Pharm. Biomed. Anal. 2020, 191, 113551. [Google Scholar] [CrossRef]
- Shen, A.; Guo, Z.; Cai, X.; Xue, X.; Liang, X. Preparation and chromatographic evaluation of a cysteine-bonded zwitterionic hydrophilic interaction liquid chromatography stationary phase. J. Chromatogr. A 2012, 1228, 175–182. [Google Scholar] [CrossRef] [PubMed]
- M10: Bioanalytical Method Validation and study Sample Analysis: Guidance for Industry; Center for Drug Evaluation and Research: Silver Spring, MD, USA, 2022.
- Booth, B.; Vazvaei, F.; Fluhler, E.; Myler, H.; Woolf, E. AAPS Workshop Report on ICH M10. AAPS J. 2019, 22, 10. [Google Scholar] [CrossRef] [PubMed]
- Magnusson, B.; Örnemark, U. Eurachem Guide: The Fitness for Purpose of Analytical Methods—A Laboratory Guide to Method Validation and Related Topics. Available online: http://www.eurachem.org (accessed on 5 June 2023).
- Olivieri, A.C. Practical guidelines for reporting results in single- and multi-component analytical calibration: A tutorial. Anal. Chim. Acta 2015, 868, 10–22. [Google Scholar] [CrossRef] [PubMed]
- Hubaux, A.; Vos, G. Decision and Detection Limits for Calibration Curves; American Chemical Society: Washington, DC, USA, 1970. [Google Scholar]
- Ebel, S.; Kühnert, H.; Mück, W. Limits of determination and calibration in HPLC. Chromatographia 1987, 23, 934–938. [Google Scholar] [CrossRef]
- Committee for Human Medicinal Products. ICH Guideline E8 (R1) on General Considerations for Clinical Studies. Available online: https://www.ema.europa.eu/en/documents/scientific-guideline/ich-e-8-general-considerations-clinical-trials-step-5_en.pdf (accessed on 23 September 2023).
- Kesner, L.; Aronson, F.L.; Silverman, M.; Chan, P.C. Determination of orotic and dihydroorotic acids in biological fluids and tissues. Clin. Chem. 1975, 21, 353–355. [Google Scholar] [CrossRef]
- Czauderna, M.; Białek, M.; Molik, E.; Zaworski, K. The Improved Method for Determination of Orotic Acid in Milk by Ultra-Fast Liquid Chromatography with Optimized Photodiode Array Detection. Animals 2021, 11, 3196. [Google Scholar] [CrossRef]
- Destanoğlu, O.; Zeydanlı, D.; Cansever, M.; Yılmaz, G.G. Ion chromatographic method for the determination of orotic acid in urine. Anal. Biochem. 2018, 563, 9–14. [Google Scholar] [CrossRef]
- Cataldi, T.R.; Nardiello, D.; Ciriello, R.; Guerrieri, A. Pulsed electrochemical detection of orotic acid by an activated potential waveform at a gold working electrode following anion-exchange chromatography. J. Chromatogr. A 2006, 1107, 130–138. [Google Scholar] [CrossRef]
- Tavazzi, B.; Lazzarino, G.; Leone, P.; Amorini, A.M.; Bellia, F.; Janson, C.G.; Di Pietro, V.; Ceccarelli, L.; Donzelli, S.; Francis, J.S.; et al. Simultaneous high performance liquid chromatographic separation of purines, pyrimidines, N-acetylated amino acids, and dicarboxylic acids for the chemical diagnosis of inborn errors of metabolism. Clin. Biochem. 2005, 38, 997–1008. [Google Scholar] [CrossRef] [PubMed]
- Wang, S.P.; Liao, C.S. Comparison of ion-pair chromatography and capillary zone electrophoresis for the assay of organic acids as markers of abnormal metabolism. J. Chromatogr. A 2004, 1051, 213–219. [Google Scholar] [CrossRef] [PubMed]
- Bellinger, J.F.; Buist, N.R. Rapid column-chromatographic measurement of orotic acid. Clin. Chem. 1971, 17, 1132–1133. [Google Scholar] [CrossRef] [PubMed]
- Brusilow, S.W.; Hauser, E. Simple method of measurement of orotic acid and orotidine in urine. J. Chromatogr. 1989, 493, 388–391. [Google Scholar] [CrossRef]
- Hauser, E.R.; Finkelstein, J.E.; Valle, D.; Brusilow, S.W. Allopurinol-induced orotidinuria. A test for mutations at the ornithine carbamoyltransferase locus in women. N. Engl. J. Med. 1990, 322, 1641–1645. [Google Scholar] [CrossRef]
- Ferrari, V.; Giordano, G.; Cracco, A.T.; Dussini, N.; Chiandetti, L.; Zacchello, F. Determination of urinary orotate excretion by high-performance liquid chromatography. J. Chromatogr. 1989, 497, 101–107. [Google Scholar] [CrossRef]
- Jakobs, C.; Sweetman, L.; Nyhan, W.L.; Gruenke, L.; Craig, J.C.; Wadman, S.K. Stable isotope dilution analysis of orotic acid and uracil in amniotic fluid. Clin. Chim. Acta 1984, 143, 123–133. [Google Scholar] [CrossRef]
- Calvo, L.; Rodríguez, J.; Vinagre, F.; Sánchez, A. Determination of orotic acid (vitamin B13) in human serum and urine by differential-pulse polarography. Analyst 1988, 113, 321–323. [Google Scholar] [CrossRef]
- Wevers, R.A.; Engelke, U.F.; Moolenaar, S.H.; Bräutigam, C.; de Jong, J.G.; Duran, R.; de Abreu, R.A.; van Gennip, A.H. 1H-NMR spectroscopy of body fluids: Inborn errors of purine and pyrimidine metabolism. Clin. Chem. 1999, 45, 539–548. [Google Scholar] [CrossRef]
- Salerno, C.; Crifò, C. Diagnostic value of urinary orotic acid levels: Applicable separation methods. J. Chromatogr. B Anal. Technol. Biomed. Life Sci. 2002, 781, 57–71. [Google Scholar] [CrossRef]
- Fabbrizzi, L.; Licchelli, M.; Mancin, F.; Pizzeghello, M.; Rabaioli, G.; Taglietti, A.; Tecilla, P.; Tonellato, U. Fluorescence sensing of ionic analytes in water: From transition metal ions to vitamin B13. Chemistry 2002, 8, 94–101. [Google Scholar] [CrossRef] [PubMed]
- Carpenter, K.H.; Potter, M.; Hammond, J.W.; Wilcken, B. Benign persistent orotic aciduria and the possibility of misdiagnosis of ornithine carbamoyltransferase deficiency. J. Inherit. Metab. Dis. 1997, 20, 354–358. [Google Scholar] [CrossRef] [PubMed]
- Scott, D.; Clinton Frazee, C.; Garg, U. Screening of Organic Acidurias by Gas Chromatography-Mass Spectrometry (GC-MS). Methods Mol. Biol. 2022, 2546, 321–333. [Google Scholar] [CrossRef]
- Hayek-Ouassini, M.; Henseling, J.; Löffler, M. Separation ofN-carbamoyl aspartate andl-dihydroorotate from serum by high-performance liquid chromatography with fluorimetric detection. Chromatographia 2002, 55, 411–415. [Google Scholar] [CrossRef]
- Gritti, F.; Guiochon, G. The van Deemter equation: Assumptions, limits, and adjustment to modern high performance liquid chromatography. J. Chromatogr. A 2013, 1302, 1–13. [Google Scholar] [CrossRef]
- Mathur, U.; Bartke, A.; Weisz, J. Effects of prolactin and LH on the activity of delta5-3beta hydroxy-steroid dehydrogenase, dihydro-orotic dehydrogenase, b-hydroxybutyrate dehydrogenase and glucose-6-phosphate dehydrogenase in the testis of the dwarf mice. Indian. J. Physiol. Pharmacol. 1975, 19, 58–64. [Google Scholar] [PubMed]
- Yao, X.; Wang, X.Q.; Ma, S.L.; Chen, B.Y. Electroacupuncture stimulates the expression of prolactin-releasing peptide (PrRP) in the medulla oblongata of ovariectomized rats. Neurosci. Lett. 2007, 411, 243–248. [Google Scholar] [CrossRef] [PubMed]
- Anderson, G.D. Gender differences in pharmacological response. Int. Rev. Neurobiol. 2008, 83, 1–10. [Google Scholar] [CrossRef]
- Lane, J.R.; Connor, J.D. The influence of endogenous and exogenous sex hormones in adolescents with attention to oral contraceptives and anabolic steroids. J. Adolesc. Health 1994, 15, 630–634. [Google Scholar] [CrossRef]
- Parish, R.C.; Spivey, C. Influence of menstrual cycle phase on serum concentrations of alpha 1-acid glycoprotein. Br. J. Clin. Pharmacol. 1991, 31, 197–199. [Google Scholar] [CrossRef]
- Huang, Z.; Ung, T. Effect of alpha-1-acid glycoprotein binding on pharmacokinetics and pharmacodynamics. Curr. Drug Metab. 2013, 14, 226–238. [Google Scholar] [PubMed]
- Flores Pérez, J.; Juárez Olguín, H.; Flores Pérez, C.; Pérez Guillé, G.; Guillé Pérez, A.; Camacho Vieyra, A.; Toledo López, A.; Carrasco Portugal, M.; Lares Asseff, I. Effects of gender and phase of the menstrual cycle on the kinetics of ranitidine in healthy volunteers. Chronobiol. Int. 2003, 20, 485–494. [Google Scholar] [PubMed]
- Wilson, J.T. Developmental pharmacology: A review of its application to clinical and basic science. Annu. Rev. Pharmacol. 1972, 12, 423–457. [Google Scholar] [CrossRef] [PubMed]
- Shen, M.; Shi, H. Sex Hormones and Their Receptors Regulate Liver Energy Homeostasis. Int. J. Endocrinol. 2015, 2015, 294278. [Google Scholar] [CrossRef]
- Xu, L.; Yuan, Y.; Che, Z.; Tan, X.; Wu, B.; Wang, C.; Xu, C.; Xiao, J. The Hepatoprotective and Hepatotoxic Roles of Sex and Sex-Related Hormones. Front. Immunol. 2022, 13, 939631. [Google Scholar] [CrossRef]
- Reale, C.; Invernizzi, F.; Panteghini, C.; Garavaglia, B. Genetics, sex, and gender. J. Neurosci. Res. 2023, 101, 553–562. [Google Scholar] [CrossRef]


| Analyte/Is, Esi+/− | Ion
Quantifier MRM (M/Z) | Ion
Qualifier MRM (M/Z) | Declustering
Potential (V) | Entrance
Potential (V) | Collision Energy
(V) | Collision Cell Exit Potential
(V) |
|---|---|---|---|---|---|---|
| Orotic Acid (−) | 155→111 | −58.74 | −9.51 | −13.34 | −14 | |
| 155→42 | −58.47 | −9.51 | −47.82 | −12.3 | ||
| Amino-Orotic Acid (−) | 170→126 | −64.96 | −14 | −17.09 | −14.09 | |
| 170→83 | −64.96 | −14 | −27.08 | −18.97 | ||
| Creatinine (+) | 114→86 | 130.6 | 10 | 16.68 | 12.09 | |
| 114→58 | 130.6 | 10 | 19.73 | 15.96 |
| Orotic Acid | Creatinine | |||||
|---|---|---|---|---|---|---|
| LEV 1 | LEV 2 | LEV 3 | LEV 1 | LEV 2 | LEV 3 | |
| Mean Value of Calculated Concentration In µmol (Xm) | 0.73 | 1.81 | 12.35 | 600.0 | 2800.0 | 6500.0 |
| Standard Deviation on Repeatability (sr) | 0.07 | 0.33 | 0.19 | 102.6 | 287.7 | 268.1 |
| Confidence Interval (IF) | 1.22 | 3.05 | 20.83 | 1011.5 | 4720.4 | 10958.1 |
| Repeatability Coefficient (r) | 0.27 | 1.35 | 0.77 | 423.7 | 1188.0 | 1107.0 |
| Relative Standard Deviation on Repeatability (RSDR) | 9.09 | 18.03 | 1.50 | 17.1 | 10.3 | 4.1 |
| Relative Standard Deviation on Reproducibility (RSDR) | 16.79 | 14.64 | 10.96 | 6.1 | 4.8 | 4.3 |
| Determination coefficient of Calibration Curve (R2) | 0.999 | 0.998 | ||||
| Limit of Quantification (LOD) | 0.68 | 0.046 | ||||
| Limit of Detection (LOQ) | 1.49 | 0.100 | ||||
| Recovery Percentage (R(%)) | 96.14 | 92.00 | ||||
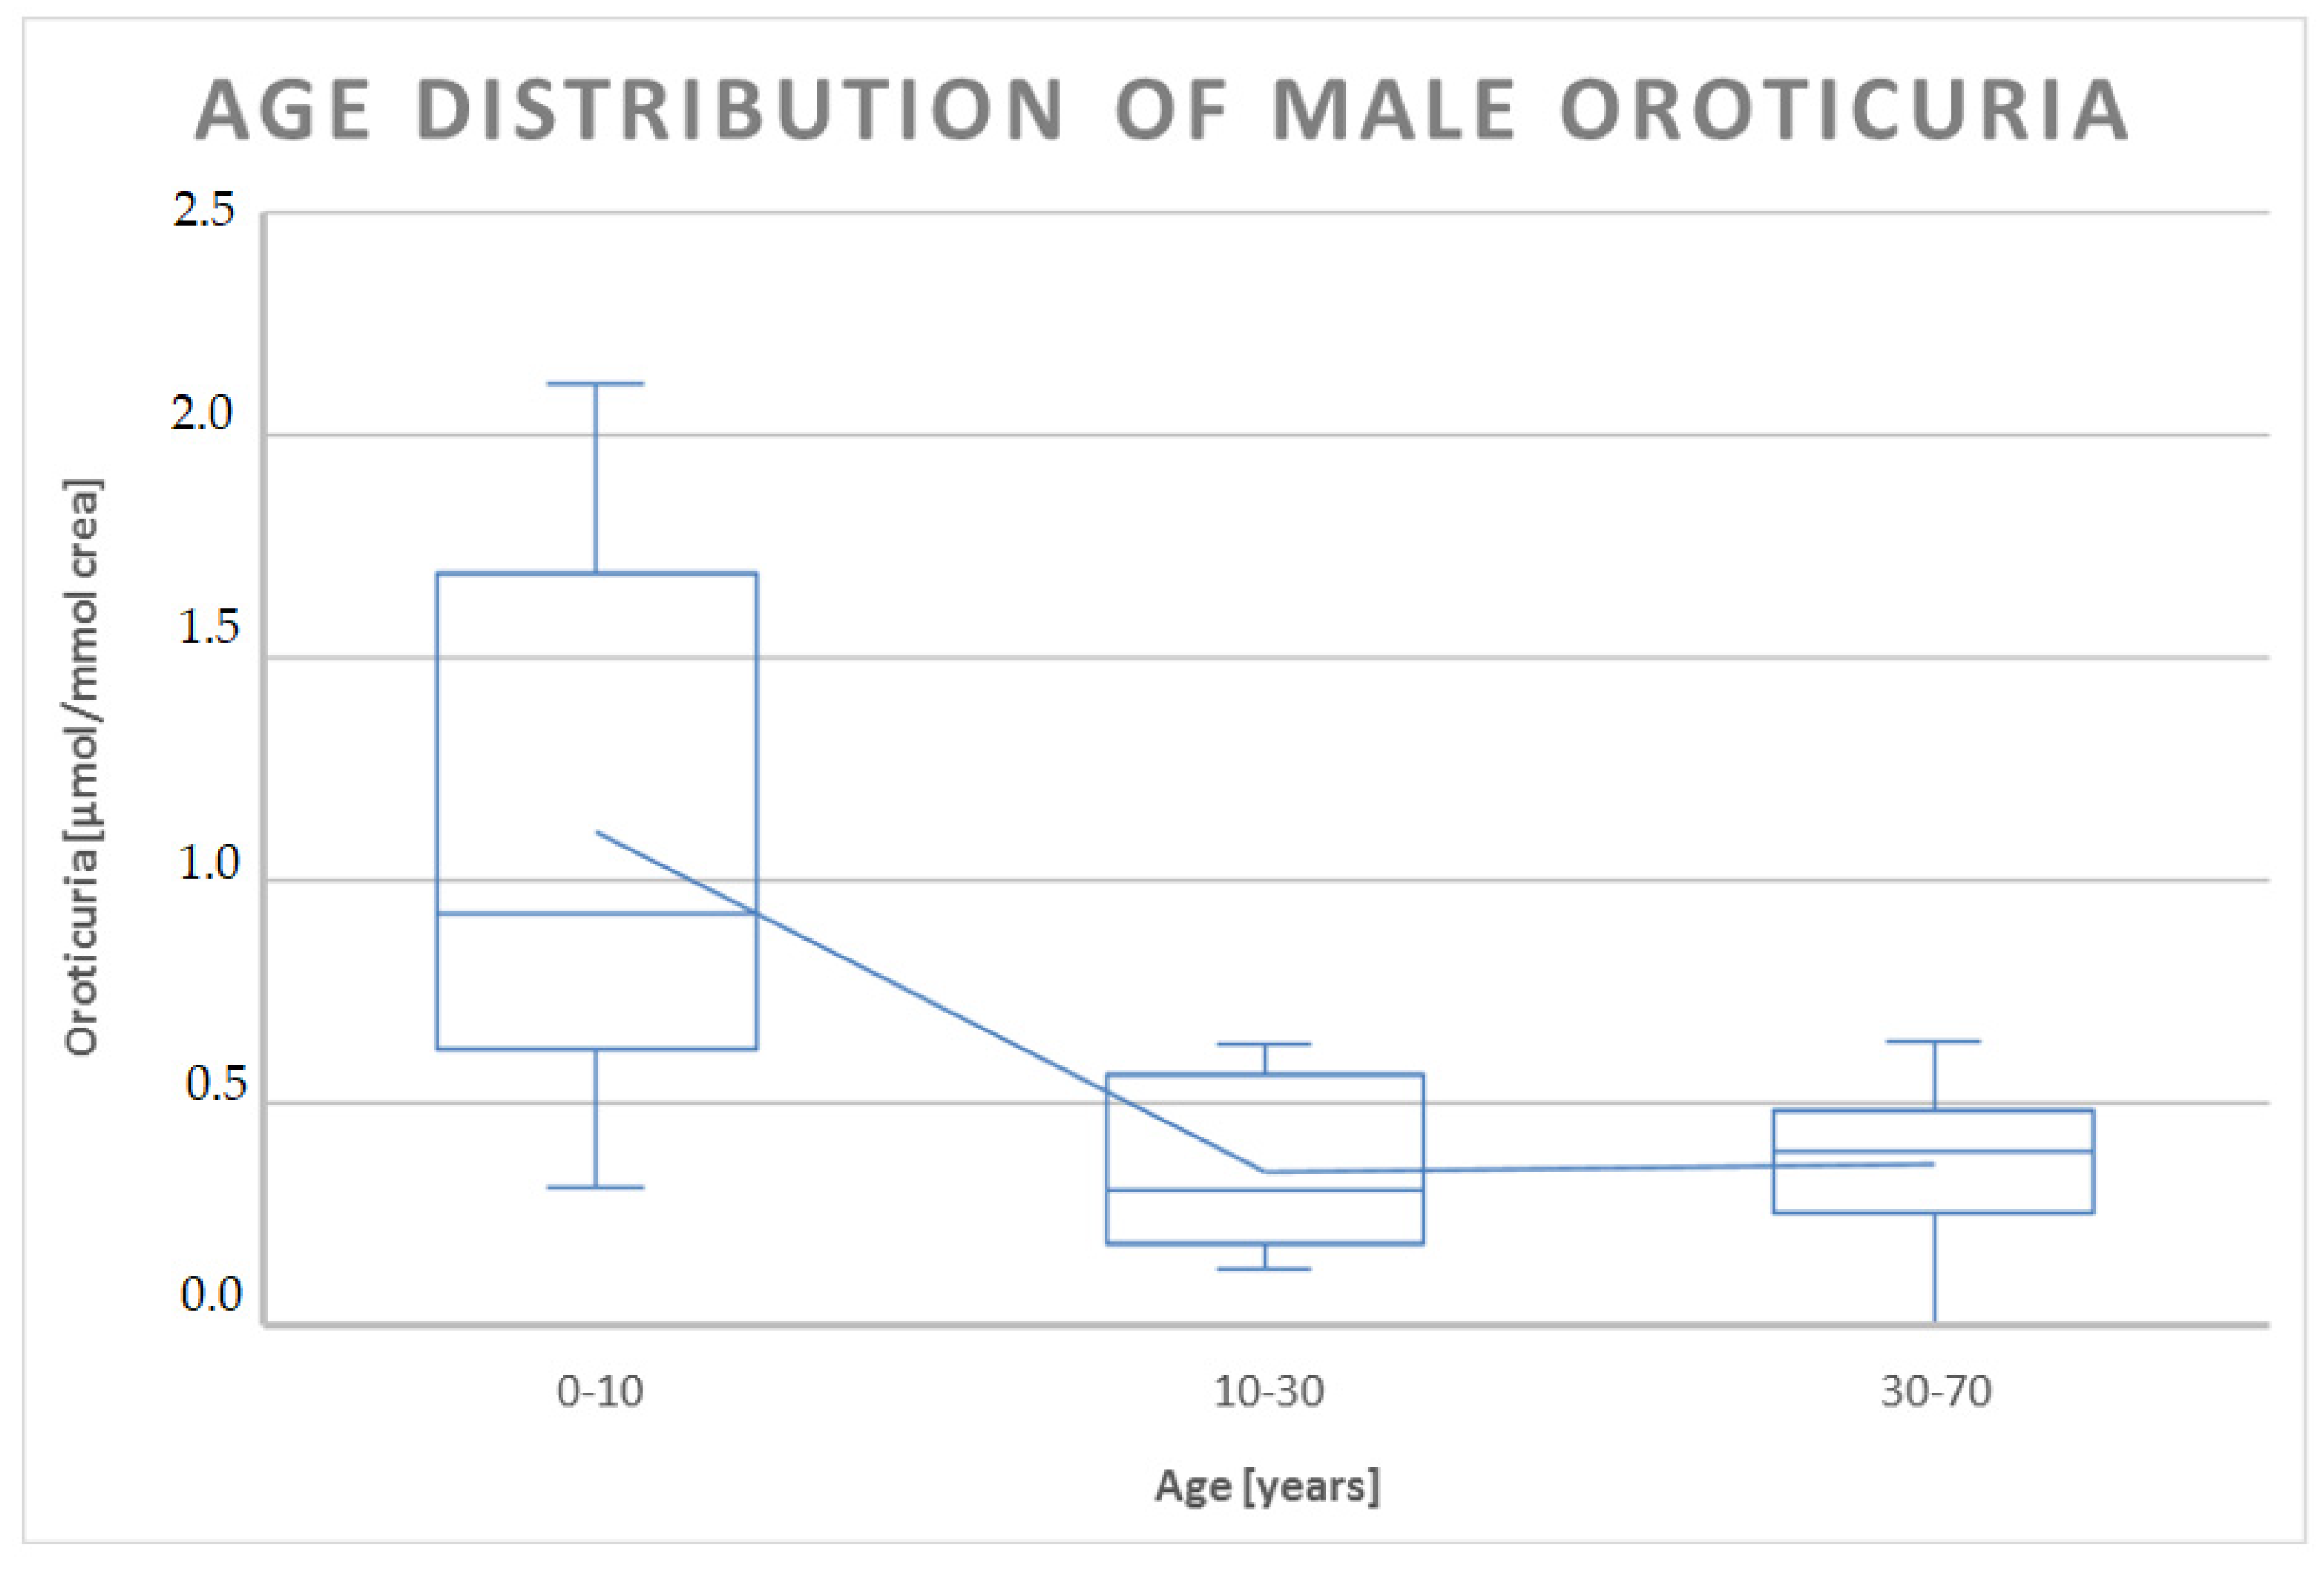
| Males | Year Range | 0–10 | 10–30 | 30–70 | |
| Min | 0.31 | 0.13 | 0.00 | ||
| Max | 2.11 | 0.63 | 0.64 | ||
| SE | 0.23 | 0.06 | 0.05 | ||
| s | 0.65 | 0.19 | 0.17 | ||
| Xm | 1.11 | 0.35 | 0.36 | ||
| n | 8 | 9 | 12 | ||
| Females | Year range | 0–10 | 10–30 | 30–50 | 50–70 |
| Min | 0.27 | 0.06 | 0.11 | 0.00 | |
| Max | 1.06 | 0.69 | 1.45 | 1.02 | |
| SE | 0.07 | 0.11 | 0.12 | 0.15 | |
| s | 0.23 | 0.27 | 0.43 | 0.39 | |
| Xm | 0.51 | 0.48 | 0.66 | 0.47 | |
| n | 12 | 6 | 12 | 7 | |
Disclaimer/Publisher’s Note: The statements, opinions and data contained in all publications are solely those of the individual author(s) and contributor(s) and not of MDPI and/or the editor(s). MDPI and/or the editor(s) disclaim responsibility for any injury to people or property resulting from any ideas, methods, instructions or products referred to in the content. |
© 2023 by the authors. Licensee MDPI, Basel, Switzerland. This article is an open access article distributed under the terms and conditions of the Creative Commons Attribution (CC BY) license (https://creativecommons.org/licenses/by/4.0/).
Share and Cite
Chiara, F.; Allegra, S.; Mula, J.; Puccinelli, M.P.; Abbadessa, G.; Mengozzi, G.; De Francia, S. The Strange Case of Orotic Acid: The Different Expression of Pyrimidines Biosynthesis in Healthy Males and Females. J. Pers. Med. 2023, 13, 1443. https://doi.org/10.3390/jpm13101443
Chiara F, Allegra S, Mula J, Puccinelli MP, Abbadessa G, Mengozzi G, De Francia S. The Strange Case of Orotic Acid: The Different Expression of Pyrimidines Biosynthesis in Healthy Males and Females. Journal of Personalized Medicine. 2023; 13(10):1443. https://doi.org/10.3390/jpm13101443
Chicago/Turabian StyleChiara, Francesco, Sarah Allegra, Jacopo Mula, Maria Paola Puccinelli, Giuliana Abbadessa, Giulio Mengozzi, and Silvia De Francia. 2023. "The Strange Case of Orotic Acid: The Different Expression of Pyrimidines Biosynthesis in Healthy Males and Females" Journal of Personalized Medicine 13, no. 10: 1443. https://doi.org/10.3390/jpm13101443
APA StyleChiara, F., Allegra, S., Mula, J., Puccinelli, M. P., Abbadessa, G., Mengozzi, G., & De Francia, S. (2023). The Strange Case of Orotic Acid: The Different Expression of Pyrimidines Biosynthesis in Healthy Males and Females. Journal of Personalized Medicine, 13(10), 1443. https://doi.org/10.3390/jpm13101443