Article

Three-Dimensional Semantic Segmentation of Diabetic Retinopathy Lesions and Grading Using Transfer Learning

1
Department of Computer Science, COMSATS University Islamabad, Wah Campus, Wah Cantt 47010, Pakistan
2
Department of Computer Science, University of Wah, Wah Campus, Wah Cantt 47010, Pakistan
3
Department of Applied Data Science, Noroff University College, 4612 Kristiansand, Norway
4
Zhejiang Bioinformatics International Science and Technology Cooperation Center, Wenzhou-Kean University, Wenzhou 325060, China
5
Wenzhou Municipal Key Lab of Applied Biomedical and Biopharmaceutical Informatics, Wenzhou-Kean University, Wenzhou 325060, China
*
Authors to whom correspondence should be addressed.
J. Pers. Med. 2022, 12(9), 1454; https://doi.org/10.3390/jpm12091454
Submission received: 25 June 2022 / Revised: 18 August 2022 / Accepted: 20 August 2022 / Published: 5 September 2022
(This article belongs to the Special Issue Bioinformatics and Medicine)

Abstract

:
Diabetic retinopathy (DR) is a drastic disease. DR embarks on vision impairment when it is left undetected. In this article, learning-based techniques are presented for the segmentation and classification of DR lesions. The pre-trained Xception model is utilized for deep feature extraction in the segmentation phase. The extracted features are fed to Deeplabv3 for semantic segmentation. For the training of the segmentation model, an experiment is performed for the selection of the optimal hyperparameters that provided effective segmentation results in the testing phase. The multi-classification model is developed for feature extraction using the fully connected (FC) MatMul layer of efficient-net-b0 and pool-10 of the squeeze-net. The extracted features from both models are fused serially, having the dimension of N × 2020, amidst the best N × 1032 features chosen by applying the marine predictor algorithm (MPA). The multi-classification of the DR lesions into grades 0, 1, 2, and 3 is performed using neural network and KNN classifiers. The proposed method performance is validated on open access datasets such as DIARETDB1, e-ophtha-EX, IDRiD, and Messidor. The obtained results are better compared to those of the latest published works.

1. Introduction

Diabetic retinopathy (DR) is the main cause of blindness affecting 93 million people worldwide [1]. It is caused due to microvascular disorders [2,3]. DR is distributed into two classes based on the severity level, proliferative (PDR) and non-proliferative (NPDR). PDR occurs when the retina begins to produce new blood vessels that are more advanced. The emergence of new vessels along the vascular arcades in the retina is usually referred to as neovascularization of the retina [4]. The NPDR is an essential stage of DR. Here, the tiny veins and blood vessels in the retina begin to discharge blood. Its anomalies are categorized according to the severity levels, which are mild, moderate, and severe. Hemorrhages (HMs), hard exudates (HE), soft exudates (SoEX), and microaneurysms (MAs) are common symptoms of NPDR, as shown in Figure 1 [5]. MAs are small red circular dots on the retina created by the damaged vessel walls in the early stage of DR. MAs with prominent edges have a maximum size of 125 micrometers [6]. The blockage of retinal blood vessels causes HMs, which lead to lesions inside the vessels. HMs are divided into two types: flame with surface shape and blot with deep spots [7]. HEs are yellow patches caused by plasma leakage. They have sharp edges and span the outer layers of the retina [8]. SoEX appear as white ovals on the retina due to nerve fiber swelling [6].
Manual DR detection is an error-prone and significant task for an ophthalmologist. Therefore, an automated method is required for precise and rapid detection. In the literature, several computerized methods have been proposed for the detection of DR lesions [10]. Convolutional neural networks (CNNs) and the Hough transform algorithm (HTA) are used for EX detection. Furthermore, histogram equalization and canny edge detection techniques are applied to improve the quality of images. This also avoids inference with the OD, which is an anatomical region. Classification results of 98.53% accuracy on DiaretDB1, 99.17% accuracy on DiaretDB0 and 99.18% accuracy on DrimDB datasets [11] have been achieved. A model based on CNN was developed for DR detection. Multiple preprocessing methods were applied, such as random brightness and random contrast change, which provided an accuracy of 0.92 on the MESSIDOR-2 and 0.958 on the MESSIDOR-1 datasets [12]. Adaptive thresholding also has been used with morphological operators for the segmentation of DR regions.
Statistical and geometrical features were employed for classification that provided an AUC of 0.99 on E-ophtha and an AUC of 1.00 on Diaretdb, Messidor, and local datasets [13]. The correlated extracted features using two SURF and PHOG descriptors were fused serially using the canonical correlation analysis technique [14]. Although much work has been done in this area, there is still a gap due to the following factors.
Fundus retinal images are used for the analysis of DR. Several challenges exist during the image capturing process, such as illumination noise and poor contrast, that degrade the performance. DR lesion segmentation is also a challenging task due to variable shape, size, and color. Optic disc (OD) detection is another challenge in this domain because it has a circular shape that resembles the retinal lesions. Therefore, it is often falsely detected as a lesion region. To overcome these concerns, a technique is presented for segmenting and classifying the retinal lesions. The contribution steps are discussed as:
(1)
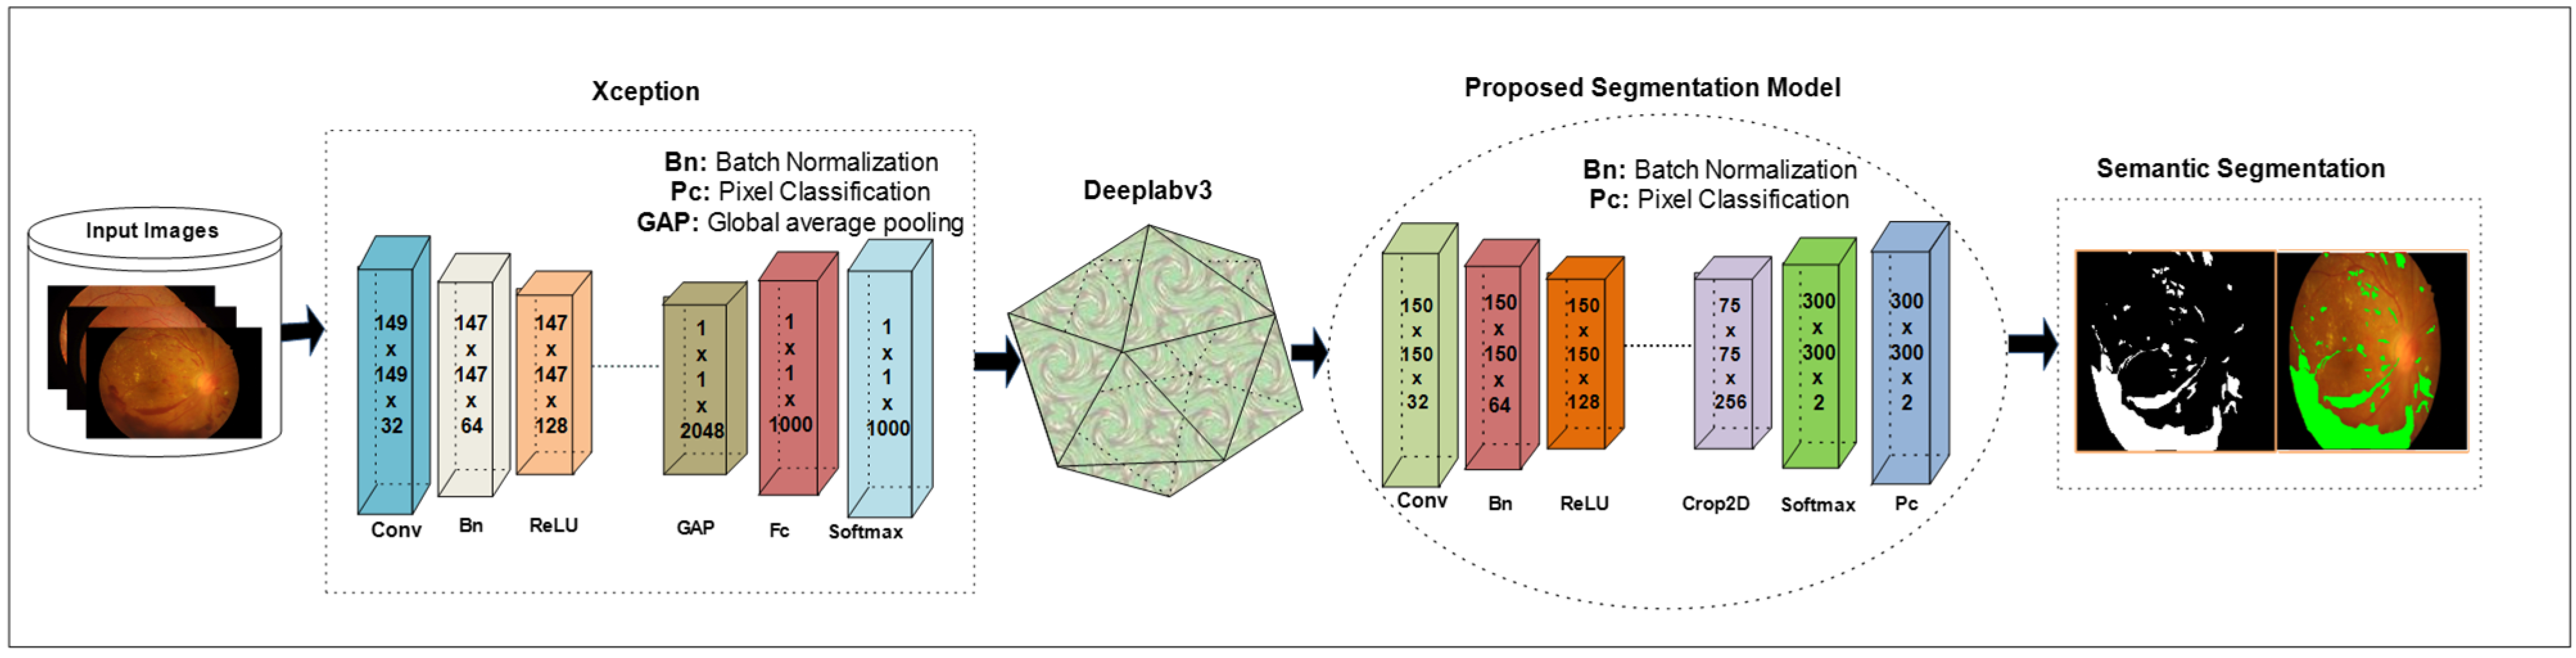
The pre-trained Xception model is combined with the Deeplabv3 model. The output of these models is trained on the selected hyperparameters that are finalized after experiments for DR lesion segmentation.
(2)
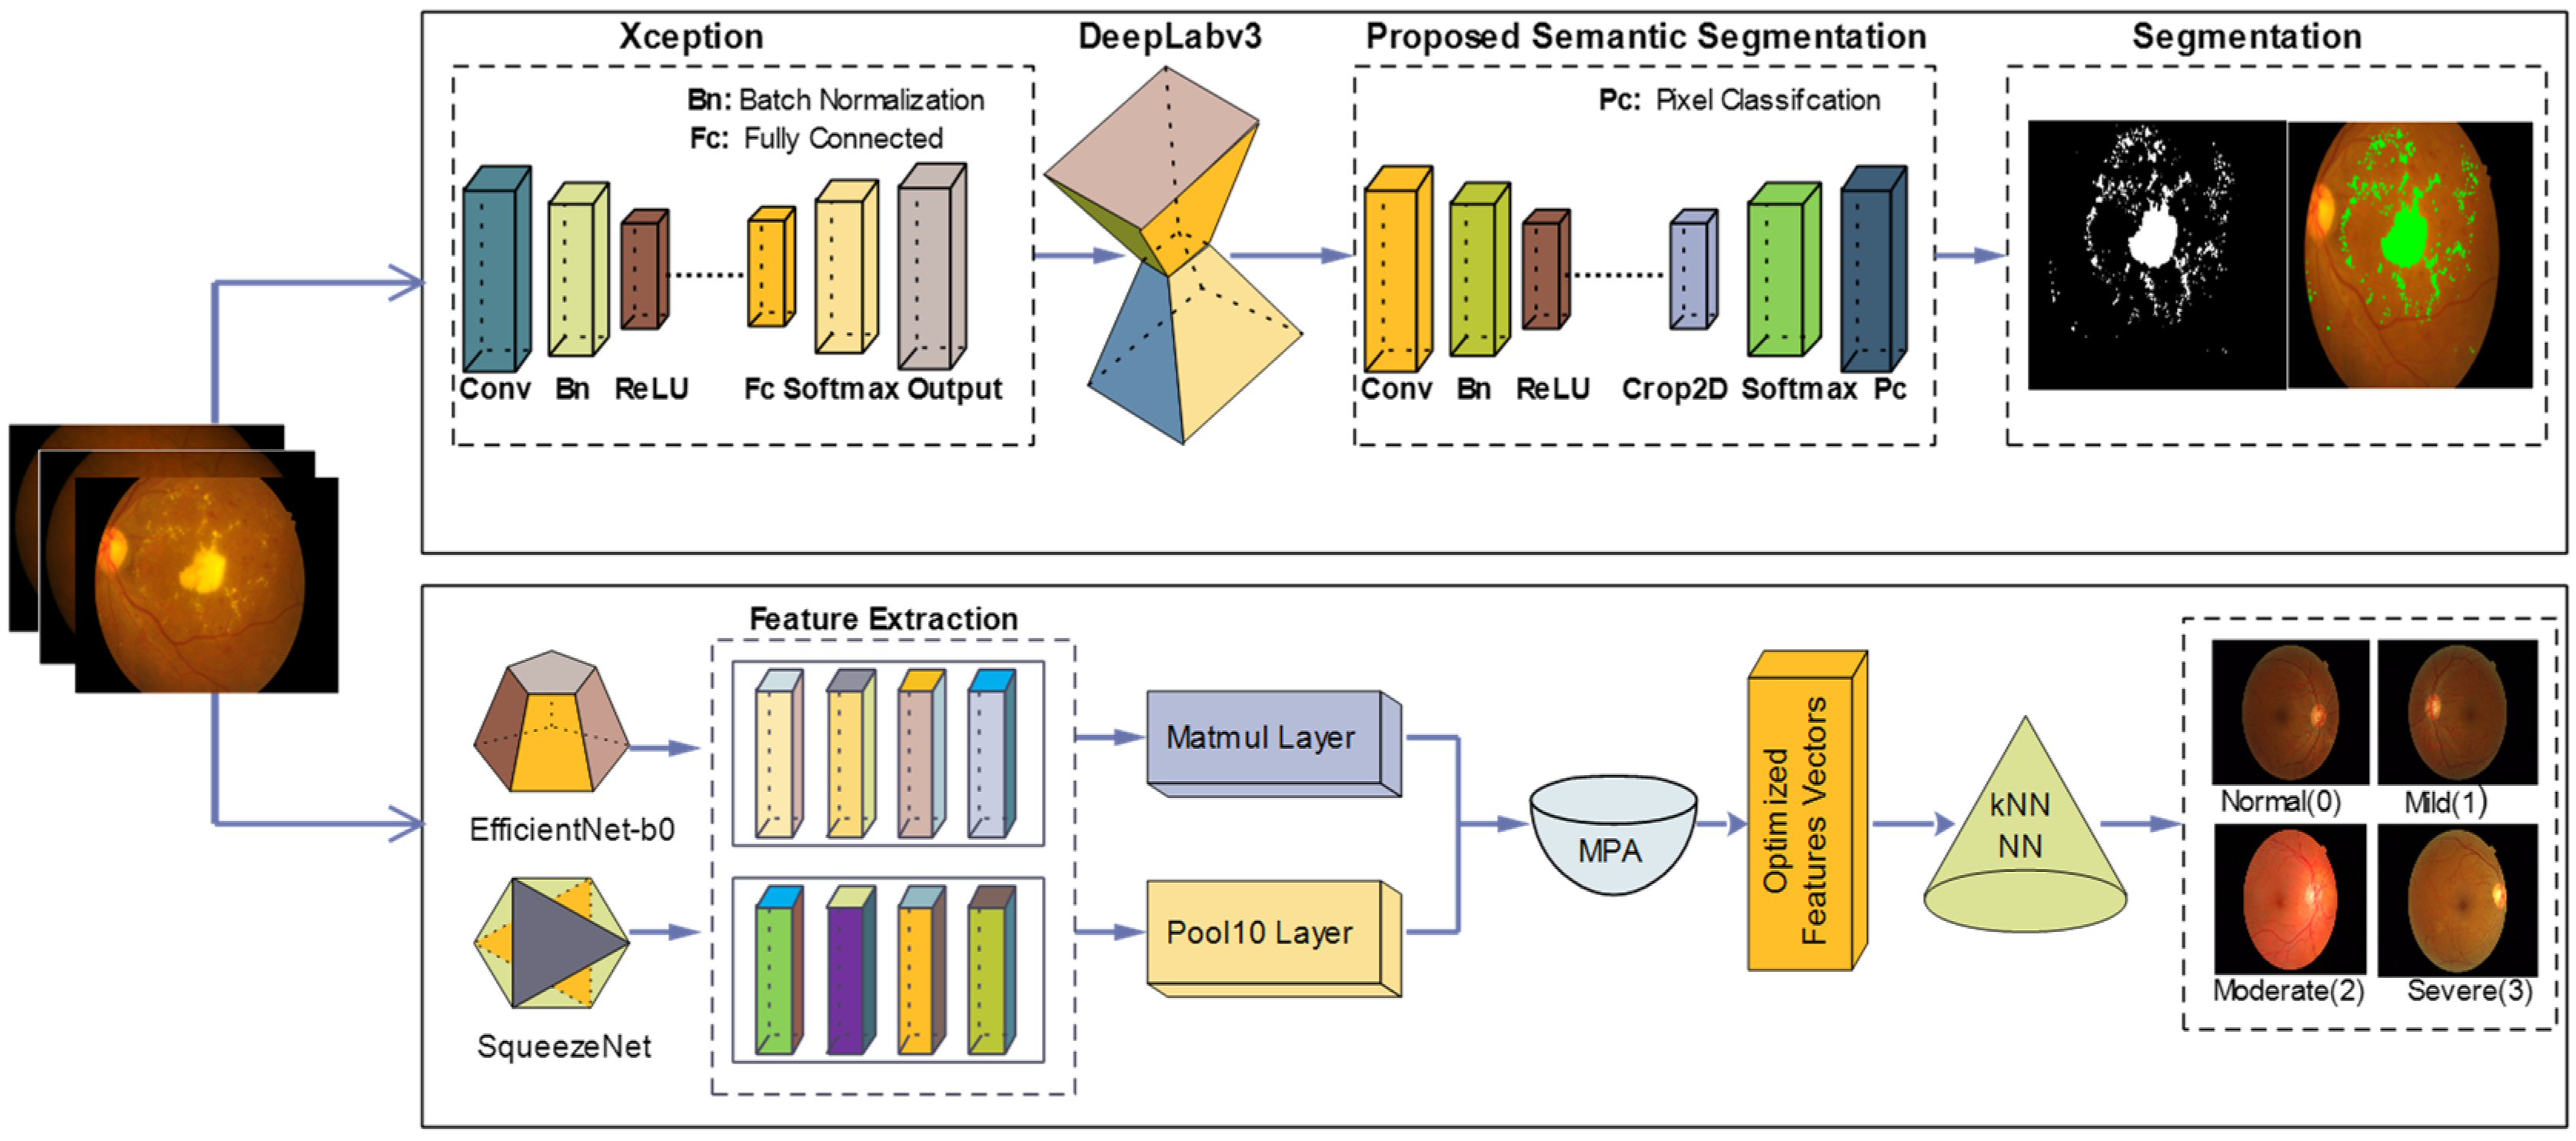
Two transform learning models, efficient-net-b0 and squeeze-net, are employed for feature extraction from the selected fully connected layers such as MATMUL and pool-10, respectively.
(3)
The extracted features from MATMUL and pool-10 layers are fused in serial. The adequate features are determined using MPA.
(4)
For selection of the best features, the MPA model is trained on the selected hyperparameters. The selected features using the MPA model are passed to the KNN and NN classifiers for DR grade classification.
The article structure is as follows. Section 2 discusses the existing work, Section 3 defines the steps of the proposed method, Section 4 gives results and discussion, and lastly, the conclusion is drafted in Section 5.

2. Related Work

Recent work covers the versatile application of conventional and modern approaches for the identification and detection of DR lesions. T-LOP features were used with ELM for classification, providing 99.6% accuracy and 0.991 precision [15]. For detecting HE spots in the blood vessels, a dense, deep feature extraction method based on CNN was proposed, which performs the classification efficiently with an accuracy of 97% and specificity of 92% [16]. Modified Alexnet architecture based on CNN was presented for DR classification. Classification was performed on the MESSIDOR dataset and produced an accuracy of 96% [17]. U-Net residual network with the pre-trained ResNet34 model was presented for the segmentation of DR lesions. The model achieved 99.88% and 0.999% accuracy and dice score, respectively [18]. For classification, a residual-based network architecture was used on the MESSIDOR dataset. Modified models such as ResNet18, ResNet34 and ResNet50 were utilized for binary classification, and obtained an accuracy of 99.47%, 99.47% and 99.87% for ResNet18, ResNet34 and ResNet50, respectively [19]. To improve the segmentation of DR lesions on fundus images, the HEDNet method was proposed. This method claimed that adding adversarial loss enhances the lesion segmentation performance on the IDRiD dataset [20]. A fully connected CNN model was presented with long and short skip connections [2,8,13,21,22,23,24,25,26,27,28,29,30,31,32,33,34,35,36,37,38,39,40,41,42,43,44,45,46,47,48,49,50]. This model was used for segmenting DR lesions, including OD and exudates. Basic FCNs architecture was used for semantic segmentation. For OD segmentation, it obtained sensitivity (SEN) of 93.12% and specificity (Spe) of 99.56%. For exudate segmentation, it achieved Sen of 81.35% and Spe of 98.76% [51]. Using the skip connection in UNet, a deep learning network called MResUNet was proposed for MA segmentation. To solve the pixel imbalance problem between the MA and the background, the authors proposed adaptive weighted loss function cross-entropy on the MResUNet. The proposed network enhanced the performance of network architecture to detect the MA. The MResUNet architecture was evaluated on IDRiD and DiaretDB1 datasets and achieved an SEN of 61.96% on IDRiD and 85.87% on the DiaretDB1 dataset [52]. The pre-trained ResNet-50 and 101 models were used for the classification of DR lesions. They provided an accuracy of 0.9582 on IDRiD, 0.9617 on E-ophtha, and 0.9578 on DDR datasets. Additionally, it was claimed that DARNet beats existing models in terms of robustness and accuracy [53]. The nested U-Net based on the CNN method was proposed for the segmentation of MA and HM and achieved 88.79% SEN on the DIARETDB1 dataset [54]. EAD-Net CNN network architecture was used for EX segmentation with an accuracy of 99.97% [55]. The results were evaluated on seven datasets and achieved an accuracy of 78.6% on DRIVE, 85.1% on DIARETDB1, 83.2% on CHASE-DB1, 80.1% on Shifa, 85.1% on DRIVES-DB1, 87.93% on MESSIDOR, and 86.1% on ONHSD datasets [56].

3. Proposed Methodology

In this research, DR lesion segmentation and classification models are proposed as shown in Figure 2. The proposed segmentation model uses the Xception model [57] with Deeplabv3 on the selected learning parameters. The proposed classification model investigates features using two pre-trained models, i.e., efficient-net-b0 [58] and squeeze-Net [59]. Features extracted from these two models are serially fused and passed on to MPA [60]. Optimal features selected by MPA are fed to the KNN [61] and NN [62] classifiers for DR classification into DR grade 0, 1, 2, and 3.

3.1. Proposed Semantic Segmentation Model

The DeepLabv3 [63] network is used for segmentation that uses encoder–decoder architecture, skips connection, and dilated convolutions. In this work, the Xception model is used for DR lesion segmentation as an input to the deeplabv3, as shown in Figure 3. The Xception model contains 170 layers, which comprise 1 input, 40 convolutional, 40 batch normalization, 35 ReLU, 34 grouped-convolution, 4 max-pooling, 12 addition, 1 global average pooling, 1 FC, 1 Softmax, and 1 classification output. The proposed segmentation model that is the combination of Xception and Deeplabv3 contains 205 layers, which include 1 input, 48 batch normalization, 49 convolution, 40 grouped convolution, ReLU43, max-pooling 4, addition 12, transposed convolution 2, crop-2D 2, depth concatenation 2, SoftMax, and pixel classification.
The model training is performed based on learning parameters that are chosen after experiments based on the minimum error rate as presented in Table 1.
Table 1 presents the selected hyperparameters for model training, which are selected after experimentation in which Adam optimizer, 200 epochs, 32 batch-sizes, and 0.0001 learning rate provide better results in model testing.

3.2. Classification of DR Lesions Using Deep Features

The dominant features are collected from FC layers of the pre-trained efficientNet-b0 and squeeze net models. Efficientnet-b0 consists of 290 layers, which include 1 input, 65 convolutions, 49 batch normalization, 65 sigmoid, 65 element-wise multiplication, 6 grouped convolution, 17 global average pooling, 9 addition, 1 FC softmax, and classification output. The squeezeNet consists of 68 layers, which include 1 output, 26 convolution, 26 ReLU, 3 max-pooling, 8 depth concatenation, 1 drop-out, 1 global average pooling, softmax, and classification output. The Matmul FC layer of efficientnet-b0 and the pool-10 layer of squeezeNet have feature dimensions of N × 1000. These features are fused serially with N × 1000 dimension and fed to the MPA for best feature selection. After MPA best, N × 1032 was selected out of N × 2000 features as an input to the KNN and NN classifiers.

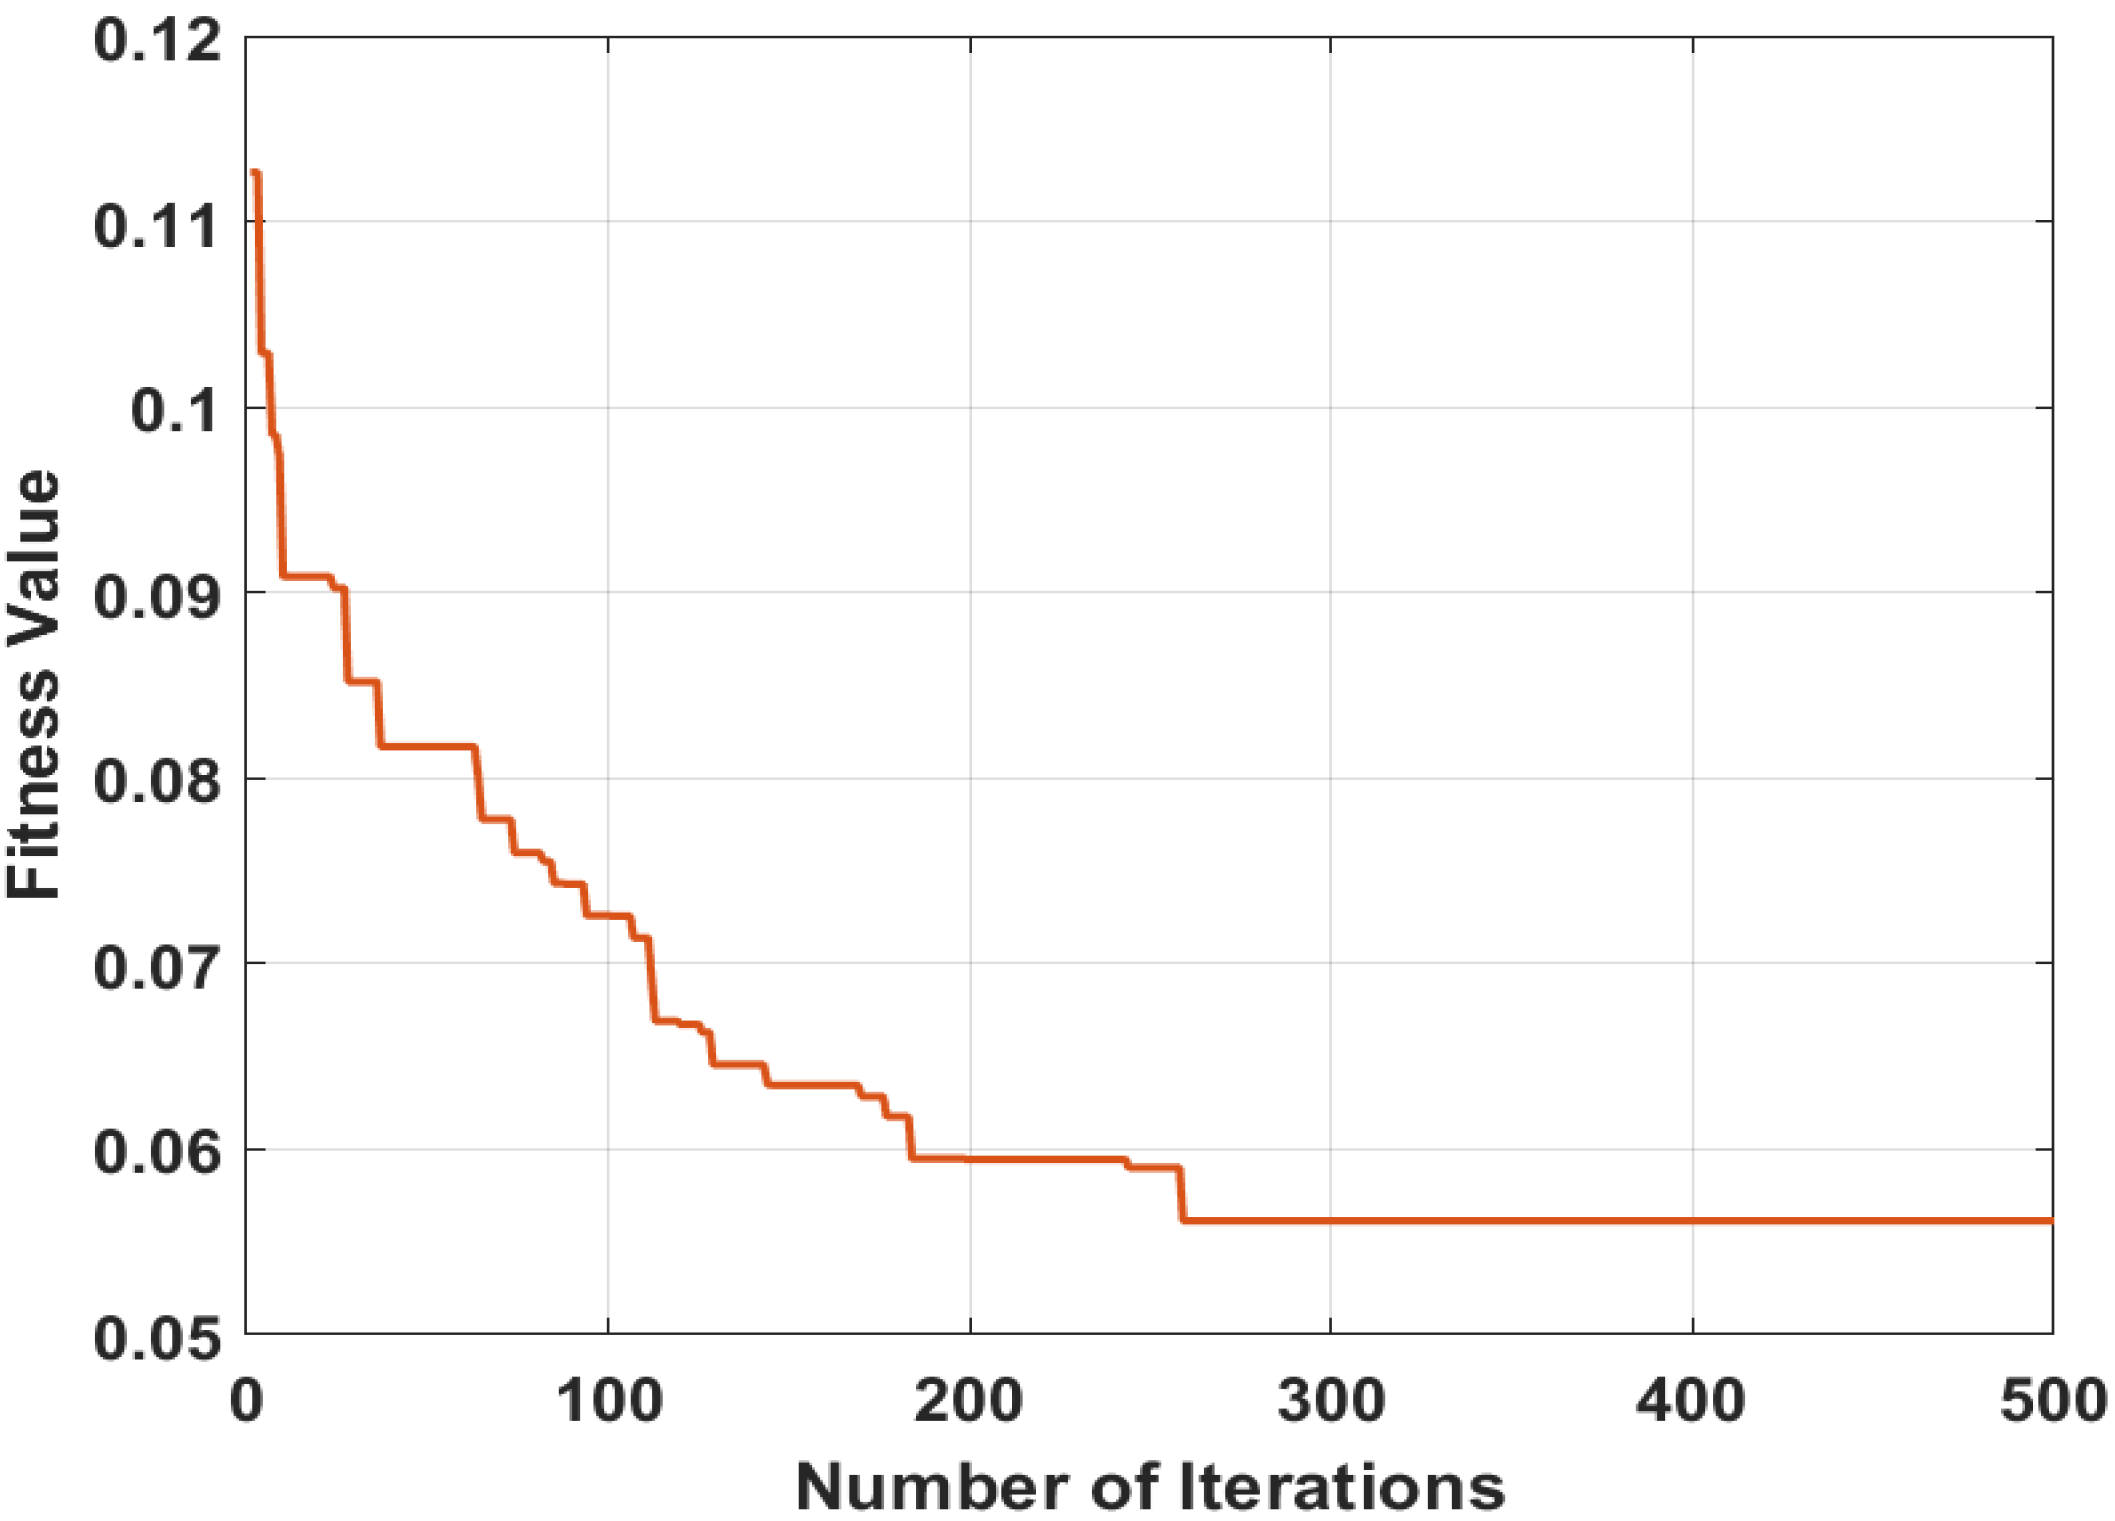
3.3. Feature Selection Using MPA

This research employs MPA for feature selection, where N × 1032 optimal features are selected out of N × 2000, which provide better results for the classification.
MPA is an optimization algorithm that is built up using the population of particles. The survival of particles is determined by the fittest hypothesis. It comprises three distinctive optimization scenarios depending on velocity ratio (v). The high-velocity proportion (v ≥ 10) shows that the prey successfully outruns the predators by using the high-velocity extent.
The low-velocity proportion (v = 0.1) shows that predators can invade the prey. Here, the predator adopts the Levy development strategy. MH algorithms deliver the basic populace of self-assertive look specialists depending on prior information. At this point, the MPA algorithm updates self-assertive look agent zones in all accentuation and at last obtains the finest ideal solution depending on the optimization issue. Equation (1) considers z as an arbitrary search operator extending over the interval z ∈ [lb, ub], and z ¯ is an opposite search operator.
z ¯ = lb + ub z
In the above equation, ‘lb’ and ‘ub’ indicate lower-bound and upper-bound arbitrary search agents respectively. Equations (2) and (3) show the arbitrary search operator created in ‘n’ dimension search spaces.
z = [z1, z2, z3, …. zn]
z ¯ = [ z ¯ 1 , z ¯ 2 , z ¯ , z ¯ n ]
In Equation (4), opposite values z ¯ are created
z ¯ j = l b j + u b j z j
In Equation (5), Φ represents the stability estimator; it is used to measure the distinctive cardinality of feature sets and determine the stability of the model.
  Φ ( B ) = 1 1 x h = 1   x S 2 h N ¯ x (   1 N ¯ x )
where
S 2 h   = W W 1 r ^ h ( 1 r ^ h )
and
N ¯ = h = 1 x   1 W · i = 1 W   Y i , h
In Equation (6), W represents the rows in a binary matrix (B), and r ^ h indicates the recurrence of the specified features that are selected at the time of iteration operation. In Equation (7), N ¯ represents the average features chosen in binary matrix and Y i , h indicates the binary value in ‘ith’ row and ‘hth’ column. The pre-trained values of MPA are used for best feature selections as shown in Table 2.
Here, lb is 0, ub is 1, thres is 0.5, beta is 1.5, P is 0.5 and FADs is 0.2; by using these parameters of MPA classification, the error rate is minimized, which gives better results. The graphical representation of MPA is depicted in Figure 4.
The conversion plot of MPA between the fitness value and the number of iterations is shown in Figure 4. Here, the plotted curve identifies the error rate, which is constant after 300 iterations.

4. Experimental Discussion

The publicly available MESSIDOR dataset is used for DR classification. The dataset contains 1200 color eye fundus images of each class. These images are provided in three sets belonging to different ophthalmologic departments. Each image set has four zipped subsets containing 100 images in TIFF format. Flip, horizontal and vertical augmentation are applied to this dataset to balance the number of images. Augmentation applied at each level of the MESSIDOR dataset is listed hereunder.
(1)
Grade0 = 1092 images
(2)
Grade1 = 1224 images
(3)
Grade2 = 1976 images
(4)
Grade3 = 1016 images
The above-mentioned 5308 augmented images are used to avoid the overfitting problem. These images are captured from a 3CCD camera with a view of 45 degrees and divided into four classes [9]. The detail of the classification dataset is shown in Table 3. In this research, segmentation datasets IDRID, DIARETDB1, and e-ophtha-EX are used [64]. Forty-seven images are of e-ophtha-EX, out of which 35 are healthy [65]. IDRiD contains 81 MA, 81 EX, 80 HE, and 40 SoEX [66].
Table 3 presents the description of the publicly available Messidor dataset, which is used for classification. The summary of the segmentation datasets is mentioned in Table 4.
MATLAB 2021RA with a Core-i7 CPU, 8 GB Nvidia graphic card 2070 RTX, and 32 GB RAM are used for the implementation of this research.

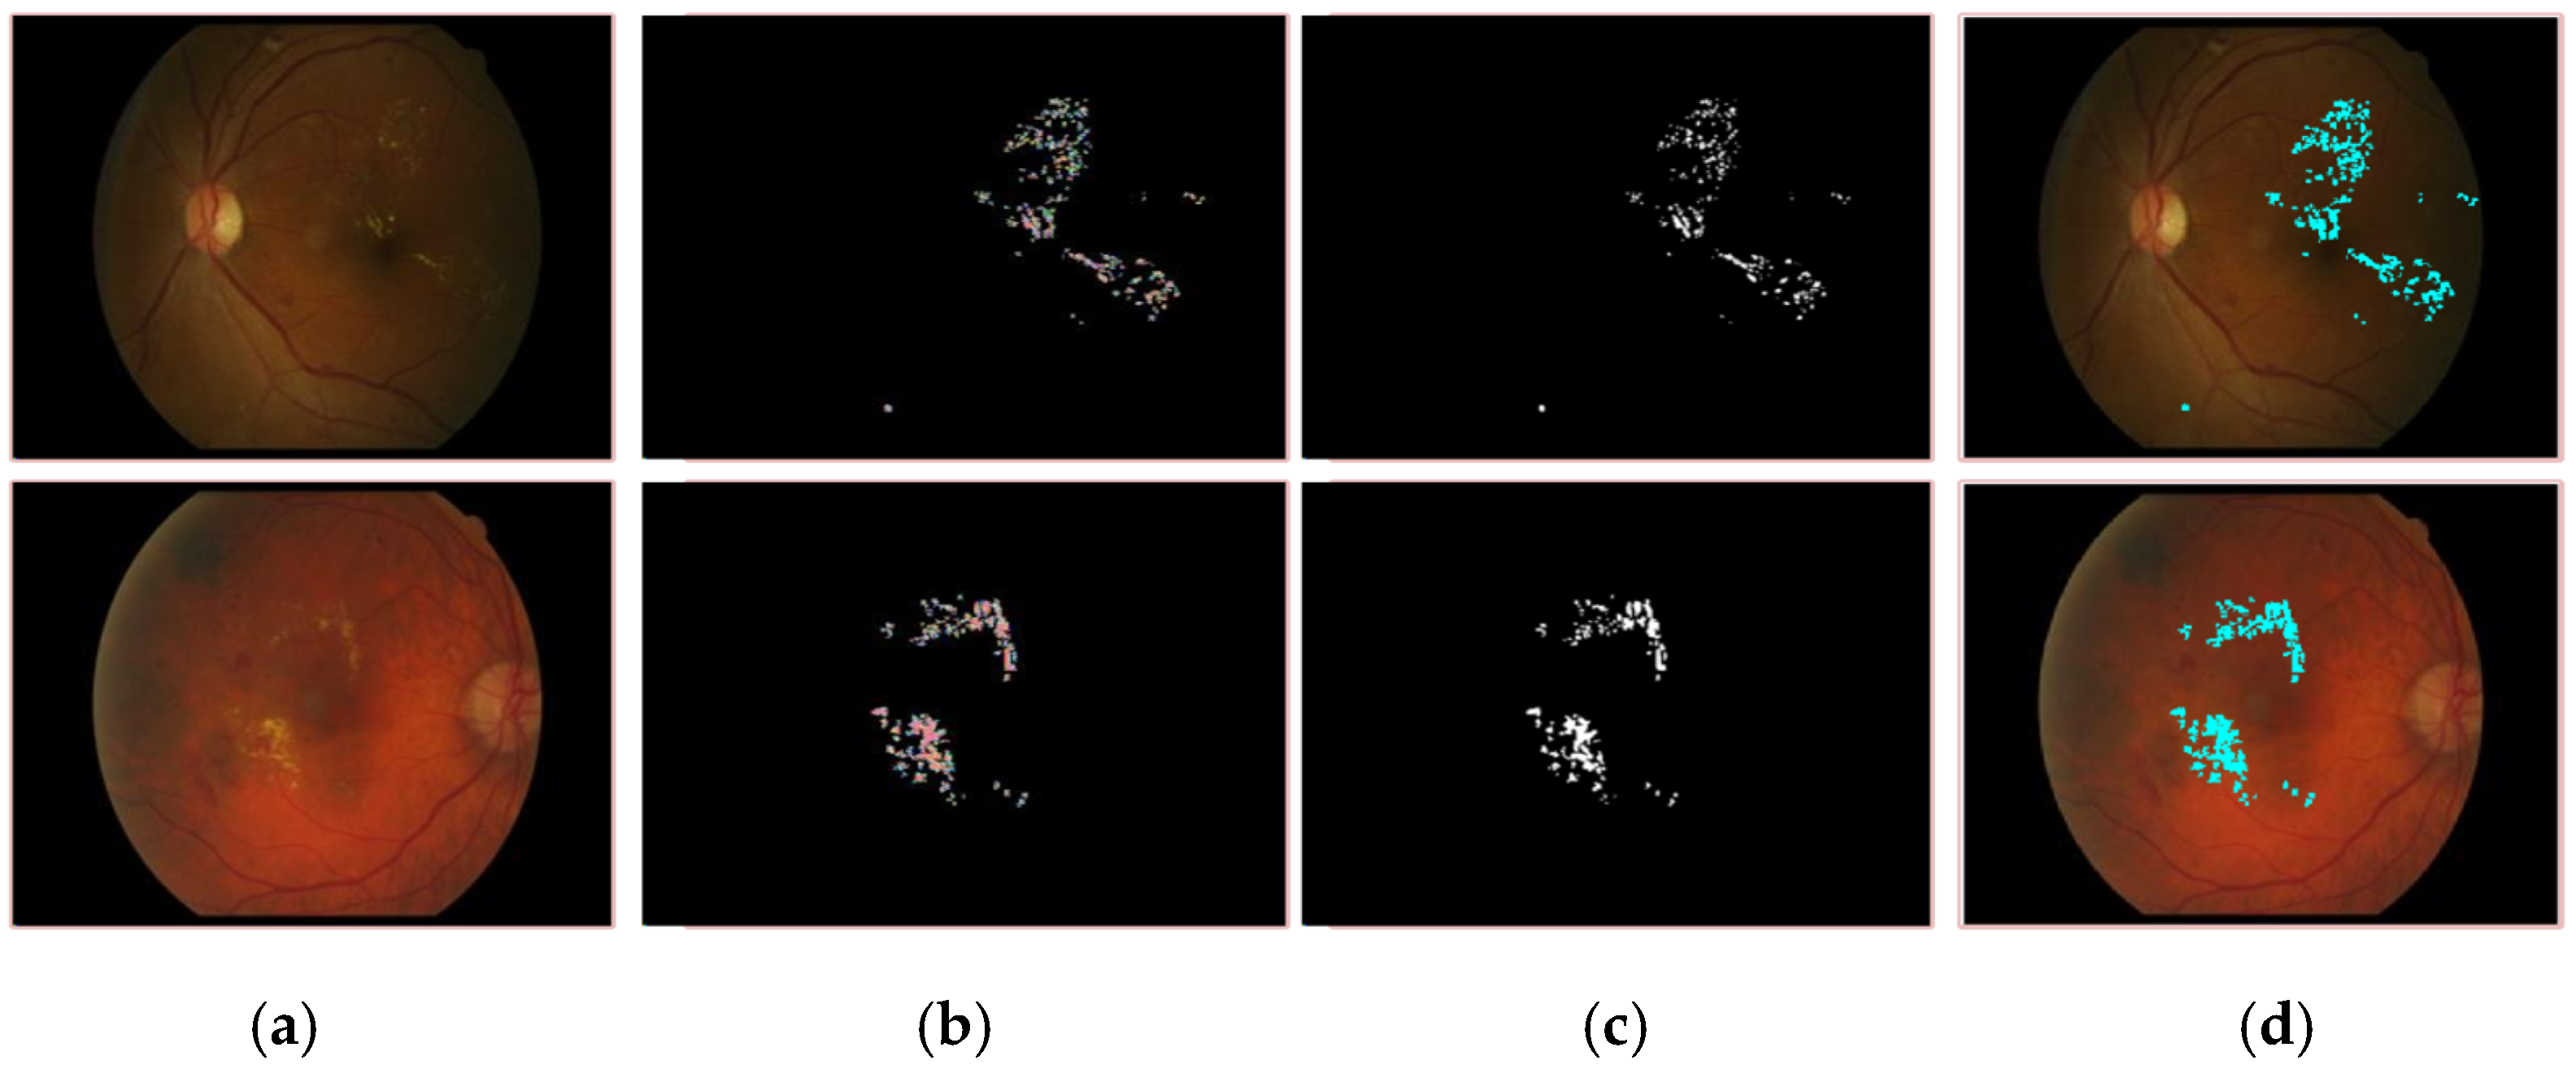
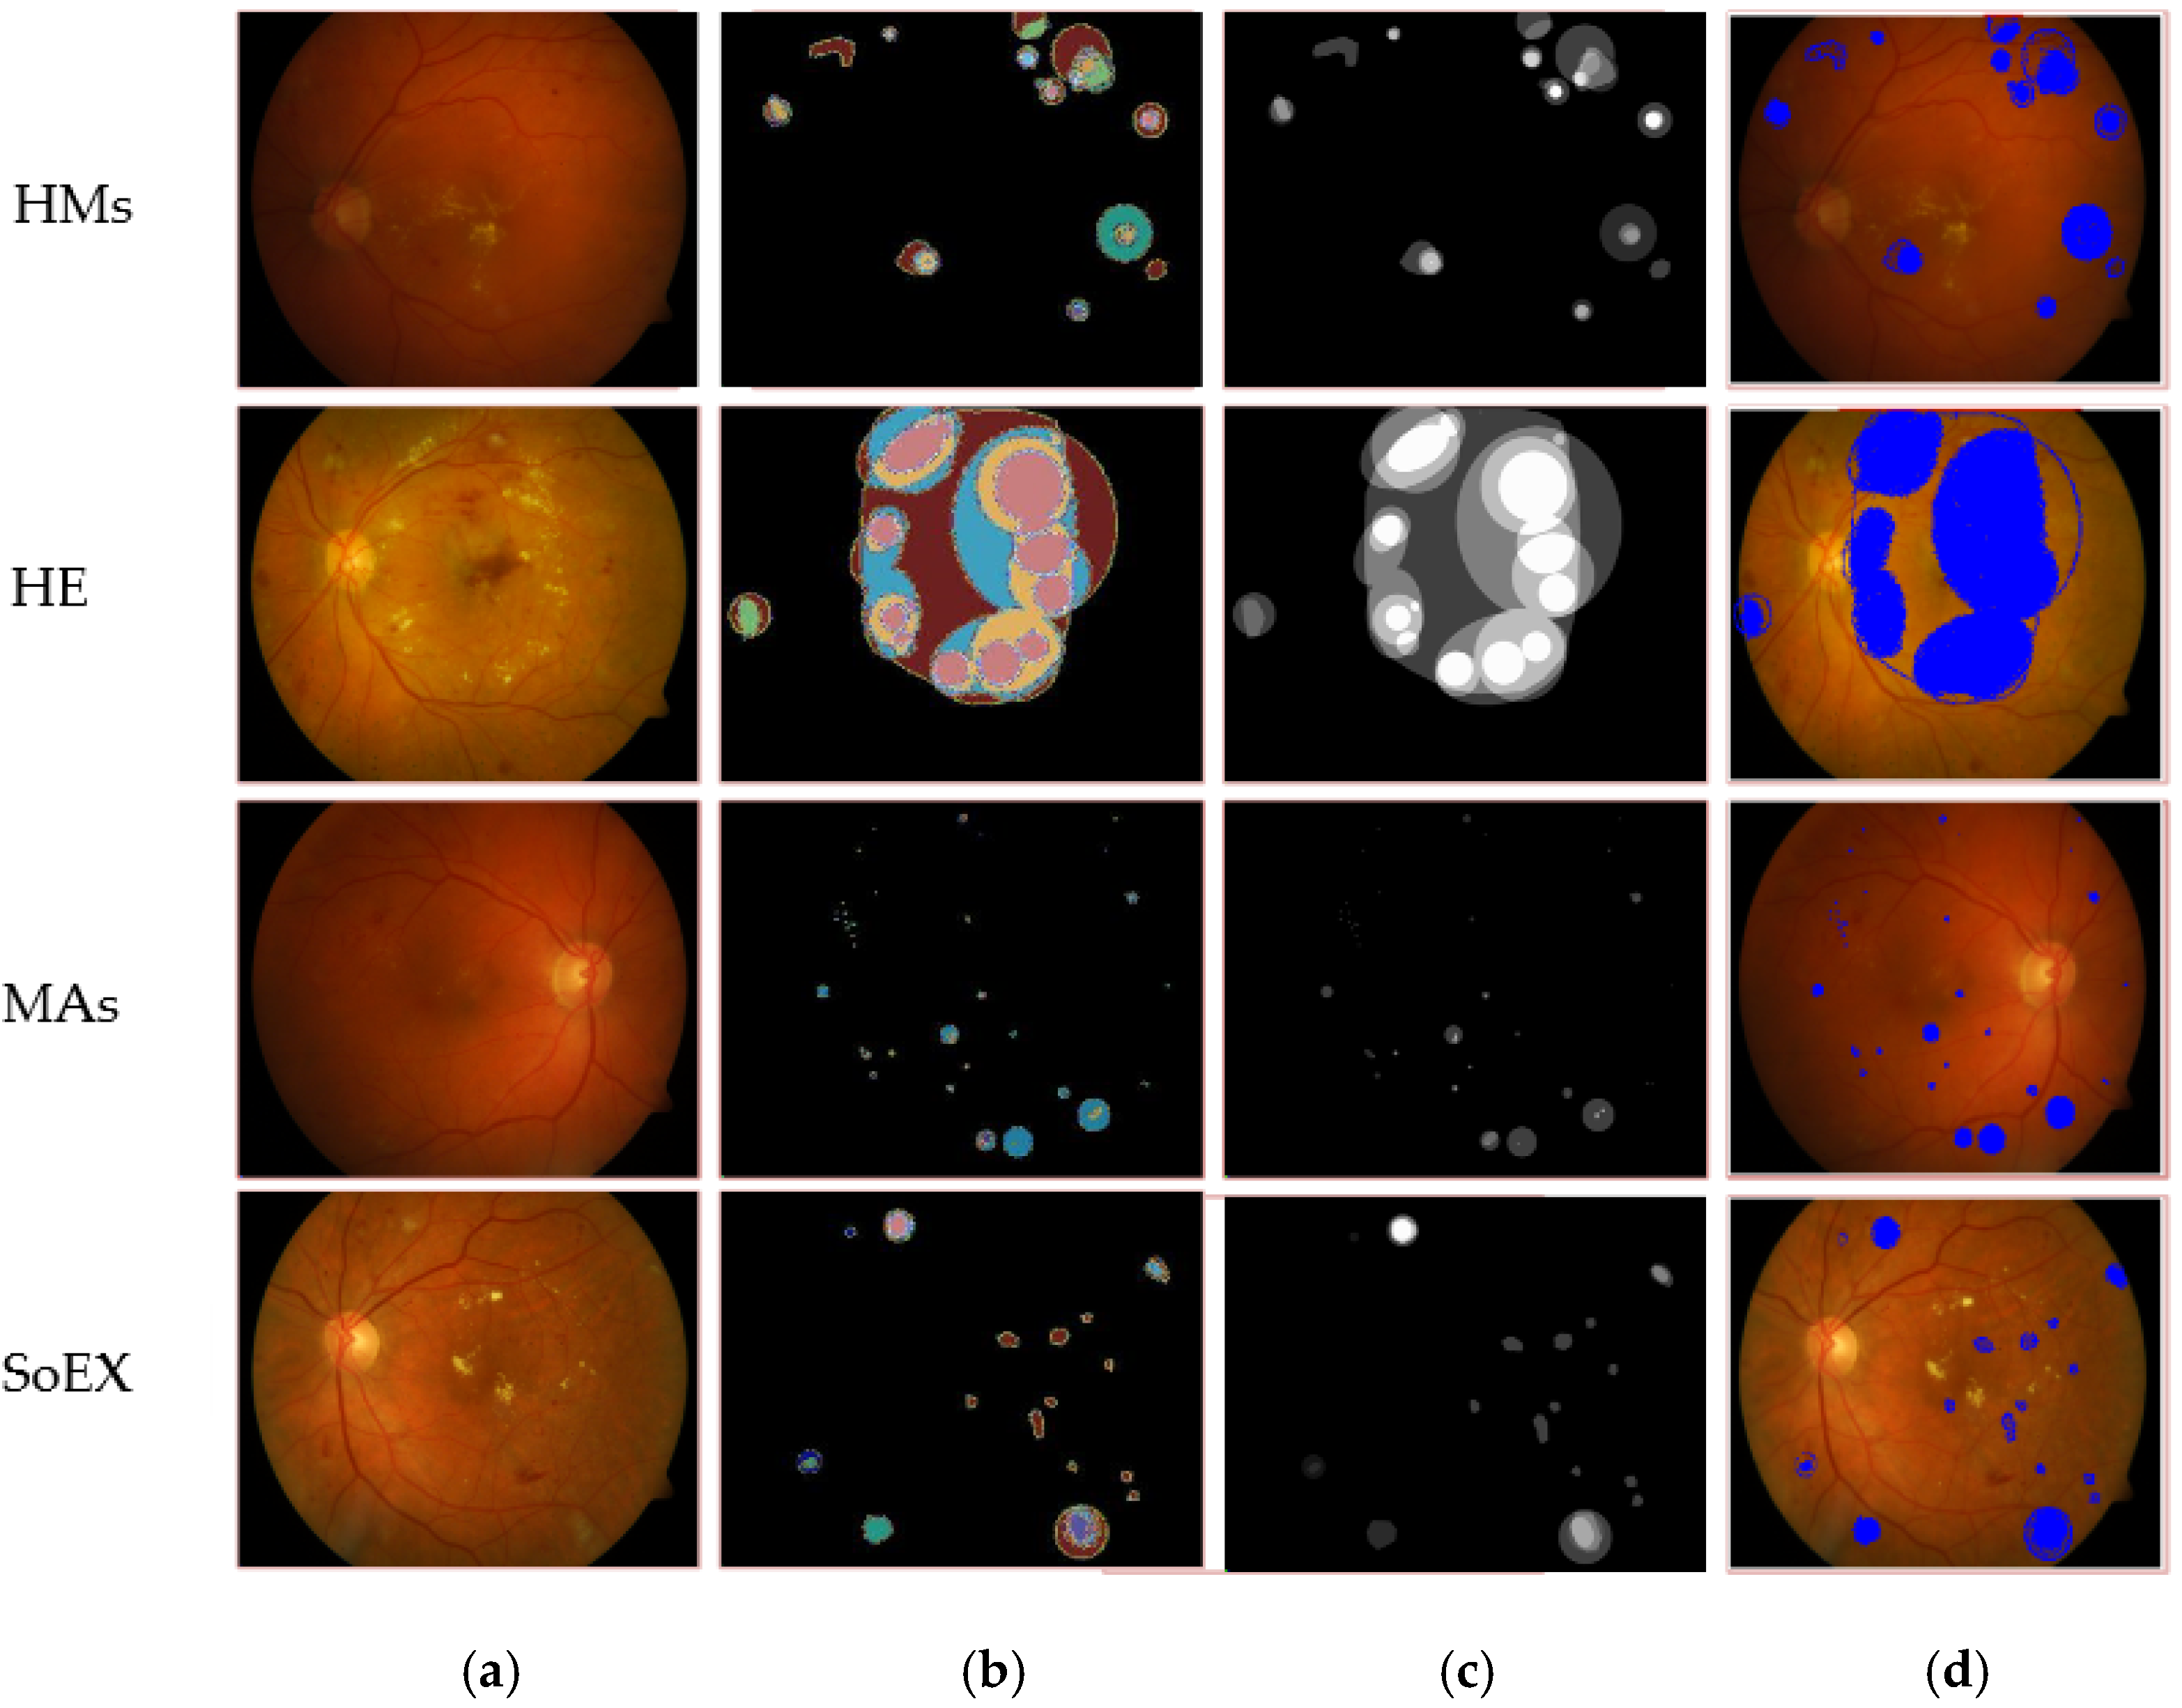
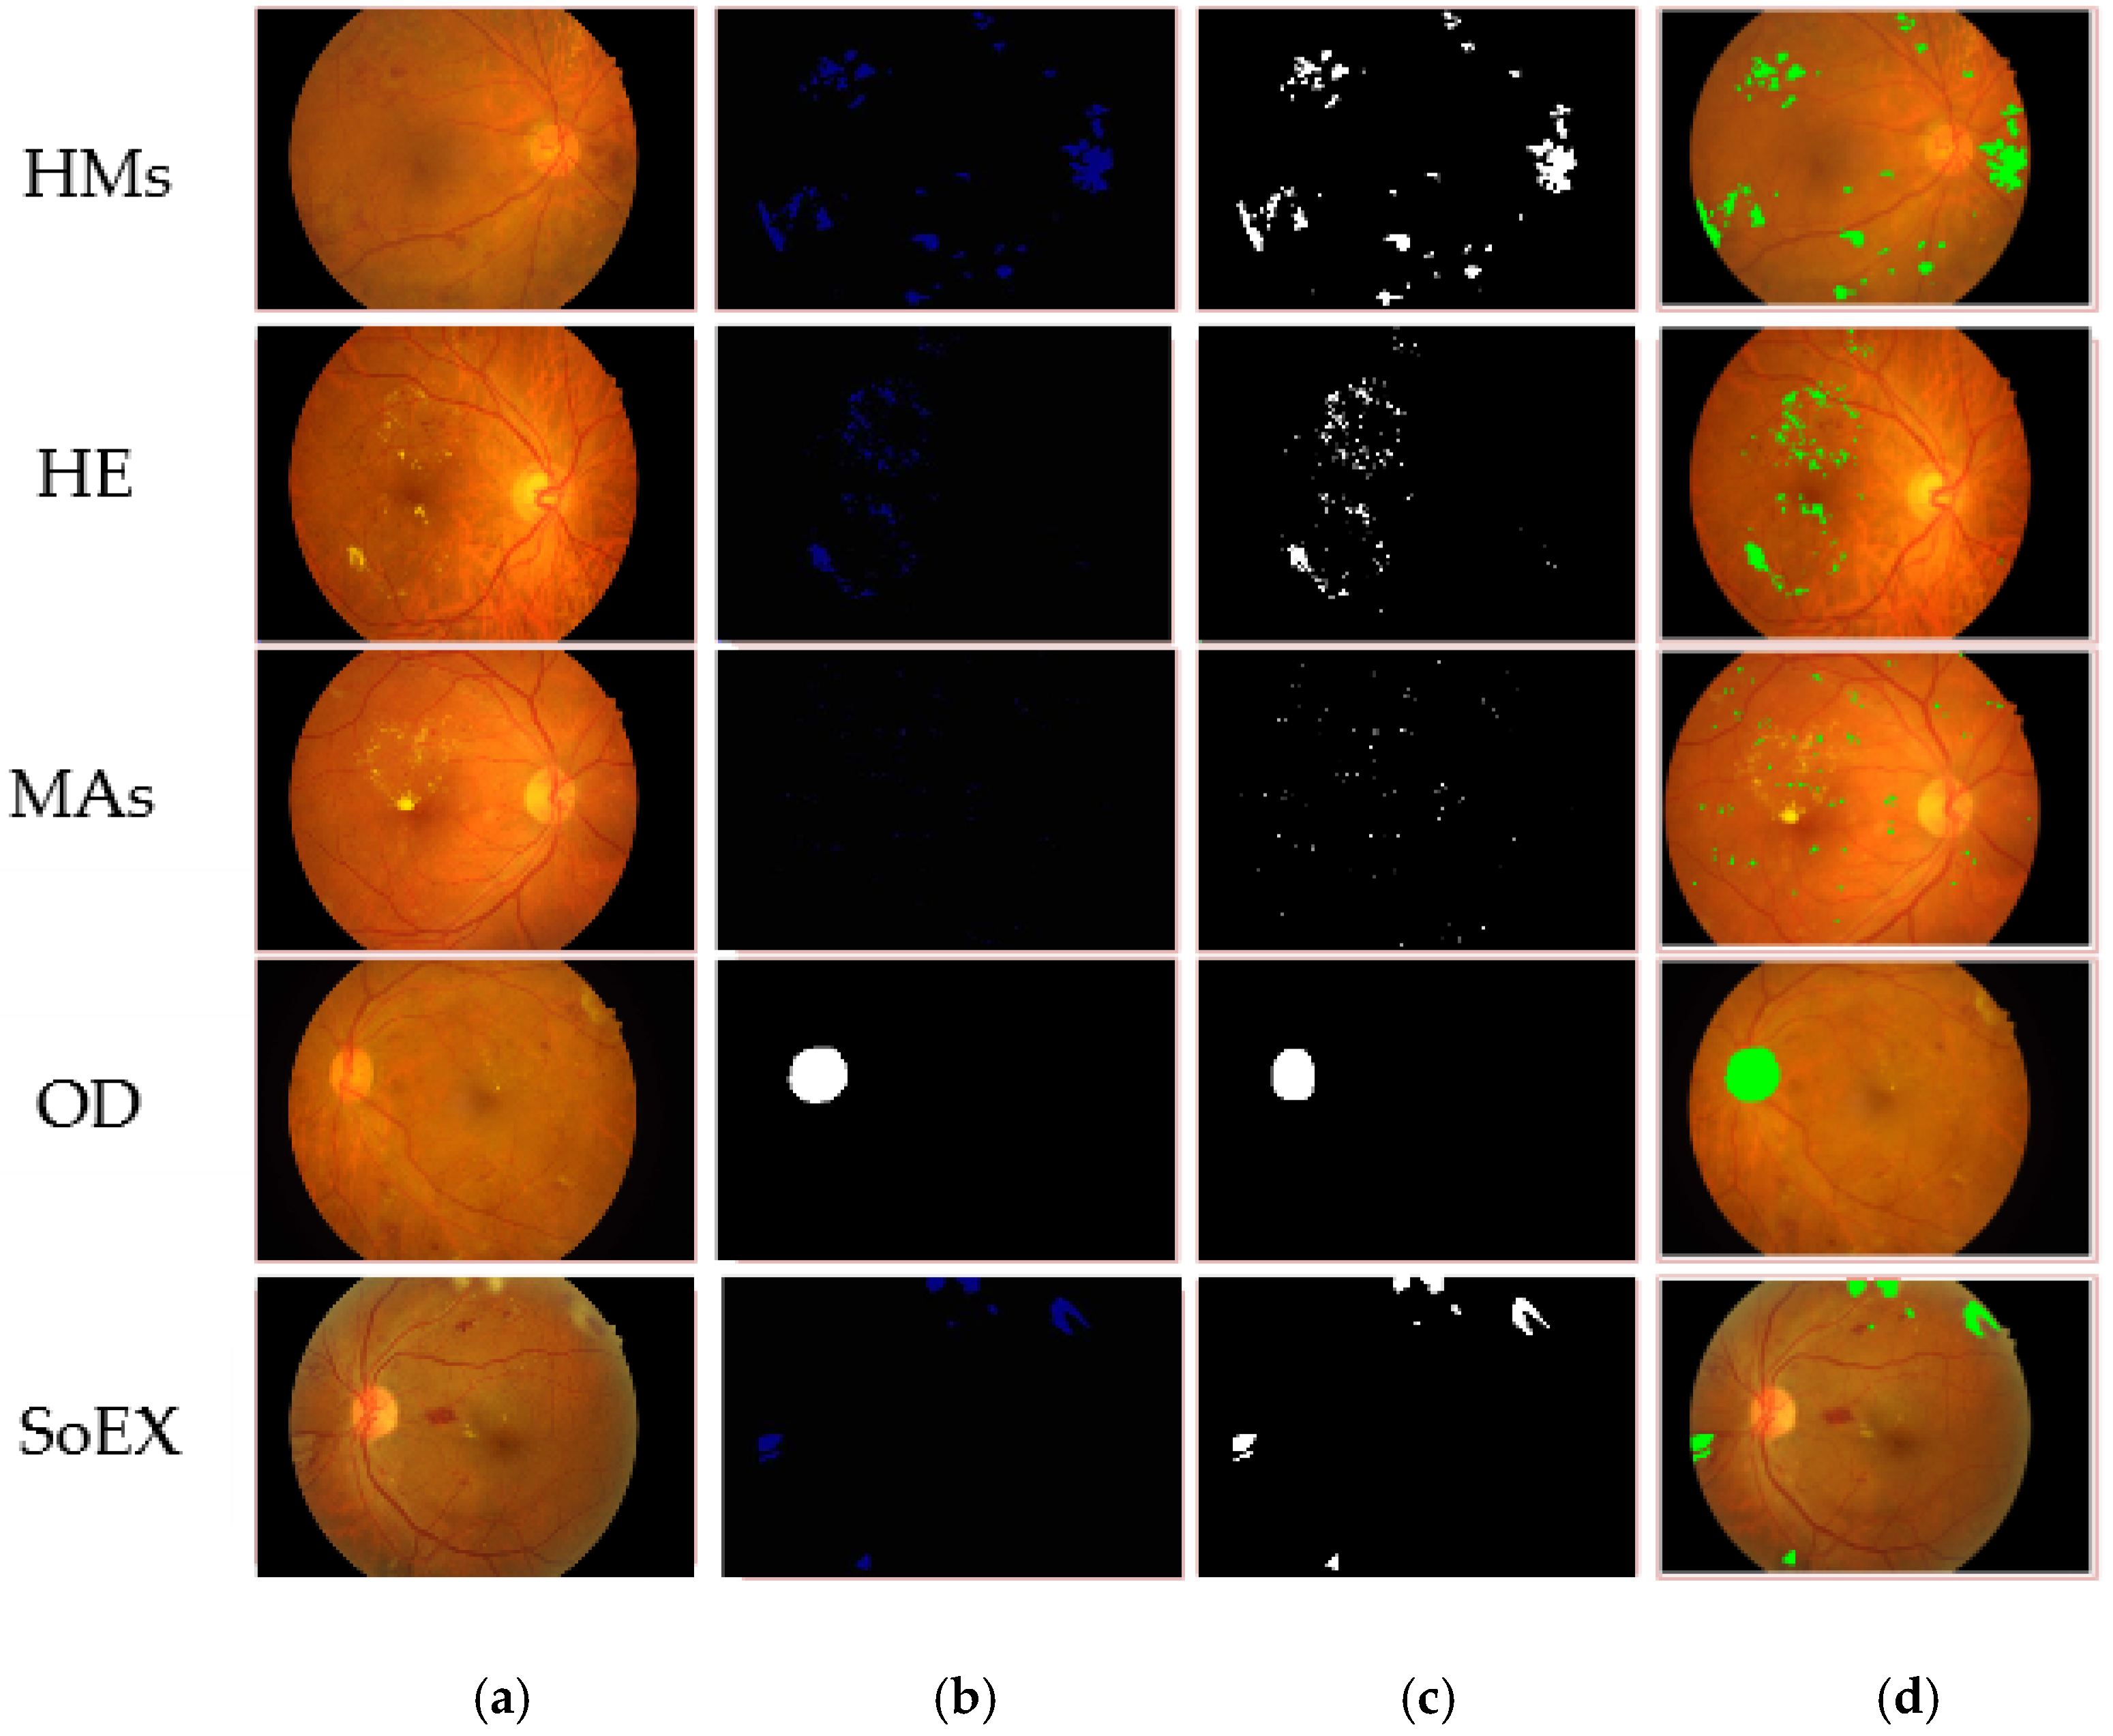
4.1. Experiment 1: DR-Lesions Segmentation

The semantic segmentation method is used to segment the multi-class DR lesions such as MA, HM, HE, SE, and OD. Here, the model is trained with the ground truth mask that gives the best result in the testing phase. It uses mIoU, mDice, F1-score, precision, recall, and accuracy measures as presented in Table 5.
Table 5 shows the segmentation results on three benchmark datasets such as e-ophtha-EX, DIARETDB1, and IDRiD. The proposed model gives mIoU of 0.94 for EX; on DIARETDB1, 0.87 mIoU for HM, 0.71 mIoU for HE, 0.87 mIoU for MA, and 0.86 mIoU for SoEX; on the IDRiD dataset, 0.86 mIoU for HM, 0.88 mIoU for HE, 0.71 mIoU for MA, 0.86 mIoU for OD, and 0.84 mIoU for SoEX. The proposed method segmentation results for the benchmark datasets are given in Figure 5, Figure 6 and Figure 7.
Table 6 compares the results of the segmentation approach with the existing methods.
Table 6 presents the results for segmentation of the DR lesions using IDRiD, E-ophtha, and DIARETDB1 datasets. DARNet is proposed for segmentation using IDRiD and e-ophtha-EX datasets that provide an average accuracy of 0.9582 on IDRiD and 0.9617 on e-ophtha-EX [53]. A nested U-Net Zhou is used for red lesion segmentation using the DIARETDB1 dataset, which provides 79.21% F1-Score and 88.79% SEN [54]. EAD-Net architecture is presented for the segmentation using the e-ophtha-EX dataset. A modified U-Net network is used for DR lesion segmentation, such as for MA and HE. It is used on IDRiD and e-ophtha datasets. This network obtains 99.88% accuracy and a 0.9998 dice score both for MA and HE segmentation [18]. The MResUNet model is used for MA segmentation. The model achieves SEN of 61.96% for IDRID and 85.87% for DiaretDB1 datasets [52].
The existing methods are evaluated in terms of average accuracy; therefore, the proposed method results are compared to the existing methods using average accuracy measures on three benchmark datasets such as IDRiD, E-ophtha, and DIARETDB1.
The results presented in Table 6 show that the proposed method provides 0.96 Acc and 0.98 Sensitivity on the IDRiD dataset, while the existing methods [53,67,68,69] yield 0.95 Acc, 0.87 Sensitivity, 0.83 Acc, and 0.80 Acc, respectively.
Similarly, the proposed method performed better on the E-ophtha dataset, having an Acc of 0.97, which is greater than that of the existing method [53] with an Acc of 0.96.
The proposed method also provided better results on the DIARETDB1 dataset with 0.99 Sensitivity as compared to existing methods [52,54,70] that provided 0.88, 0.61, and 0.85 sensitivity, respectively. It is concluded that the overall proposed method performed well on three benchmark datasets such as IDRiD, E-ophtha, and DIARETDB1 as compared to all existing methods having the same datasets and average accuracy measure.
In comparison to the previous works, the segmentation model in this research is developed by combining Xception and Deeplabv3 models. These models are trained on optimal hyperparameters that provide improved segmentation results.

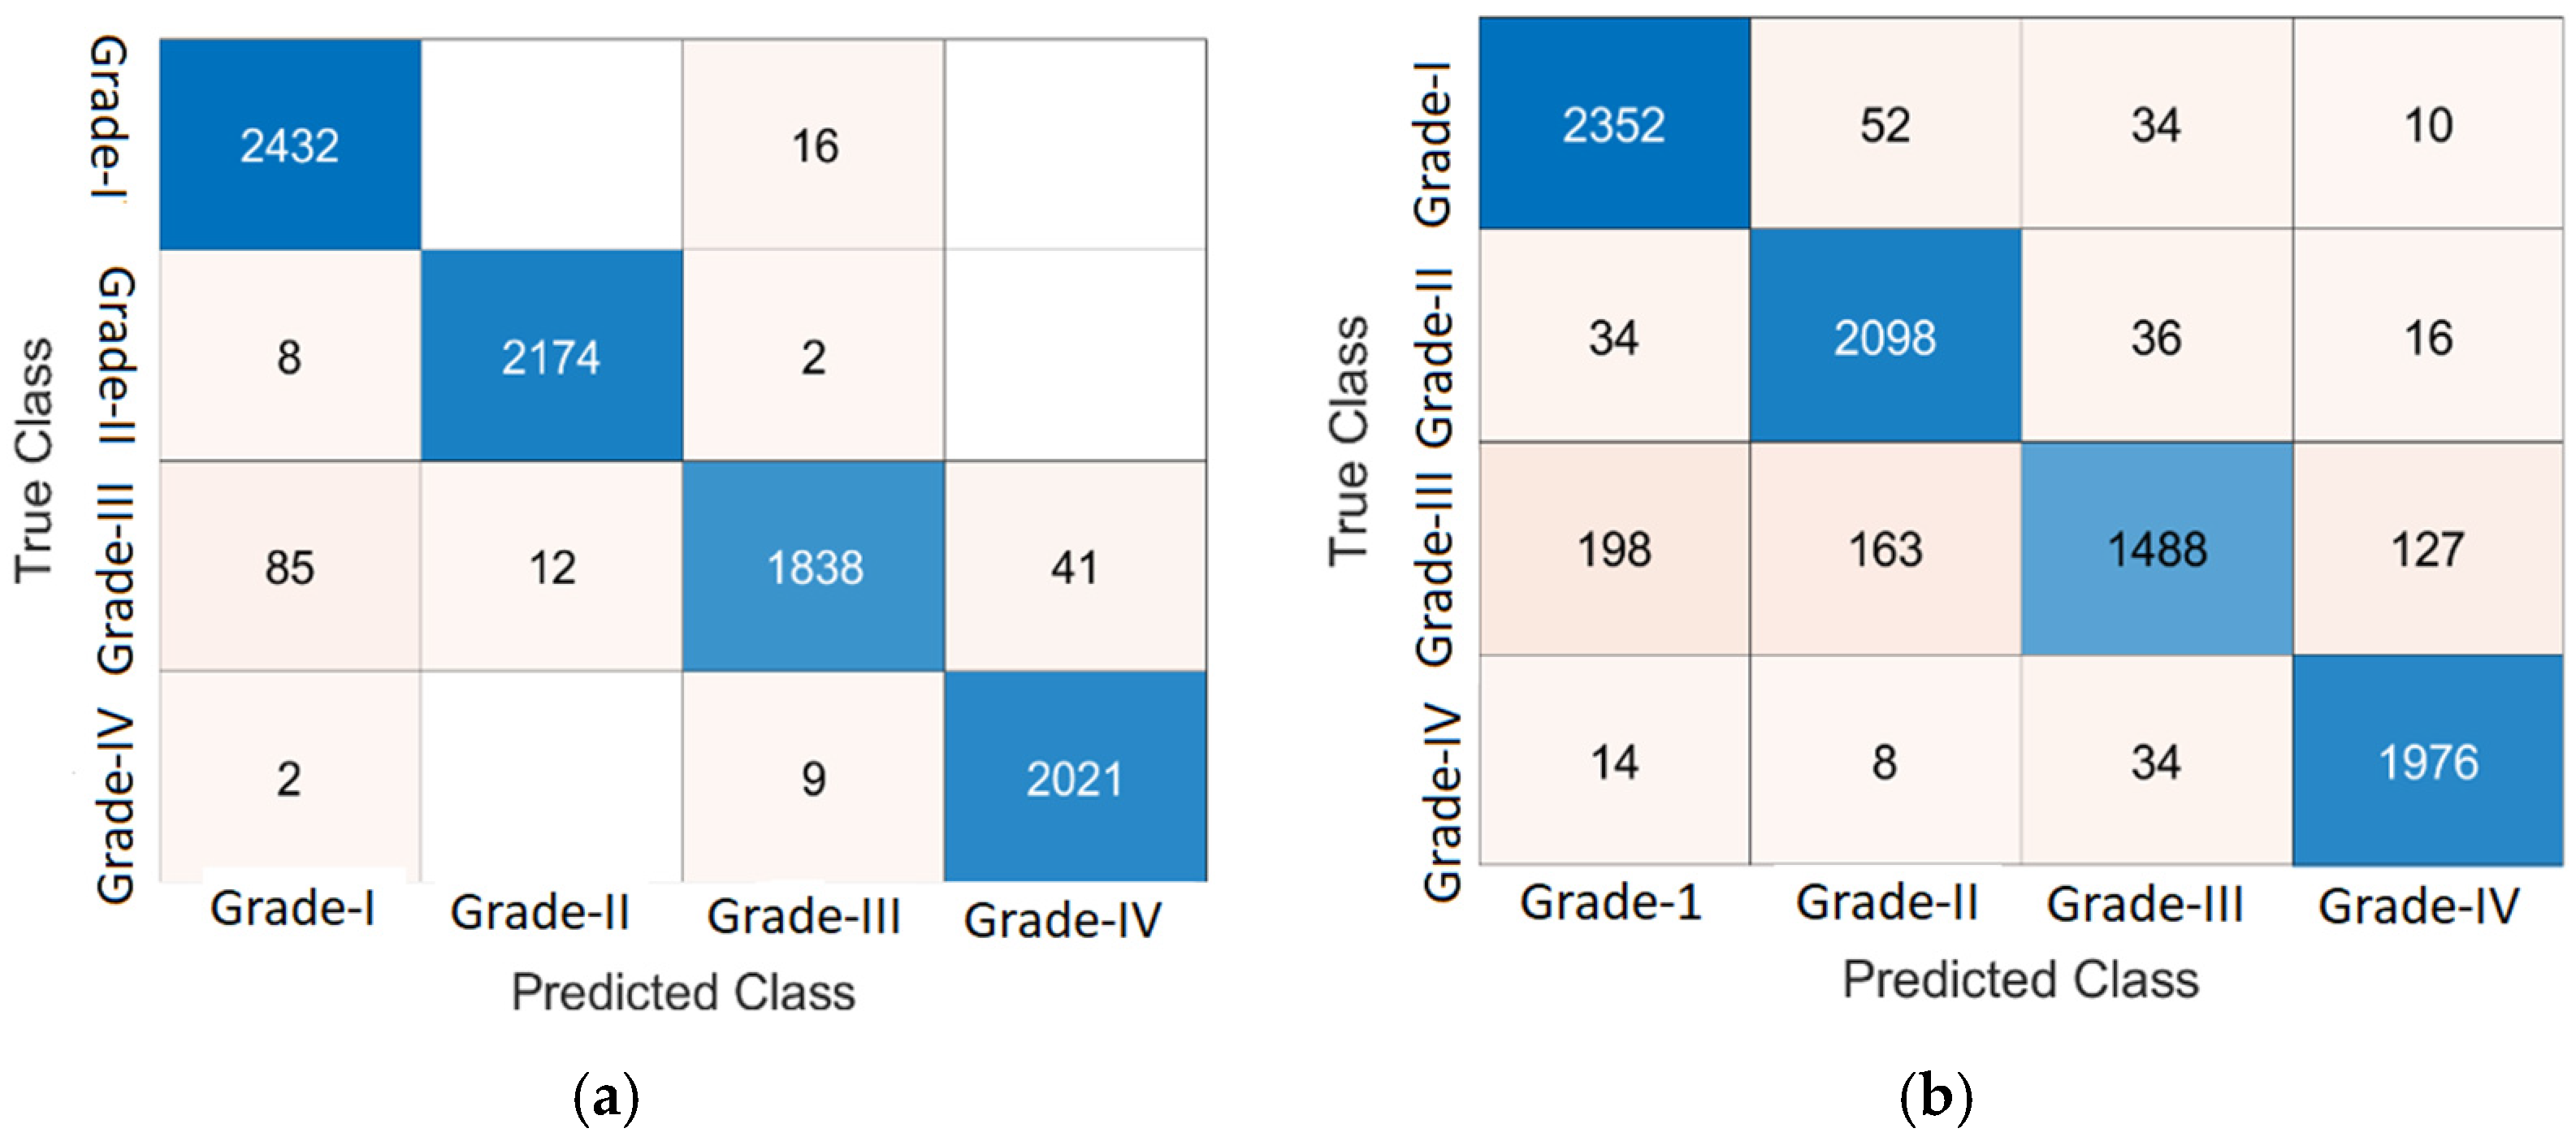
4.2. Experiment 2: DR Lesions Classification

In this experiment, two benchmark classifiers, KNN and NN, are used for DR classification. The DR classification results are computed on a benchmark dataset as presented in Table 7 and Table 8. Figure 8 presents the classification results in a confusion matrix.
Figure 8 presents the results of classification on 10-fold cross-validation using KNN and NN classifiers. The computed classification results are presented in Table 7 using a KNN classifier.
Table 7 shows the classification result of KNN on 10-fold cross-validation. Here, the grade 0 level achieves 86.57% accuracy by using weighted KNN, 98.72% by optimizable KNN, 96.75% by cosine KNN, and 97.94% by fine KNN. Grade 1 yields the following accuracies: 97.08% by weighted KNN, 99.75% by optimizable KNN, 95.56% by cosine KNN, and 99.29%by fine KNN. The attained accuracy for grade 2 is 87.77% using weighted KNN, 98.09% by optimizable KNN, 96.53% by cosine KNN, and 97.73% by fine KNN. Achieved accuracy in grade 3 is 98.32% by using weighted KNN, 99.4% by optimizable KNN, 98.48% by cosine KNN, and 99.29% by fine KNN. The DR classification results of the NN classifier on 10-fold cross-validation are presented in Table 8.
Table 8 shows the classification results of NN on 10-fold cross-validation. Here, grade 0 gives 95.8% accuracy by using a narrow neural network, 95.78% by medium neural network, 96.04% by wide neural network, 95.35% by bilayered neural network, and 94.12% by trilayered neural network. In grade 1, the following accuracies are achieved: 95.67% by narrow neural network, 96.38% by medium neural network, 96.42% by wide neural network, 95.56% by bilayered neural network, and 95.34% by trilayered neural network. The attained accuracy for grade 2 is 90.94% by narrow neural network, 92.11% by medium neural network, 93.15% by wide neural network, 90.47% by bilayered neural network, and 89.04% by trilayered neural network. Achieved accuracies in grade 3 are 96.2% by narrow neural network, 97.04% by medium neural network, 97.58% by wide neural network, 96.35% by bilayered neural network, and 96.16% by trilayered neural network.

4.3. Significance Test

In this experiment, Monte Carlo simulation is performed using fine KNN on the Messidor dataset. Here, mean and standard deviation values are computed using 10, 15, and 20 different iterations. The classification results of these iterations, including the mean and standard deviation of classification with a graphical representation of the classification score, are presented in Figure 9.
In Figure 9, the whisker box plot represents the distribution of the score. Here, the orange color represents the median distribution, and the triangle green color shows the arithmetic mean. Distribution is symmetric on the same symbol values, and the mean value attain the central position. This method provides help for the selection of appropriate heuristic values using different iterations. On 10-fold cross-validation, greater than 0.925 accuracy is achieved. The classification task is performed in 15-fold, and the results are presented in Figure 10.
In Figure 10, the achieved classification accuracy is greater than 0.95. The classification results are computed on 20 iterations, as depicted in Figure 11.
The classification accuracy after 20 cross-fold validation is greater than 0.95. Table 9 presents the comparison results of the classification methods.
VGG-16 and Inception-V3 provide 98.5%, 98.9%, and 98.0% accuracy, SEN, and specificity, respectively [71]. For classification, Alexnet architecture gives the accuracy of 96.6% on grade 0, 96.2% on grade 1, 95.6% on grade 2 and 96.6% on grade 3 [17]. Different architectures are used for the classification of DR. Optimal results are obtained using ResNet50-based architecture with achieved accuracy of 0.92 for grade 0 and grade 1, and 0.93 and 0.81 for grade 2 and grade 3, respectively [1]. A capsule network is proposed for classification of DR lesions that provides accuracy of 97.98% for grade 0, 97.65% for grade 1, 97.65% for grade 2, and 98.64% for grade 3 [72]. The pre-trained Inception-ResNet-v2 model is used for classification that provides an accuracy of 72.33% on the MESSIDOR dataset [73]. The proposed classification model achieves better results because of serially fused features and optimum feature selection by MPA optimizer.

5. Conclusions

DR lesion segmentation and classification are challenging tasks. Some challenges include variable size shape and irregular location of the lesion. The Xception and deeplabv3 models have been integrated to devise a single model. This model is trained on selected hyperparameters for DR lesion segmentation. The proposed model optimally segments the DR lesions. The performance measures are 0.94 for mIoU, 0.97 for mDice, 0.99 for F1-score, 0.95 for precision, and 0.99 for Recall on the e-ophtha-EX dataset. Further, performance on the DIARETDB1 dataset includes mIOU of 0.87 on HM, 0.71 on HE, 0.87 on MA, and 0.86 on SoEX. Using the IDRiD dataset, mIOU of 0.86 on HM, 0.88 on HE, 0.71 on MA, 0.86 on OD, and 0.84 on SoEX are achieved. The classification is performed based on 10-fold cross-validation using KNN and neural network classifiers. Optimizable KNN achieved an accuracy of 97.97%, with a precision of 0.99 on grade 0, 1.00 on grade 1, 0.93 on grade 2, and 0.99 on grade 3. The proposed classification model accurately classifies the DR grades using serially fused features and a swarm intelligence algorithm.

Author Contributions

Conceptualization, N.S. and J.A.; methodology, M.S., F.A., S.K. (Seifedine Kadry); software, S.K. (Sujatha Krishnamoorthy); validation, N.S., J.A., M.S., F.A., S.K. (Seifedine Kadry), S.K. (Sujatha Krishnamoorthy). All authors have read and agreed to the published version of the manuscript.

Funding

This research was funded by Wenzhou kean university grant number ICRP and The APC was funded by PI of the project sujatha krishnamoorthy.

Conflicts of Interest

The authors declare no conflict of interest.

References

  1. Martinez-Murcia, F.J.; Ortiz, A.; Ramírez, J.; Górriz, J.M.; Cruz, R. Deep residual transfer learning for automatic diagnosis and grading of diabetic retinopathy. Neurocomputing 2021, 452, 424–434. [Google Scholar] [CrossRef]
  2. Amin, J.; Sharif, M.; Yasmin, M.; Ali, H.; Fernandes, S.L. A method for the detection and classification of diabetic retinopathy using structural predictors of bright lesions. J. Comput. Sci. 2017, 19, 153–164. [Google Scholar] [CrossRef]
  3. Amin, J.; Anjum, M.A.; Malik, M. Fused information of DeepLabv3+ and transfer learning model for semantic segmentation and rich features selection using equilibrium optimizer (EO) for classification of NPDR lesions. Knowl.-Based Syst. 2022, 249, 108881. [Google Scholar] [CrossRef]
  4. Wong, T.Y.; Sun, J.; Kawasaki, R.; Ruamviboonsuk, P.; Gupta, N.; Lansingh, V.C.; Maia, M.; Mathenge, W.; Moreker, S.; Muqit, M.M.; et al. Guidelines on Diabetic Eye Care: The International Council of Ophthalmology Recommendations for Screening, Follow-up, Referral, and Treatment Based on Resource Settings. Ophthalmology 2018, 125, 1608–1622. [Google Scholar] [CrossRef] [PubMed]
  5. Wilkinson, C.; Ferris, F.; Klein, R.; Lee, P.; Agardh, C.D.; Davis, M.; Dills, D.; Kampik, A.; Pararajasegaram, R.; Verdaguer, J.T. Proposed international clinical diabetic retinopathy and diabetic macular edema disease severity scales. Ophthalmology 2003, 110, 1677–1682. [Google Scholar] [CrossRef]
  6. Dubow, M.; Pinhas, A.; Shah, N.; Cooper, R.F.; Gan, A.; Gentile, R.C.; Hendrix, V.; Sulai, Y.N.; Carroll, J.; Chui, T.Y.P.; et al. Classification of Human Retinal Microaneurysms Using Adaptive Optics Scanning Light Ophthalmoscope Fluorescein Angiography. Investig. Opthalmol. Vis. Sci. 2014, 55, 1299–1309. [Google Scholar] [CrossRef]
  7. Murugesan, N.; Üstunkaya, T.; Feener, E.P. Thrombosis and Hemorrhage in Diabetic Retinopathy: A Perspective from an Inflammatory Standpoint. Semin. Thromb. Hemost. 2015, 41, 659–664. [Google Scholar] [CrossRef]
  8. Amin, J.; Sharif, M.; Yasmin, M. A Review on Recent Developments for Detection of Diabetic Retinopathy. Scientifica 2016, 2016, 6838976. [Google Scholar] [CrossRef]
  9. Decencière, E.; Zhang, X.; Cazuguel, G.; Lay, B.; Cochener, B.; Trone, C.; Gain, P.; Ordóñez-Varela, J.-R.; Massin, P.; Erginay, A.; et al. Feedback on a publicly distributed image database: The messidor database. Image Anal. Ster. 2014, 33, 231–234. [Google Scholar] [CrossRef]
  10. Mateen, M.; Wen, J.; Nasrullah, N.; Sun, S.; Hayat, S. Exudate Detection for Diabetic Retinopathy Using Pretrained Convolutional Neural Networks. Complexity 2020, 2020, 5801870. [Google Scholar] [CrossRef] [Green Version]
  11. Adem, K. Exudate detection for diabetic retinopathy with circular Hough transformation and convolutional neural networks. Expert Syst. Appl. 2018, 114, 289–295. [Google Scholar] [CrossRef]
  12. Saxena, G.; Verma, D.K.; Paraye, A.; Rajan, A.; Rawat, A. Improved and robust deep learning agent for preliminary detection of diabetic retinopathy using public datasets. Intell. Med. 2020, 3–4, 100022. [Google Scholar] [CrossRef]
  13. Amin, J.; Sharif, M.; Rehman, A.; Raza, M.; Mufti, M.R. Diabetic retinopathy detection and classification using hybrid feature set. Microsc. Res. Tech. 2018, 81, 990–996. [Google Scholar] [CrossRef] [PubMed]
  14. Koh, J.E.W.; Ng, E.Y.K.; Bhandary, S.V.; Laude, A.; Acharya, U.R. Automated detection of retinal health using PHOG and SURF features extracted from fundus images. Appl. Intell. 2017, 48, 1379–1393. [Google Scholar] [CrossRef]
  15. Nazir, T.; Irtaza, A.; Shabbir, Z.; Javed, A.; Akram, U.; Mahmood, M.T. Diabetic retinopathy detection through novel tetragonal local octa patterns and extreme learning machines. Artif. Intell. Med. 2019, 99, 101695. [Google Scholar] [CrossRef] [PubMed]
  16. Sungheetha, A.; Sharma, R. Design an early detection and classification for diabetic retinopathy by deep feature extraction based convolution neural network. J. Trends Comput. Sci. Smart Technol. 2021, 3, 81–94. [Google Scholar] [CrossRef]
  17. Shanthi, T.; Sabeenian, R. Modified Alexnet architecture for classification of diabetic retinopathy images. Comput. Electr. Eng. 2019, 76, 56–64. [Google Scholar] [CrossRef]
  18. Sambyal, N.; Saini, P.; Syal, R.; Gupta, V. Modified U-Net architecture for semantic segmentation of diabetic retinopathy images. Biocybern. Biomed. Eng. 2020, 40, 1094–1109. [Google Scholar] [CrossRef]
  19. Sambyal, N.; Saini, P.; Syal, R.; Gupta, V. Modified residual networks for severity stage classification of diabetic retinopathy. Evol. Syst. 2022, 163, 1–19. [Google Scholar] [CrossRef]
  20. Xiao, Q.; Zou, J.; Yang, M.; Gaudio, A.; Kitani, K.; Smailagic, A.; Costa, P.; Xu, M. Improving Lesion Segmentation for Diabetic Retinopathy Using Adversarial Learning. In Image Analysis and Recognition; Springer Nature Switzerland AG: Cham, Switzerland, 2019; pp. 333–344. [Google Scholar] [CrossRef]
  21. Amin, J.; Sharif, M.; Yasmin, M.; Fernandes, S.L. A distinctive approach in brain tumor detection and classification using MRI. Pattern Recognit. Lett. 2017, 139, 118–127. [Google Scholar] [CrossRef]
  22. Sharif, M.I.; Li, J.P.; Amin, J.; Sharif, A. An improved framework for brain tumor analysis using MRI based on YOLOv2 and convolutional neural network. Complex Intell. Syst. 2021, 7, 2023–2036. [Google Scholar] [CrossRef]
  23. Saba, T.; Mohamed, A.S.; El-Affendi, M.; Amin, J.; Sharif, M. Brain tumor detection using fusion of hand crafted and deep learning features. Cogn. Syst. Res. 2019, 59, 221–230. [Google Scholar] [CrossRef]
  24. Amin, J.; Sharif, M.; Raza, M.; Saba, T.; Anjum, M.A. Brain tumor detection using statistical and machine learning method. Comput. Methods Programs Biomed. 2019, 177, 69–79. [Google Scholar] [CrossRef] [PubMed]
  25. Amin, J.; Sharif, M.; Raza, M.; Yasmin, M. Detection of Brain Tumor based on Features Fusion and Machine Learning. J. Ambient Intell. Humaniz. Comput. 2018, 1274, 1–17. [Google Scholar] [CrossRef]
  26. Amin, J.; Sharif, M.; Gul, N.; Yasmin, M.; Shad, S.A. Brain tumor classification based on DWT fusion of MRI sequences using convolutional neural network. Pattern Recognit. Lett. 2019, 129, 115–122. [Google Scholar] [CrossRef]
  27. Sharif, M.; Amin, J.; Raza, M.; Yasmin, M.; Satapathy, S.C. An integrated design of particle swarm optimization (PSO) with fusion of features for detection of brain tumor. Pattern Recognit. Lett. 2019, 129, 150–157. [Google Scholar] [CrossRef]
  28. Amin, J.; Sharif, M.; Yasmin, M.; Saba, T.; Anjum, M.A.; Fernandes, S.L. A New Approach for Brain Tumor Segmentation and Classification Based on Score Level Fusion Using Transfer Learning. J. Med. Syst. 2019, 43, 326. [Google Scholar] [CrossRef]
  29. Amin, J.; Sharif, M.; Raza, M.; Saba, T.; Sial, R.; Shad, S.A. Brain tumor detection: A long short-term memory (LSTM)-based learning model. Neural Comput. Appl. 2019, 32, 15965–15973. [Google Scholar] [CrossRef]
  30. Amin, J.; Sharif, M.; Raza, M.; Saba, T.; Rehman, A. Brain tumor classification: Feature fusion. In Proceedings of the 2019 International Conference on Computer and Information Sciences (ICCIS), Aljouf, Saudi Arabia, 3–4 April 2019; pp. 1–6. [Google Scholar]
  31. Amin, J.; Sharif, M.; Yasmin, M.; Saba, T.; Raza, M. Use of machine intelligence to conduct analysis of human brain data for detection of abnormalities in its cognitive functions. Multimedia Tools Appl. 2019, 79, 10955–10973. [Google Scholar] [CrossRef]
  32. Amin, J.; Sharif, A.; Gul, N.; Anjum, M.A.; Nisar, M.W.; Azam, F.; Bukhari, S.A.C. Integrated design of deep features fusion for localization and classification of skin cancer. Pattern Recognit. Lett. 2019, 131, 63–70. [Google Scholar] [CrossRef]
  33. Amin, J.; Sharif, M.; Gul, N.; Raza, M.; Anjum, M.A.; Nisar, M.W.; Bukhari, S.A.C. Brain Tumor Detection by Using Stacked Autoencoders in Deep Learning. J. Med. Syst. 2019, 44, 32. [Google Scholar] [CrossRef]
  34. Sharif, M.; Amin, J.; Raza, M.; Anjum, M.A.; Afzal, H.; Shad, S.A. Brain tumor detection based on extreme learning. Neural Comput. Appl. 2020, 32, 15975–15987. [Google Scholar] [CrossRef]
  35. Amin, J.; Sharif, M.; Anjum, M.A.; Raza, M.; Bukhari, S.A.C. Convolutional neural network with batch normalization for glioma and stroke lesion detection using MRI. Cogn. Syst. Res. 2019, 59, 304–311. [Google Scholar] [CrossRef]
  36. Muhammad, N.; Sharif, M.; Amin, J.; Mehboob, R.; Gilani, S.A.; Bibi, N.; Javed, H.; Ahmed, N. Neurochemical Alterations in Sudden Unexplained Perinatal Deaths—A Review. Front. Pediatr. 2018, 6, 6. [Google Scholar] [CrossRef] [PubMed]
  37. Sharif, M.; Amin, J.; Nisar, M.W.; Anjum, M.A.; Muhammad, N.; Shad, S. A unified patch based method for brain tumor detection using features fusion. Cogn. Syst. Res. 2019, 59, 273–286. [Google Scholar] [CrossRef]
  38. Sharif, M.; Amin, J.; Siddiqa, A.; Khan, H.U.; Malik, M.S.A.; Anjum, M.A.; Kadry, S. Recognition of Different Types of Leukocytes Using YOLOv2 and Optimized Bag-of-Features. IEEE Access 2020, 8, 167448–167459. [Google Scholar] [CrossRef]
  39. Anjum, M.A.; Amin, J.; Sharif, M.; Khan, H.U.; Malik, M.S.A.; Kadry, S. Deep Semantic Segmentation and Multi-Class Skin Lesion Classification Based on Convolutional Neural Network. IEEE Access 2020, 8, 129668–129678. [Google Scholar] [CrossRef]
  40. Sharif, M.; Amin, J.; Yasmin, M.; Rehman, A. Efficient hybrid approach to segment and classify exudates for DR prediction. Multimedia Tools Appl. 2018, 79, 11107–11123. [Google Scholar] [CrossRef]
  41. Amin, J.; Sharif, M.; Anjum, M.A.; Khan, H.U.; Malik, M.S.A.; Kadry, S. An Integrated Design for Classification and Localization of Diabetic Foot Ulcer Based on CNN and YOLOv2-DFU Models. IEEE Access 2020, 8, 228586–228597. [Google Scholar] [CrossRef]
  42. Amin, J.; Sharif, M.; Yasmin, M. Segmentation and classification of lung cancer: A review. Immunol. Endocr. Metab. Agents Med. Chem. 2016, 16, 82–99. [Google Scholar] [CrossRef]
  43. Umer, M.J.; Amin, J.; Sharif, M.; Anjum, M.A.; Azam, F.; Shah, J.H. An integrated framework for COVID -19 classification based on classical and quantum transfer learning from a chest radiograph. Concurr. Comput. Pract. Exp. 2021, 34, e6434. [Google Scholar] [CrossRef] [PubMed]
  44. Amin, J.; Anjum, M.A.; Sharif, M.; Saba, T.; Tariq, U. An intelligence design for detection and classification of COVID19 using fusion of classical and convolutional neural network and improved microscopic features selection approach. Microsc. Res. Tech. 2021, 84, 2254–2267. [Google Scholar] [CrossRef] [PubMed]
  45. Amin, J.; Sharif, M.; Anjum, M.A.; Siddiqa, A.; Kadry, S.; Nam, Y.; Raza, M. 3D Semantic Deep Learning Networks for Leukemia Detection. Comput. Mater. Contin. 2021, 69, 785–799. [Google Scholar] [CrossRef]
  46. Amin, J.; Anjum, M.A.; Sharif, M.; Kadry, S.; Nam, Y.; Wang, S. Convolutional Bi-LSTM Based Human Gait Recognition Using Video Sequences. Comput. Mater. Contin. 2021, 68, 2693–2709. [Google Scholar] [CrossRef]
  47. Amin, J.; Anjum, M.A.; Sharif, M.; Rehman, A.; Saba, T.; Zahra, R. Microscopic segmentation and classification of COVID -19 infection with ensemble convolutional neural network. Microsc. Res. Tech. 2021, 85, 385–397. [Google Scholar] [CrossRef]
  48. Saleem, S.; Amin, J.; Sharif, M.; Anjum, M.A.; Iqbal, M.; Wang, S.-H. A deep network designed for segmentation and classification of leukemia using fusion of the transfer learning models. Complex Intell. Syst. 2022, 8, 3105–3120. [Google Scholar] [CrossRef]
  49. Amin, J.; Anjum, M.A.; Sharif, M.; Kadry, S.; Nam, Y. Fruits and Vegetable Diseases Recognition Using Convolutional Neural Networks. Comput. Mater. Contin. 2022, 70, 619–635. [Google Scholar] [CrossRef]
  50. Linsky, T.W.; Vergara, R.; Codina, N.; Nelson, J.W.; Walker, M.J.; Su, W.; Barnes, C.O.; Hsiang, T.Y.; Esser-Nobis, K.; Yu, K.; et al. De novo design of potent and resilient hACE2 decoys to neutralize SARS-CoV-2. Science 2020, 370, 1208–1214. [Google Scholar] [CrossRef]
  51. Feng, Z.; Yang, J.; Yao, L.; Qiao, Y.; Yu, Q.; Xu, X. Deep Retinal Image Segmentation: A FCN-Based Architecture with Short and Long Skip Connections for Retinal Image Segmentation. In Proceedings of the International Conference on Neural Information Processing, Guangzhou, China, 14–18 November 2017; Springer: Berlin/Heidelberg, Germany, 2017; pp. 713–722. [Google Scholar] [CrossRef]
  52. Qomariah, D.; Nopember, I.T.S.; Tjandrasa, H.; Fatichah, C. Segmentation of Microaneurysms for Early Detection of Diabetic Retinopathy Using MResUNet. Int. J. Intell. Eng. Syst. 2021, 14, 359–373. [Google Scholar] [CrossRef]
  53. Guo, Y.; Peng, Y. Multiple lesion segmentation in diabetic retinopathy with dual-input attentive RefineNet. Appl. Intell. 2022, 344, 1–25. [Google Scholar] [CrossRef]
  54. Kundu, S.; Karale, V.; Ghorai, G.; Sarkar, G.; Ghosh, S.; Dhara, A.K. Nested U-Net for Segmentation of Red Lesions in Retinal Fundus Images and Sub-image Classification for Removal of False Positives. J. Digit. Imaging, 2022; epub ahead of print. [Google Scholar] [CrossRef]
  55. Wan, C.; Chen, Y.; Li, H.; Zheng, B.; Chen, N.; Yang, W.; Wang, C.; Li, Y. EAD-Net: A Novel Lesion Segmentation Method in Diabetic Retinopathy Using Neural Networks. Dis. Markers 2021, 2021, 1–13. [Google Scholar] [CrossRef] [PubMed]
  56. Abdullah, M.; Fraz, M.M.; Barman, S. Localization and segmentation of optic disc in retinal images using Circular Hough transform and Grow Cut algorithm. PeerJ 2016, 4, e2003. [Google Scholar] [CrossRef] [PubMed]
  57. Chollet, F. Xception: Deep learning with depthwise separable convolutions. In Proceedings of the IEEE Conference on Computer Vision and Pattern Recognition, Honolulu, HI, USA, 21–26 July 2017; pp. 1251–1258. [Google Scholar]
  58. Tan, M.; Le, Q. EfficientNet: Rethinking model scaling for convolutional neural networks. Int. Conf. Mach. Learn. 2019, 6105–6114. [Google Scholar]
  59. Iandola, F.N.; Han, S.; Moskewicz, M.W.; Ashraf, K.; Dally, W.J.; Keutzer, K. SqueezeNet: AlexNet-level accuracy with 50x fewer parameters and <0.5 MB model size. arXiv 2016, arXiv:1602.07360. [Google Scholar]
  60. Balakrishnan, K.; Dhanalakshmi, R.; Khaire, U.M. Analysing stable feature selection through an augmented marine predator algorithm based on opposition-based learning. Expert Syst. 2021, 39, e12816. [Google Scholar] [CrossRef]
  61. Soomro, T.A.; Zheng, L.; Afifi, A.J.; Ali, A.; Soomro, S.; Yin, M.; Gao, J. Image Segmentation for MR Brain Tumor Detection Using Machine Learning: A Review. IEEE Rev. Biomed. Eng. 2022, 1–21. [Google Scholar] [CrossRef] [PubMed]
  62. Gardoll, S.; Boucher, O. Classification of tropical cyclone containing images using a convolutional neural network: Performance and sensitivity to the learning dataset. EGUsphere 2022, preprint. [Google Scholar] [CrossRef]
  63. Chen, L.-C.; Zhu, Y.; Papandreou, G.; Schroff, F.; Adam, H. Encoder-decoder with atrous separable convolution for semantic image segmentation. In Proceedings of the European Conference on Computer Vision (ECCV), Munich, Germany, 8–14 September 2018; pp. 801–818. [Google Scholar]
  64. Kauppi, T.; Kalesnykiene, V.; Kamarainen, J.-K.; Lensu, L.; Sorri, I.; Raninen, A.; Voutilainen, R.; Uusitalo, H.; Kalviainen, H.; Pietila, J. The diaretdb1 diabetic retinopathy database and evaluation protocol. In Proceedings of the British Machine Vision Conference 2007, Coventry, UK, 10–13 September 2007; pp. 61–65. [Google Scholar] [CrossRef]
  65. Decencière, E.; Cazuguel, G.; Zhang, X.; Thibault, G.; Klein, J.-C.; Meyer, F.; Marcotegui, B.; Quellec, G.; Lamard, M.; Danno, R.; et al. TeleOphta: Machine learning and image processing methods for teleophthalmology. IRBM 2013, 34, 196–203. [Google Scholar] [CrossRef]
  66. Porwal, P.; Pachade, S.; Kamble, R.; Kokare, M.; Deshmukh, G.; Sahasrabuddhe, V.; Meriaudeau, F. Indian diabetic retinopathy image dataset (IDRiD): A database for diabetic retinopathy screening research. Data 2018, 3, 25. [Google Scholar] [CrossRef]
  67. Xu, Y.; Zhou, Z.; Li, X.; Zhang, N.; Zhang, M.; Wei, P. FFU-Net: Feature Fusion U-Net for Lesion Segmentation of Diabetic Retinopathy. BioMed Res. Int. 2021, 2021, 1–12. [Google Scholar] [CrossRef]
  68. Valizadeh, A.; Ghoushchi, S.J.; Ranjbarzadeh, R.; Pourasad, Y. Presentation of a Segmentation Method for a Diabetic Retinopathy Patient’s Fundus Region Detection Using a Convolutional Neural Network. Comput. Intell. Neurosci. 2021, 2021, 1–14. [Google Scholar] [CrossRef] [PubMed]
  69. Jadhav, M.L.; Shaikh, M.Z.; Sardar, V.M. Automated Microaneurysms Detection in Fundus Images for Early Diagnosis of Diabetic Retinopathy. In Data Engineering and Intelligent Computing; Springer: Singapore, 2021; pp. 87–95. [Google Scholar] [CrossRef]
  70. Sharma, A.; Shinde, S.; Shaikh, I.I.; Vyas, M.; Rani, S. Machine Learning Approach for Detection of Diabetic Retinopathy with Improved Pre-Processing. In Proceedings of the 2021 International Conference on Computing, Communication, and Intelligent Systems (ICCCIS), Greater Noida, India, 19–20 February 2021; pp. 517–522. [Google Scholar] [CrossRef]
  71. Nneji, G.U.; Cai, J.; Deng, J.; Monday, H.N.; Hossin, A.; Nahar, S. Identification of Diabetic Retinopathy Using Weighted Fusion Deep Learning Based on Dual-Channel Fundus Scans. Diagnostics 2022, 12, 540. [Google Scholar] [CrossRef] [PubMed]
  72. Kalyani, G.; Janakiramaiah, B.; Karuna, A.; Prasad, L.V.N. Diabetic retinopathy detection and classification using capsule networks. Complex Intell. Syst. 2021, 2821, 1–14. [Google Scholar] [CrossRef]
  73. Gangwar, A.K.; Ravi, V. Diabetic Retinopathy Detection Using Transfer Learning and Deep Learning. In Evolution in Computational Intelligence; Springer: Singapore, 2020; pp. 679–689. [Google Scholar] [CrossRef]
Figure 1. Symptoms of NPDR lesions [9]: (a) HEs (b) HMs (c) MAs (d) OD (e) SoEX.
Jpm 12 01454 g001
Figure 2. Steps of proposed method for segmentation and classification.
Jpm 12 01454 g002
Figure 3. Proposed model for NPDR lesion segmentation.
Jpm 12 01454 g003
Figure 4. Best selected features using MPA.
Jpm 12 01454 g004
Figure 5. Segmented EX lesions of the e-ophtha-EX dataset. (a) Input image, (b) proposed segmentation, (c) ground truth image, (d) segmented region mapped on the input image.
Jpm 12 01454 g005
Figure 6. Segmented DR lesion outcomes on DIARETDB1 dataset. (a) Input image, (b) proposed segmentation, (c) ground truth image, (d) segmented region mapped on the input image.
Jpm 12 01454 g006
Figure 7. Segmented DR lesions on IDRiD dataset. (a) Input image, (b) proposed segmentation, (c) ground truth image, (d) segmented region mapped on the input image.
Jpm 12 01454 g007
Figure 8. Classification of DR lesions. (a) KNN of the optimizable kernel, (b) NN of medium neural network.
Jpm 12 01454 g008
Figure 9. Confidence interval of classification accuracy by performing Monte Carlo simulation on 10-fold cross-validation using Messidor dataset.
Jpm 12 01454 g009
Figure 10. Confidence interval of classification accuracy by performing Monte Carlo simulation on 15 iterations using Messidor dataset.
Jpm 12 01454 g010
Figure 11. Confidence interval of classification accuracy by performing Monte Carlo simulation on 20 iterations using Messidor dataset.
Jpm 12 01454 g011
Table 1. Hyperparameters of the proposed segmentation model.
OptimizerEpochs for TrainingSize BatchLearning RateError Rate
Sgdm200320.00010.02
Adam160.04
RmsProp80.06
Momentum640.07
Table 2. Pre-trained parameters of MPA.
Lower Bound (lb)0
Upper Bound (ub)1
Threshold (thres)0.5
Levy Component (beta)1.5
Constant (P)0.5
Fish Aggregating Devices Effect (FADs)0.2
Table 3. Classification dataset description.
DR LevelsDescriptionGrades
NormalHealthy0
Mild (NPDR)Mas1
Moderate (NPDR)Few MAs or HMs2
PDRMore MAs and HMs3
Table 4. Description of segmentation datasets.
DatasetsDescription
DIARETDB1Total images:89
Normal:5
Mild NPDR:84
e-ophtha-EXNormal: 35
Exudates:47
IDRiDMAs:81
HE:81
HMs:80
SoEX:40
Table 5. Results of segmentation method using benchmark datasets.
DatasetsLesionsmIoUmDiceF1-ScorePrecision (P)RecallAccuracy (Acc)
e-ophtha-EXEX0.940.970.980.940.990.96
DIARETDB1HM0.870.830.720.870.990.87
HE0.710.830.920.710.990.71
MA0.870.830.720.870.990.87
SE0.860.880.870.861.000.86
IDRiDHM0.860.880.880.861.000.86
HE0.880.840.810.881.000.88
MA0.710.830.920.711.000.71
OD0.860.870.870.861.000.86
SE0.840.830.820.870.980.97
Table 6. Comparison of segmentation results.
RefYearMethodDatasetResults
[53]2022Dual-input attentive RefineNet (DARNet)IDRiD0.95 Acc
[67]2021U-Net0.87 Sensitivity
[68]2021U-Net0.83 Acc
[69]2021SVM0.80 Acc
Proposed Model0.96 Acc, 0.98 Sensitivity
[53]2022DARNetE-ophtha-EX0.96 Acc
Proposed Model0.97 Acc
[54]2022Nested U-NetDIARETDB10.88 Sensitivity
[52]2021MResUNet0.61 Sensitivity
[70]2020U-Net 0.85 Sensitivity
Proposed Model0.99 Sensitivity
Table 7. Classification results on 10-fold cross-validation using KNN classifier.
GradeAccuracyPrecisionRecallF1 ScoreOverall Accuracy
Weighted KNN086.57%1.000.680.8184.87%
197.08%0.940.940.94
287.77%0.471.000.64
398.32%0.940.990.96
Optimizable KNN098.72%0.990.960.9897.97%
199.75%1.000.990.99
298.09%0.930.990.96
399.40%0.990.980.99
Cosine KNN096.75%0.990.910.9593.66%
195.56%0.840.990.90
296.53%0.940.910.93
398.48%0.980.960.97
Fine KNN097.94%1.000.940.9697.13%
199.29%0.990.980.99
297.73%0.910.990.95
399.29%0.980.990.98
Table 8. Classification results on 10-fold cross-validation using NN classifier.
Narrow Neural NetworkGradeAccuracyPrecisionRecallF1 ScoreOverall Accuracy
095.80%0.960.900.9389.31%
195.67%0.960.880.92
290.94%0.670.910.77
396.20%0.970.880.92
Medium Neural Network095.78%0.960.900.9390.65%
196.38%0.960.910.93
292.11%0.720.920.81
397.04%0.970.910.94
Wide Neural Network096.04%0.960.910.9391.60%
196.42%0.960.900.93
293.15%0.750.930.83
397.58%0.970.930.95
Bilayered Neural Network095.35%0.950.890.9288.87%
195.56%0.950.880.92
290.47%0.670.890.76
396.35%0.960.890.93
Trilayered Neural Network094.12%0.940.860.9087.33%
195.34%0.950.880.91
289.04%0.610.870.72
396.16%0.960.890.92
Table 9. Comparison of classification results.
Ref#YearMethodDatasetOverall Acc%Grade-0%Grade-1%Grade-2%Grade-3%
[71]2022WFDLNMessidor0.98----
[17]2019Modified Alexnet-0.960.960.950.96
[1]2021ResNet50-0.930.930.810.92
[72]2021CapsNet-0.970.970.970.98
[73]2021Inception-ResNet-v20.72----
Proposed method0.990.980.990.980.99
Publisher’s Note: MDPI stays neutral with regard to jurisdictional claims in published maps and institutional affiliations.

