1. Introduction
Abnormal dopamine transporter (DAT) uptake is an important biomarker for the clinical diagnosis of Lewy body disease (LBD), including Parkinson’s disease (PD) and dementia with Lewy bodies (DLB). Patients with PD should present with abnormal DAT uptake; therefore, a normal DAT scan (DaTscan) definitively excludes PD diagnosis [
1]. A DaTscan has a sensitivity of 78–88% and a specificity of 90–100% for differentiating DLB from Alzheimer’s disease (AD) [
2]. The 2017 consensus criteria included abnormal DAT uptake as an indicative biomarker for DLB diagnosis [
3]. Thus, DaTscan findings can strongly influence the accuracy of the clinical diagnosis of PD and DLB [
1,
3]. Furthermore, even non-LBD brain disorders can exhibit mixed Lewy body pathology in later stages, such as those observed in AD [
4,
5,
6] or vascular cognitive impairment (VCI) [
7,
8]. A diagnosis of mixed pathology has a higher clinical significance, making DaTscans vital for diagnosing brain disorders with LBD.
Several methods are used in clinical or research settings to determine whether the DaTscan results are normal or abnormal, including visual rating (VR) [
9,
10], striatal/background ratio (SBR), caudate/putamen ratio using semiquantification [
11,
12], and diagnosis supplementary with artificial intelligence (AI) and machine learning (ML) or deep learning (DL) [
13,
14]. A systematic review indicated that DaTscans can differentiate DLB from non-DLB, with a pooled sensitivity and specificity of 86.5% and 93.6%, respectively [
15]. Differences in accuracy among studies may be due to several reasons, including variations in the scanning lens or machine, condition setting, rater experience, rating methods, study population, and accuracy of clinical diagnosis methods. Use of ML or DL might further increase the diagnostic power [
13,
14]. Therefore, many studies have used ML or DL for the supplementary diagnosis of neurodegenerative disorders, such as DaTscan for PD; however, its clinical application remains uncertain. In addition, this novel diagnostic approach has never been used for diagnosing DLB. Furthermore, whether AI-derived tools established in one center provide similar diagnostic power when applied in other centers remains unclear.
To clarify the applicability of an AI-derived diagnostic tool that uses DaTscans for PD diagnosis as well as DLB, we used an ML-derived visual scale (ML-VS); this scale was designed in one medical center and applied to two other centers. Diagnostic accuracy was compared using the traditional diagnostic approach using VR or semiquantification, and the correlation between these tools was analyzed.
2. Methods
This was a two-phase study. The design phase was executed in the nuclear medicine department of a medical center in central Taiwan. The test phase was executed in two other centers in Taiwan.
2.1. Design Phase
2.1.1. Procedure for the Development of the ML-VS
Image Data
Method of Tc-99m TRODAT-1 brain SPECT
Brain images were acquired 3–6 h after intravenous administration of 20 mCi of Tc-S99m TRODAT-1 by using a dual-head SPECT/CT scanner (Infinia/Hawkeye4 or Discovery 670 pro, GE Healthcare, Waukesha, WI, USA), equipped with a parallel hole, low-energy high-resolution collimator, with the following parameters: 1.4 zoom, 120 projections, 25 s per projection, and 128 × 128 image matrix size. The acquired images were processed using Xeleris 3.1 Workstation (GE Healthcare) and were further reconstructed using the filtered back projection with a Metz filter (Power 3.5). Attenuation correction was performed using the first-order Chang method (attenuation coefficient µ = 0.12/cm).
Study population
This study retrospectively collected data from 1253 patients who underwent Tc-99m TRODAT-1 brain SPECT as part of routine clinical examinations in China Medical University Hospital, Taichung, Taiwan, between May 2011 and July 2014. This study was approved by the Medical Ethics Committee of China Medical University Hospital (DMR99-IRB-293-(CR10)). The patient age range was 19–95 years. A 6-point visual scale, including the intermediate point, of each patient was retrieved from routine reports, which was provided by an experienced board-certified nuclear medicine physician, who visually interpreted the representative transaxial images of the corpus striata [
16].
Table 1 presents the number of patients at each point.
Computing Equipment
Lists of laboratory equipment
This model was developed to be suitable for clinical end computers. Therefore, model training was conducted through NVIDIA DGX2(Nvidia Corporation, Santa Clara, CA, USA), and the model, after training, was successfully compiled on multiple clinical end computers. The DGX2 equipment list is as follows: processor: Dual Intel Xeon Platinum 8168, 2.7 GHz, 24-cores *2; memory: 1.5-TB RAM; graphics card: NVIDIA TeslaV100 * 16; GPU memory 512 GB.
Data Preprocessing
Preprocessing included image normalization and predicted image postprocessing.
Image normalization
Because the functional examination image scan will cause varying image characteristics, due to the different extent of absorption of radiopharmaceuticals in patients, it will produce different tabletop images. The changed parameters of the processing result in different values of the output image (pixel), which will cause the image to have a gap; so as not to affect the image characteristics judged by the model, the image must be virtualized.
is the image, where
and
are the minimum and maximum values in the image, respectively. The equation is as follows:
Predict image postprocessing
(1). Image intensity correction
The value of the image is different on different machines. Therefore, we performed intensity correction on the input image. We collected the pixel average value of the training data image as
and calculated the pixel average value of the input image as
. Then, we adjusted the intensity of the input image according to the calculated ratio. The equation was as follows:
(2). Image rescale
In step two, the image may be different because of different medical centers. Therefore, pixel spacing in Dicom was used to calculate the size ratio. The pixel spacing in our training data was 2.21 for
. The pixel spacing of the input data was
. In our study, the rows and columns of the training data were 128 × 128. When the size ratio was calculated, we used the Python package OpenCV to resize. Finally, the center point of the image was used to crop to the size of 128 × 128. The equation for calculating the size ratio was as follows:
Model: random forest
Random forest (RF) is a nonparametric supervised learning method used for classification and regression. RF training is a commonly used method in ML. The goal of RF is to create a model that predicts the value of a target variable based on several input variables, and classification or regression models are built in the form of a tree structure. It divides data into smaller and smaller subsets, while incrementally developing an associated decision tree. RF involves the construction of multiple classification and regression trees (classification and regression trees (CART)), the implementation of joint decision-making (Gini index, GINI algorithm), and the addition of randomly allocated training data to reduce the entropy of the data [
1]. The advantages of a decision tree model are as follows: (a) the tree is visualizable, making it easy to understand and explain, (b) it can analyze both numerical and categorical data and multioutput problems, and (c) it requires low computing power. The use of RF for PD diagnosis has been published [
17].
2.2. Study Phase
Participants were selected from the History-based Artificial Intelligent Clinical Dementia Diagnostic System (HAICDDS) database, which is currently applied in the Show Chwan Health System [
18,
19,
20,
21,
22]. All participants and their primary caregivers were interviewed by a trained neuropsychologist, and the registration database contained their complete demographic characteristics, clinical history, cognitive impairment, or dementia staging using the Clinical Dementia Rating scale, neuropsychological and neuropsychiatric assessments, and laboratory and neuroimaging data for diagnosing disease severity, as well as common subtypes of dementia. In this study, we analyzed the data of normal controls (NCs) and patients with PD, PDD, DLB, or AD.
The brain images were acquired 3–6 h after intravenous administration of 30 mCi of Tc-99m TRODAT-1 by using dual-head SPECT/CT scanners (Infinia/Hawkeye4, GE Healthcare, Waukesha, WI, USA or Symbia Truepoint, Siemens, Hoffman Estates, Illinois), equipped with a fanbeam collimator, with the following parameters: 1.0 (GE Healthcare) or 1.78 (Siemens) zoom, 60 projections, 30 s per projection, and 128 × 128 image matrix size. The acquired images were processed with Xeleris 3.1 (GE Healthcare) or Syngo-p (Siemens) Workstation and were further reconstructed using filtered back projection with a Metz filter (Power 3.5). Attenuation correction was performed using the first-order Chang method (attenuation coefficient µ = 0.12/cm). Semiquantification with SBR was calculated by subtracting the mean counts per pixel in the occipital cortex (OC) from the mean counts per pixel in the whole striatum and by dividing the result by the mean counts per pixel in the background, as follows: (striatum − OC)/OC.
2.2.1. Diagnosis of NC, PD, PDD, DLB, or AD
The participants were categorized as NC if they had a global Clinical Dementia Rating Scale (CDR) score of 0 and no established brain disorder [
23]. PD was diagnosed according to the MDS 2015 criteria [
1]. Patients with PDD were diagnosed according to the clinical criteria for probable PDD developed by the MDS in 2007 [
24]. DLB was diagnosed according to the revised consensus criteria for probable DLB, developed by the fourth report of the DLB consortium [
3]. AD was diagnosed according to the criteria for probable AD, developed by the National Institute on Aging and the Alzheimer’s Association workgroup (NIA-AA) [
25].
2.2.2. Procedure of the Test Phase
This was a retrospective study. Daily function was assessed using the History-Based Artificial Intelligent Activities of Daily Living (HAIADL) questionnaire [
18]. Cognitive function was assessed using the Cognitive Abilities Screening Instrument (CASI) [
26] and the Montreal Cognitive Assessment (MoCA) [
27]. Neuropsychiatric symptoms were assessed using the Neuropsychiatric Inventory (NPI) [
28]. Cognitive tests and neuropsychiatric symptoms for all patients were performed by trained neuropsychologists.
3. Statistics
The Chinese version of SPSS 22.0 for Windows (IBM, Armonk, NY, USA) was used for statistical analyses. Comparisons of demographic data, neuropsychological tests, sum of boxes of CDR (CDR-SB), HAIADL, MoCA, CASI, and sum of score of the Neuropsychiatric Inventory (NPI-sum) between different groups were conducted using an independent t test or one-way analysis of variance, with either Bonferroni or Dunnett T3 post hoc analysis according to the homogeneity of variance. Sex was compared using the chi-square test. Sensitivity and specificity were calculated using 2 × 2 tables, and the area under the receiver operating characteristic curve (AUROC) of ML-VS, SBR-R, and SBR-L were used to compare their superiority. To determine the cutoff scores for the differentiation of different cognitive stages, the following Youden index was applied: maximum = sensitivity + specificity − 1. The significance level was set at p < 0.05 for all hypothesis tests. The Spearman correlation coefficients of ML-VS/SBR-R and ML-VS/SBR-L in all participants are summarized.
4. Results
We included 715 individuals, including 122 NCs, 286 patients with PD, 40 with AD, 179 with DLB, and 88 with PDD. The dementia and nondementia groups were compared separately. The demographic data among patients without dementia revealed poorer activities of daily living in the PD group (1.1 ± 1.9) than in the NC group (0.5 ± 0.9), using the HAIADL questionnaire (
p = 0.004). SBR-R and SBR-L were lower in the PD group (0.5 ± 0.2 and 0.5 ± 0.2, respectively) than in the NC group (1.0 ± 0.2 and 1.0 ± 0.2, respectively). Comparison of the demographic data among the patients with dementia revealed significant differences in several parameters, including CDR-SB (
f = 11.31;
p < 0.001), HAIADL (
f = 5.92;
p = 0.003), CASI (
f = 5.23;
p = 0.003), MoCA (
f = 3.04;
p = 0.049), and NPI-sum (
f = 9.10;
p < 0.001) scores. Post hoc analysis revealed that the DLB group had significantly higher CDR-SB scores and worse HAIADL and cognitive performance in CASI and MoCA than the AD group. Compared with the PDD group, the DLB group had higher CDR-SB and NPI-sum scores. SBR-R and SBR-L were significantly different among the three groups (
Table 2).
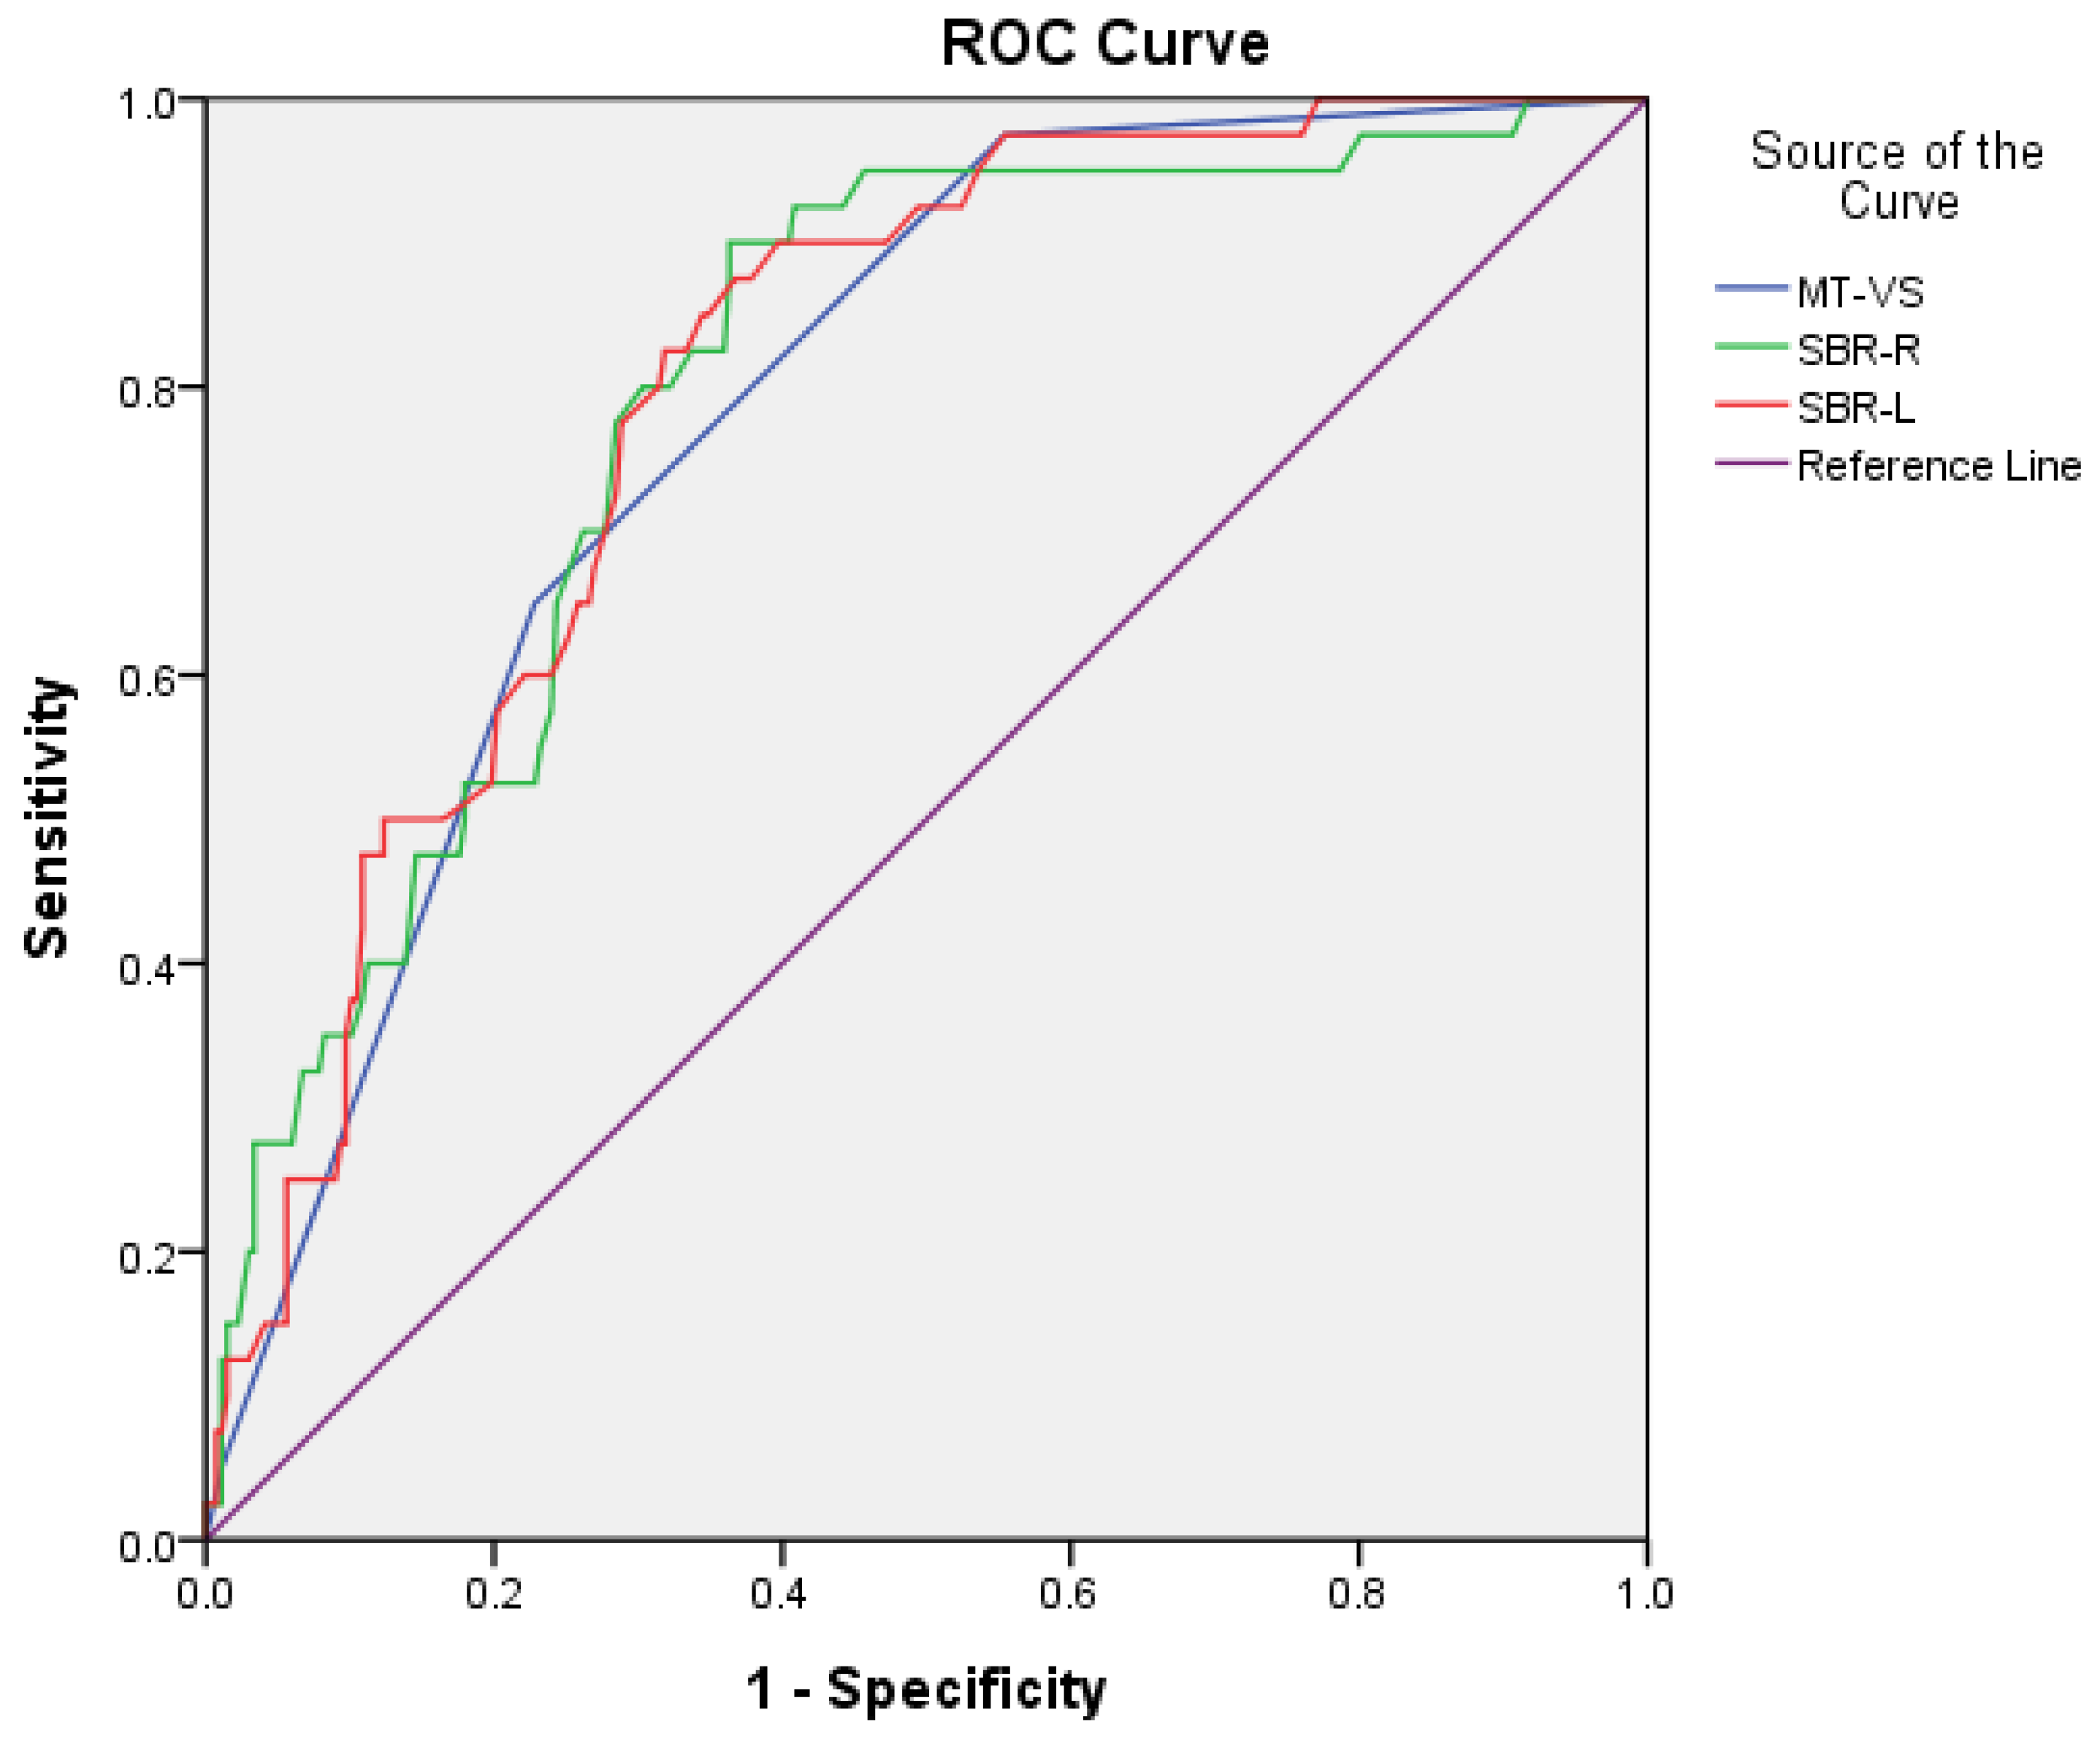
For the discrimination of PD from NC, sensitivity/specificity was 0.87/0.70, 0.81/0.79, and 0.82/0.79 for MT-VS, SBR-R, and SBR-L, respectively. AUC (95% CI) was 0.84 (0.80–0.88), 0.86 (0.82–0.90), and 0.86 (0.82–0.90) for MT-VS, SBR-R, and SBR-L, respectively. The cutoff scores were 3/2, 0.82/0.83, and 0.83/0.84 for MT-VS, SBR-R, and SBR-L, respectively (
Figure 1).
For the discrimination of PDD/DLB from AD, sensitivity/specificity was 0.77/0.65, 0.80/0.70, and 0.78/0.71 for MT-VS, SBR-R, and SBR-L, respectively. AUC (95% CI) was 0.78 (0.72–0.85), 0.79 (0.83–0.86), and 0.80 (0.74–0.86) for MT-VS, SBR-R, and SBR-L, respectively. The cutoff scores were 3/2, 0.81/0.82, and 0.79/0.80 for MT-VS, SBR-R, and SBR-L, respectively (
Figure 2).
Detailed comparison of sensitivity, specificity, AUC, and cutoff scores for the diagnosis of Lewy body disease (LBD) among the machine learning-visual scale (MT-VS) and striatal-background ratio (SBR) for Tc99m TRODAT-1 is demonstrated in
Table 3.
The correlation coefficients between ML-VS/SBR (combined SBR-R and SBR-L), ML-VS/SBR-R, and ML-VS/SBR-L in all participants were 0.679, 0.693, and 0.643, respectively.
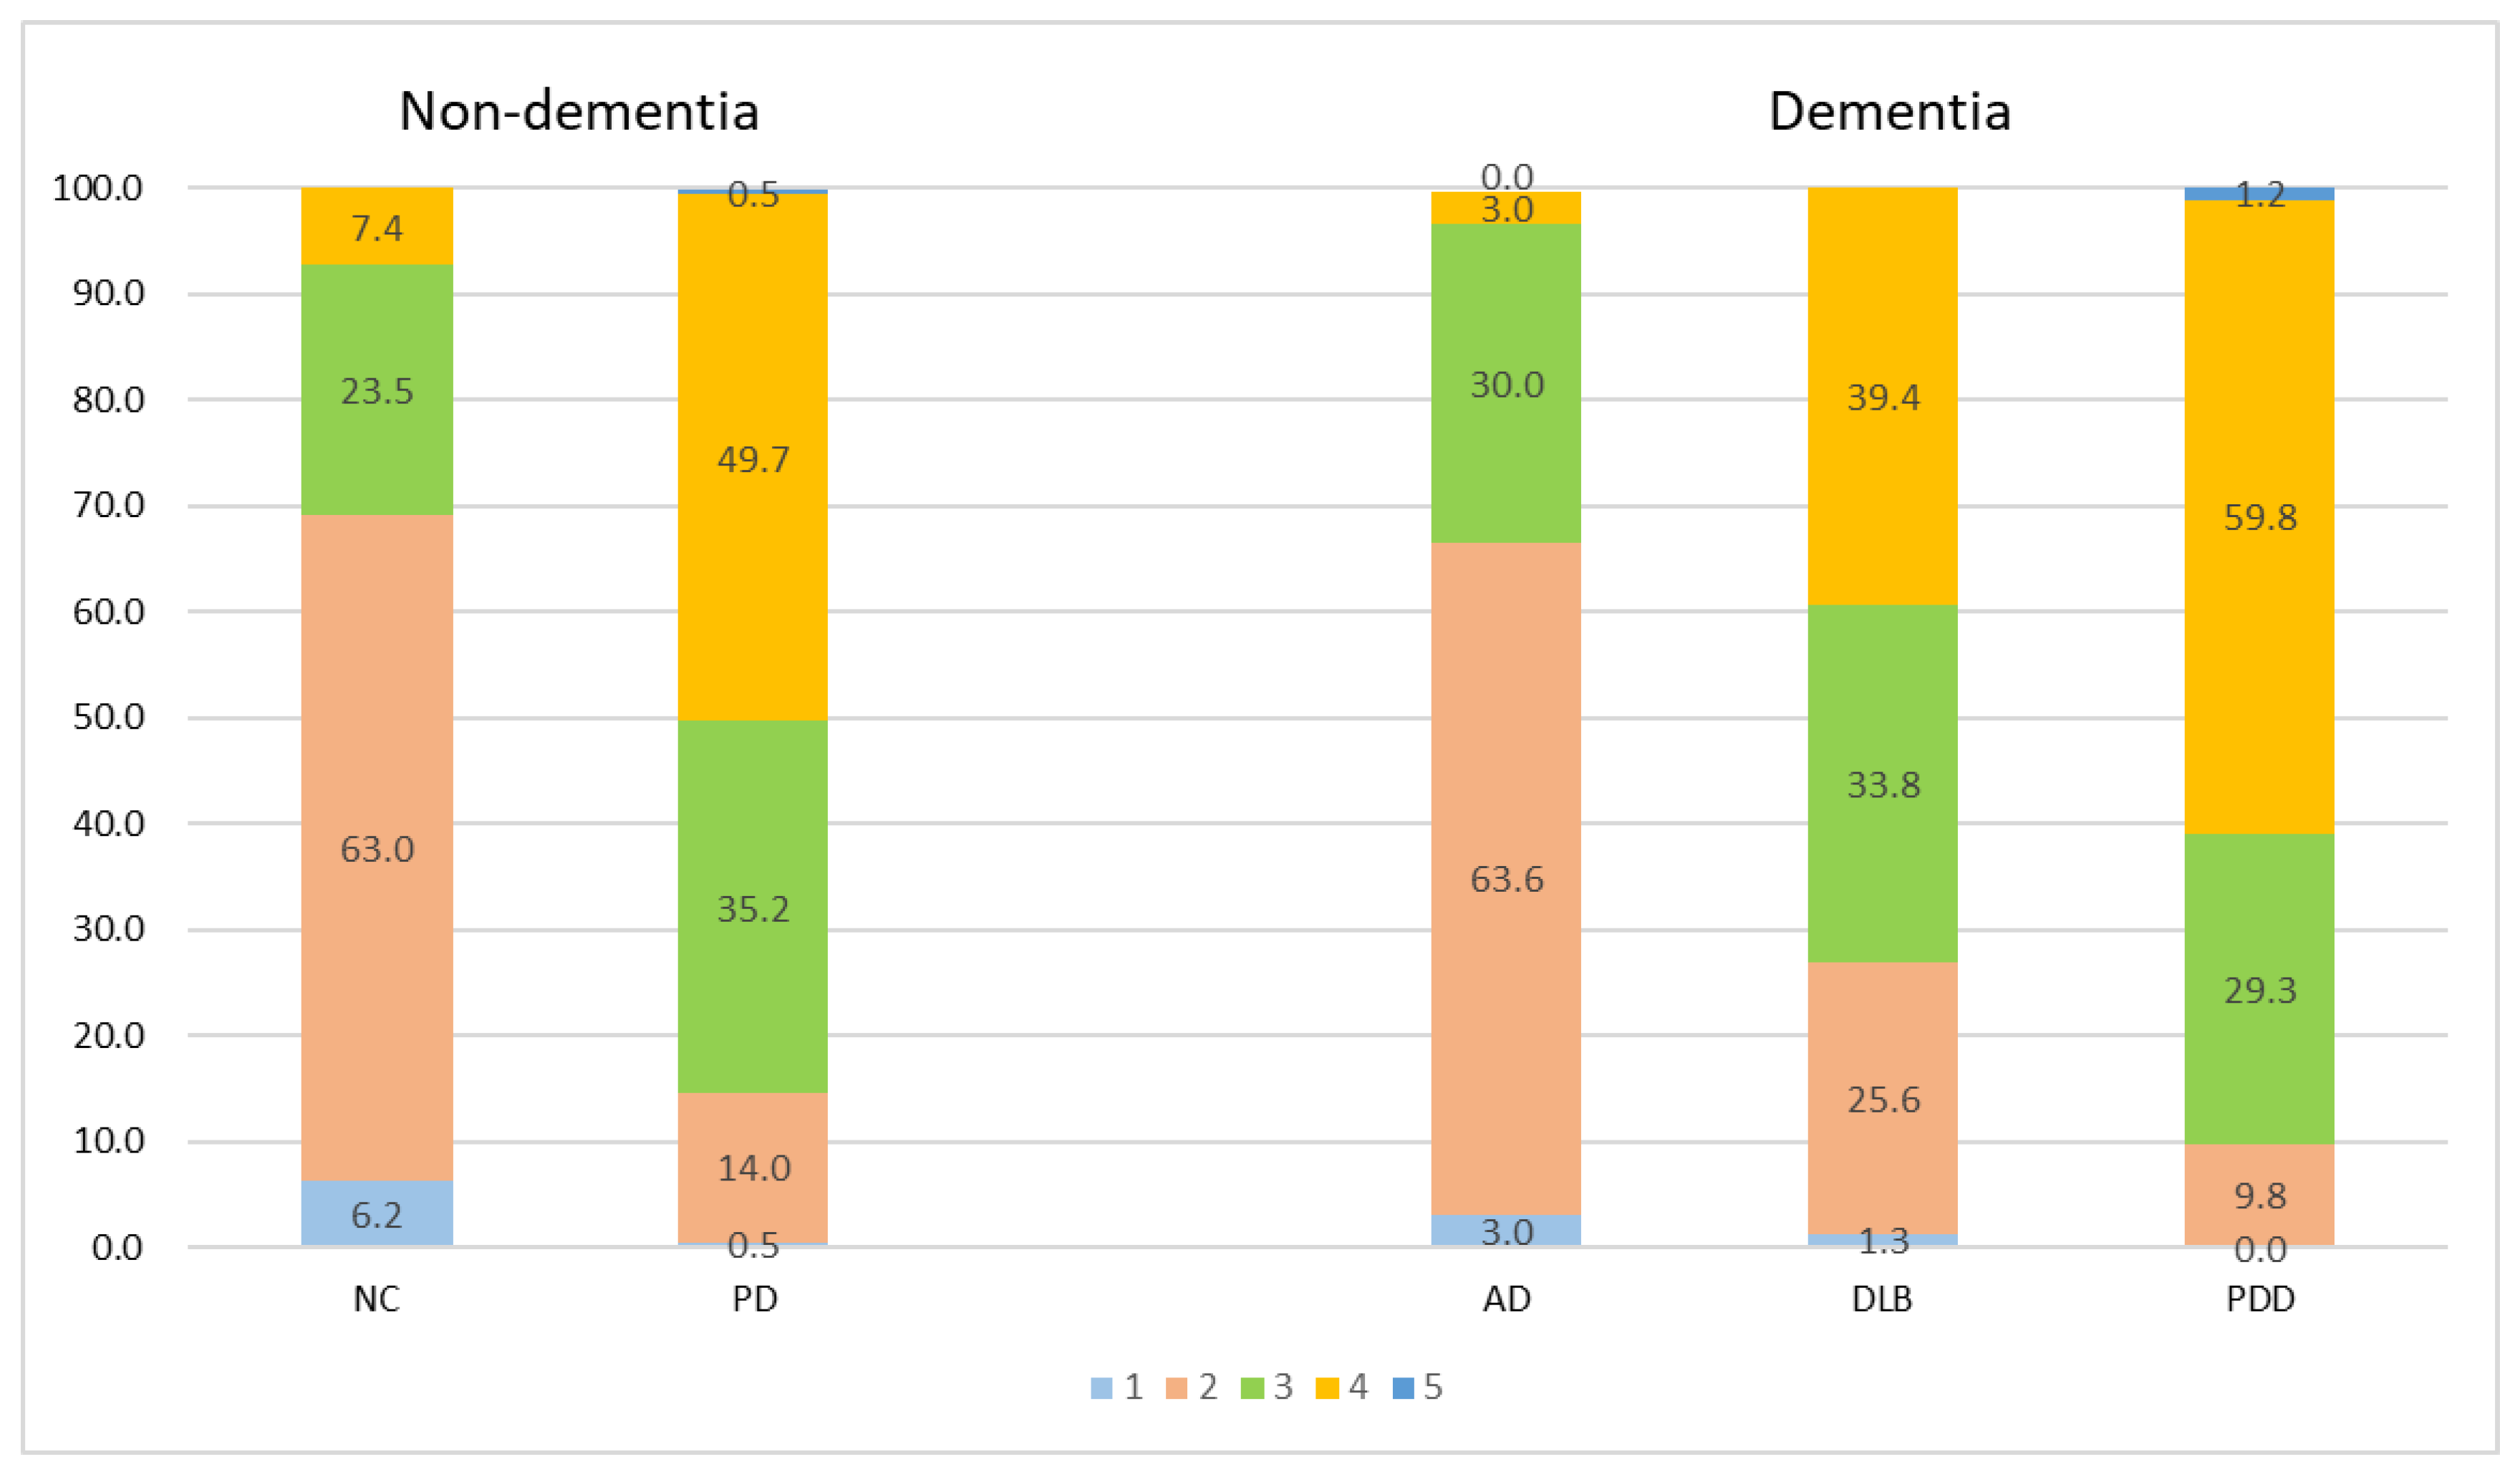
Figure 3 Illustration of the percentage frequency of ML-VS in different diagnostic groups. Comparisons between the PD and NC, DLB and AD, PDD and AD, DLB and PDD groups revealed significant differences (all
p < 0.001).
5. Discussion
This was a two-phase multicenter study. The design phase was executed in the nuclear medicine department of a medical center in central Taiwan, and the test phase was executed in that of two other centers in Taiwan. Both phases used relatively large samples. This is also the first study that separately investigated participants with or without dementia using TRODAT-1 supplementary with AI with ML.
Our study reported some important findings. First, cognitive function, ADL function, and neuropsychiatric symptoms were worse in the DLB group than in the AD or PDD group, consistent with the results of previous studies [
29,
30]. SBR-R and SBR-L were negatively correlated with LBD compared with NC or AD, which is consistent with the results of studies comparing DLB and AD or PD with non-PD [
31,
32].
Second, the accuracy of the judgment of an abnormal DaTscan using a training database from a center and applying it in other centers was fair; however, the results are not as good as expected; several studies have shown excellent results when the training and testing sets were from the same center [
33,
34,
35]. The lower accuracy of our findings or varying accuracy among the different studies is probably attributed to several reasons, including the scanning lens or machine, condition setting, rater experience, rating methods, study population, and accuracy of clinical diagnosis methods. These factors all contributed to both the training and testing datasets during the diagnosis of LBD/non-LBD or the diagnosis of normal/abnormal DaTscan images.
Third, for the discrimination of nondementia participants (PD versus NC), the sensitivity/specificity was 0.87/0.70, 0.81/0.79, and 0.82/0.79 for MT-VS, SBR-R, and SBR-L, respectively. The cutoff scores were 3/2, 0.82/0.83, and 0.83/0.84 for MT-VS, SBR-R, and SBR-L, respectively. These were superior to those for the discrimination of dementia participants (PDD/DLB versus AD), and the sensitivity/specificity was 0.77/0.65, 0.80/0.70, and 0.78/0.71 for MT-VS, SBR-R, and SBR-L, respectively. Cutoff scores for the discrimination of PD from NC or PDD/DLB from AD were the same (3/2) for MT-VS; however, using the SBR, the cutoff scores were lower in the dementia groups (PDD/DLB versus AD; 0.81/0.82 and 0.79/0.80 for SBR-R and SBR-L, respectively) than in the nondementia groups (PD versus NC; 0.82/0.83 and 0.83/0.84 for SBR-R and SBR-L, respectively). Lower accuracy in the dementia group compared with that in the nondementia group is probably due to the higher probability of mixed pathologies among the dementia participants than among nondementia participants [
4,
5,
6,
7,
8]. The lower cutoff scores are probably due to older age in the dementia group than in the nondementia group. Older people tend to have lower DAT uptake [
36,
37].
This study has some limitations. First, it was conducted in three hospitals in Taiwan. Therefore, the study findings may not be generalizable. Second, the design in one center and testing in other centers might raise the probabilities of lower accuracy, due to different scanning lenses or machines, condition setting, rater experience, rating methods, study population, and accuracy of clinical diagnosis. Further multicenter study in the design phase, as well as the test phase, is warranted. In addition, the study design is retrospective and findings from the other modalities of imaging, such as MRI or PET scan, were not incorporated in the algorithm.
In conclusion, our data indicated that the ML-VS designed in one center can differentiate PD from NC, DLB from AD, and PDD from AD in other centers, and that its correlation with traditional approaches using different scanning machines was also acceptable. However, compared with studies that conducted the design and tests within the same center, higher accuracy for diagnosis and differential diagnosis is expected, and further studies using ML-based models should pool data from multiple centers using different scanners and protocols in order to achieve higher diagnostic accuracy.
Author Contributions
The authors’ individual contributions were as follows. P.-Y.C., P.-N.H., G.-U.H., T.-C.H. and C.-H.K. were responsible for the study design. P.-Y.C., P.-N.H. and P.-K.C. collected the data. P.-Y.C., P.-N.H., P.-K.C. and C.-H.K. performed the statistical analyses, interpreted the data, and drafted the article. All authors provided some intellectual content. P.-Y.C., P.-N.H., G.-U.H., T.-C.H., P.-K.C. and C.-H.K. approved the version to be submitted. All authors have read and agreed to the published version of the manuscript.
Funding
This study is supported in part by China Medical University Hospital (DMR-110-089, DMR-111-090, DMR-111-091). The funders had no role in the study design, data collection and analysis, the decision to publish, or preparation of the manuscript. No additional external funding was received for this study.
Institutional Review Board Statement
Not applicable.
Informed Consent Statement
Not applicable.
Data Availability Statement
The participants were selected from a registry-based database of the Show Chwan Health System. The study design was retrospective, and the data were analyzed anonymously. The Committee for Medical Research Ethics of Show Chwan Memorial Hospital reviewed the project, and the data inspectorate approved the study.
Conflicts of Interest
The authors declare no conflict of interest.
References
- Postuma, R.B.; Berg, D.; Stern, M.; Poewe, W.; Olanow, C.W.; Oertel, W.; Obeso, J.; Marek, K.; Litvan, I.; Lang, A.E.; et al. MDS clinical diagnostic criteria for Parkinson’s disease. Mov. Disord. 2015, 30, 1591–1601. [Google Scholar] [PubMed]
- Mak, E.; Su, L.; Williams, G.B.; O’Brien, J.T. Neuroimaging characteristics of dementia with Lewy bodies. Alzheimer’s Res. Ther. 2014, 6, 18. [Google Scholar] [CrossRef] [PubMed]
- McKeith, I.G.; Boeve, B.F.; Dickson, D.W.; Halliday, G.; Taylor, J.P.; Weintraub, D.; Aarsland, D.; Galvin, J.; Attems, J.; Ballard, C.G.; et al. Diagnosis and management of dementia with Lewy bodies Fourth consensus report of the DLB Consortium. Neurology 2017, 89, 88–100. [Google Scholar] [CrossRef] [PubMed]
- James, B.D.; Bennett, D.A.; Boyle, P.A.; Leurgans, S.; Schneider, J.A. Dementia from Alzheimer disease and mixed pathologies in the oldest old. JAMA 2012, 307, 1798–1800. [Google Scholar] [CrossRef]
- Nedelska, Z.; Ferman, T.J.; Boeve, B.F.; Przybelski, S.A.; Lesnick, T.G.; Murray, M.; Gunter, J.L.; Senjem, M.L.; Vemuri, P.; Smith, G.; et al. Pattern of brain atrophy rates in autopsy-confirmed dementia with Lewy bodies. Neurobiol. Aging 2015, 36, 452–461. [Google Scholar] [CrossRef]
- Walker, L.; McAleese, K.E.; Thomas, A.J.; Johnson, M.; Martin-Ruiz, C.; Parker, C.; Colloby, S.J.; Jellinger, K.; Attems, J. Neuropathologically mixed Alzheimer’s and Lewy body disease: Burden of pathological protein aggregates differs between clinical phenotypes. Acta Neuropathol. 2015, 129, 729–748. [Google Scholar]
- Schneider, J.A.; Arvanitakis, Z.; Bang, W.; Bennett, D.A. Mixed Brain Pathologies Account for Most Dementia Cases in Community-Dwelling Older Persons. Neurology 2007, 69, 2197–2204. [Google Scholar] [CrossRef]
- Pillai, J.A.; Butler, R.S.; Bonner-Jackson, A.; Leverenz, J.B. Impact of Alzheimer’s disease, Lewy body and vascular co-pathologies on clinical transition to dementia in a national autopsy cohort. Dement. Geriatr. Cogn. Disord. 2016, 42, 106–116. [Google Scholar] [CrossRef]
- McKeith, I.; O’Brien, J.; Walker, Z.; Tatsch, K.; Booij, J.; Darcourt, J.; Padovani, A.; Giubbini, R.; Bonuccelli, U.; Volterrani, D.; et al. Sensitivity and specificity of dopamine transporter imaging with 123I-FP-CIT SPECT in dementia with Lewy bodies: A phase III, multicentre study. Lancet Neurol. 2007, 6, 305–313. [Google Scholar]
- Walker, Z.; Moreno, E.; Thomas, A.; Inglis, F.; Tabet, N.; Rainer, M.; Pizzolato, G.; Padovani, A. Clinical usefulness of dopamine transporter SPECT imaging with 123I-FP-CIT in patients with possible dementia with Lewy bodies: Randomised study. Br. J. Psychiatry 2015, 206, 145–152. [Google Scholar] [CrossRef]
- Tinaz, S.; Chow, C.; Kuo, P.H.; Krupinski, E.A.; Blumenfeld, H.; Louis, E.D.; Zubal, G. Semiquantitative analysis of dopamine transporter scans in patients with Parkinson disease. Clin. Nucl. Med. 2018, 43, e1–e7. [Google Scholar] [CrossRef] [PubMed]
- Honkanen, E.A.; Noponen, T.; Hirvilammi, R.; Lindholm, K.; Parkkola, R.; Joutsa, J.; Varrone, A.; Kaasinen, V. Sex correction improves the accuracy of clinical dopamine transporter imaging. EJNMMI Res. 2021, 11, 82. [Google Scholar] [CrossRef]
- Choi, H.; Ha, S.; Im, H.J.; Paek, S.H.; Lee, D.S. Refining diagnosis of Parkinson’s disease with deep learning-based interpretation of dopamine transporter imaging. Neuroimage Clin. 2017, 16, 586–594. [Google Scholar] [CrossRef] [PubMed]
- Prashanth, R.; Dutta Roy, S.; Mandal, P.K.; Ghosh, S. High-accuracy detection of early Parkinson’s disease through multimodal features and machine learning. Int. J. Med. Inform. 2016, 90, 13–21. [Google Scholar] [PubMed]
- Papathanasiou, N.D.; Boutsiadis, A.; Dickson, J.; Bomanji, J.B. Diagnostic accuracy of 123I-FP-CIT (DaTSCAN) in dementia with Lewy bodies: A meta-analysis of published studies. Parkinsonism Relat. Disord. 2012, 18, 225–229. [Google Scholar] [CrossRef] [PubMed]
- Huang, W.S.; Lee, M.S.; Lin, J.C.; Chen, C.Y.; Yang, Y.W.; Lin, S.Z.; Wey, S.P. Usefulness of brain 99mTc-TRODAT-1 SPET for the evaluation of Parkinson’s disease. Eur. J. Nucl. Med. Mol. Imaging 2004, 31, 155–161. [Google Scholar] [CrossRef]
- Chang, Y.C.; Hsieh, T.C.; Chen, J.C.; Wang, K.-P.; Hsu, Z.-K.; Chan, P.-K.; Kao, C.-H. Low-Parameter Small Convolutional Neural Network Applied to Functional Medical Imaging of Tc-99m Trodat-1 Brain Single-Photon Emission Computed Tomography for Parkinson’s Disease. J. Pers. Med. 2021, 12, 1. [Google Scholar] [CrossRef]
- Chang, Y.F.; Loi, W.Y.; Chiu, P.Y.; Huang, H.-N. Classification of Dementia Severity in Taiwan Based on History-Based Clinical Diagnosis System. Am. J. Alzheimer’s Dis. Other Dement. 2020, 35, 1533317520970788. [Google Scholar] [CrossRef]
- Chiu, P.Y.; Hung, G.U.; Wei, C.Y.; Tzeng, R.-C.; Pai, M.-C. Freezing of Speech Single Questionnaire as a Screening Tool for Cognitive Dysfunction in Patients with Dementia with Lewy Bodies. Front. Aging Neurosci. 2020, 12, 65. [Google Scholar] [CrossRef]
- Zhu, F.; Li, X.; Tang, H.; He, Z.; Zhang, C.; Hung, G.-U.; Chiu, P.-Y.; Zhou, W. Machine Learning for the Preliminary Diagnosis of Dementia. Sci. Program. 2020, 2020, 5629090. [Google Scholar] [CrossRef]
- Wang, C.T.; Hung, G.U.; Wei, C.Y.; Tzeng, R.-C.; Chiu, P.-Y. An Informant-Based Simple Questionnaire for Visuospatial Dysfunction Assessment in Dementia. Front. Neurosci. 2020, 14, 44. [Google Scholar] [CrossRef] [PubMed]
- Zhu, F.; Li, X.; McGonigle, D.; Tang, H.; He, Z.; Zhang, C.; Hung, G.-U.; Chiu, P.-Y.; Zhou, W. Analyze Informant-based Questionnaire for The Early Diagnosis of Senile Dementia Using Deep Learning. IEEE J. Transl. Eng. Health Med. 2019, 8, 2200106. [Google Scholar] [CrossRef] [PubMed]
- Morris, J.C. The Clinical Dementia Rating (CDR): Current version and scoring rules. Neurology 1993, 43, 2412–2414. [Google Scholar] [CrossRef] [PubMed]
- Emre, M.; Aarsland, D.; Brown, R.; Burn, D.J.; Duyckaerts, C.; Mizuno, Y.; Broe, G.A.; Cummings, J.; Dickson, D.W.; Gauthier, S.; et al. Clinical diagnostic criteria for dementia associated with Parkinson’s disease. Mov. Disord. 2007, 22, 1689–1707. [Google Scholar]
- McKhann, G.M.; Knopman, D.S.; Chertkow, H.; Hyman, B.T.; Jack, C.R., Jr.; Kawas, C.H.; Klunk, W.E.; Koroshetz, W.J.; Manly, J.J.; Mayeux, R.; et al. The diagnosis of dementia due to Alzheimer’s disease: Recommendations from the National Institute on Aging-Alzheimer’s Association workgroups on diagnostic guidelines for Alzheimer’s disease. Alzheimer’s Dement. 2011, 7, 263–269. [Google Scholar] [CrossRef]
- Lin, K.N.; Wang, P.N.; Liu, C.Y.; Chen, W.-T.; Lee, Y.-C.; Liu, H.-C. Cutoff scores of the cognitive abilities screening instrument, Chinese version in screening of dementia. Dement. Geriatr. Cogn. Disord. 2002, 14, 176–182. [Google Scholar] [CrossRef]
- Hoops, S.; Nazem, S.; Siderowf, A.D.; Duda, J.E.; Xie, S.X.; Stern, M.B.; Weintraub, D. Validity of the MoCA and MMSE in the detection of MCI and dementia in Parkinson disease. Neurology 2009, 73, 1738–1745. [Google Scholar] [CrossRef]
- Cummings, J.L. Intellectual impairment in Parkinson’s disease: Clinical, pathologic, and biochemical correlates. J. Geriatr. Psychiatry Neurol. 1988, 1, 24–36. [Google Scholar] [CrossRef]
- Bjoerke-Bertheussen, J.; Ehrt, U.; Rongve, A.; Ballard, C.; Aarsland, D. Neuropsychiatric symptoms in mild dementia with Lewy bodies and Alzheimer’s disease. Dement. Geriatr. Cogn. Disord. 2012, 34, 1–6. [Google Scholar] [CrossRef]
- Chiu, P.Y.; Tsai, C.T.; Chen, P.K.; Chen, W.-J.; Lai, T.-J. Neuropsychiatric symptoms in Parkinson’s disease dementia are more similar to Alzheimer’s disease than dementia with Lewy bodies: A case-control study. PLoS ONE 2016, 11, e0153989. [Google Scholar] [CrossRef]
- Costa, D.C.; Walker, Z.; Walker, R.W.; Fontes, F.R.G. Dementia with Lewy bodies versus Alzheimer’s disease: Role of dopamine transporter imaging. Mov. Disord. 2003, 18 (Suppl. 7), S34–S38. [Google Scholar] [CrossRef] [PubMed]
- de la Fuente-Fernández, R. Role of DaTSCAN and clinical diagnosis in Parkinson disease. Neurology 2012, 78, 696–701. [Google Scholar] [CrossRef] [PubMed]
- Wenzel, M.; Milletari, F.; Krüger, J.; Lange, C.; Schenk, M.; Apostolova, I.; Klutmann, S.; Ehrenburg, M.; Buchert, R. Automatic classification of dopamine transporter SPECT: Deep convolutional neural networks can be trained to be robust with respect to variable image characteristics. Eur. J. Nucl. Med. Mol. Imaging 2019, 46, 2800–2811. [Google Scholar] [PubMed]
- Nazari, M.; Kluge, A.; Apostolova, I.; Klutmann, S.; Kimiaei, S.; Schroeder, M.; Buchert, R. Explainable AI to improve acceptance of convolutional neural networks for automatic classification of dopamine transporter SPECT in the diagnosis of clinically uncertain parkinsonian syndromes. Eur. J. Nucl. Med. Mol. Imaging 2022, 49, 1176–1186. [Google Scholar] [CrossRef]
- Shin, D.H.; Heo, H.; Song, S.; Shin, N.-Y.; Nam, Y.; Yoo, S.-W.; Kim, J.-S.; Yoon, J.H.; Lee, S.H.; Sung, Y.H.; et al. Automated assessment of the substantia nigra on susceptibility map-weighted imaging using deep convolutional neural networks for diagnosis of Idiopathic Parkinson’s disease. Parkinsonism Relat. Disord. 2021, 85, 84–90. [Google Scholar]
- Lavalaye, J.; Booij, J.; Reneman, L.; Habraken, J.B.A.; Van Royen, E.A. Effect of age and gender on dopamine transporter imaging with [123I] FP-CIT SPET in healthy volunteers. Eur. J. Nucl. Med. 2000, 27, 867–869. [Google Scholar] [CrossRef]
- Mozley, P.D.; Acton, P.D.; Barraclough, E.D.; Plössl, K.; Gur, R.C.; Alavi, A.; Mathur, A.; Saffer, J.; Kung, H.F. Effects of age on dopamine transporters in healthy humans. J. Nucl. Med. 1999, 40, 1812–1817. [Google Scholar]
| Publisher’s Note: MDPI stays neutral with regard to jurisdictional claims in published maps and institutional affiliations. |
© 2022 by the authors. Licensee MDPI, Basel, Switzerland. This article is an open access article distributed under the terms and conditions of the Creative Commons Attribution (CC BY) license (https://creativecommons.org/licenses/by/4.0/).


 ,
, 
