
Increased Risk of NAFLD in Adults with Glomerular Hyperfiltration: An 8-Year Cohort Study Based on 147,162 Koreans

 ,
,  ,
,  , ,
, ,
Abstract
:
1. Introduction
2. Materials and Methods
2.1. Study Population and Design
2.2. Anthropometric and Laboratory Measurements
2.3. Diagnosis of NAFLD and Advanced Liver Fibrosis
2.4. Definition of Glomerular Hyperfiltration
2.5. Statistical Analysis
3. Results
4. Discussion
Supplementary Materials
Author Contributions
Funding
Institutional Review Board Statement
Informed Consent Statement
Data Availability Statement
Acknowledgments
Conflicts of Interest
References
- Chalasani, N.; Younossi, Z.; Lavine, J.E.; Diehl, A.M.; Brunt, E.M.; Cusi, K.; Charlton, M.; Sanyal, A.J. The diagnosis and management of non-alcoholic fatty liver disease: Practice Guideline by the American Association for the Study of Liver Diseases, American College of Gastroenterology, and the American Gastroenterological Association. Hepatology 2012, 55, 2005–2023. [Google Scholar] [CrossRef] [PubMed]
- Lee, Y.H.; Cho, Y.; Lee, B.W.; Park, C.Y.; Lee, D.H.; Cha, B.S.; Rhee, E.J. Nonalcoholic fatty liver disease in diabetes. Part I: Epidemiology and diagnosis. Diabetes Metab. J. 2019, 43, 31–45. [Google Scholar] [CrossRef] [PubMed]
- Tilg, H.; Moschen, A.R.; Roden, M. NAFLD and diabetes mellitus. Nat. Rev. Gastroenterol. Hepatol. 2017, 14, 32–42. [Google Scholar] [CrossRef]
- Adams, L.A.; Lymp, J.F.; St Sauver, J.; Sanderson, S.O.; Lindor, K.D.; Feldstein, A.; Angulo, P. The natural history of nonalcoholic fatty liver disease: A population-based cohort study. Gastroenterology 2005, 129, 113–121. [Google Scholar] [CrossRef] [PubMed]
- Han, E.; Lee, Y.H. Non-alcoholic fatty liver disease: The emerging burden in cardiometabolic and renal diseases. Diabetes Metab. J. 2017, 41, 430–437. [Google Scholar] [CrossRef]
- Chinnadurai, R.; Ritchie, J.; Green, D.; Kalra, P.A. Non-alcoholic fatty liver disease and clinical outcomes in chronic kidney disease. Nephrol. Dial. Transplant. 2019, 34, 449–457. [Google Scholar] [CrossRef] [PubMed]
- Lee, S.A.; Cozzi, M.; Bush, E.L.; Rabb, H. Distant organ dysfunction in acute kidney injury: A review. Am. J. Kidney Dis. 2018, 72, 846–856. [Google Scholar] [CrossRef]
- Kubota, M.; Watanabe, R.; Yamaguchi, M.; Hosojima, M.; Saito, A.; Fujii, M.; Fujimura, S.; Kadowaki, M. Rice endosperm protein slows progression of fatty liver and diabetic nephropathy in Zucker diabetic fatty rats. Br. J. Nutr. 2016, 116, 1326–1335. [Google Scholar] [CrossRef] [Green Version]
- Spoto, B.; Pisano, A.; Zoccali, C. Insulin resistance in chronic kidney disease: A systematic review. Am. J. Physiol. Renal Physiol. 2016, 311, F1087–F1108. [Google Scholar] [CrossRef] [Green Version]
- Wang, C.; Cui, Y.; Li, C.; Zhang, Y.; Xu, S.; Li, X.; Li, H.; Zhang, X. Nrf2 deletion causes "benign" simple steatosis to develop into nonalcoholic steatohepatitis in mice fed a high-fat diet. Lipids Health Dis. 2013, 12, 165. [Google Scholar] [CrossRef] [Green Version]
- Helal, I.; Fick-Brosnahan, G.M.; Reed-Gitomer, B.; Schrier, R.W. Glomerular hyperfiltration: Definitions, mechanisms and clinical implications. Nat. Rev. Nephrol. 2012, 8, 293–300. [Google Scholar] [CrossRef] [PubMed]
- Bosma, R.J.; Krikken, J.A.; Homan van der Heide, J.J.; de Jong, P.E.; Navis, G.J. Obesity and renal hemodynamics. Contrib. Nephrol. 2006, 151, 184–202. [Google Scholar] [PubMed]
- Melsom, T.; Mathisen, U.D.; Ingebretsen, O.C.; Jenssen, T.G.; Njolstad, I.; Solbu, M.D.; Toft, I.; Eriksen, B.O. Impaired fasting glucose is associated with renal hyperfiltration in the general population. Diabetes Care 2011, 34, 1546–1551. [Google Scholar] [CrossRef] [Green Version]
- Dupuis, M.E.; Nadeau-Fredette, A.C.; Madore, F.; Agharazii, M.; Goupil, R. Association of glomerular hyperfiltration and cardiovascular risk in middle-aged healthy individuals. JAMA Netw. Open 2020, 3, e202377. [Google Scholar] [CrossRef] [PubMed]
- Kang, M.W.; Park, S.; Lee, S.; Lee, Y.; Cho, S.; Han, K.; Cho, H.; Kim, Y.; Kim, Y.C.; Han, S.S.; et al. Glomerular hyperfiltration is associated with dementia: A nationwide population-based study. PLoS ONE 2020, 15, e0228361. [Google Scholar] [CrossRef] [PubMed]
- Tomaszewski, M.; Charchar, F.J.; Maric, C.; McClure, J.; Crawford, L.; Grzeszczak, W.; Sattar, N.; Zukowska-Szczechowska, E.; Dominiczak, A.F. Glomerular hyperfiltration: A new marker of metabolic risk. Kidney Int. 2007, 71, 816–821. [Google Scholar] [CrossRef] [Green Version]
- Yodoshi, T.; Arce-Clachar, A.C.; Sun, Q.; Fei, L.; Bramlage, K.; Xanthakos, S.A.; Flores, F.; Mouzaki, M. Glomerular hyperfiltration is associated with liver disease severity in children with nonalcoholic fatty liver disease. J. Pediatr. 2020, 222, 127–133. [Google Scholar] [CrossRef]
- Abbate, M.; Mascaro, C.M.; Montemayor, S.; Casares, M.; Gomez, C.; Ugarriza, L.; Tejada, S.; Abete, I.; Zulet, M.A.; Sureda, A.; et al. Non-Alcoholic Fatty Liver Disease Is Associated with Kidney Glomerular Hyperfiltration in Adults with Metabolic Syndrome. J. Clin. Med. 2021, 10, 1717. [Google Scholar] [CrossRef]
- Chang, Y.; Jung, H.S.; Cho, J.; Zhang, Y.; Yun, K.E.; Lazo, M.; Pastor-Barriuso, R.; Ahn, J.; Kim, C.W.; Rampal, S.; et al. Metabolically healthy obesity and the development of nonalcoholic fatty liver disease. Am. J. Gastroenterol. 2016, 111, 1133–1140. [Google Scholar] [CrossRef]
- Yoon, Y.S.; Oh, S.W.; Baik, H.W.; Park, H.S.; Kim, W.Y. Alcohol consumption and the metabolic syndrome in Korean adults: The 1998 Korean National Health and Nutrition Examination Survey. Am. J. Clin. Nutr. 2004, 80, 217–224. [Google Scholar] [CrossRef] [Green Version]
- Chun, M.Y. Validity and reliability of korean version of international physical activity questionnaire short form in the elderly. Korean J. Fam. Med. 2012, 33, 144–151. [Google Scholar] [CrossRef] [PubMed] [Green Version]
- Matthews, D.R.; Hosker, J.P.; Rudenski, A.S.; Naylor, B.A.; Treacher, D.F.; Turner, R.C. Homeostasis model assessment: Insulin resistance and beta-cell function from fasting plasma glucose and insulin concentrations in man. Diabetologia 1985, 28, 412–419. [Google Scholar] [CrossRef] [PubMed] [Green Version]
- Black, S.; Kushner, I.; Samols, D. C-reactive protein. J. Biol. Chem. 2004, 279, 48487–48490. [Google Scholar] [CrossRef] [PubMed] [Green Version]
- American Diabetes Association. Classification and diagnosis of diabetes: Standards of medical care in diabetes-2019. Diabetes Care 2019, 42, S13–S28. [Google Scholar] [CrossRef] [PubMed] [Green Version]
- Hamer, O.W.; Aguirre, D.A.; Casola, G.; Lavine, J.E.; Woenckhaus, M.; Sirlin, C.B. Fatty liver: Imaging patterns and pitfalls. Radiographics 2006, 26, 1637–1653. [Google Scholar] [CrossRef] [PubMed]
- Ryu, S.; Chang, Y.; Choi, Y.; Kwon, M.J.; Kim, C.W.; Yun, K.E.; Jung, H.S.; Kim, B.K.; Kim, Y.J.; Ahn, J.; et al. Age at menarche and non-alcoholic fatty liver disease. J. Hepatol. 2015, 62, 1164–1170. [Google Scholar] [CrossRef]
- Cusi, K.; Isaacs, S.; Barb, D.; Basu, R.; Caprio, S.; Garvey, W.T.; Kashyap, S.; Mechanick, J.I.; Mouzaki, M.; Nadolsky, K.; et al. American Association of Clinical Endocrinology Clinical Practice Guideline for the Diagnosis and Management of Nonalcoholic Fatty Liver Disease in Primary Care and Endocrinology Clinical Settings: Co-Sponsored by the American Association for the Study of Liver Diseases (AASLD). Endocr. Pract. 2022, 28, 528–562. [Google Scholar]
- Lee, J.; Vali, Y.; Boursier, J.; Spijker, R.; Anstee, Q.M.; Bossuyt, P.M.; Zafarmand, M.H. Prognostic accuracy of FIB-4, NAFLD fibrosis score and APRI for NAFLD-related events: A systematic review. Liver Int. 2021, 41, 261–270. [Google Scholar] [CrossRef]
- Levey, A.S.; Stevens, L.A.; Schmid, C.H.; Zhang, Y.L.; Castro, A.F., 3rd; Feldman, H.I.; Kusek, J.W.; Eggers, P.; Van Lente, F.; Greene, T.; et al. A new equation to estimate glomerular filtration rate. Ann. Intern. Med. 2009, 150, 604–612. [Google Scholar] [CrossRef]
- Park, M.; Yoon, E.; Lim, Y.H.; Kim, H.; Choi, J.; Yoon, H.J. Renal hyperfiltration as a novel marker of all-cause mortality. J. Am. Soc. Nephrol. 2015, 26, 1426–1433. [Google Scholar] [CrossRef]
- Royston, P.; Parmar, M.K. Flexible parametric proportional-hazards and proportional-odds models for censored survival data, with application to prognostic modelling and estimation of treatment effects. Stat. Med. 2002, 21, 2175–2197. [Google Scholar] [CrossRef] [PubMed]
- Ciardullo, S.; Ballabeni, C.; Trevisan, R.; Perseghin, G. Liver stiffness, albuminuria and chronic kidney disease in patients with NAFLD: A systematic review and meta-analysis. Biomolecules 2022, 12, 105. [Google Scholar] [CrossRef] [PubMed]
- Utzschneider, K.M.; Kahn, S.E. Review: The role of insulin resistance in nonalcoholic fatty liver disease. J. Clin. Endocrinol. Metab. 2006, 91, 4753–4761. [Google Scholar] [CrossRef] [PubMed] [Green Version]
- Wahba, I.M.; Mak, R.H. Obesity and obesity-initiated metabolic syndrome: Mechanistic links to chronic kidney disease. Clin. J. Am. Soc. Nephrol. 2007, 2, 550–562. [Google Scholar] [CrossRef] [PubMed] [Green Version]
- Kalupahana, N.S.; Moustaid-Moussa, N. The renin-angiotensin system: A link between obesity, inflammation and insulin resistance. Obes. Rev. 2012, 13, 136–149. [Google Scholar] [CrossRef]
- Kovesdy, C.P.; Furth, S.L.; Zoccali, C.; World Kidney Day Steering, C. Obesity and kidney disease: Hidden consequences of the epidemic. J. Nephrol. 2017, 30, 1–10. [Google Scholar] [CrossRef] [Green Version]
- Ciardullo, S.; Monti, T.; Sala, I.; Grassi, G.; Mancia, G.; Perseghin, G. Nonalcoholic fatty liver disease and advanced fibrosis in US adults across blood pressure categories. Hypertension 2020, 76, 562–568. [Google Scholar] [CrossRef]
- Matthew Morris, E.; Fletcher, J.A.; Thyfault, J.P.; Rector, R.S. The role of angiotensin II in nonalcoholic steatohepatitis. Mol. Cell. Endocrinol. 2013, 378, 29–40. [Google Scholar] [CrossRef]
- Musso, G.; Cassader, M.; Cohney, S.; Pinach, S.; Saba, F.; Gambino, R. Emerging liver-kidney interactions in nonalcoholic fatty liver disease. Trends Mol. Med. 2015, 21, 645–662. [Google Scholar] [CrossRef]
- Yokohama, S.; Yoneda, M.; Haneda, M.; Okamoto, S.; Okada, M.; Aso, K.; Hasegawa, T.; Tokusashi, Y.; Miyokawa, N.; Nakamura, K. Therapeutic efficacy of an angiotensin II receptor antagonist in patients with nonalcoholic steatohepatitis. Hepatology 2004, 40, 1222–1225. [Google Scholar] [CrossRef]
- Georgescu, E.F. Angiotensin receptor blockers in the treatment of NASH/NAFLD: Could they be a first-class option? Adv. Ther. 2008, 25, 1141–1174. [Google Scholar] [CrossRef] [PubMed]
- Hirata, T.; Tomita, K.; Kawai, T.; Yokoyama, H.; Shimada, A.; Kikuchi, M.; Hirose, H.; Ebinuma, H.; Irie, J.; Ojiro, K.; et al. Effect of telmisartan or losartan for treatment of nonalcoholic fatty liver disease: Fatty liver protection trial by telmisartan or losartan study (FANTASY). Int. J. Endocrinol. 2013, 2013, 587140. [Google Scholar] [CrossRef]
- Wang, C.H.; Liu, H.M.; Chang, Z.Y.; Huang, T.H.; Lee, T.Y. Losartan prevents hepatic steatosis and macrophage polarization by inhibiting HIF-1alpha in a murine model of NAFLD. Int. J. Mol. Sci. 2021, 22, 7841. [Google Scholar] [CrossRef] [PubMed]
- Sumida, Y.; Nakajima, A.; Itoh, Y. Limitations of liver biopsy and non-invasive diagnostic tests for the diagnosis of nonalcoholic fatty liver disease/nonalcoholic steatohepatitis. World J. Gastroenterol. 2014, 20, 475–485. [Google Scholar] [CrossRef] [PubMed]
- Bril, F.; Ortiz-Lopez, C.; Lomonaco, R.; Orsak, B.; Freckleton, M.; Chintapalli, K.; Hardies, J.; Lai, S.; Solano, F.; Tio, F.; et al. Clinical value of liver ultrasound for the diagnosis of nonalcoholic fatty liver disease in overweight and obese patients. Liver Int. 2015, 35, 2139–2146. [Google Scholar] [CrossRef] [PubMed]
- de Moura Almeida, A.; Cotrim, H.P.; Barbosa, D.B.; de Athayde, L.G.; Santos, A.S.; Bitencourt, A.G.; de Freitas, L.A.; Rios, A.; Alves, E. Fatty liver disease in severe obese patients: Diagnostic value of abdominal ultrasound. World J. Gastroenterol. 2008, 14, 1415–1418. [Google Scholar] [CrossRef]
- Mottin, C.C.; Moretto, M.; Padoin, A.V.; Swarowsky, A.M.; Toneto, M.G.; Glock, L.; Repetto, G. The role of ultrasound in the diagnosis of hepatic steatosis in morbidly obese patients. Obes. Surg. 2004, 14, 635–637. [Google Scholar] [CrossRef]
- Hernaez, R.; Lazo, M.; Bonekamp, S.; Kamel, I.; Brancati, F.L.; Guallar, E.; Clark, J.M. Diagnostic accuracy and reliability of ultrasonography for the detection of fatty liver: A meta-analysis. Hepatology 2011, 54, 1082–1090. [Google Scholar] [CrossRef] [Green Version]
- Day, C.P.; James, O.F. Steatohepatitis: A tale of two “hits”? Gastroenterology 1998, 114, 842–845. [Google Scholar] [CrossRef]


| Characteristics | Total | NAFLD | p-Value | |
|---|---|---|---|---|
| No | Yes | |||
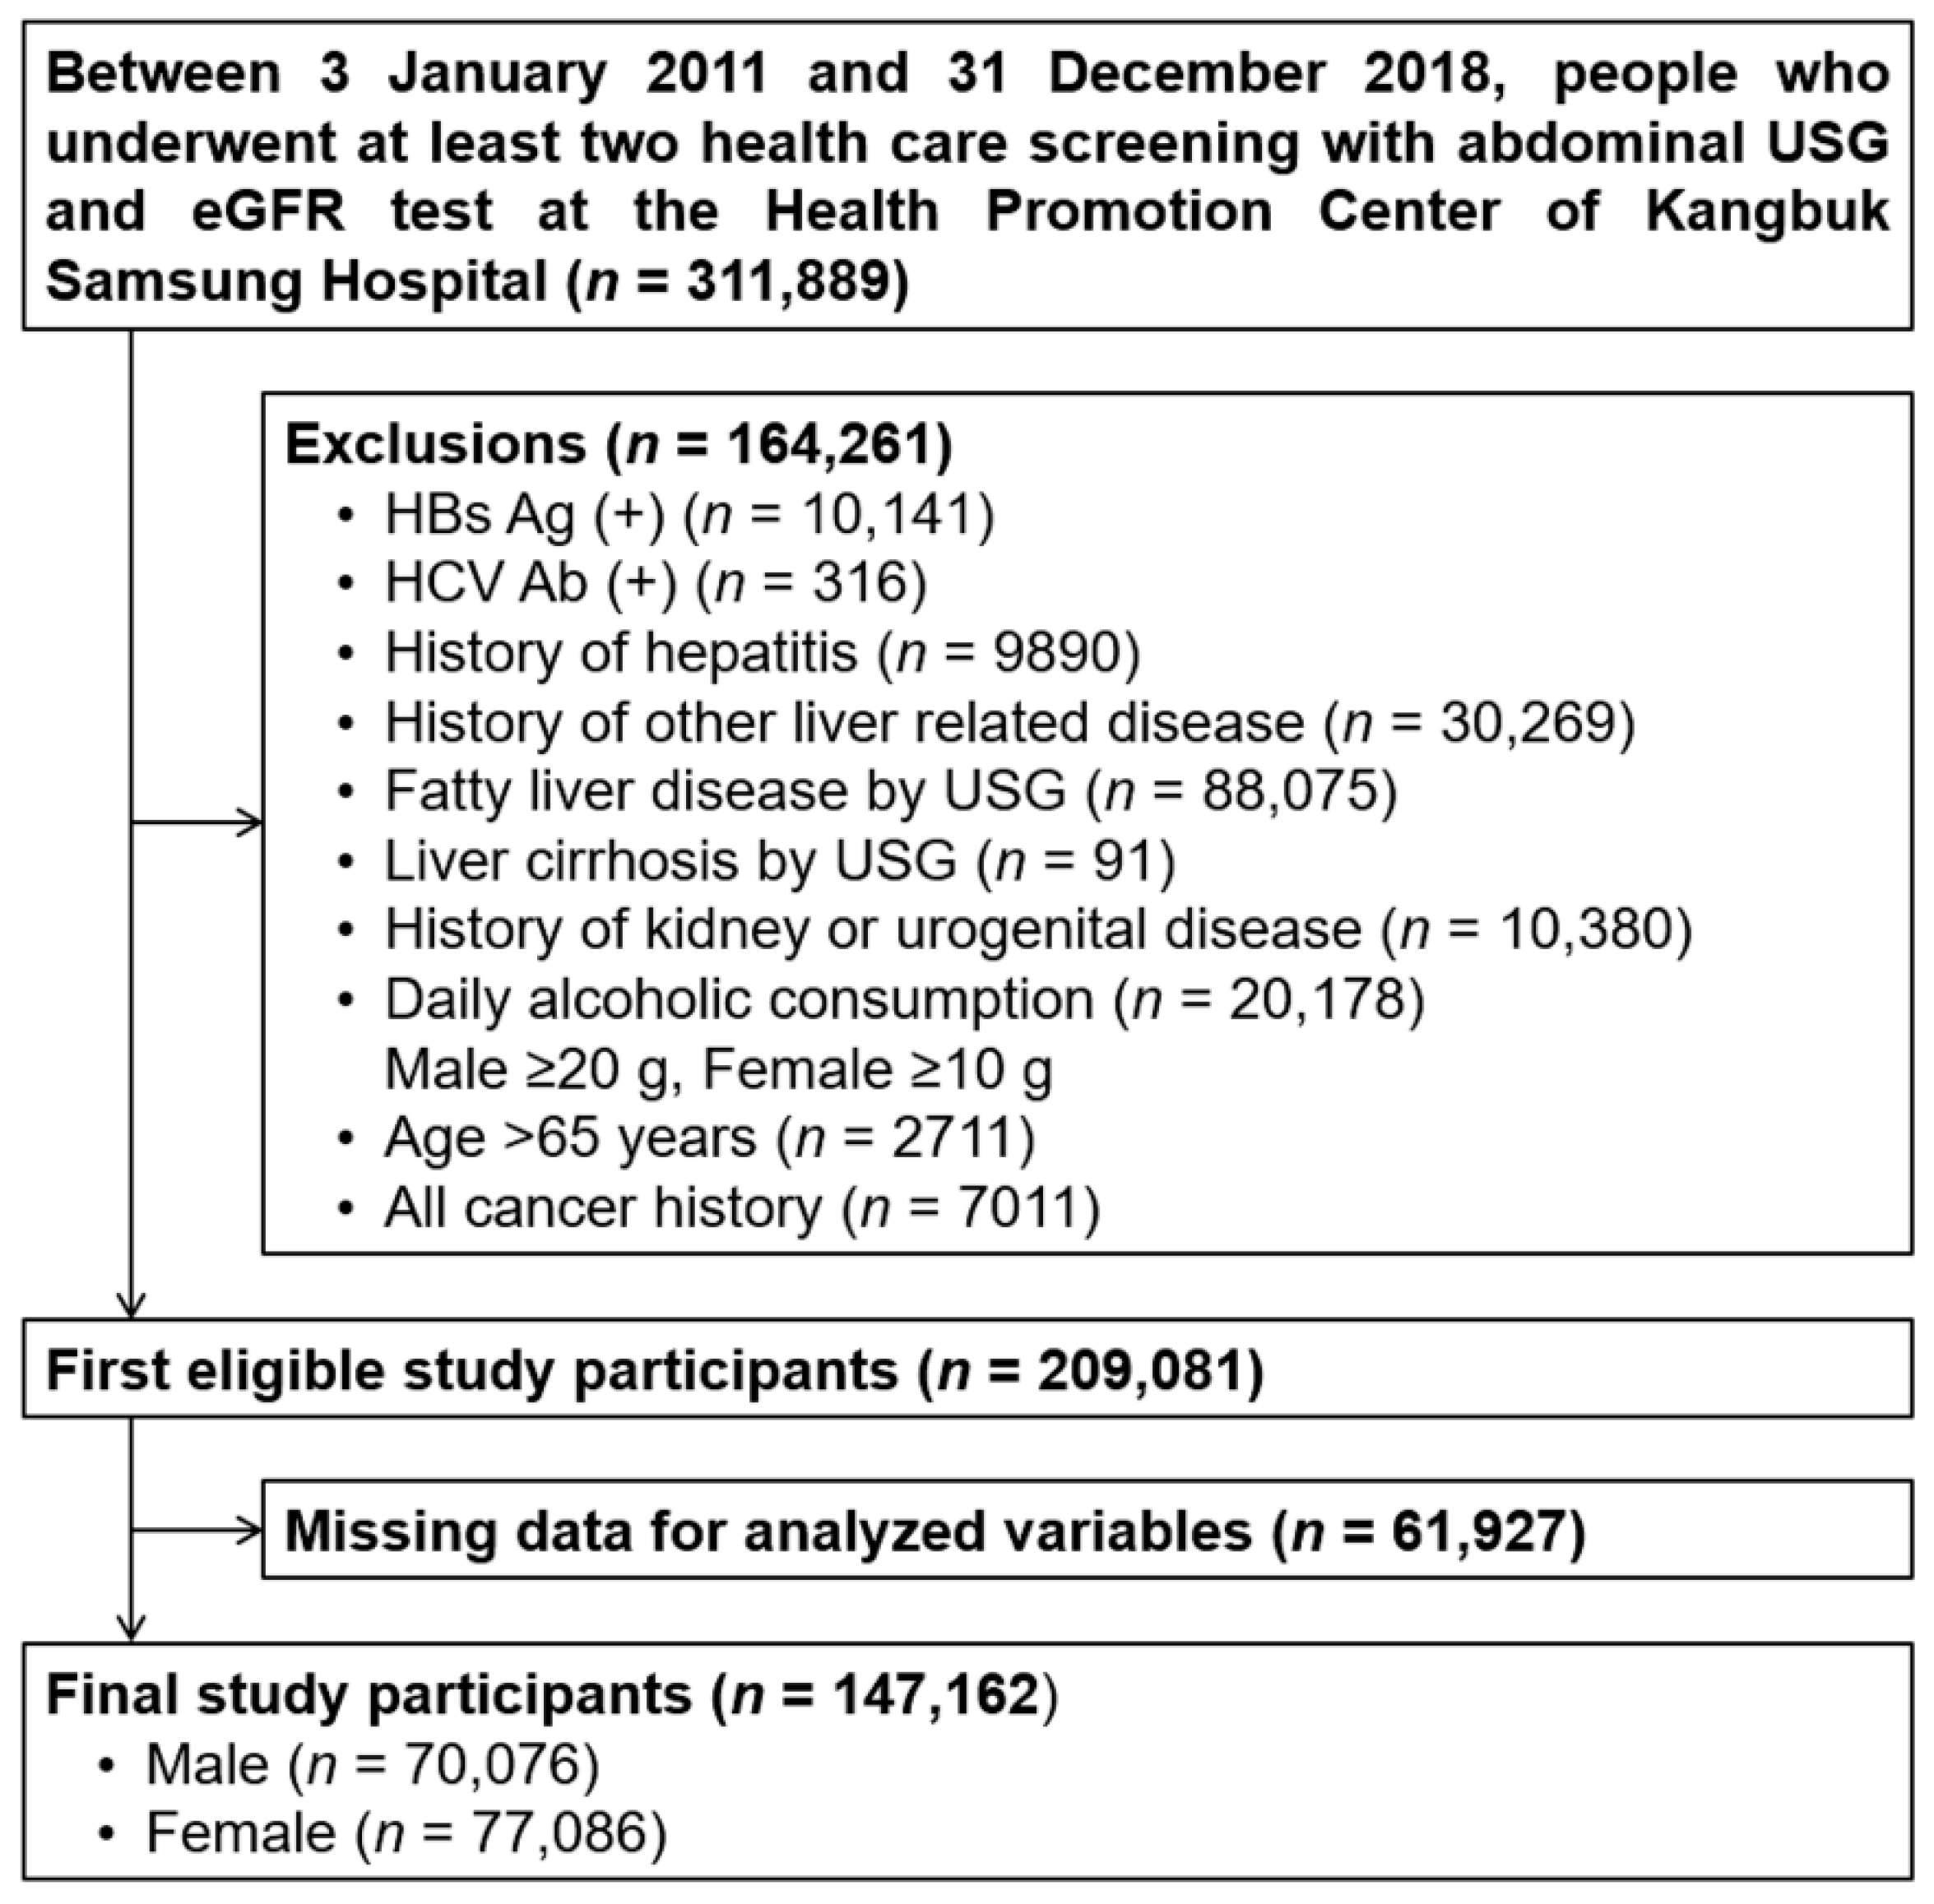
| No. of subjects | 147,162 | 117,752 | 29,410 | |
| Male | 70,076 (47.6) | 48,528 (41.2) | 21,548 (73.3) | <0.001 |
| Age, years | 36.3 ± 6.9 | 36.0 ± 0.0 | 37.3 ± 0.0 | <0.001 |
| BMI, kg/m2 | 22.1 ± 2.7 | 21.7 ± 0.0 | 23.9 ± 0.0 | <0.001 |
| Obesity | 20,792 (14.1) | 11,674 (9.9) | 9118 (31.0) | <0.001 |
| WC, cm | 78.1 ± 8.1 | 76.7 ± 0.0 | 83.9 ± 0.1 | <0.001 |
| FBG, mg/dL | 92.3 ± 10.1 | 91.7 ± 0.0 | 95.0 ± 0.1 | <0.001 |
| Hemoglobin A1c, % | 5.5 ± 0.3 | 5.5 ± 0.3 | 5.6 ± 0.4 | <0.001 |
| HOMA-IR | 1.01 (0.68–1.45) | 0.97 (0.65–1.39) | 1.2 (0.82–1.71) | <0.001 |
| DM | 1649 (1.1) | 1039 (0.9) | 610 (2.1) | <0.001 |
| SBP, mmHg | 106.7 ± 12.2 | 105.4 ± 0.0 | 111.7 ± 0.1 | <0.001 |
| DBP, mmHg | 68.0 ± 9.2 | 67.2 ± 8.9 | 71.3 ± 9.4 | <0.001 |
| Hypertension | 8207 (5.6) | 5429 (4.6) | 2778 (9.5) | <0.001 |
| AST, U/L | 18 (16–22) | 18 (15–21) | 19 (16–24) | <0.001 |
| ALT, U/L | 15 (12–21) | 14 (11–20) | 19 (14–27) | <0.001 |
| TC, mg/dL | 188.1 ± 31.7 | 186.1 ± 0.1 | 196.4 ± 0.2 | <0.001 |
| Triglyceride, mg/dL | 78 (58–108) | 73 (56–99) | 102 (75–143) | <0.001 |
| LDL, mg/dL | 114.2 ± 29.4 | 111.5 ± 0.1 | 124.8 ± 0.2 | <0.001 |
| HDL, mg/dL | 61.8 ± 14.5 | 63.5 ± 0.0 | 55.1 ± 0.1 | <0.001 |
| Dyslipidemia | 15,411 (10.5) | 10,804 (9.2) | 4607 (15.7) | <0.001 |
| hs-CRP, mg/dL | 0.03 (0.02–0.07) | 0.03 (0.02–0.06) | 0.05 (0.03–0.09) | <0.001 |
| Creatinine, mg/dL | 0.8 (0.7–1.0) | 0.8 (0.7- 0.9) | 0.9 (0.8–1.0) | <0.001 |
| eGFR, mL/min/1.73 m2 | 106.5 (94.0–114.5) | 107.9 (95.1–115.0) | 100.6 (90.5–111.5) | <0.001 |
| Alcohol intake, g/day | 4 (2–11) | 4 (1–10) | 7 (3–20) | <0.001 |
| Current smoker | 24,397 (16.6) | 16,029 (13.6) | 8368 (28.5) | <0.001 |
| Regular exercise | 18,543 (12.6) | 14,595 (12.4) | 3948 (13.4) | <0.001 |
| NFS | −3.058 ± 0.002 | −3.077 ± 0.003 | −2.98 ± 0.006 | <0.001 |
| FIB-4 | 0.69 (0.56–0.87) | 0.69 (0.56–0.88) | 0.68 (0.54–0.85) | <0.001 |
| Percentile Group of eGFR | No. of Participants | Cases, n | IR, per 1000 PY | HR (95% CI) | ||
|---|---|---|---|---|---|---|
| Model 1 | Model 2 | Model 3 | ||||
| <5 | 7307 | 1462 | 46.09 (43.79–48.51) | 0.85 (0.80–0.90) | 0.88 (0.83–0.93) | 0.88 (0.83–0.94) |
| 5–19 | 22,073 | 4436 | 47.02 (45.66–48.43) | 0.91 (0.87–0.95) | 0.94 (0.90–0.98) | 0.94 (0.90–0.98) |
| 20–34 | 22,088 | 4478 | 47.63 (46.26–49.05) | 0.95 (0.91–0.99) | 0.96 (0.92–1.01) | 0.97 (0.93–1.01) |
| 35–49 | 22,087 | 4445 | 48.51 (47.1–49.95) | 0.99 (0.95–1.03) | 0.99 (0.95–1.03) | 0.99 (0.95–1.04) |
| 50–64 | 22,021 | 4245 | 47.34 (45.94–48.78) | 1 (reference) | 1 (reference) | 1 (reference) |
| 65–79 | 22,164 | 4514 | 51.03 (49.56–52.54) | 1.09 (1.04–1.13) | 1.06 (1.02–1.11) | 1.07 (1.02–1.11) |
| 80–94 | 22,053 | 4402 | 52.71 (51.17–54.29) | 1.17 (1.12–1.22) | 1.11 (1.07–1.16) | 1.11 (1.07–1.16) |
| ≥95 | 7369 | 1428 | 56.26 (53.41–59.25) | 1.35 (1.27–1.44) | 1.21 (1.14–1.28) | 1.21 (1.14–1.29) |
| Percentile Group of eGFR | No. of Participants | Cases, n | IR, Per 1000 PY | HR (95% CI) | ||
|---|---|---|---|---|---|---|
| Model 1 | Model 2 | Model 3 | ||||
| <5 | 512 | 136 | 65.21 (55.13–77.15) | 0.95 (0.77–1.17) | 0.95 (0.77–1.18) | 0.96 (0.78–1.19) |
| 5–19 | 1382 | 349 | 61.38 (55.27–68.17) | 0.97 (0.82–1.14) | 1.03 (0.88–1.21) | 1.05 (0.89–1.24) |
| 20–34 | 1236 | 301 | 58.85 (52.57–65.89) | 0.95 (0.80–1.12) | 1.03 (0.87–1.22) | 1.05 (0.88–1.25) |
| 35–49 | 1185 | 296 | 61.31 (54.71–68.71) | 1.02 (0.86–1.21) | 1.08 (0.91–1.28) | 1.09 (0.92–1.29) |
| 50–64 | 1037 | 252 | 58.77 (51.94–66.49) | 1 (reference) | 1 (reference) | 1 (reference) |
| 65–79 | 1063 | 259 | 61.24 (54.22–69.17) | 1.03 (0.87–1.23) | 1.06 (0.89–1.26) | 1.08 (0.90–1.29) |
| 80–94 | 976 | 253 | 66.92 (59.16–75.69) | 1.18 (0.99–1.41) | 1.11 (0.94–1.33) | 1.15 (0.97–1.38) |
| ≥95 | 304 | 83 | 77.36 (62.39–95.93) | 1.50 (1.17–1.93) | 1.37 (1.07–1.76) | 1.42 (1.11–1.82) |
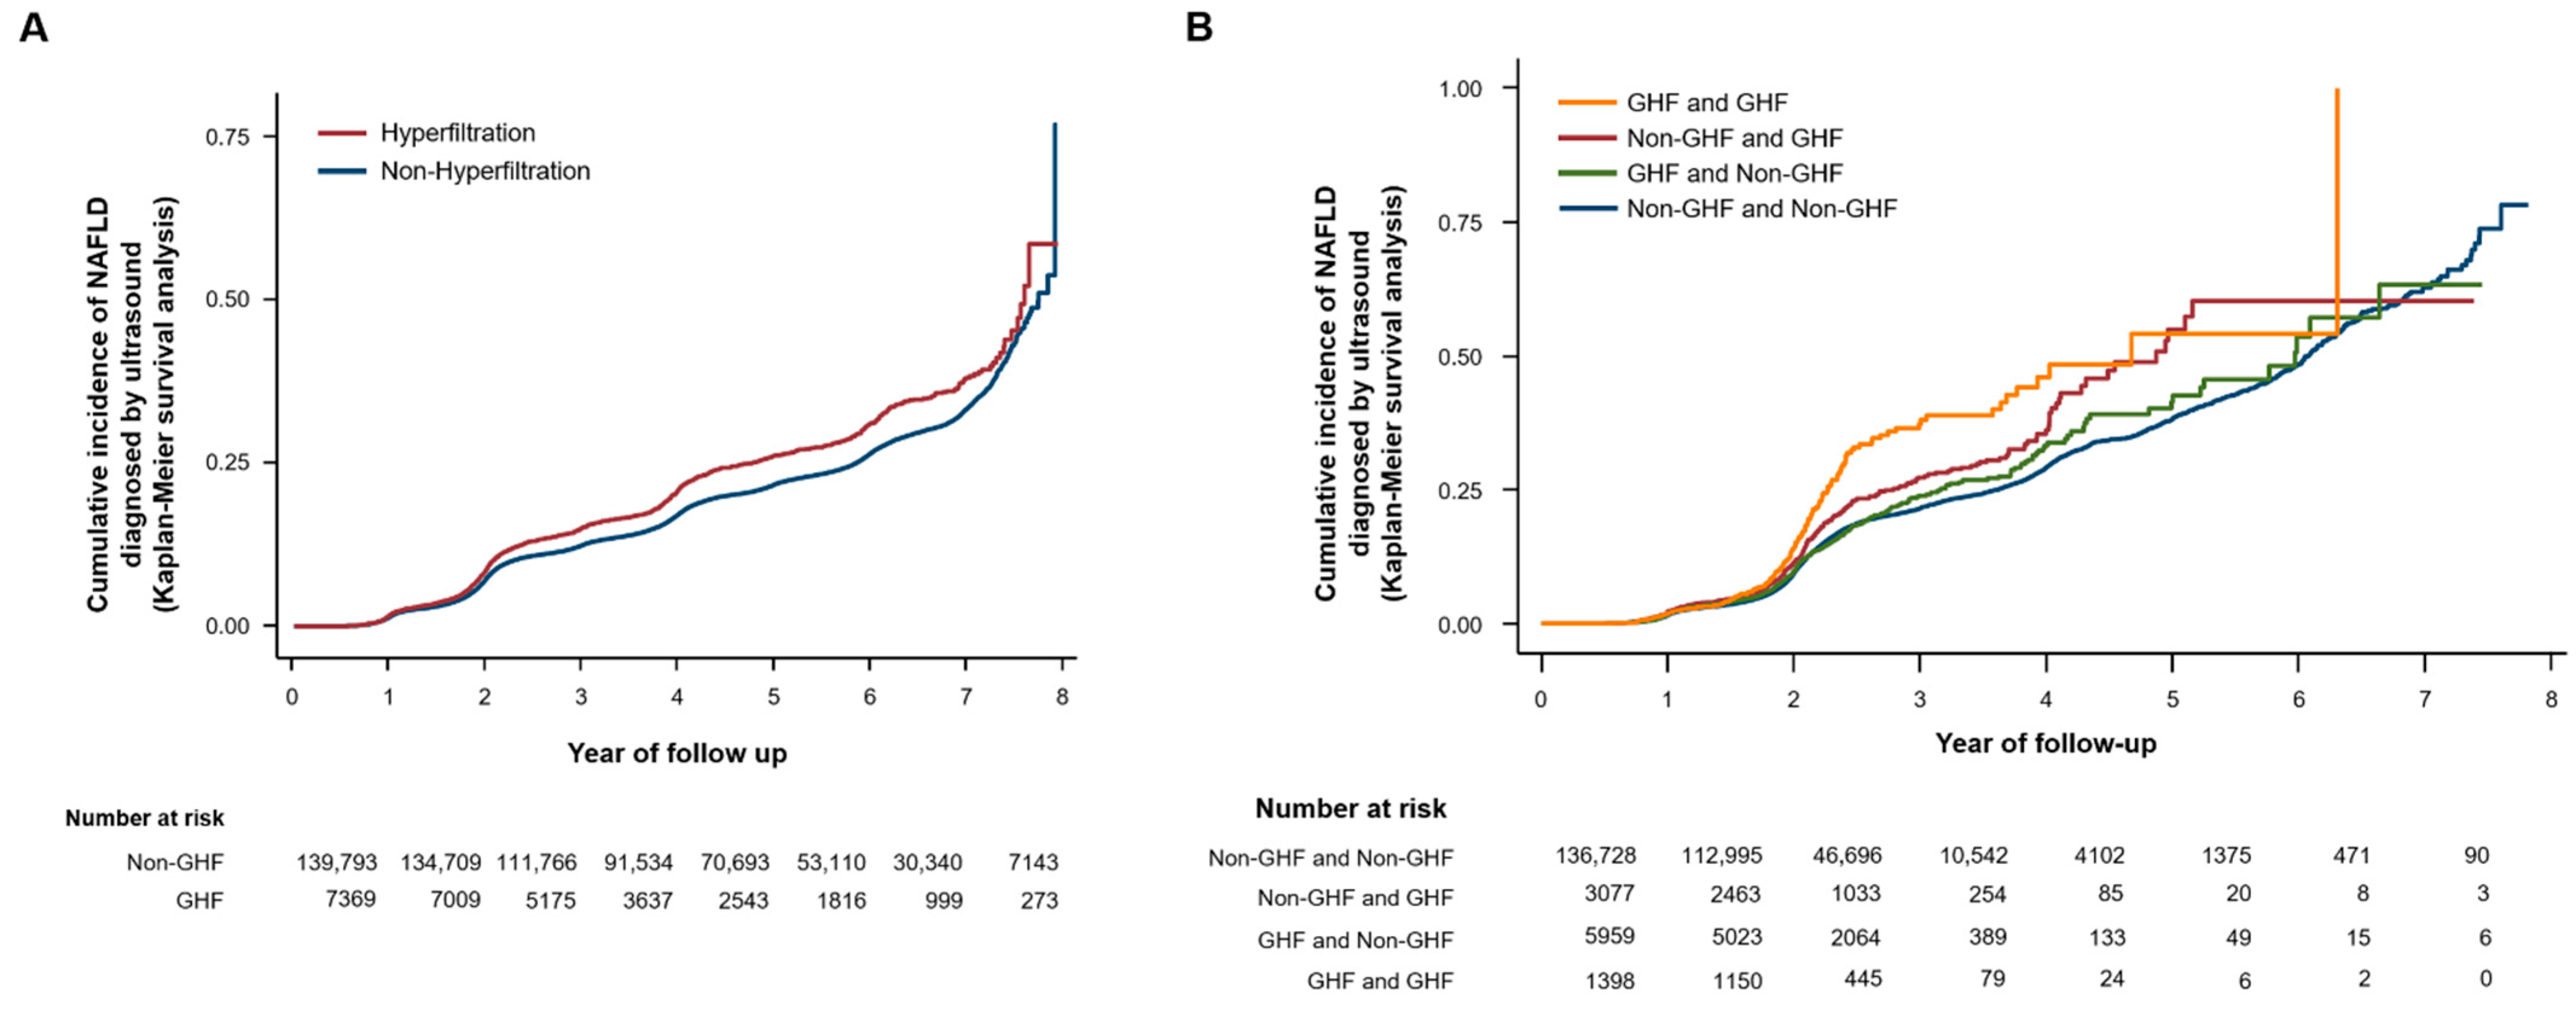
| eGFR Status (Baseline and End of Follow-Up) | No. of Participants | Cases, n | IR, Per 1000 PY | HR (95% CI) | ||
|---|---|---|---|---|---|---|
| Model 1 | Model 2 | Model 3 | ||||
| Non-GHF and Non-GHF 1 | 130,728 | 12,910 | 51.74 (50.85–52.64) | 1 (reference) | 1 (reference) | 1 (reference) |
| Non-GHF and GHF | 3077 | 368 | 66.25 (59.82–73.38) | 1.23 (1.11–1.37) | 1.18 (1.07–1.31) | 1.18 (1.07–1.31) |
| GHF and Non-GHF | 5959 | 590 | 54.21 (50.01–58.76) | 1.24 (1.14–1.35) | 1.18 (1.08–1.28) | 1.17 (1.08–1.28) |
| GHF and GHF | 1398 | 194 | 79.08 (68.70–91.02) | 1.44 (1.25–1.66) | 1.31 (1.14–1.51) | 1.31 (1.14–1.51) |
Publisher’s Note: MDPI stays neutral with regard to jurisdictional claims in published maps and institutional affiliations. |
© 2022 by the authors. Licensee MDPI, Basel, Switzerland. This article is an open access article distributed under the terms and conditions of the Creative Commons Attribution (CC BY) license (https://creativecommons.org/licenses/by/4.0/).
Share and Cite
Koo, D.-J.; Lee, M.Y.; Jung, I.; Moon, S.J.; Kwon, H.; Rhee, E.-J.; Park, C.-Y.; Lee, W.-Y.; Oh, K.W.; Park, S.E. Increased Risk of NAFLD in Adults with Glomerular Hyperfiltration: An 8-Year Cohort Study Based on 147,162 Koreans. J. Pers. Med. 2022, 12, 1142. https://doi.org/10.3390/jpm12071142
Koo D-J, Lee MY, Jung I, Moon SJ, Kwon H, Rhee E-J, Park C-Y, Lee W-Y, Oh KW, Park SE. Increased Risk of NAFLD in Adults with Glomerular Hyperfiltration: An 8-Year Cohort Study Based on 147,162 Koreans. Journal of Personalized Medicine. 2022; 12(7):1142. https://doi.org/10.3390/jpm12071142
Chicago/Turabian StyleKoo, Dae-Jeong, Mi Yeon Lee, Inha Jung, Sun Joon Moon, Hyemi Kwon, Eun-Jung Rhee, Cheol-Young Park, Won-Young Lee, Ki Won Oh, and Se Eun Park. 2022. "Increased Risk of NAFLD in Adults with Glomerular Hyperfiltration: An 8-Year Cohort Study Based on 147,162 Koreans" Journal of Personalized Medicine 12, no. 7: 1142. https://doi.org/10.3390/jpm12071142
APA StyleKoo, D.-J., Lee, M. Y., Jung, I., Moon, S. J., Kwon, H., Rhee, E.-J., Park, C.-Y., Lee, W.-Y., Oh, K. W., & Park, S. E. (2022). Increased Risk of NAFLD in Adults with Glomerular Hyperfiltration: An 8-Year Cohort Study Based on 147,162 Koreans. Journal of Personalized Medicine, 12(7), 1142. https://doi.org/10.3390/jpm12071142