
Deep Learning Analysis of Polish Electronic Health Records for Diagnosis Prediction in Patients with Cardiovascular Diseases

 , ,
, ,
Abstract
:1. Introduction
2. Materials and Methods
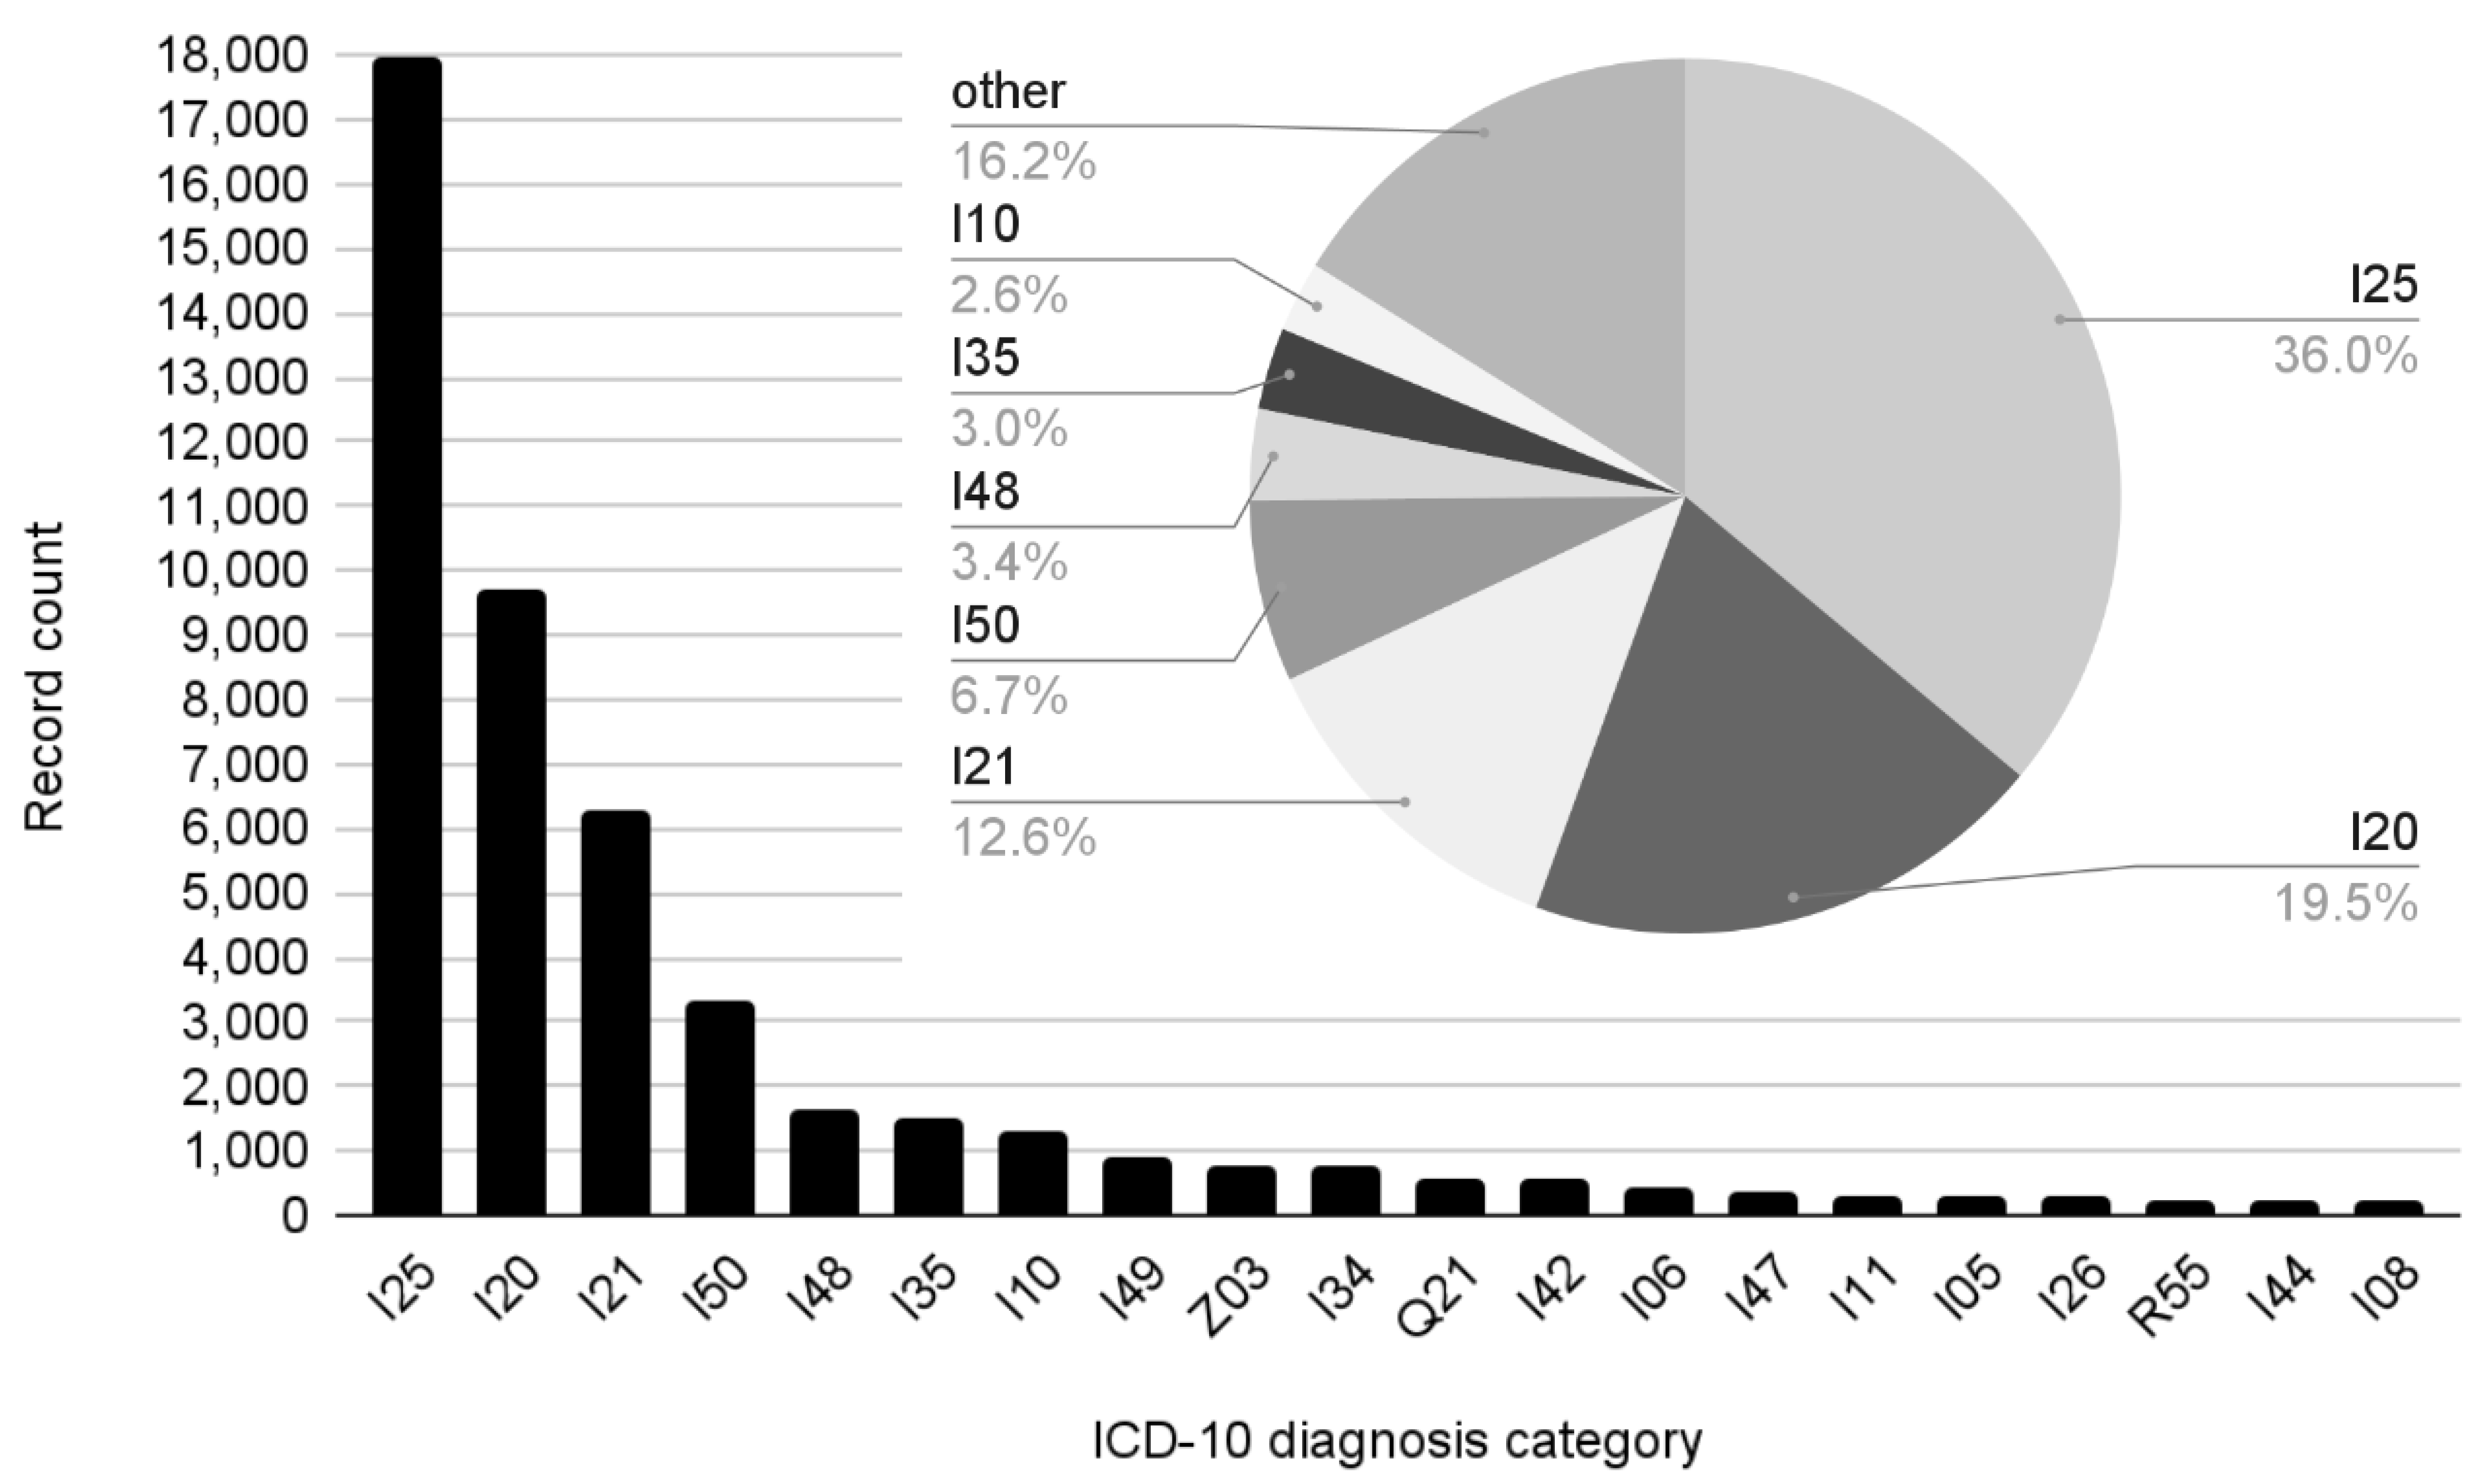
2.1. Dataset Characteristics
- Admission, reasons for admission, and medical history.
- Physical examination at admission.
- Discharge, summary of hospitalization, and results.
- Recommendations at discharge and medication.
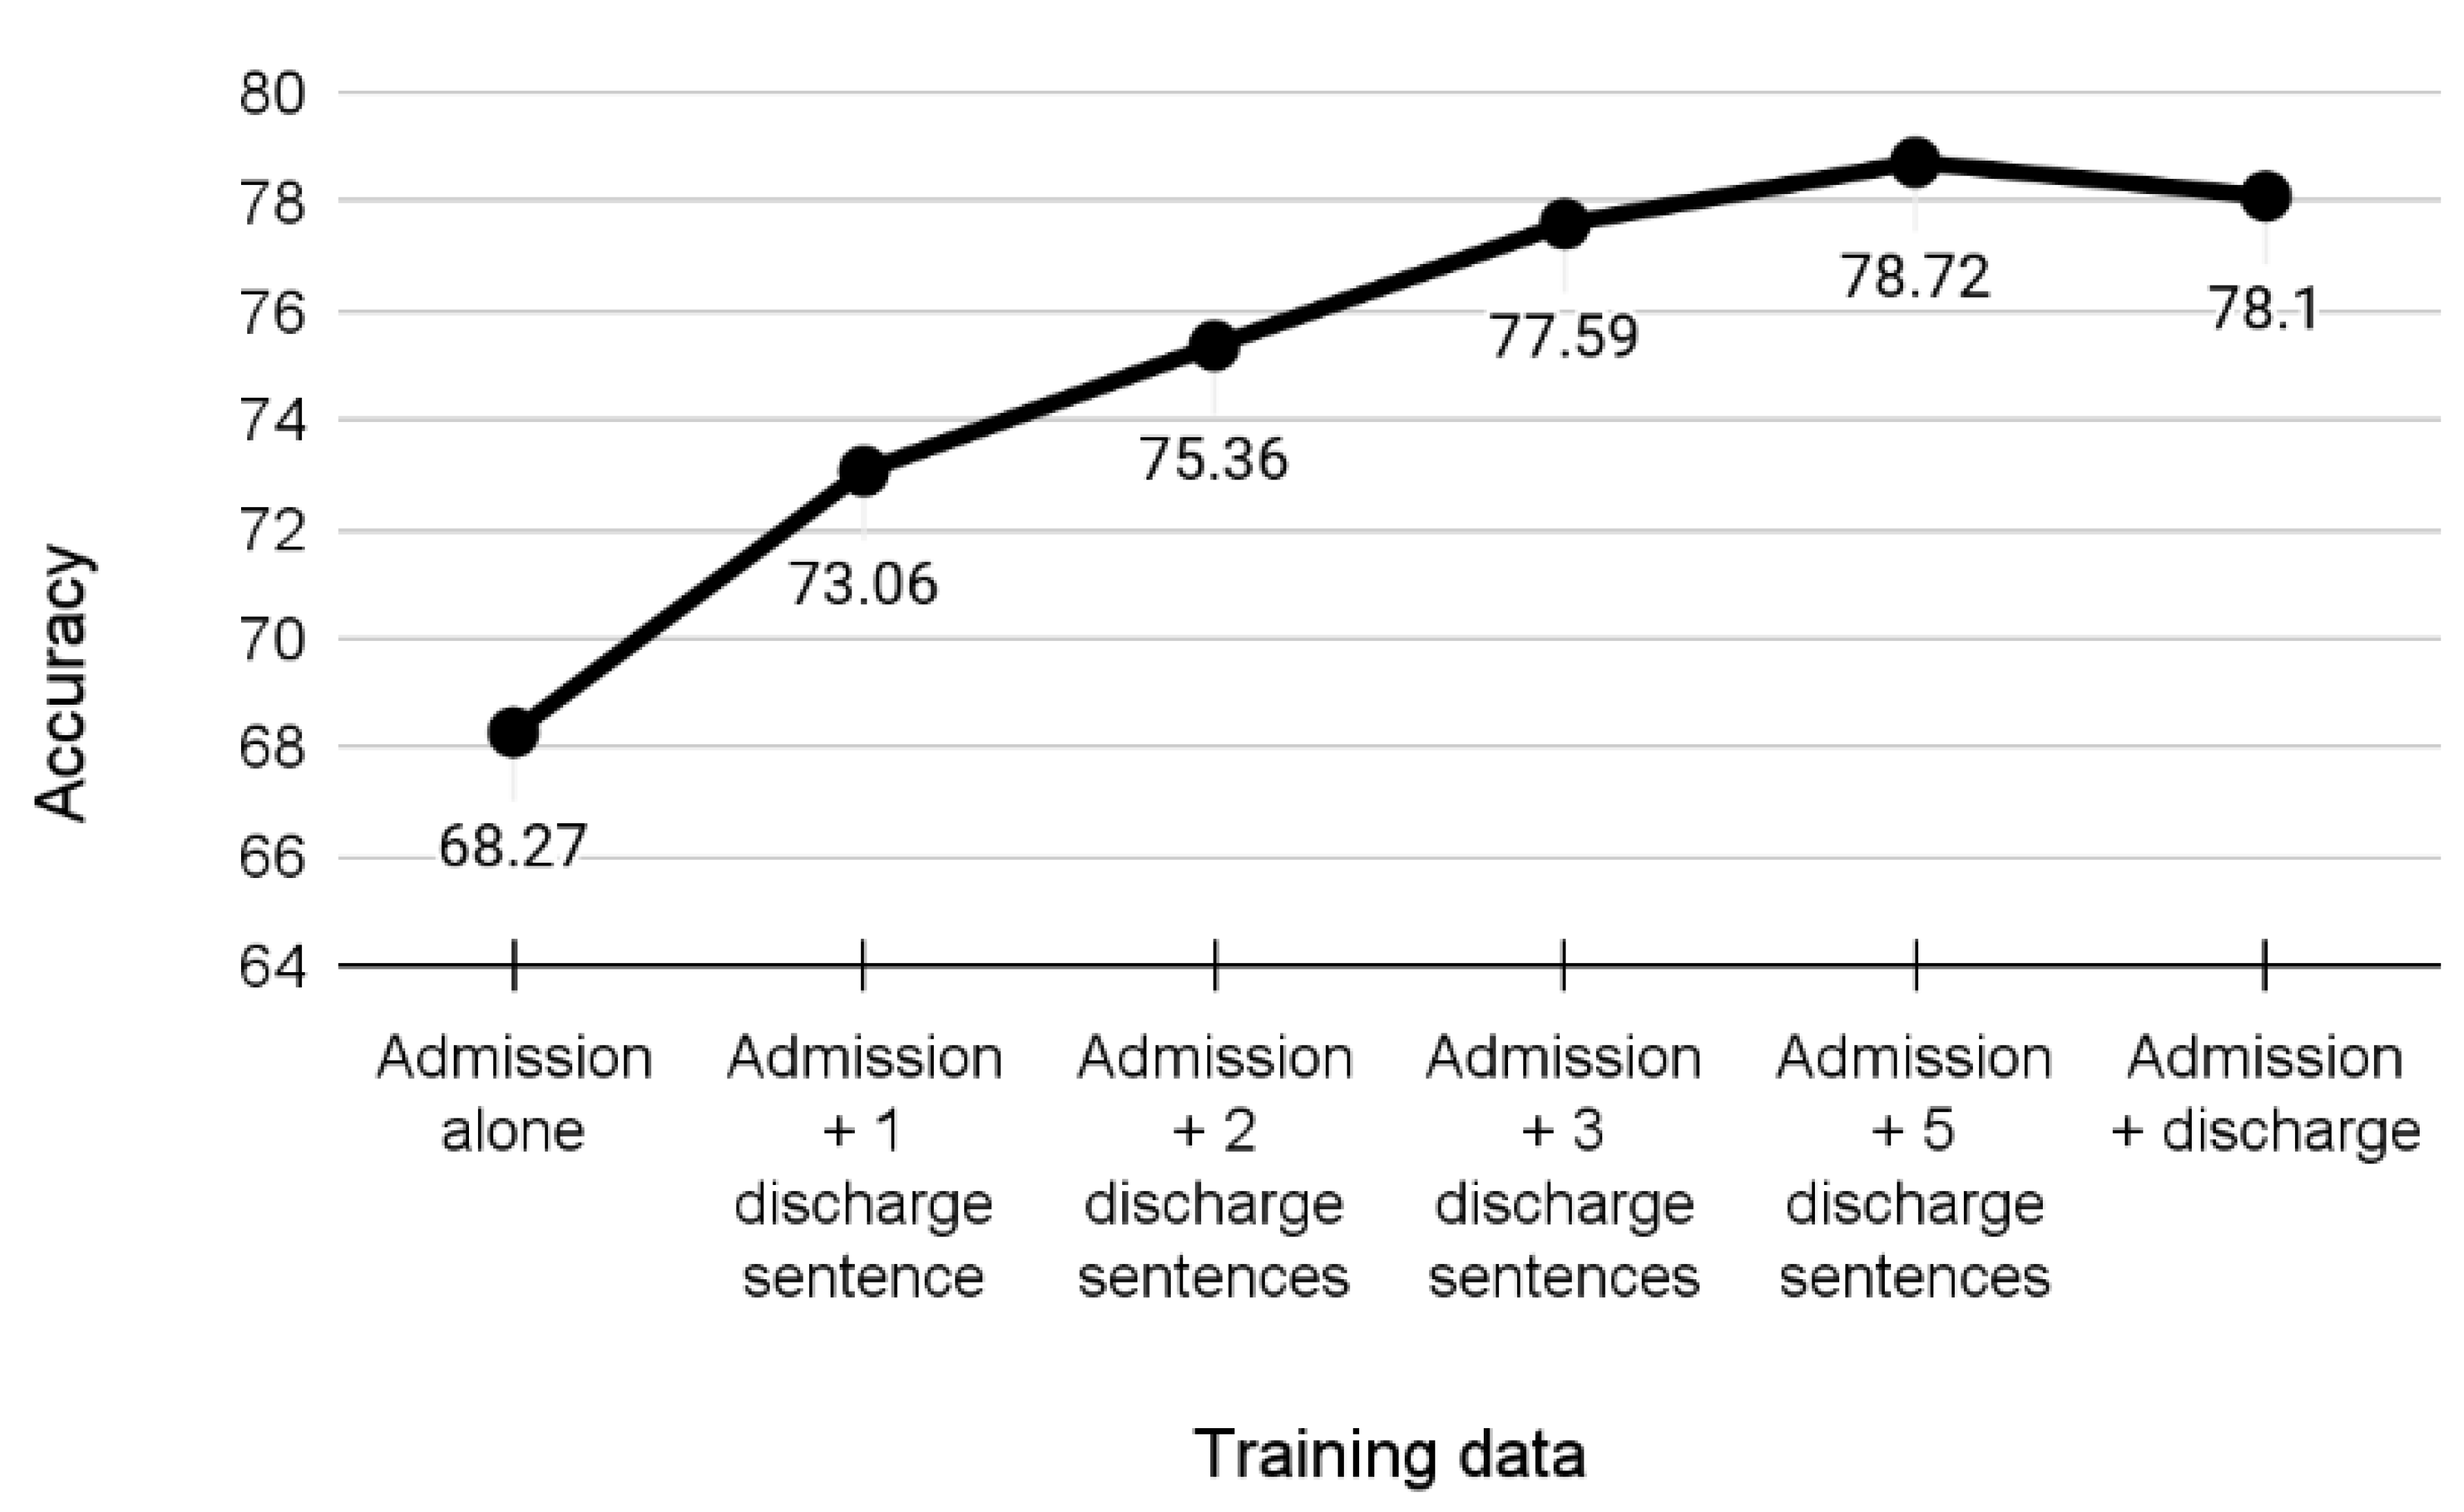
- Section 1 (admission) composed without the knowledge of future diagnosis; models trained on Section 1 text can be said to perform true prediction.
- Section 3 (discharge) composed with the knowledge of the diagnosis; models trained on Section 3 text are useful for pattern/inconsistency discovery but also set a ceiling value for any prediction efforts, revealing the limitedness of textual information (as distinct from measurements or medical imaging) in determining the actual physical condition of a patient.
2.2. Dataset Preprocessing for Classification
2.3. Limitations and Data Consistency Considerations
- Real changes in disease prevalence.
- Evolution of medical research.
- Individual staff members’ documentation tendencies.
3. Results
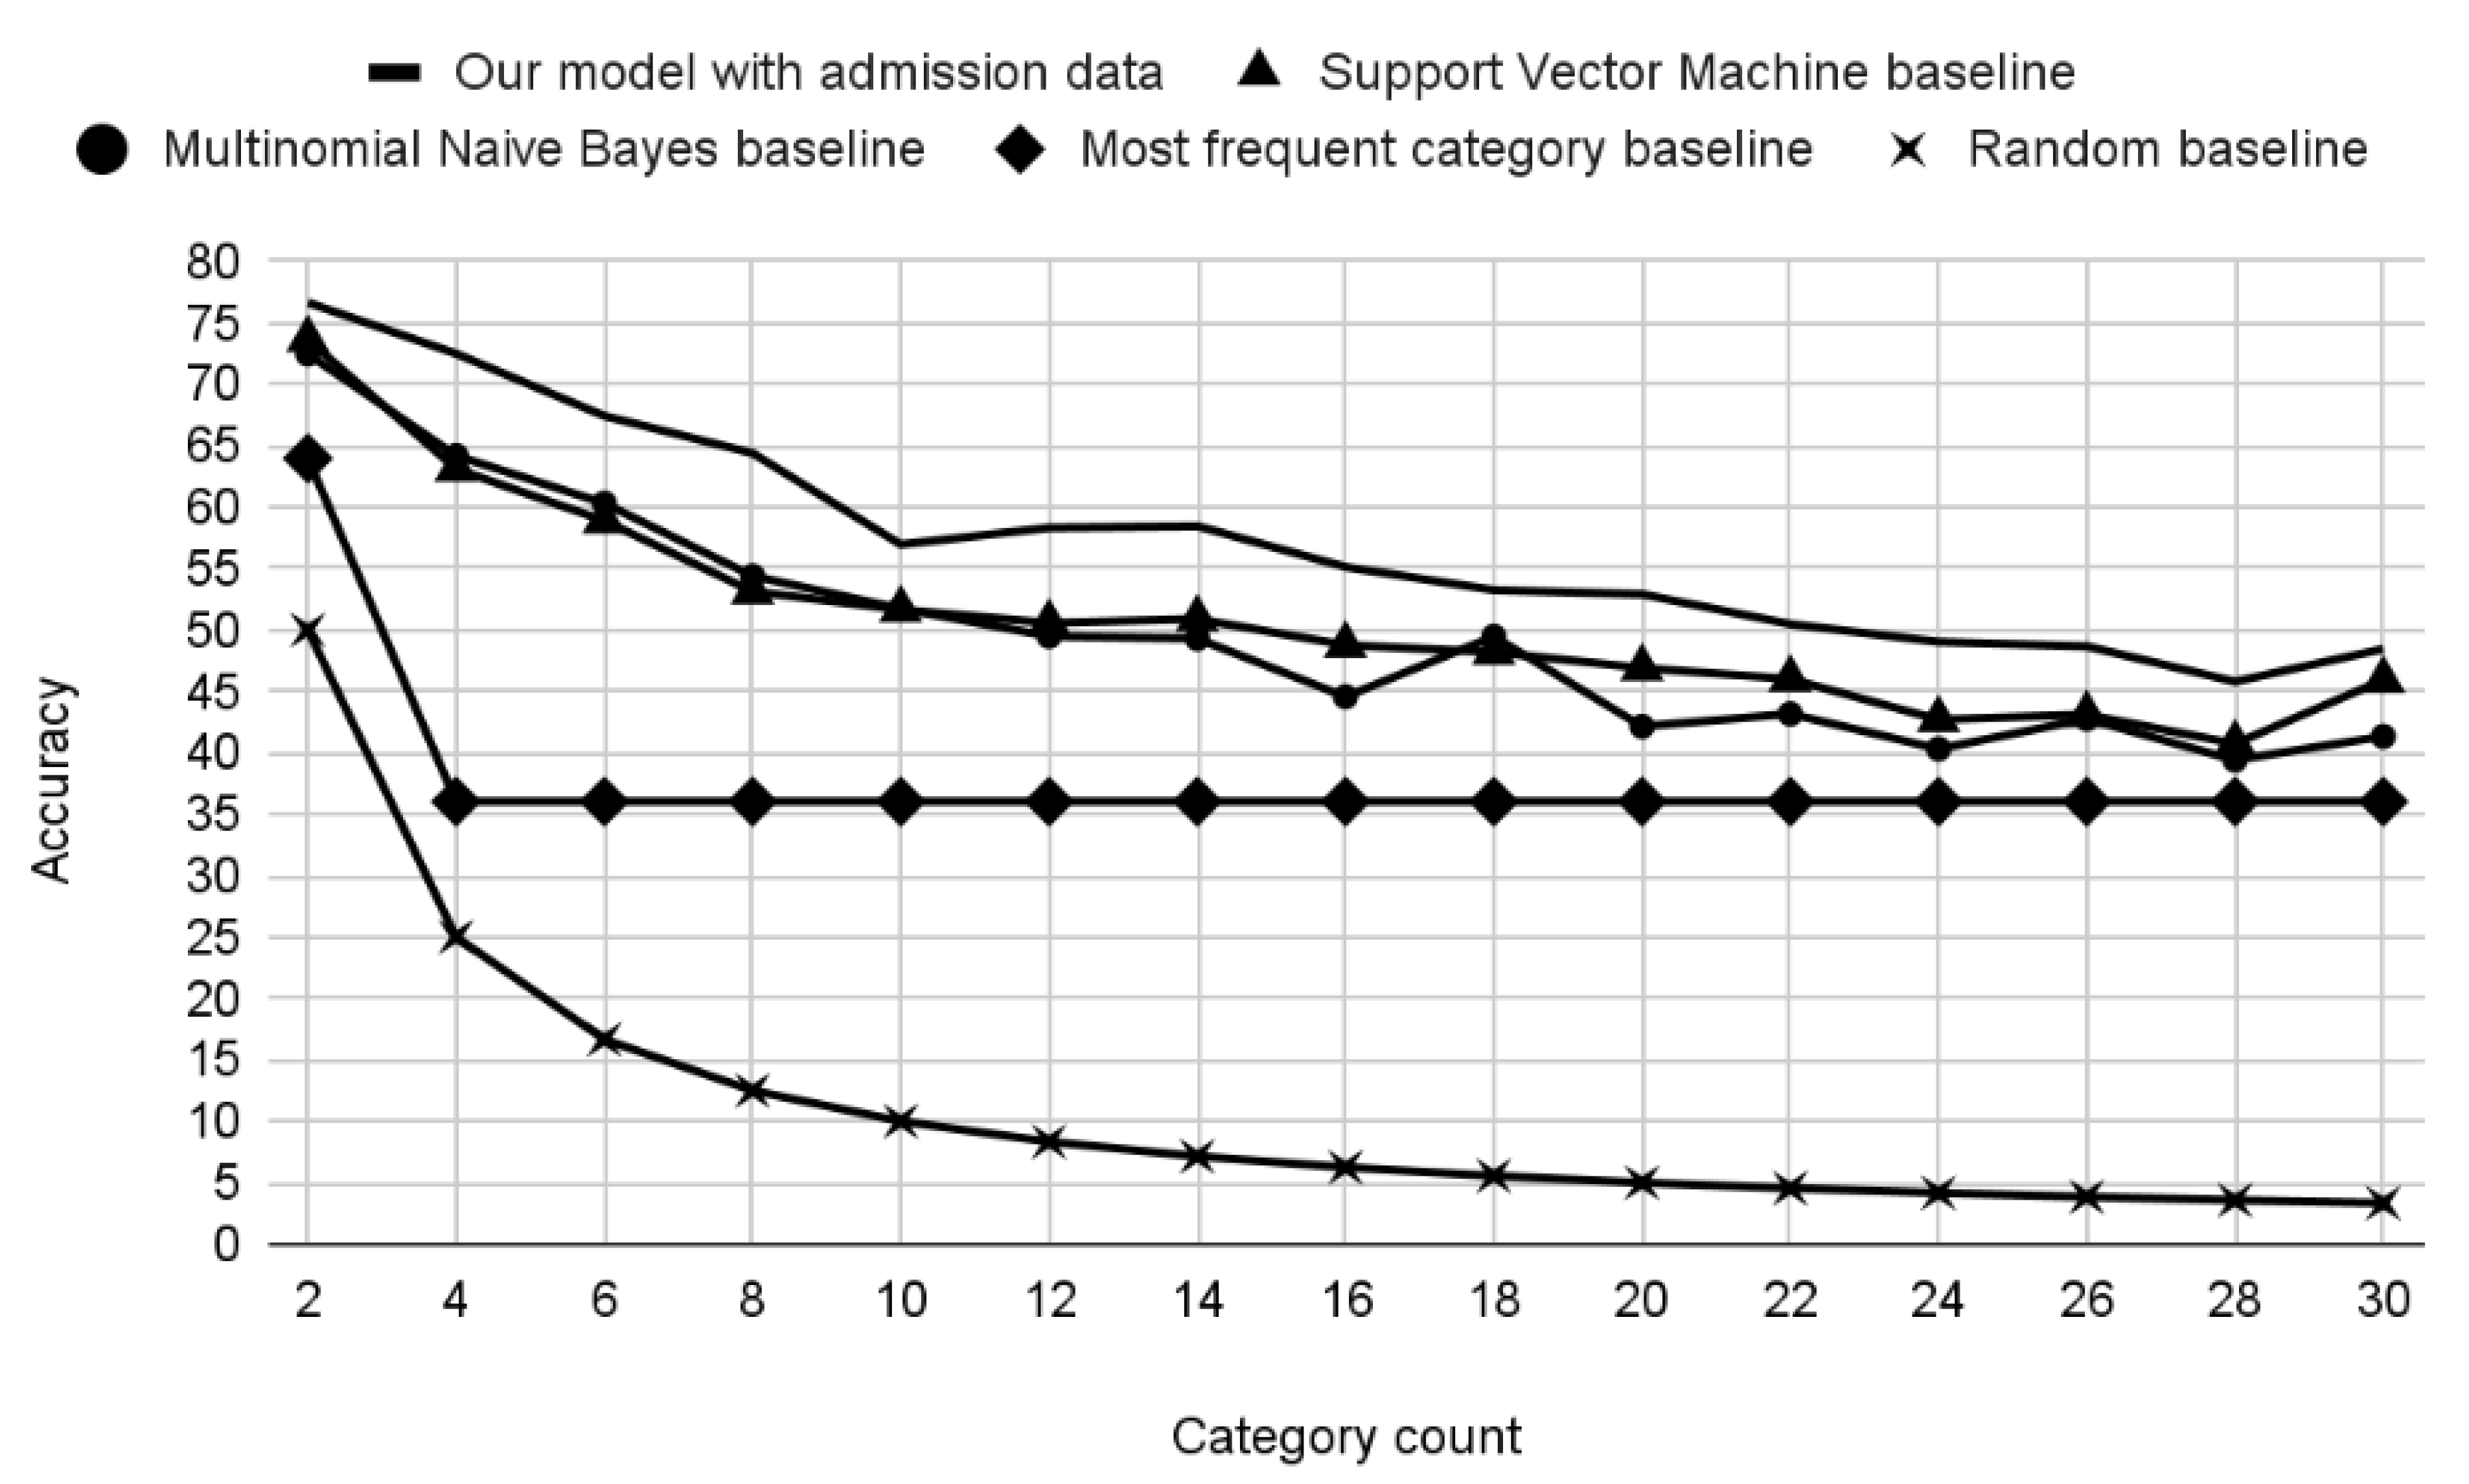
Experiments
4. Discussion
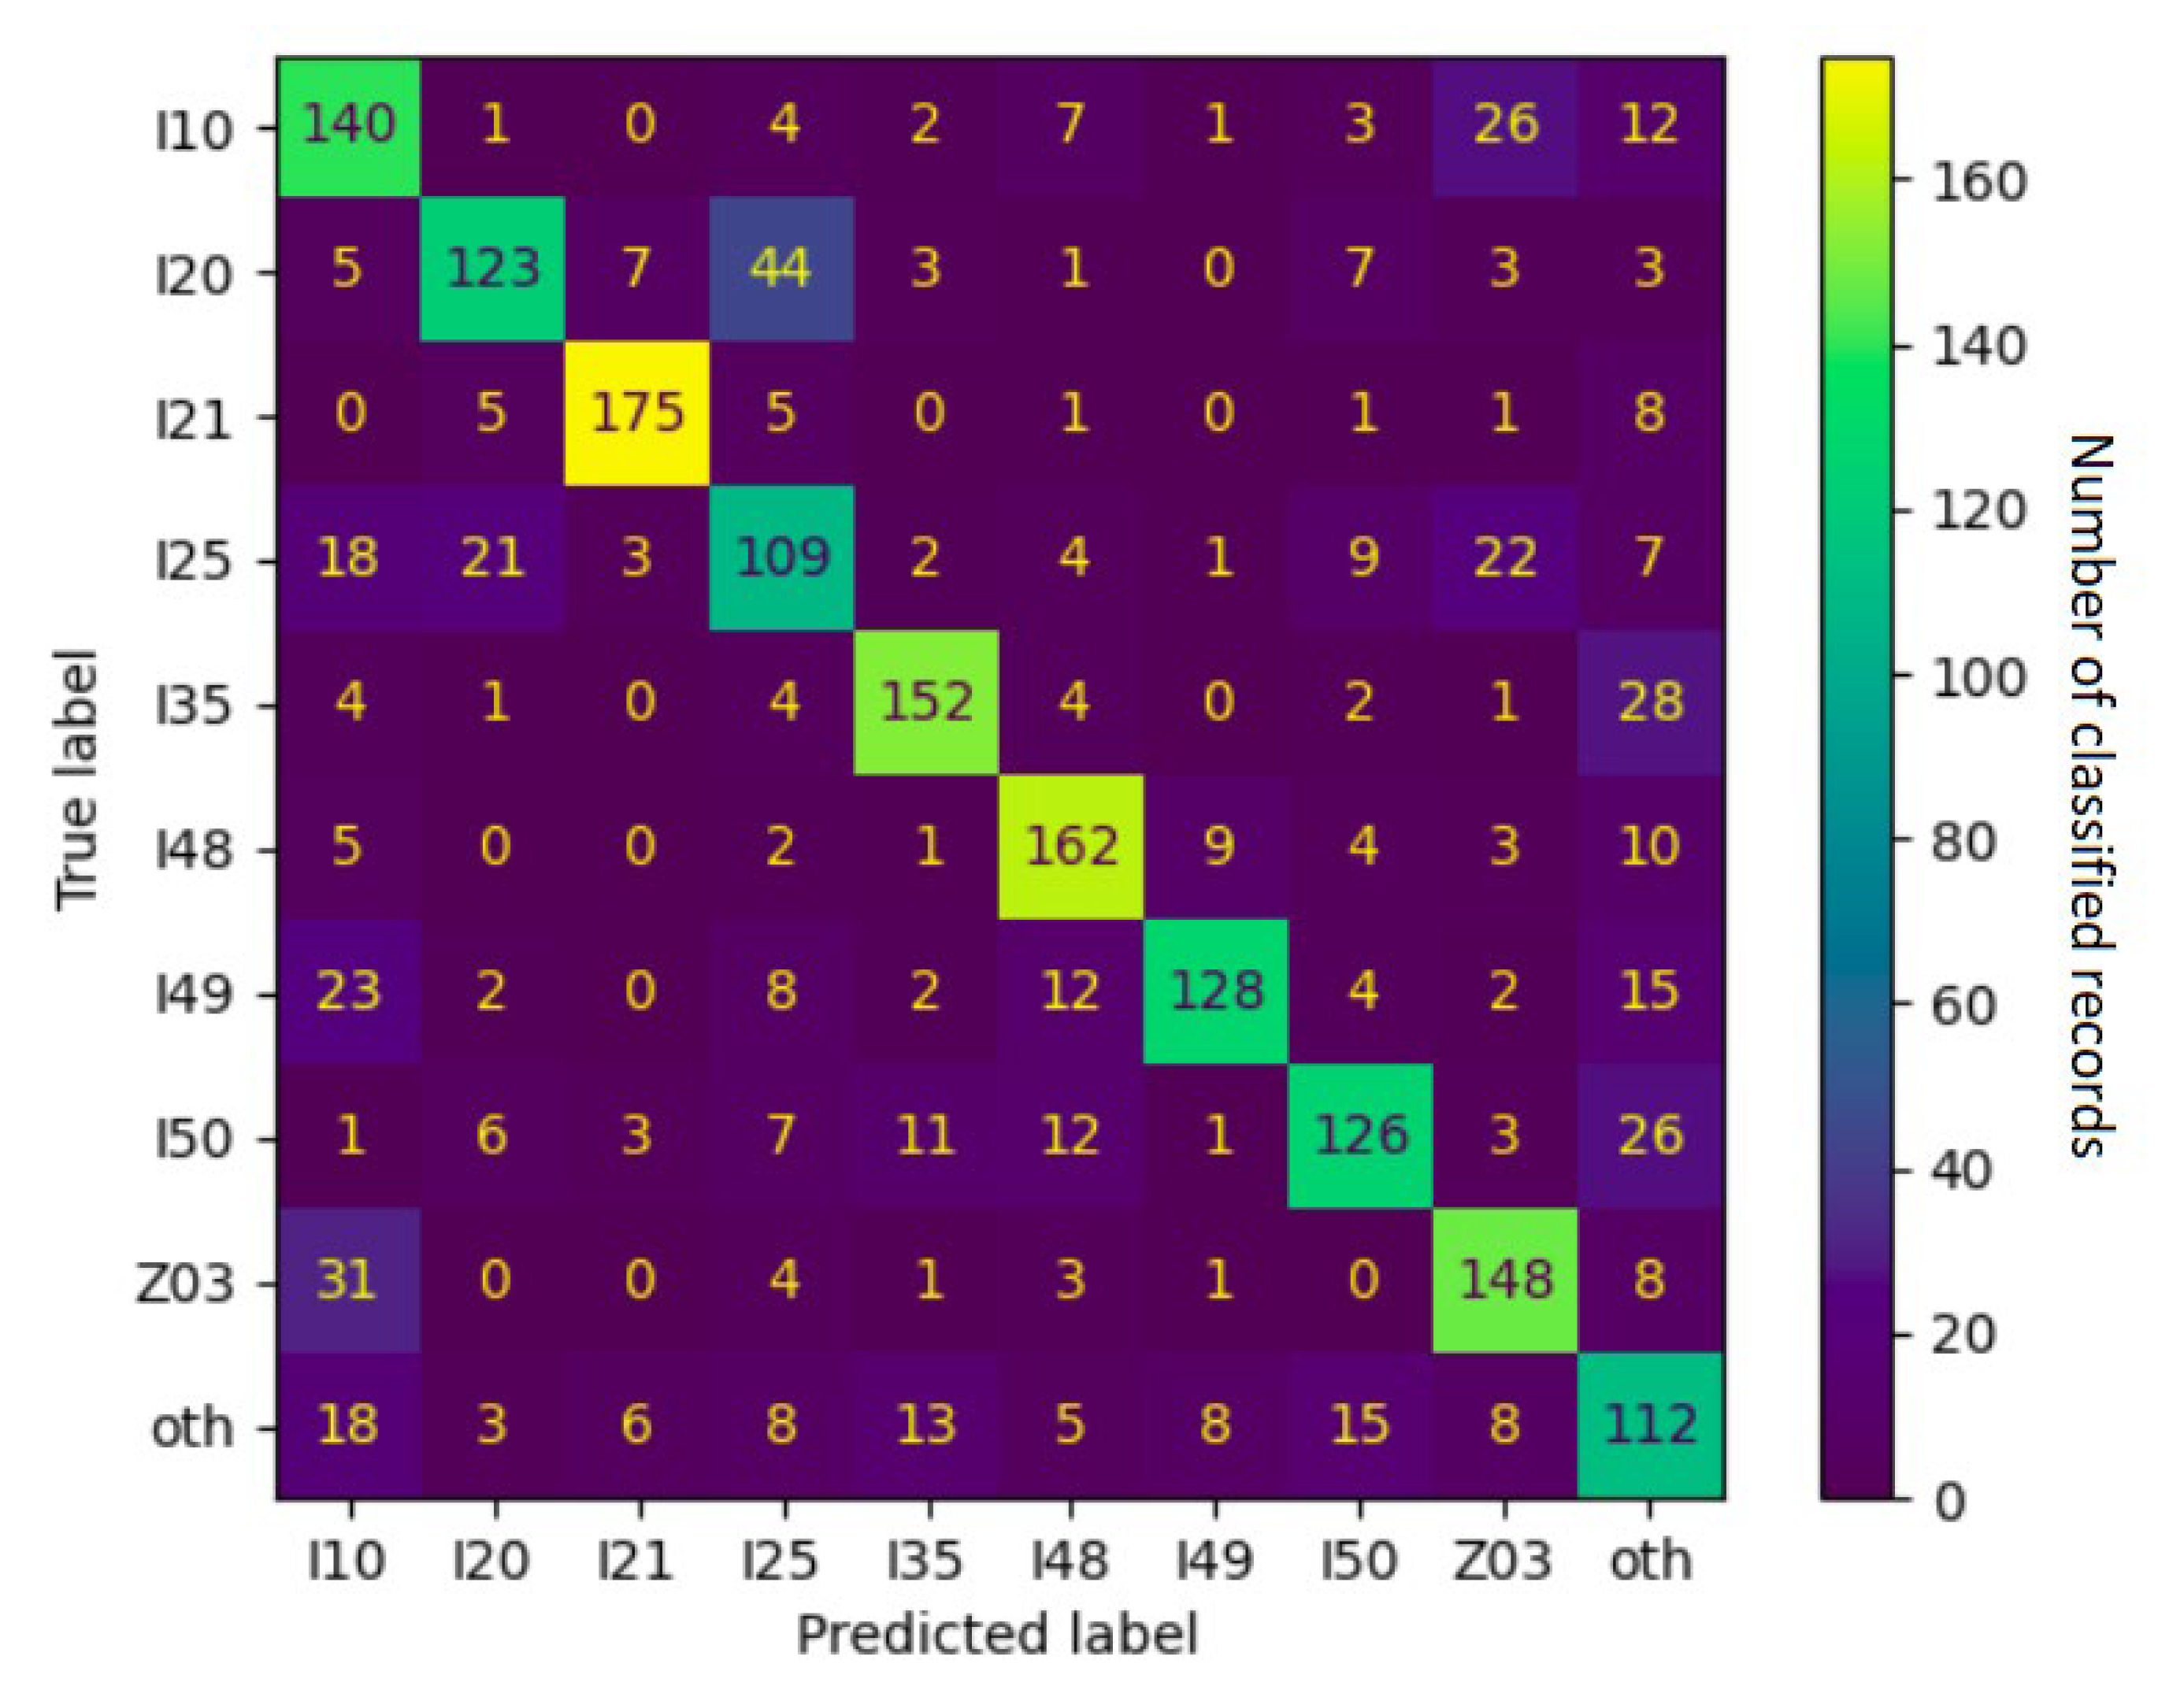
4.1. Error Analysis
4.2. Medical Implications
5. Conclusions
Author Contributions
Funding
Institutional Review Board Statement
Informed Consent Statement
Data Availability Statement
Conflicts of Interest
References
- Roth, G.A.; Mensah, G.A.; Johnson, C.O.; Addolorato, G.; Ammirati, E.; Baddour, L.M.; Barengo, N.C.; Beaton, A.Z.; Benjamin, E.J.; Benziger, C.P.; et al. Global Burden of Cardiovascular Diseases and Risk Factors, 1990–2019: Update from the GBD 2019 Study. J. Am. Coll. Cardiol. 2020, 76, 2982–3021. [Google Scholar] [CrossRef] [PubMed]
- World Health Organization. International Statistical Classification of Diseases and Related Health Problems: 10th Revision (ICD-10); 2016 Revision; World Health Organization: Geneva, Switzerland, 2015; p. 2131. ISBN 9789241549165.
- Chen, P.-F.; Wang, S.-M.; Liao, W.-C.; Kuo, L.-C.; Chen, K.-C.; Lin, Y.-C.; Yang, C.-Y.; Chiu, C.-H.; Chang, S.-C.; Lai, F. Automatic ICD-10 Coding and Training System: Deep Neural Network Based on Supervised Learning. JMIR Med. Inform. 2021, 9, e23230. [Google Scholar] [CrossRef] [PubMed]
- Sinsky, C.; Colligan, L.; Li, L.; Prgomet, M.; Reynolds, S.; Goeders, L.; Westbrook, J.; Tutty, M.; Blike, G. Allocation of physician time in ambulatory practice: A time and motion study in 4 specialties. Ann. Intern. Med. 2016, 165, 753–760. [Google Scholar] [CrossRef]
- U.S. Centers for Medicare & Medicaid Services. Medicare Fee-for-Service Payment Regulations. Available online: https://www.cms.gov/Regulations-and-Guidance/Regulations-and-Policies/Medicare-Fee-for-Service-Payment-Regulations (accessed on 15 April 2022).
- Liu, J.; Zhang, Z.; Razavian, N. Deep EHR: Chronic disease prediction using medical notes. In Proceedings of the 3rd Machine Learning for Healthcare Conference, Palo Alto, CA, USA, 17–18 August 2018; Volume 85, pp. 440–464. [Google Scholar]
- Du, Z.; Yang, Y.; Zheng, J.; Li, Q.; Lin, D.; Li, Y.; Fan, J.; Cheng, W.; Chen, X.-H.; Cai, Y. Accurate Prediction of Coronary Heart Disease for Patients with Hypertension from Electronic Health Records with Big Data and Machine-Learning Methods: Model Development and Performance Evaluation. JMIR Med. Inform. 2020, 8, e17257. [Google Scholar] [CrossRef]
- Van Vleck, T.T.; Chan, L.; Coca, S.G.; Craven, C.K.; Do, R.; Ellis, S.B.; Kannry, J.L.; Loos, R.J.F.; Bonis, P.A.; Cho, J.; et al. Augmented intelligence with natural language processing applied to electronic health records for identifying patients with non-alcoholic fatty liver disease at risk for disease progression. Int. J. Med. Inform. 2019, 129, 334–341. [Google Scholar] [CrossRef]
- Ashfaq, A.; Sant’Anna, A.; Lingman, M.; Nowaczyk, S. Readmission prediction using deep learning on electronic health records. J. Biomed. Inform. 2019, 97, 103256. [Google Scholar] [CrossRef]
- Ma, F.; Chitta, R.; Zhou, J.; You, Q.; Sun, T.; Gao, J. Dipole: Diagnosis Prediction in Healthcare via Attention-based Bidirectional Recurrent Neural Networks. In Proceedings of the 23rd ACM SIGKDD International Conference on Knowledge Discovery and Data Mining—KDD ’17, Halifax, NS, Canada, 13–17 August 2017; ACM Press: New York, NY, USA, 2017; pp. 1903–1911. [Google Scholar]
- Gao, J.; Wang, X.; Wang, Y.; Yang, Z.; Gao, J.; Wang, J.; Tang, W.; Xie, X. CAMP: Co-Attention Memory Networks for Diagnosis Prediction in Healthcare. In Proceedings of the 2019 IEEE International Conference on Data Mining (ICDM), Beijing, China, 8–11 November 2019; pp. 1036–1041. [Google Scholar]
- Nancy, A.M.; Maheswari, R. A review on unstructured data in medical data. J. Crit. Rev. 2020, 7, 2202–2208. [Google Scholar]
- Xiao, C.; Choi, E.; Sun, J. Opportunities and challenges in developing deep learning models using electronic health records data: A systematic review. J. Am. Med. Inform. Assoc. 2018, 25, 1419–1428. [Google Scholar] [CrossRef]
- Vaswani, A.; Shazeer, N.; Parmar, N. Attention is all you need. In Proceedings of the Advances in Neural Information Processing Systems (NIPS 2017), Long Beach, CA, USA, 4–9 December 2017; Volume 30. [Google Scholar]
- Devlin, J.; Chang, M.-W.; Lee, K.; Toutanova, K. BERT: Pre-training of Deep Bidirectional Transformers for Language Understanding. arXiv 2018, arXiv:1810.04805. [Google Scholar] [CrossRef]
- Liu, Y.; Ott, M.; Goyal, N.; Du, J.; Joshi, M.; Chen, D.; Levy, O.; Lewis, M.; Zettlemoyer, L.; Stoyanov, V. RoBERTa: A Robustly Optimized BERT Pretraining Approach. arXiv 2019, arXiv:1907.11692. [Google Scholar] [CrossRef]
- Floridi, L.; Chiriatti, M. GPT-3: Its Nature, Scope, Limits, and Consequences. Minds Mach. 2020, 30, 681–694. [Google Scholar] [CrossRef]
- Johnson, A.E.W.; Pollard, T.J.; Shen, L.; Lehman, L.-W.H.; Feng, M.; Ghassemi, M.; Moody, B.; Szolovits, P.; Celi, L.A.; Mark, R.G. MIMIC-III, a Freely Accessible Critical Care Database. Sci. Data 2016, 3, 160035. [Google Scholar] [CrossRef] [Green Version]
- Johnson, A.; Bulgarelli, L.; Pollard, T.; Celi, L.A.; Mark, R.; Horng, S. MIMIC-IV-ED. PhysioNet 2021. [Google Scholar] [CrossRef]
- European Parliament. Regulation (EU) 2016/679 of the European Parliament and of the Council of 27 April 2016 on the Protection of Natural Persons with Regard to the Processing of Personal Data and on the Free Movement of Such Data, and Repealing Directive 95/46/EC (General Data Protection Regulation); European Parliament: Strasbourg, France, 2016. [Google Scholar]
- Rybak, P.; Mroczkowski, R.; Tracz, J.; Gawlik, I. KLEJ: Comprehensive Benchmark for Polish Language Understanding. arXiv 2020, arXiv:2005.00630. [Google Scholar] [CrossRef]
- Mroczkowski, R.; Rybak, P.; Wróblewska, A.; Gawlik, I. HerBERT: Efficiently Pretrained Transformer-based Language Model for Polish. arXiv 2021, arXiv:2105.0173. [Google Scholar] [CrossRef]
- Dadas, S.; Perełkiewicz, M.; Poświata, R. Pre-training Polish Transformer-Based Language Models at Scale. In Proceedings of the Artificial Intelligence and Soft Computing: 19th International Conference, ICAISC 2020, Part II, Zakopane, Poland, 12–14 October 2020; Rutkowski, L., Scherer, R., Korytkowski, M., Pedrycz, W., Tadeusiewicz, R., Zurada, J.M., Eds.; Lecture Notes in Computer Science; Springer International Publishing: Cham, Switzerland, 2020; Volume 12416, pp. 301–314. ISBN 978-3-030-61533-8. [Google Scholar]
- Conneau, A.; Khandelwal, K.; Goyal, N.; Chaudhary, V.; Wenzek, G.; Guzmán, F.; Grave, E.; Ott, M.; Zettlemoyer, L.; Stoyanov, V. Unsupervised Cross-lingual Representation Learning at Scale. arXiv 2019, arXiv:1911.02116. [Google Scholar] [CrossRef]
- Kim, E.; Rubinstein, S.M.; Nead, K.T.; Wojcieszynski, A.P.; Gabriel, P.E.; Warner, J.L. The evolving use of electronic health records (EHR) for research. Semin. Radiat. Oncol. 2019, 29, 354–361. [Google Scholar] [CrossRef]
- Virani, S.S.; Alonso, A.; Aparicio, H.J.; Benjamin, E.J.; Bittencourt, M.S.; Callaway, C.W.; Carson, A.P.; Chamberlain, A.M.; Cheng, S.; Delling, F.N.; et al. Heart Disease and Stroke Statistics—2021 Update: A Report From the American Heart Association. Circulation 2021, 143, e254–e743. [Google Scholar] [CrossRef]
- Timmis, A.; Vardas, P.; Townsend, N.; Torbica, A.; Katus, H.; De Smedt, D.; Gale, C.P.; Maggioni, A.P.; Petersen, S.E.; Huculeci, R.; et al. European Society of Cardiology: Cardiovascular disease statistics 2021. Eur. Heart J. 2022, 43, 716–799. [Google Scholar] [CrossRef]
- Heusch, G. Myocardial ischemia: Lack of coronary blood flow, myocardial oxygen supply-demand imbalance, or what? Am. J. Physiol. Heart Circ. Physiol. 2019, 316, H1439–H1446. [Google Scholar] [CrossRef]
- Knuuti, J.; Wijns, W.; Saraste, A.; Capodanno, D.; Barbato, E.; Funck-Brentano, C.; Prescott, E.; Storey, R.F.; Deaton, C.; Cuisset, T.; et al. 2019 ESC Guidelines for the diagnosis and management of chronic coronary syndromes. Eur. Heart J. 2020, 41, 407–477. [Google Scholar] [CrossRef]
- Writing Committee Members; Lawton, J.S.; Tamis-Holland, J.E.; Bangalore, S.; Bates, E.R.; Beckie, T.M.; Bischoff, J.M.; Bittl, J.A.; Cohen, M.G.; DiMaio, J.M.; et al. 2021 ACC/AHA/SCAI guideline for coronary artery revascularization: A report of the american college of cardiology/american heart association joint committee on clinical practice guidelines. J. Am. Coll. Cardiol. 2022, 79, e21–e129. [Google Scholar] [CrossRef]
- Conrad, N.; Judge, A.; Tran, J.; Mohseni, H.; Hedgecott, D.; Crespillo, A.P.; Allison, M.; Hemingway, H.; Cleland, J.G.; McMurray, J.J.V.; et al. Temporal trends and patterns in heart failure incidence: A population-based study of 4 million individuals. Lancet 2018, 391, 572–580. [Google Scholar] [CrossRef] [Green Version]
- Smeets, M.; Vaes, B.; Mamouris, P.; Van Den Akker, M.; Van Pottelbergh, G.; Goderis, G.; Janssens, S.; Aertgeerts, B.; Henrard, S. Burden of heart failure in Flemish general practices: A registry-based study in the Intego database. BMJ Open 2019, 9, e022972. [Google Scholar] [CrossRef]
- Virani, S.S.; Alonso, A.; Benjamin, E.J.; Bittencourt, M.S.; Callaway, C.W.; Carson, A.P.; Chamberlain, A.M.; Chang, A.R.; Cheng, S.; Delling, F.N.; et al. Heart Disease and Stroke Statistics—2020 Update: A Report From the American Heart Association. Circulation 2020, 141, e139–e596. [Google Scholar] [CrossRef]
- McDonagh, T.A.; Metra, M.; Adamo, M.; Gardner, R.S.; Baumbach, A.; Böhm, M.; Burri, H.; Butler, J.; Čelutkienė, J.; Chioncel, O.; et al. 2021 ESC Guidelines for the diagnosis and treatment of acute and chronic heart failure. Eur. Heart J. 2021, 42, 3599–3726. [Google Scholar] [CrossRef]
- Heidenreich, P.A.; Bozkurt, B.; Aguilar, D.; Allen, L.A.; Byun, J.J.; Colvin, M.M.; Deswal, A.; Drazner, M.H.; Dunlay, S.M.; Evers, L.R.; et al. 2022 AHA/ACC/HFSA Guideline for the Management of Heart Failure: A Report of the American College of Cardiology/American Heart Association Joint Committee on Clinical Practice Guidelines. J. Am. Coll. Cardiol. 2022, 79, e263–e421. [Google Scholar] [CrossRef]
- Hindricks, G.; Potpara, T.; Dagres, N.; Arbelo, E.; Bax, J.J.; Blomström-Lundqvist, C.; Boriani, G.; Castella, M.; Dan, G.-A.; Dilaveris, P.E.; et al. 2020 ESC Guidelines for the diagnosis and management of atrial fibrillation developed in collaboration with the European Association for Cardio-Thoracic Surgery (EACTS): The Task Force for the diagnosis and management of atrial fibrillation of the European Society of Cardiology (ESC) Developed with the special contribution of the European Heart Rhythm Association (EHRA) of the ESC. Eur. Heart J. 2021, 42, 373–498. [Google Scholar] [CrossRef]
- Mulder, B.A.; Rienstra, M.; Van Gelder, I.C.; Blaauw, Y. Update on management of atrial fibrillation in heart failure: A focus on ablation. Heart 2022, 108, 422–428. [Google Scholar] [CrossRef] [PubMed]
- Kong, H.-J. Managing unstructured big data in healthcare system. Healthc. Inform. Res. 2019, 25, 1–2. [Google Scholar] [CrossRef]
- Reading Turchioe, M.; Volodarskiy, A.; Pathak, J.; Wright, D.N.; Tcheng, J.E.; Slotwiner, D. Systematic review of current natural language processing methods and applications in cardiology. Heart 2021. [Google Scholar] [CrossRef] [PubMed]
- Chang, T.E.; Lichtman, J.H.; Goldstein, L.B.; George, M.G. Accuracy of ICD-9-CM Codes by Hospital Characteristics and Stroke Severity: Paul Coverdell National Acute Stroke Program. J. Am. Heart Assoc. 2016, 5, e003056. [Google Scholar] [CrossRef] [PubMed] [Green Version]
- McCarthy, C.; Murphy, S.; Cohen, J.A.; Rehman, S.; Jones-O’Connor, M.; Olshan, D.S.; Singh, A.; Vaduganathan, M.; Januzzi, J.L.; Wasfy, J.H. Misclassification of Myocardial Injury as Myocardial Infarction: Implications for Assessing Outcomes in Value-Based Programs. JAMA Cardiol. 2019, 4, 460–464. [Google Scholar] [CrossRef] [PubMed] [Green Version]
- Kim, H.N.; Gupta, A.; Lan, K.; Stewart, J.; Dhanireddy, S.; Corcorran, M.A. Diagnostic accuracy of ICD code versus discharge summary-based query for endocarditis cohort identification. Medicine 2021, 100, e28354. [Google Scholar] [CrossRef]
- Horsky, J.; Drucker, E.A.; Ramelson, H.Z. Accuracy and Completeness of Clinical Coding Using ICD-10 for Ambulatory Visits. AMIA Annu. Symp. Proc. 2017, 2017, 912–920. [Google Scholar]
- Alonso, V.; Santos, J.V.; Pinto, M.; Ferreira, J.; Lema, I.; Lopes, F.; Freitas, A. Problems and Barriers during the Process of Clinical Coding: A Focus Group Study of Coders’ Perceptions. J. Med. Syst. 2020, 44, 62. [Google Scholar] [CrossRef]
- Miotto, R.; Li, L.; Kidd, B.A.; Dudley, J.T. Deep Patient: An Unsupervised Representation to Predict the Future of Patients from the Electronic Health Records. Sci. Rep. 2016, 6, 26094. [Google Scholar] [CrossRef]
- Goldstein, B.A.; Navar, A.M.; Pencina, M.J.; Ioannidis, J.P.A. Opportunities and challenges in developing risk prediction models with electronic health records data: A systematic review. J. Am. Med. Inform. Assoc. 2017, 24, 198–208. [Google Scholar] [CrossRef] [Green Version]
- Osler, T.M.; Glance, L.G.; Cook, A.; Buzas, J.S.; Hosmer, D.W. A trauma mortality prediction model based on the ICD-10-CM lexicon: TMPM-ICD10. J. Trauma Acute Care Surg. 2019, 86, 891–895. [Google Scholar] [CrossRef]
- Mullenbach, J.; Wiegreffe, S.; Duke, J.; Sun, J.; Eisenstein, J. Explainable Prediction of Medical Codes from Clinical Text. arXiv 2018, arXiv:1802.05695. [Google Scholar] [CrossRef]
- Mahbub, M.; Srinivasan, S.; Danciu, I.; Peluso, A.; Begoli, E.; Tamang, S.; Peterson, G.D. Unstructured clinical notes within the 24 hours since admission predict short, mid & long-term mortality in adult ICU patients. PLoS ONE 2022, 17, e0262182. [Google Scholar] [CrossRef]
- Shah, A.D.; Bailey, E.; Williams, T.; Denaxas, S.; Dobson, R.; Hemingway, H. Natural language processing for disease phenotyping in UK primary care records for research: A pilot study in myocardial infarction and death. J. Biomed. Semant. 2019, 10, 20. [Google Scholar] [CrossRef]
- Moore, C.R.; Jain, S.; Haas, S.; Yadav, H.; Whitsel, E.; Rosamand, W.; Heiss, G.; Kucharska-Newton, A.M. Ascertaining Framingham heart failure phenotype from inpatient electronic health record data using natural language processing: A multicentre Atherosclerosis Risk in Communities (ARIC) validation study. BMJ Open 2021, 11, e047356. [Google Scholar] [CrossRef]
- Garvin, J.H.; Kim, Y.; Gobbel, G.T.; Matheny, M.E.; Redd, A.; Bray, B.E.; Heidenreich, P.; Bolton, D.; Heavirland, J.; Kelly, N.; et al. Automating quality measures for heart failure using natural language processing: A descriptive study in the department of veterans affairs. JMIR Med. Inform. 2018, 6, e5. [Google Scholar] [CrossRef]
- Bielinski, S.J.; Pathak, J.; Carrell, D.S.; Takahashi, P.Y.; Olson, J.E.; Larson, N.B.; Liu, H.; Sohn, S.; Wells, Q.S.; Denny, J.C.; et al. A Robust e-Epidemiology Tool in Phenotyping Heart Failure with Differentiation for Preserved and Reduced Ejection Fraction: The Electronic Medical Records and Genomics (eMERGE) Network. J. Cardiovasc. Transl. Res. 2015, 8, 475–483. [Google Scholar] [CrossRef] [Green Version]
- Shah, S.J.; Katz, D.H.; Selvaraj, S.; Burke, M.A.; Yancy, C.W.; Gheorghiade, M.; Bonow, R.O.; Huang, C.-C.; Deo, R.C. Phenomapping for novel classification of heart failure with preserved ejection fraction. Circulation 2015, 131, 269–279. [Google Scholar] [CrossRef] [Green Version]
- Somani, S.; Yoffie, S.; Teng, S.; Havaldar, S.; Nadkarni, G.N.; Zhao, S.; Glicksberg, B.S. Development and validation of techniques for phenotyping ST-elevation myocardial infarction encounters from electronic health records. JAMIA Open 2021, 4, ooab068. [Google Scholar] [CrossRef]
- Watzlaf, V.J.M.; Garvin, J.H.; Moeini, S.; Anania-Firouzan, P. The effectiveness of ICD-10-CM in capturing public health diseases. Perspect. Health Inf. Manag. 2007, 4, 6. [Google Scholar]
- Gąsior, M.; Pres, D.; Wojakowski, W.; Buszman, P.; Kalarus, Z.; Hawranek, M.; Gierlotka, M.; Lekston, A.; Mizia-Stec, K.; Zembala, M.; et al. Causes of hospitalization and prognosis in patients with cardiovascular diseases. Secular trends in the years 2006–2014 according to the SILesian CARDiovascular (SILCARD) database. Pol. Arch. Med. Wewn. 2016, 126, 754–762. [Google Scholar] [CrossRef]
- Faryan, M.; Buchta, P.; Kowalski, O.; Wybraniec, M.T.; Cieśla, D.; Myrda, K.; Wnuk-Wojnar, A.; Kalarus, Z.; Gąsior, M.; Mizia-Stec, K. Temporal trends in the availability and efficacy of catheter ablation for atrial fibrillation and atrial flutter in a highly populated urban area. Kardiol. Pol. 2020, 78, 537–544. [Google Scholar] [CrossRef] [Green Version]
- Myrda, K.; Streb, W.; Wojakowski, W.; Piegza, J.; Mitręga, K.; Smolka, G.; Nowak, J.; Podolecki, T.; Gasiewska-Żurek, E.; Nowowiejska-Wiewióra, A.; et al. Long-term outcomes in patients after left atrial appendage occlusion: The results from the LAAO SILESIA registry. Kardiol. Pol. 2022, 80, 332–338. [Google Scholar] [CrossRef] [PubMed]
- Wilczek, K.; Hawranek, M.; Wojakowski, W.; Chodór, P.; Zembala, M.; Buszman, P.; Bochenek, A.; Deja, M.; Dyrbus, M.; Ciesla, D.; et al. Transcatheter Versus Surgical Valve Replacement: A 24-months Propensity-matched Analysis of the SILCARD Registry. Anatol. J. Cardiol. 2022, 26, 172–179. [Google Scholar] [CrossRef] [PubMed]
- Pres, D.; Niedziela, J.; Kurek, A.; Gołba, K.; Mizia-Stec, K.; Gąsior, Z.; Nowalany-Kozielska, E.; Wojakowski, W.; Tajstra, M.; Gierlotka, M.; et al. In-hospital and long-term prognosis in patients after implantation of implantable cardioverter-defibrillators and cardiac resynchronization therapy: 10-year results of the SILCARD registry. Pol. Arch. Intern. Med. 2018, 128, 580–586. [Google Scholar] [CrossRef] [PubMed] [Green Version]
- Han, S.; Zhang, R.F.; Shi, L.; Richie, R.; Liu, H.; Tseng, A.; Quan, W.; Ryan, N.; Brent, D.; Tsui, F.R. Classifying social determinants of health from unstructured electronic health records using deep learning-based natural language processing. J. Biomed. Inform. 2022, 127, 103984. [Google Scholar] [CrossRef]
- Hatef, E.; Rouhizadeh, M.; Nau, C.; Xie, F.; Rouillard, C.; Abu-Nasser, M.; Padilla, A.; Lyons, L.J.; Kharrazi, H.; Weiner, J.P.; et al. Development and assessment of a natural language processing model to identify residential instability in electronic health records’ unstructured data: A comparison of 3 integrated healthcare delivery systems. JAMIA Open 2022, 5, ooac006. [Google Scholar] [CrossRef]
- Patra, B.G.; Sharma, M.M.; Vekaria, V.; Adekkanattu, P.; Patterson, O.V.; Glicksberg, B.; Lepow, L.A.; Ryu, E.; Biernacka, J.M.; Furmanchuk, A.; et al. Extracting social determinants of health from electronic health records using natural language processing: A systematic review. J. Am. Med. Inform. Assoc. 2021, 28, 2716–2727. [Google Scholar] [CrossRef]
- Lazakidou, A.A. Handbook of Research on Informatics in Healthcare and Biomedicine, 1st ed.; IGI Global: Hershey, PA, USA, 2006; p. 240. ISBN 1591409837. [Google Scholar]
- Wang, Y.; Wang, L.; Rastegar-Mojarad, M.; Moon, S.; Shen, F.; Afzal, N.; Liu, S.; Zeng, Y.; Mehrabi, S.; Sohn, S.; et al. Clinical information extraction applications: A literature review. J. Biomed. Inform. 2018, 77, 34–49. [Google Scholar] [CrossRef]


| Average word count per record | 472 |
| Average word counts per sections | 132; 249; 86; 64 |
| Records | 50,465 |
| Sentences | 2,583,087 |
| Words | 23,831,785 |
| Tokens | 34,315,153 |
| Section 1 (Admission) | Pacjent przyjęty w ramach ostrego dyżuru z powodu zawału mięśnia sercowego ściany dolnej. Spoczynkowe dolegliwości wieńcowe od 29.03. 17:00, w dniu dzisiejszym, w godzinach porannych zgłasił sie do poradni, gdzie rozpoznano zawał. Czynniki ryzyka choroby wieńcowej: Hypercholesterolemia i nadcisnienie leczone skutecznie. Nigdy nie palił. Cukrzycę neguje, ale przy przyjęciu cukier >200 mg% i dodatni wywiad rodzinny—matka chorowała. Skargi dodatkowe i choroby przebyte: Nie zgłasza. Na żółtaczkę nei chorował, nie szczepiony. Alergie i nietolerancje lekowe neguje. Wywiad rodzinny: Matka chorowała na cukrzycę. Bez wczesncyh powikłań miażdżycowych w rodzinie. |
| Section 2 (Physical) | Pacjent przytomny, ułożenie dowolne, kontakt logiczny zachowany. Budowa prawidłowa, nadwaga 170 cm, 90 kg. Skóra prawidłowo ucieplona, bez wykwitów patologicznych. Tkanka podskórna prawidłowo rozwinięta. Węzły chłonne niewyczuwalne. Głowa opukowo niebolesna. Gałki oczne osadzone prawidłowo, symetryczne. Źrenice równe, okrągłe, prawidłowo reagują na światło i nastawność. Nad płucami wypuk jawny, szmer oddechowy pęcherzykowy symetryczny. Drżenie głosowe zachowane. Akcja serca miarowa 80/min. Tony serca głuche, bez szmerów patologicznych. Brzuch miękki, palpacyjnie niebolesny, bez oporów patologicznych. Wątroba pod łukiem żebrowym. Śledziona, nerki niewyczuwalne. Objawy Chełmońskiego i Blumberga ujemne. Objaw Goldflama obustronnie ujemny. Perystaltyka słyszalna. Bez obrzęków obwodowych. Bez zmian żylakowatych. Tętno na tt. kończyn dolnych dobrze wyczuwalne. |
| Section 3 (Discharge) | Pacjent lat 68 przyjęty w ramach ostrego dyżuru z powodu zawału ściany dolnej mięśnia sercowego. Wykonano koronarografię, w której stwierdzono w prawej tętnicy wieńcowej w początkowym odcinku 99% zwężenie. Jednoczasowo wykonano skuteczny zabieg PCI PTW z implantacją stentu. W lewej tętnicy wieńcowej stwierdzono: pień bez zmian, LAD bez zmian, LCx zmiany przyścienne, OM1 dość szeroka i rozległa, medialnie krótka zmiana do 95%. Wskazany w 2-gi etap PCI w OM1. Przeprowadzono wewnatrzszpitalny etap rehabilitacji kardiologicznej. W badanich dodatkowych stwierdzono podwyższone wartości glikemii, rozpoczęto intensywną farmakoterapię (z insuliną). Pacjent wypisany do domu z zaleceniami jw. |
| Section 4 (Recommendations) | Vivacor 6,25 1-0-1 Enarenal 5 1-0-1 Polocard 75 mg 0-0-1 Zocor 20 mg 0-0-1 Ranigast 150 mg 0-0-1 Plavix 1-0-0 (optymalnie 12 miesięcy) Siofor 500 mg 1-1-0 Insulina wg. poziomu glukozy (ostatnie zapotrzebowanie: NovoMix 30: R-20j, W-19j) Normalizacja wagi ciała. Dieta cukrzycowa.Dalsze leczenie w Poradniach: lekarza rodzinnego, kardiologicznej, diabetologicznej (pilne). Pacjent za około 2 miesiące zostanie ponownie przyjęty celem wykonania 2-go etapu leczenia choroby wieńcowej (PCI OM)- konieczne skierowanie do Kliniki. Po zakończeniu leczenia interwencyjnego proponujemy rehabilitacje w warunkach sanatoryjnych. |
| ICD-10 diagnosis | I21.1 |
| ICD-10 Category | Medical Name | Count in Dataset |
|---|---|---|
| I25 | Chronic ischemic heart disease/chronic coronary syndrome | 17,973 (36.03%) |
| I20 | Unstable angina pectoris | 9741 (19.53%) |
| I21 | Acute myocardial infarction | 6262 (12.55%) |
| I50 | Heart failure | 3360 (6.74%) |
| I48 | Atrial fibrillation and flutter | 1678 (3.36%) |
| I35 | Nonrheumatic aortic valve disorders | 1511 (3.03%) |
| I10 | Essential hypertension | 1299 (2.60%) |
| I49 | Other cardiac arrhythmias | 881 (1.77%) |
| Z03 | Suspected condition not found | 804 (1.61%) |
| I34 | Nonrheumatic mitral valve disorders | 777 (1.56%) |
| Training Subset | Categories Included | Coverage |
|---|---|---|
| 4 + 1 | I25, I20, I21, I50, “other” | 74.8% |
| 6 + 1 | I25, I20, I21, I50, I48, I35, “other” | 81.2% |
| 9 + 1 | I25, I20, I21, I50, I48, I35, I10, I49, Z03, “other” | 87.2% |
| 12 + 1 | I25, I20, I21, I50, I48, I35, I10, I49, Z03, I34, Q21, I42, “other” | 91.0% |
| Training Dataset | Training/Testing Examples per Class | Accuracy (Admission Data) | Accuracy (Discharge Data) |
|---|---|---|---|
| 4 + 1 | 15,148/841 | 68.79% | 78.64% |
| 6 + 1 | 6773/376 | 67.71% | 77.00% |
| 9 + 1 | 3533/196 | 59.62% | 71.49% |
| 12 + 1 | 2458/136 | 56.49% | 69.21% |
| ICD-10 Category | F1 Score | Frequently Confused with |
|---|---|---|
| I21 | 0.90 | other |
| I48 | 0.80 | other, I49 |
| I35 | 0.79 | other |
| I49 | 0.74 | I10, other, I48 |
| Z03 | 0.72 | I10 |
| I20 | 0.69 | I25 |
| I50 | 0.69 | other, I48, I35 |
| I10 | 0.63 | Z03, other |
| I25 | 0.56 | Z03, I20, I10 |
| other | 0.53 | I10, I50, I35 |
Publisher’s Note: MDPI stays neutral with regard to jurisdictional claims in published maps and institutional affiliations. |
© 2022 by the authors. Licensee MDPI, Basel, Switzerland. This article is an open access article distributed under the terms and conditions of the Creative Commons Attribution (CC BY) license (https://creativecommons.org/licenses/by/4.0/).
Share and Cite
Anetta, K.; Horak, A.; Wojakowski, W.; Wita, K.; Jadczyk, T. Deep Learning Analysis of Polish Electronic Health Records for Diagnosis Prediction in Patients with Cardiovascular Diseases. J. Pers. Med. 2022, 12, 869. https://doi.org/10.3390/jpm12060869
Anetta K, Horak A, Wojakowski W, Wita K, Jadczyk T. Deep Learning Analysis of Polish Electronic Health Records for Diagnosis Prediction in Patients with Cardiovascular Diseases. Journal of Personalized Medicine. 2022; 12(6):869. https://doi.org/10.3390/jpm12060869
Chicago/Turabian StyleAnetta, Kristof, Ales Horak, Wojciech Wojakowski, Krystian Wita, and Tomasz Jadczyk. 2022. "Deep Learning Analysis of Polish Electronic Health Records for Diagnosis Prediction in Patients with Cardiovascular Diseases" Journal of Personalized Medicine 12, no. 6: 869. https://doi.org/10.3390/jpm12060869
APA StyleAnetta, K., Horak, A., Wojakowski, W., Wita, K., & Jadczyk, T. (2022). Deep Learning Analysis of Polish Electronic Health Records for Diagnosis Prediction in Patients with Cardiovascular Diseases. Journal of Personalized Medicine, 12(6), 869. https://doi.org/10.3390/jpm12060869