
Redefining the Cut-Off Ranges for TSH Based on the Clinical Picture, Results of Neuroimaging and Laboratory Tests in Unsupervised Cluster Analysis as Individualized Diagnosis of Early Schizophrenia

 , ,
, ,  and
and
Abstract
1. Introduction
2. Materials and Methods
2.1. Participants of the Study
2.2. Research Procedures
- Positive symptoms: delusions (P1), hallucinatory behaviour (P3), grandiosity (P5), suspiciousness (P6), stereotyped thinking (N7), somatic concern (G1), unusual thought content (G9), lack of judgment and insight (G12);
- Negative symptoms: blunted affect (N1), emotional withdrawal (N2), poor rapport (N3), passive social withdrawal (N4), lack of spontaneity (N6), motor retardation (G7), active social avoidance (G16);
- Disorganized thoughts: difficulty in abstract thinking (N5), mannerisms and posturing (G5), disorientation (G10), poor attention (G11), disturbance of volition (G13), preoccupation (G15), conceptual disorganization (P2);
- Uncontrolled hostility/excitement: poor impulse control (G14), excitement (P4), hostility (P7), uncooperativeness (G8);
- Anxiety/depression: anxiety (G2), guilt feelings (G3), tension (G4), depression (G6) [47].
2.3. Description of Biochemical and Neuroimaging Analyses
2.3.1. Laboratory Analyses
2.3.2. Specialized Laboratory Analyses
Total Antioxidant Potential Expressed as FRAP in Blood and Saliva
Measurement of the Activity of Paraoxonase 1 (PON-1) in the Blood
Measurement of the Severity of Lipid Peroxidation by Assessing Blood Malondialdehyde (MDA)
2.3.3. MRI
- presentation of data in an easy-to-interpret form;
- assigning specific signals to specific metabolites;
- determination of absolute and relative concentrations of the metabolites.
- loading of appropriate raw data presented in the form of FID signal;
- data reconstruction (reconstruct-Probe Quant), which consists of noise reduction by applying filters and automatic Fourier transformation (conversion of a time-domain function to a frequency-domain function);
- offset correction—subtraction of the signal component that arose in the receiver as a result of the interaction of electronic circuits, while the FID signal disappeared to zero;
- zero filling—supplementing the digital form of the signal with additional data of zero amplitude in order to improve the resolution of the spectrum;
- apodization—signal multiplication by appropriate mathematical functions, which improves the signal-to-noise ratio;
- determination of peaks that were subject to further analysis;
- converting the spectrum with marked peaks into the FID signal (processing FID generate);
- Fourier transformation of the newly received FID signal;
- reading the value of the area of the fields under the selected peaks;
- superimposing the developed spectrum with the selected peaks on the original spectrum;
- calculation of relative ratios of metabolite concentrations in relation to Cr.
2.4. Statistical Analysis
3. Results
3.1. Relationship between the Functioning of the HPT Axis and the Analyzed Variables
3.2. Analysis of the Tested Parameters of Clinical and Laboratory Evaluation According to the Level of TSH
3.3. Analysis of the Relationship between the Functioning of the Thyroid Gland and Individual Variables
3.4. Cluster Analysis
4. Discussion
4.1. Linking the Level of Thyroid Hormones with the Course of Psychosis
4.2. Relationship of the Level of Thyroid Hormones with the Antipsychotic Drugs (including Partial D2-Agonist Effect) in the Course of Psychosis
4.3. Relationship of the Level of Thyroid Hormones with Depressive Symptoms in the Course of Psychosis
4.4. The Relationship of Thyroid Hormones with the Intensification of the Inflammatory Process
4.5. Relationship of Thyroid Hormones with the Results of Neuroimaging Studies
4.6. The Importance of Early Childhood Trauma
4.7. Limitations
5. Conclusions
Author Contributions
Funding
Institutional Review Board Statement
Informed Consent Statement
Data Availability Statement
Conflicts of Interest
References
- Lai, S.; Zhong, S.; Zhang, Y.; Wang, Y.; Zhao, H.; Chen, G.; Chen, F.; Shen, S.; Huang, H.; Jia, Y. Association of altered thyroid hormones and neurometabolism to cognitive dysfunction in unmedicated bipolar II depression. Prog. Neuropsychopharmacol. Biol. Psychiatry 2021, 105, 110027. [Google Scholar] [CrossRef] [PubMed]
- Noda, M. Possible role of glial cells in the relationship between thyroid dysfunction and mental disorders. Front. Cell. Neurosci. 2015, 9, 194. [Google Scholar] [CrossRef] [PubMed]
- Telo, S.; Bilgic, S.; Karabulut, N. Thyroid Hormone Levels in Chronic Schizophrenic Patients: Association with Psychopathology. West Indian Med. J. 2016, 65, 312–315. [Google Scholar] [PubMed]
- Ishihara, Y.; Sugawa, T.; Kaneko, H.; Hiroshima-Hamanaka, K.; Amano, A.; Umakoshi, H.; Tsuiki, M.; Kusakabe, T.; Satoh-Asahara, N.; Shimatsu, A.; et al. The Delayed Diagnosis of Thyroid Storm in Patients with Psychosis. Intern. Med. 2019, 58, 2195–2199. [Google Scholar] [CrossRef]
- Feldman, A.Z.; Shrestha, R.T.; Hennessey, J.V. Neuropsychiatric manifestations of thyroid disease. Endocrinol. Metab. Clin. N. Am. 2013, 42, 453–476. [Google Scholar] [CrossRef]
- Bahls, S.-C.; de Carvalho, G.A. The relation between thyroid function and depression: A review. Rev. Bras. Psiquiatr. 2004, 26, 41–49. [Google Scholar] [CrossRef][Green Version]
- Sharif, K.; Tiosano, S.; Watad, A.; Comaneshter, D.; Cohen, A.D.; Shoenfeld, Y.; Amital, H. The link between schizophrenia and hypothyroidism: A population-based study. Immunol. Res. 2018, 66, 663–667. [Google Scholar] [CrossRef]
- Ichioka, S.; Terao, T.; Hoaki, N.; Matsushita, T.; Hoaki, T. Triiodothyronine may be possibly associated with better cognitive function and less extrapyramidal symptoms in chronic schizophrenia. Prog. Neuropsychopharmacol. Biol. Psychiatry 2012, 39, 170–174. [Google Scholar] [CrossRef]
- Kalinowska, S.; Trześniowska-Drukała, B.; Safranow, K.; Pełka-Wysiecka, J.; Kłoda, K.; Misiak, B.; Samochowiec, J. Association between thyroid function and metabolic syndrome in male and female schizophrenia patients. Psychiatry Res. 2019, 274, 167–175. [Google Scholar] [CrossRef]
- Labad, J.; Barbero, J.D.; Gutiérrez-Zotes, A.; Montalvo, I.; Creus, M.; Cabezas, Á.; Solé, M.; Algora, M.J.; Garcia-Parés, G.; Vilella, E. Free thyroxine levels are associated with cognitive changes in individuals with a first episode of psychosis: A prospective 1-year follow-up study. Schizophr. Res. 2016, 171, 182–186. [Google Scholar] [CrossRef]
- Tandon, R.; Halbreich, U. The second-generation “atypical” antipsychotics: Similar improved efficacy but different neuroendocrine side effects. Psychoneuroendocrinology 2003, 28 (Suppl. 1), 1–7. [Google Scholar] [CrossRef]
- Barbero, J.D.; Palacín, A.; Serra, P.; Solé, M.; Ortega, L.; Cabezas, Á.; Montalvo, I.; Algora, M.J.; Martorell, L.; Vilella, E.; et al. Association between anti-thyroid antibodies and negative symptoms in early psychosis. Early Interv. Psychiatry 2020, 14, 470–475. [Google Scholar] [CrossRef]
- Wong, H.H.; Pang, N.T.P. Deliberate self-harm in a patient with hyperthyroidism with acute psychosis. BMJ Case Rep. 2021, 14, e242333. [Google Scholar] [CrossRef]
- Heuck, C.C.; Kallner, A.; Kanagasabapathy, A.S.; Riesen, W. World Health Organization Diagnosis and Monitoring of Diseases of the Thyroid; World Health Organization: Geneva, Switzerland, 2000. [Google Scholar]
- Biondi, B.; Cappola, A.R.; Cooper, D.S. Subclinical Hypothyroidism: A Review. JAMA 2019, 322, 153–160. [Google Scholar] [CrossRef]
- Baloch, Z.; Carayon, P.; Conte-Devolx, B.; Demers, L.M.; Feldt-Rasmussen, U.; Henry, J.-F.; LiVosli, V.A.; Niccoli-Sire, P.; John, R.; Ruf, J.; et al. Laboratory medicine practice guidelines. Laboratory support for the diagnosis and monitoring of thyroid disease. Thyroid 2003, 13, 3–126. [Google Scholar]
- Völzke, H.; Lüdemann, J.; Robinson, D.M.; Spieker, K.W.; Schwahn, C.; Kramer, A.; John, U.; Meng, W. The prevalence of undiagnosed thyroid disorders in a previously iodine-deficient area. Thyroid 2003, 13, 803–810. [Google Scholar] [CrossRef]
- Wartofsky, L.; Dickey, R.A. The evidence for a narrower thyrotropin reference range is compelling. J. Clin. Endocrinol. Metab. 2005, 90, 5483–5488. [Google Scholar] [CrossRef]
- Säljö, K.; Thornell, A.; Jin, C.; Stålberg, P.; Norlén, O.; Teneberg, S. Characterization of Glycosphingolipids in the Human Parathyroid and Thyroid Glands. Int. J. Mol. Sci. 2021, 22, 7044. [Google Scholar] [CrossRef]
- Varese, F.; Smeets, F.; Drukker, M.; Lieverse, R.; Lataster, T.; Viechtbauer, W.; Read, J.; van Os, J.; Bentall, R.P. Childhood adversities increase the risk of psychosis: A meta-analysis of patient-control, prospective- and cross-sectional cohort studies. Schizophr. Bull. 2012, 38, 661–671. [Google Scholar] [CrossRef]
- Duhig, M.; Patterson, S.; Connell, M.; Foley, S.; Capra, C.; Dark, F.; Gordon, A.; Singh, S.; Hides, L.; McGrath, J.J.; et al. The prevalence and correlates of childhood trauma in patients with early psychosis. Aust. N. Z. J. Psychiatry 2015, 49, 651–659. [Google Scholar] [CrossRef]
- Lecomte, T.; Spidel, A.; Leclerc, C.; MacEwan, G.W.; Greaves, C.; Bentall, R.P. Predictors and profiles of treatment non-adherence and engagement in services problems in early psychosis. Schizophr. Res. 2008, 102, 295–302. [Google Scholar] [CrossRef] [PubMed]
- Read, J.; van Os, J.; Morrison, A.P.; Ross, C.A. Childhood trauma, psychosis and schizophrenia: A literature review with theoretical and clinical implications. Acta Psychiatr. Scand. 2005, 112, 330–350. [Google Scholar] [CrossRef] [PubMed]
- Stain, H.J.; Brønnick, K.; Hegelstad, W.T.V.; Joa, I.; Johannessen, J.O.; Langeveld, J.; Mawn, L.; Larsen, T.K. Impact of interpersonal trauma on the social functioning of adults with first-episode psychosis. Schizophr. Bull. 2014, 40, 1491–1498. [Google Scholar] [CrossRef] [PubMed]
- Uçok, A.; Bikmaz, S. The effects of childhood trauma in patients with first-episode schizophrenia. Acta Psychiatr. Scand. 2007, 116, 371–377. [Google Scholar] [CrossRef]
- van Nierop, M.; Viechtbauer, W.; Gunther, N.; van Zelst, C.; de Graaf, R.; Ten Have, M.; van Dorsselaer, S.; Bak, M.; van Winkel, R. Childhood trauma is associated with a specific admixture of affective, anxiety, and psychosis symptoms cutting across traditional diagnostic boundaries. Psychol. Med. 2015, 45, 1277–1288. [Google Scholar] [CrossRef]
- Hellstrom, I.C.; Dhir, S.K.; Diorio, J.C.; Meaney, M.J. Maternal licking regulates hippocampal glucocorticoid receptor transcription through a thyroid hormone-serotonin-NGFI-A signalling cascade. Philos. Trans. R. Soc. Lond. Ser. B Biol. Sci. 2012, 367, 2495–2510. [Google Scholar] [CrossRef]
- Machado, T.D.; Salum, G.A.; Bosa, V.L.; Goldani, M.Z.; Meaney, M.J.; Agranonik, M.; Manfro, G.G.; Silveira, P.P. Early life trauma is associated with decreased peripheral levels of thyroid-hormone T3 in adolescents. Int. J. Dev. Neurosci. Off. J. Int. Soc. Dev. Neurosci. 2015, 47, 304–308. [Google Scholar] [CrossRef]
- World Health Organization. International Statistical Classification of Diseases and Related Health Problems; World Health Organization: Geneva, Switzerland, 2010. [Google Scholar]
- Bryll, A.; Krzyściak, W.; Karcz, P.; Pilecki, M.; Śmierciak, N.; Szwajca, M.; Skalniak, A.; Popiela, T.J. Determinants of Schizophrenia Endophenotypes Based on Neuroimaging and Biochemical Parameters. Biomedicines 2021, 9, 374. [Google Scholar] [CrossRef]
- Hadjulis, M.; Margariti, M.; Lazaridou, M.; Angelidis, G.F.; Fotopoulos, V.; Markaki, L.; Koulouri, F. Clinical guidelines for the management of schizophrenia: Pharmacological and psychological interventions (III). Psychiatrike 2018, 29, 303–315. [Google Scholar] [CrossRef]
- Taylor, D.; Paton, C.; Paton, C. The Maudsley Prescribing Guidelines, 10th ed.; CRC Press: Boca Raton, FL, USA, 2009. [Google Scholar]
- Danivas, V.; Venkatasubramanian, G. Current perspectives on chlorpromazine equivalents: Comparing apples and oranges! Indian J. Psychiatry 2013, 55, 207–208. [Google Scholar]
- Fargason, R.; Birur, B. Switching antipsychotics: A guide to dose equivalents. Curr. Psychiatry 2021, 20, 13–14. [Google Scholar]
- Kay, S.R.; Fiszbein, A.; Opler, L.A. The positive and negative syndrome scale (PANSS) for schizophrenia. Schizophr. Bull. 1987, 13, 261–276. [Google Scholar] [CrossRef]
- Beck, A.T.; Steer, R.A.; Ball, R.; Ranieri, W. Comparison of Beck Depression Inventories -IA and -II in psychiatric outpatients. J. Pers. Assess. 1996, 67, 588–597. [Google Scholar] [CrossRef]
- Addington, D.; Addington, J.; Maticka-Tyndale, E. Assessing depression in schizophrenia: The Calgary Depression Scale. Br. J. Psychiatry 1993, 163, 39–44. [Google Scholar] [CrossRef]
- Addington, D.; Addington, J.; Maticka-Tyndale, E.; Joyce, J. Reliability and validity of a depression rating scale for schizophrenics. Schizophr. Res. 1992, 6, 201–208. [Google Scholar] [CrossRef]
- Bernstein, D.P.; Ahluvalia, T.; Pogge, D.; Handelsman, L. Validity of the Childhood Trauma Questionnaire in an adolescent psychiatric population. J. Am. Acad. Child Adolesc. Psychiatry 1997, 36, 340–348. [Google Scholar] [CrossRef]
- Bernstein, D.P.; Fink, L.; Handelsman, L.; Foote, J.; Lovejoy, M.; Wenzel, K.; Sapareto, E.; Ruggiero, J. Initial reliability and validity of a new retrospective measure of child abuse and neglect. Am. J. Psychiatry 1994, 151, 1132–1136. [Google Scholar]
- Eckerson, H.W.; Romson, J.; Wyte, C.; La Du, B.N. The human serum paraoxonase polymorphism: Identification of phenotypes by their response to salts. Am. J. Hum. Genet. 1983, 35, 214–227. [Google Scholar]
- Aust, S. Thiobarbituric acid assay reactants. In Methods in Toxicology. In Vitro Toxicity Indicators; Tyson, C., Frazier, J., Eds.; Academic Press: San Diego, CA, SUA, 1994; pp. 367–376. [Google Scholar]
- Szczeklik, K.; Krzyściak, W.; Cibor, D.; Domagała-Rodacka, R.; Pytko-Polończyk, J.; Mach, T.; Owczarek, D. Markers of lipid peroxidation and antioxidant status in the serum and saliva of patients with active Crohn disease. Polish Arch. Intern. Med. 2018, 128, 362–370. [Google Scholar]
- Benzie, I.F.; Strain, J.J. The ferric reducing ability of plasma (FRAP) as a measure of “antioxidant power”: The FRAP assay. Anal. Biochem. 1996, 239, 70–76. [Google Scholar] [CrossRef]
- Lançon, C.; Auquier, P.; Nayt, G.; Reine, G. Stability of the five-factor structure of the Positive and Negative Syndrome Scale (PANSS). Schizophr. Res. 2000, 42, 231–239. [Google Scholar] [CrossRef]
- Lindenmayer, J.P.; Bernstein-Hyman, R.; Grochowski, S. A new five factor model of schizophrenia. Psychiatr. Q. 1994, 65, 299–322. [Google Scholar] [CrossRef]
- Marder, S.R.; Davis, J.M.; Chouinard, G. The effects of risperidone on the five dimensions of schizophrenia derived by factor analysis: Combined results of the North American trials. J. Clin. Psychiatry 1997, 58, 538–546. [Google Scholar] [CrossRef]
- Wallwork, R.S.; Fortgang, R.; Hashimoto, R.; Weinberger, D.R.; Dickinson, D. Searching for a consensus five-factor model of the Positive and Negative Syndrome Scale for schizophrenia. Schizophr. Res. 2012, 137, 246–250. [Google Scholar] [CrossRef]
- Łojek, E.; Stańczak, J. Inwentarz Depresji Becka–Drugie Wydanie [Beck Depression Inventory–Second Edition; BDI-II], 2nd ed.; Pracownia Testów Psychologicznych: Warszawa, Poland, 2019. [Google Scholar]
- Addington, D.; Addington, J.; Maticka-Tyndale, E. Specificity of the Calgary Depression Scale for schizophrenics. Schizophr. Res. 1994, 11, 239–244. [Google Scholar] [CrossRef]
- Szwajca, K. The Conditionings of Transgenerational Transmission of Trauma in Offspring of Holocaust Survivors. Ph.D. Thesis, Collegium Medicum, Jagiellonian University, Kraków, Poland, 2009. [Google Scholar]
- Pereira, P. ISO 15189:2012; Medical Laboratories-Requirements for Quality and Competence. Westgard QC: Madison, WI, USA, 2020.
- Benzie, I.F.; Strain, J.J. Ferric reducing/antioxidant power assay: Direct measure of total antioxidant activity of biological fluids and modified version for simultaneous measurement of total antioxidant power and ascorbic acid concentration. Methods Enzymol. 1999, 299, 15–27. [Google Scholar]
- Bai, Z.-L.; Li, X.-S.; Chen, G.-Y.; Du, Y.; Wei, Z.-X.; Chen, X.; Zheng, G.-E.; Deng, W.; Cheng, Y. Serum Oxidative Stress Marker Levels in Unmedicated and Medicated Patients with Schizophrenia. J. Mol. Neurosci. 2018, 66, 428–436. [Google Scholar] [CrossRef]
- Gutteridge, J.M. Aspects to consider when detecting and measuring lipid peroxidation. Free Radic. Res. Commun. 1986, 1, 173–184. [Google Scholar] [CrossRef]
- Kathuria, A.; Lopez-lengowski, K.; Vater, M.; Mcphie, D.; Cohen, B.M. Transcriptome analysis and functional characterization of cerebral organoids in bipolar disorder. Genome Med. 2020, 12, 1–16. [Google Scholar] [CrossRef]
- Śmierciak, N.; Krzyściak, W.; Szwajca, M.; Szczęsny-Malysiak, E.; Kij, A.; Chłopicki, S.; Pilecki, M. Improvement in clinical symptoms in patients with the first episode of psychosis is associated with a decrease in systemic nitric oxide availability. A pilot study. Psychiatr. Pol. 2021, 55, 541–554. [Google Scholar] [CrossRef] [PubMed]
- Kim, S.-Y.; Cohen, B.M.; Chen, X.; Lukas, S.E.; Shinn, A.K.; Yuksel, A.C.; Li, T.; Du, F.; Öngür, D. Redox Dysregulation in Schizophrenia Revealed by in vivo NAD+/NADH Measurement. Schizophr. Bull. 2017, 43, 197–204. [Google Scholar] [CrossRef] [PubMed]
- Jackson-Koku, G. Beck Depression Inventory. Occup. Med. 2016, 66, 174–175. [Google Scholar] [CrossRef] [PubMed]
- Smarr, K.L.; Keefer, A.L. Measures of depression and depressive symptoms: Beck Depression Inventory-II (BDI-II), Center for Epidemiologic Studies Depression Scale (CES-D), Geriatric Depression Scale (GDS), Hospital Anxiety and Depression Scale (HADS), and Patient Health Questionnaire-9 (PHQ-9). Arthritis Care Res. 2011, 63 (Suppl. 11), S454–S466. [Google Scholar]
- Misiak, B.; Stańczykiewicz, B.; Wiśniewski, M.; Bartoli, F.; Carra, G.; Cavaleri, D.; Samochowiec, J.; Jarosz, K.; Rosińczuk, J.; Frydecka, D. Thyroid hormones in persons with schizophrenia: A systematic review and meta-analysis. Prog. Neuropsychopharmacol. Biol. Psychiatry 2021, 111, 110402. [Google Scholar] [CrossRef]
- Petrikis, P.; Tigas, S.; Tzallas, A.T.; Archimandriti, D.T.; Skapinakis, P.; Mavreas, V. Prolactin levels in drug-naïve patients with schizophrenia and other psychotic disorders. Int. J. Psychiatry Clin. Pract. 2016, 20, 165–169. [Google Scholar] [CrossRef]
- Prange, A.J.J.; Loosen, P.T.; Wilson, I.C.; Meltzer, H.Y.; Fang, V.S. Behavioral and endocrine responses of schizophrenic patients to TRH (protirelin). Arch. Gen. Psychiatry 1979, 36, 1086–1093. [Google Scholar] [CrossRef]
- Zhu, Y.; Ji, H.; Tao, L.; Cai, Q.; Wang, F.; Ji, W.; Li, G.; Fang, Y. Functional Status of Hypothalamic-Pituitary-Thyroid and Hypothalamic-Pituitary-Adrenal Axes in Hospitalized Schizophrenics in Shanghai. Front. Psychiatry 2020, 11, 65. [Google Scholar] [CrossRef]
- Yazici, K.; Yazici, A.E.; Taneli, B. Different neuroendocrine profiles of remitted and nonremitted schizophrenic patients. Prog. Neuropsychopharmacol. Biol. Psychiatry 2002, 26, 579–584. [Google Scholar] [CrossRef]
- Trentin, A.G. Thyroid hormone and astrocyte morphogenesis. J. Endocrinol. 2006, 189, 189–197. [Google Scholar] [CrossRef]
- Mendes-de-Aguiar, C.B.N.; Alchini, R.; Decker, H.; Alvarez-Silva, M.; Tasca, C.I.; Trentin, A.G. Thyroid hormone increases astrocytic glutamate uptake and protects astrocytes and neurons against glutamate toxicity. J. Neurosci. Res. 2008, 86, 3117–3125. [Google Scholar] [CrossRef]
- Losi, G.; Garzon, G.; Puia, G. Nongenomic regulation of glutamatergic neurotransmission in hippocampus by thyroid hormones. Neuroscience 2008, 151, 155–163. [Google Scholar] [CrossRef]
- Hashimoto, H.; Walker, C.H.; Prange, A.J.J.; Mason, G.A. The effects of thyroid hormones on potassium-stimulated release of 3H-GABA by synaptosomes of rat cerebral cortex. Neuropsychopharmacol. Off. Publ. Am. Coll. Neuropsychopharmacol. 1991, 5, 49–54. [Google Scholar]
- Strawn, J.R.; Ekhator, N.N.; D’Souza, B.B.; Geracioti, T.D.J. Pituitary-thyroid state correlates with central dopaminergic and serotonergic activity in healthy humans. Neuropsychobiology 2004, 49, 84–87. [Google Scholar] [CrossRef]
- Dickerman, A.L.; Barnhill, J.W. Abnormal thyroid function tests in psychiatric patients: A red herring? Am. J. Psychiatry 2012, 169, 127–133. [Google Scholar] [CrossRef]
- Snyder, S.H. Dopamine receptor excess and mouse madness. Neuron 2006, 49, 484–485. [Google Scholar] [CrossRef][Green Version]
- Boesgaard, S.; Hagen, C.; Hangaard, J.; Andersen, A.N.; Eldrup, E. Effect of dopamine and a dopamine D-1 receptor agonist on pulsatile thyrotrophin secretion in normal women. Clin. Endocrinol. 1990, 32, 423–431. [Google Scholar] [CrossRef]
- Rao, M.L.; Gross, G.; Huber, G. Altered interrelationship of dopamine, prolactin, thyrotropin and thyroid hormone in schizophrenic patients. Eur. Arch. Psychiatry Neurol. Sci. 1984, 234, 8–12. [Google Scholar] [CrossRef]
- Geyer, M.A.; Vollenweider, F.X. Serotonin research: Contributions to understanding psychoses. Trends Pharmacol. Sci. 2008, 29, 445–453. [Google Scholar] [CrossRef]
- Koller, D.; Almenara, S.; Mejía, G.; Saiz-Rodríguez, M.; Zubiaur, P.; Román, M.; Ochoa, D.; Navares-Gómez, M.; Santos-Molina, E.; Pintos-Sánchez, E.; et al. Metabolic Effects of Aripiprazole and Olanzapine Multiple-Dose Treatment in a Randomised Crossover Clinical Trial in Healthy Volunteers: Association with Pharmacogenetics. Adv. Ther. 2021, 38, 1035–1054. [Google Scholar] [CrossRef]
- Ohta, H.; Inoue, S.; Hara, K.; Watanabe, A. TSH and PRL, side-effect markers in aripiprazole treatment: Adjunctive aripiprazole-induced thyrotropin oversuppression in a young man with schizophrenia. BMJ Case Rep. 2017, 2017, bcr-2017-220192. [Google Scholar] [CrossRef]
- Zenno, A.; Leschek, E. Quetiapine-Induced Central Hypothyroidism. J. Am. Acad. Child Adolesc. Psychiatry 2020, 59, 575–576. [Google Scholar] [CrossRef]
- Petty, R.G. Prolactin and antipsychotic medications: Mechanism of action. Schizophr. Res. 1999, 35, S67–S73. [Google Scholar] [CrossRef]
- Preda, A.; Shapiro, B.B. A safety evaluation of aripiprazole in the treatment of schizophrenia. Expert Opin. Drug Saf. 2020, 19, 1529–1538. [Google Scholar] [CrossRef]
- Bou Khalil, R.; Richa, S. Thyroid adverse effects of psychotropic drugs: A review. Clin. Neuropharmacol. 2011, 34, 248–255. [Google Scholar] [CrossRef]
- Iñiguez, C.; Tamayo, P.; Gómez, A.; Gayoso, M.J. Effects of perinatal administration of haloperidol on GH pituitary contents and serum levels during the first postnatal month. Neuroendocrinology 1995, 62, 308–312. [Google Scholar] [CrossRef]
- Inoue, A.; Seto, M.; Sugita, S.; Hide, I.; Hirose, T.; Koga, N.; Kikuchi, T.; Nakata, Y. Differential effects on D2 dopamine receptor and prolactin gene expression by haloperidol and aripiprazole in the rat pituitary. Brain Res. Mol. Brain Res. 1998, 55, 285–292. [Google Scholar] [CrossRef]
- Paunović, V.R.; Timotijević, I.; Marinković, D. Neuroleptic actions on the thyroid axis: Different effects of clozapine and haloperidol. Int. Clin. Psychopharmacol. 1991, 6, 133–139. [Google Scholar] [CrossRef] [PubMed]
- Vedal, T.S.J.; Steen, N.E.; Birkeland, K.I.; Dieset, I.; Reponen, E.J.; Laskemoen, J.F.; Rødevand, L.; Melle, I.; Andreassen, O.A.; Molden, E.; et al. Free thyroxine and thyroid-stimulating hormone in severe mental disorders: A naturalistic study with focus on antipsychotic medication. J. Psychiatr. Res. 2018, 106, 74–81. [Google Scholar] [CrossRef] [PubMed]
- Soria-Chacartegui, P.; Villapalos-García, G.; Zubiaur, P.; Abad-Santos, F.; Koller, D. Genetic Polymorphisms Associated With the Pharmacokinetics, Pharmacodynamics and Adverse Effects of Olanzapine, Aripiprazole and Risperidone. Front. Pharmacol. 2021, 12, 711940. [Google Scholar] [CrossRef] [PubMed]
- Nazou, M.; Parlapani, E.; Nazlidou, E.-I.; Athanasis, P.; Bozikas, V.P. Psychotic episode due to Hashimoto’s thyroiditis. Psychiatrike 2016, 27, 144–147. [Google Scholar] [CrossRef]
- Steiner, J.; Schiltz, K.; Stoecker, W.; Teegen, B.; Dobrowolny, H.; Meyer-Lotz, G.; Pennewitz, M.; Borucki, K.; Frodl, T.; Bernstein, H.-G. Association of thyroid peroxidase antibodies with anti-neuronal surface antibodies in health, depression and schizophrenia-Complementary linkage with somatic symptoms of major depression. Brain. Behav. Immun. 2020, 90, 47–54. [Google Scholar] [CrossRef]
- Coentre, R.; Talina, M.C.; Góis, C.; Figueira, M.L. Depressive symptoms and suicidal behavior after first-episode psychosis: A comprehensive systematic review. Psychiatry Res. 2017, 253, 240–248. [Google Scholar] [CrossRef]
- Forman-Hoffman, V.; Philibert, R.A. Lower TSH and higher T4 levels are associated with current depressive syndrome in young adults. Acta Psychiatr. Scand. 2006, 114, 132–139. [Google Scholar] [CrossRef]
- Kvetny, J.; Ellervik, C.; Bech, P. Is suppressed thyroid-stimulating hormone (TSH) associated with subclinical depression in the Danish General Suburban Population Study? Nord. J. Psychiatry 2015, 69, 282–286. [Google Scholar] [CrossRef]
- Frey, A.; Lampert, A.; Dietz, K.; Striebich, S.; Locher, C.; Fedorenko, O.; Möhle, R.; Gallinat, J.; Lang, F.; Lang, U.E. Thyrotropin serum concentrations in healthy volunteers are associated with depression-related personality traits. Neuropsychobiology 2007, 56, 123–126. [Google Scholar] [CrossRef]
- Medici, M.; Direk, N.; Visser, W.E.; Korevaar, T.I.M.; Hofman, A.; Visser, T.J.; Tiemeier, H.; Peeters, R.P. Thyroid function within the normal range and the risk of depression: A population-based cohort study. J. Clin. Endocrinol. Metab. 2014, 99, 1213–1219. [Google Scholar] [CrossRef]
- Blum, M.R.; Wijsman, L.W.; Virgini, V.S.; Bauer, D.C.; den Elzen, W.P.J.; Jukema, J.W.; Buckley, B.M.; de Craen, A.J.M.; Kearney, P.M.; Stott, D.J.; et al. Subclinical Thyroid Dysfunction and Depressive Symptoms among the Elderly: A Prospective Cohort Study. Neuroendocrinology 2016, 103, 291–299. [Google Scholar] [CrossRef]
- Oomen, H.A.; Schipperijn, A.J.; Drexhage, H.A. The prevalence of affective disorder and in particular of a rapid cycling of bipolar disorder in patients with abnormal thyroid function tests. Clin. Endocrinol. 1996, 45, 215–223. [Google Scholar] [CrossRef]
- Bauer, M.; Goetz, T.; Glenn, T.; Whybrow, P.C. The thyroid-brain interaction in thyroid disorders and mood disorders. J. Neuroendocrinol. 2008, 20, 1101–1114. [Google Scholar] [CrossRef]
- Bunevicius, R. Thyroid disorders in mental patients. Curr. Opin. Psychiatry 2009, 22, 391–395. [Google Scholar] [CrossRef]
- Duval, F. Thyroid Hormone Treatment of Mood Disorders. Curr. Treat. Options Psychiatry 2018, 5, 363–376. [Google Scholar] [CrossRef]
- Duval, F.; Mokrani, M.-C.; Erb, A.; Danila, V.; Gonzalez Lopera, F.; Jeanjean, L. Dopaminergic, Noradrenergic, Adrenal, and Thyroid Abnormalities in Psychotic and Affective Disorders. Front. Psychiatry 2020, 11, 533872. [Google Scholar] [CrossRef]
- Davis, M.C.; Horan, W.P.; Marder, S.R. Psychopharmacology of the negative symptoms: Current status and prospects for progress. Eur. Neuropsychopharmacol. J. Eur. Coll. Neuropsychopharmacol. 2014, 24, 788–799. [Google Scholar] [CrossRef]
- Howes, O.D.; McCutcheon, R. Inflammation and the neural diathesis-stress hypothesis of schizophrenia: A reconceptualization. Transl. Psychiatry 2017, 7, e1024-11. [Google Scholar] [CrossRef]
- Asevedo, E.; Rizzo, L.B.; Gadelha, A.; Mansur, R.B.; Ota, V.K.; Berberian, A.A.; Scarpato, B.S.; Teixeira, A.L.; Bressan, R.A.; Brietzke, E. Peripheral interleukin-2 level is associated with negative symptoms and cognitive performance in schizophrenia. Physiol. Behav. 2014, 129, 194–198. [Google Scholar] [CrossRef]
- Garcia-Rizo, C.; Fernandez-Egea, E.; Oliveira, C.; Justicia, A.; Bernardo, M.; Kirkpatrick, B. Inflammatory markers in antipsychotic-naïve patients with nonaffective psychosis and deficit vs. nondeficit features. Psychiatry Res. 2012, 198, 212–215. [Google Scholar] [CrossRef]
- Goldsmith, D.R.; Haroon, E.; Miller, A.H.; Addington, J.; Bearden, C.; Cadenhead, K.; Cannon, T.; Cornblatt, B.; Mathalon, D.; McGlashan, T.; et al. Association of baseline inflammatory markers and the development of negative symptoms in individuals at clinical high risk for psychosis. Brain. Behav. Immun. 2019, 76, 268–274. [Google Scholar] [CrossRef] [PubMed]
- Xiu, M.H.; Yang, G.G.; Tan, Y.L.; Chen, D.C.; Tan, S.P.; Wang, Z.R.; Yang, F.D.; Okusaga, O.; Soares, J.C.; Zhang, X.Y. Decreased interleukin-10 serum levels in first-episode drug-naïve schizophrenia: Relationship to psychopathology. Schizophr. Res. 2014, 156, 9–14. [Google Scholar] [CrossRef] [PubMed]
- van der Poll, T.; Romijn, J.A.; Wiersinga, W.M.; Sauerwein, H.P. Tumor necrosis factor: A putative mediator of the sick euthyroid syndrome in man. J. Clin. Endocrinol. Metab. 1990, 71, 1567–1572. [Google Scholar] [CrossRef] [PubMed]
- Corssmit, E.P.; Heyligenberg, R.; Endert, E.; Sauerwein, H.P.; Romijn, J.A. Acute effects of interferon-alpha administration on thyroid hormone metabolism in healthy men. J. Clin. Endocrinol. Metab. 1995, 80, 3140–3144. [Google Scholar]
- Jurczak, A.; Kościelniak, D.; Skalniak, A.; Papież, M.; Vyhouskaya, P.; Krzyściak, W. The role of the saliva antioxidant barrier to reactive oxygen species with regard to caries development. Redox Rep. 2017, 22, 524–533. [Google Scholar] [CrossRef]
- Khoury, R.; Nasrallah, H.A. Inflammatory biomarkers in individuals at clinical high risk for psychosis (CHR-P): State or trait? Schizophr. Res. 2018, 199, 31–38. [Google Scholar] [CrossRef]
- Benvenga, S.; Nordio, M.; Laganà, A.S.; Unfer, V. The Role of Inositol in Thyroid Physiology and in Subclinical Hypothyroidism Management. Front. Endocrinol. 2021, 12, 662582. [Google Scholar] [CrossRef]
- Fallahi, P.; Ferrari, S.M.; Elia, G.; Ragusa, F.; Paparo, S.R.; Caruso, C.; Guglielmi, G.; Antonelli, A. Myo-inositol in autoimmune thyroiditis, and hypothyroidism. Rev. Endocr. Metab. Disord. 2018, 19, 349–354. [Google Scholar] [CrossRef]
- Peluso, I.; Raguzzini, A. Salivary and Urinary Total Antioxidant Capacity as Biomarkers of Oxidative Stress in Humans. Patholog. Res. Int. 2016, 2016, 5480267. [Google Scholar] [CrossRef]
- Mahjoub, S.; Ghasempour, M.; Gharage, A.; Bijani, A.; Masrourroudsari, J. Comparison of total antioxidant capacity in saliva of children with severe early childhood caries and caries-free children. Caries Res. 2014, 48, 271–275. [Google Scholar] [CrossRef]
- Toczewska, J.; Maciejczyk, M.; Konopka, T.; Zalewska, A. Total Oxidant and Antioxidant Capacity of Gingival Crevicular Fluid and Saliva in Patients with Periodontitis: Review and Clinical Study. Antioxidants 2020, 9, 450. [Google Scholar] [CrossRef]
- Fraguas, D.; Díaz-Caneja, C.M.; Ayora, M.; Hernández-Álvarez, F.; Rodríguez-Quiroga, A.; Recio, S.; Leza, J.C.; Arango, C. Oxidative Stress and Inflammation in First-Episode Psychosis: A Systematic Review and Meta-analysis. Schizophr. Bull. 2019, 45, 742–751. [Google Scholar] [CrossRef]
- Kamodyová, N.; Tóthová, L.; Celec, P. Salivary markers of oxidative stress and antioxidant status: Influence of external factors. Dis. Markers 2013, 34, 313–321. [Google Scholar] [CrossRef]
- Cui, G.; Qing, Y.; Li, M.; Sun, L.; Zhang, J.; Feng, L.; Li, J.; Chen, T.; Wang, J.; Wan, C. Salivary Metabolomics Reveals that Metabolic Alterations Precede the Onset of Schizophrenia. J. Proteome Res. 2021, 20, 5010–5023. [Google Scholar] [CrossRef] [PubMed]
- Qing, Y.; Xu, L.; Cui, G.; Sun, L.; Hu, X.; Yang, X.; Jiang, J.; Zhang, J.; Zhang, T.; Wang, T.; et al. Salivary microbiome profiling reveals a dysbiotic schizophrenia-associated microbiota. NPJ Schizophr. 2021, 7, 51. [Google Scholar] [CrossRef] [PubMed]
- Seitz-Holland, J.; Cetin-Karayumak, S.; Wojcik, J.D.; Lyall, A.; Levitt, J.; Shenton, M.E.; Pasternak, O.; Westin, C.-F.; Baxi, M.; Kelly, S.; et al. Elucidating the relationship between white matter structure, demographic, and clinical variables in schizophrenia-a multicenter harmonized diffusion tensor imaging study. Mol. Psychiatry 2021, 26, 5357–5370. [Google Scholar] [CrossRef] [PubMed]
- Pae, C.-U.; Choe, B.-Y.; Joo, R.-H.; Lim, H.-K.; Kim, T.-S.; Yoo, S.-S.; Choi, B.-G.; Kim, J.-J.; Lee, S.-J.; Lee, C.; et al. Neuronal dysfunction of the frontal lobe in schizophrenia. Neuropsychobiology 2004, 50, 211–215. [Google Scholar] [CrossRef]
- Shergill, S.S.; Kanaan, R.A.; Chitnis, X.A.; O’Daly, O.; Jones, D.K.; Frangou, S.; Williams, S.C.R.; Howard, R.J.; Barker, G.J.; Murray, R.M.; et al. A diffusion tensor imaging study of fasciculi in schizophrenia. Am. J. Psychiatry 2007, 164, 467–473. [Google Scholar] [CrossRef]
- Das, T.K.; Dey, A.; Sabesan, P.; Javadzadeh, A.; Théberge, J.; Radua, J.; Palaniyappan, L. Putative Astroglial Dysfunction in Schizophrenia: A Meta-Analysis of (1)H-MRS Studies of Medial Prefrontal Myo-Inositol. Front. Psychiatry 2018, 9, 438. [Google Scholar] [CrossRef]
- Jeon, P.; Mackinley, M.; Théberge, J.; Palaniyappan, L. The trajectory of putative astroglial dysfunction in first episode schizophrenia: A longitudinal 7-Tesla MRS study. Sci. Rep. 2021, 11, 22333. [Google Scholar] [CrossRef]
- Bosworth, A.P.; Allen, N.J. The diverse actions of astrocytes during synaptic development. Curr. Opin. Neurobiol. 2017, 47, 38–43. [Google Scholar] [CrossRef]
- Notter, T. Astrocytes in schizophrenia. Brain Neurosci. Adv. 2021, 5, 23982128211009148. [Google Scholar] [CrossRef]
- Fornito, A.; Yücel, M.; Dean, B.; Wood, S.J.; Pantelis, C. Anatomical abnormalities of the anterior cingulate cortex in schizophrenia: Bridging the gap between neuroimaging and neuropathology. Schizophr. Bull. 2009, 35, 973–993. [Google Scholar] [CrossRef]
- Kierans, A.S.; Kirov, I.I.; Gonen, O.; Haemer, G.; Nisenbaum, E.; Babb, J.S.; Grossman, R.I.; Lui, Y.W. Myoinositol and glutamate complex neurometabolite abnormality after mild traumatic brain injury. Neurology 2014, 82, 521–528. [Google Scholar] [CrossRef]
- Geiszler, P.C.; Ugun-Klusek, A.; Lawler, K.; Pardon, M.-C.; Yuchun, D.; Bai, L.; Daykin, C.A.; Auer, D.P.; Bedford, L. Dynamic metabolic patterns tracking neurodegeneration and gliosis following 26S proteasome dysfunction in mouse forebrain neurons. Sci. Rep. 2018, 8, 4833. [Google Scholar] [CrossRef]
- Nordio, M.; Basciani, S. Myo-inositol plus selenium supplementation restores euthyroid state in Hashimoto’s patients with subclinical hypothyroidism. Eur. Rev. Med. Pharmacol. Sci. 2017, 21, 51–59. [Google Scholar]
- Xu, M.; Iwasaki, T.; Shimokawa, N.; Sajdel-Sulkowska, E.M.; Koibuchi, N. The effect of low dose lipopolysaccharide on thyroid hormone-regulated actin cytoskeleton modulation and type 2 iodothyronine deiodinase activity in astrocytes. Endocr. J. 2013, 60, 1221–1230. [Google Scholar] [CrossRef]
- Davis, P.J.; Leonard, J.L.; Davis, F.B. Mechanisms of nongenomic actions of thyroid hormone. Front. Neuroendocrinol. 2008, 29, 211–218. [Google Scholar] [CrossRef]
- Wang, C.; Aleksic, B.; Ozaki, N. Glia-related genes and their contribution to schizophrenia. Psychiatry Clin. Neurosci. 2015, 69, 448–461. [Google Scholar] [CrossRef]
- van Kesteren, C.F.M.G.; Gremmels, H.; de Witte, L.D.; Hol, E.M.; Van Gool, A.R.; Falkai, P.G.; Kahn, R.S.; Sommer, I.E.C. Immune involvement in the pathogenesis of schizophrenia: A meta-analysis on postmortem brain studies. Transl. Psychiatry 2017, 7, e1075. [Google Scholar] [CrossRef]
- Mawey, F.; Karimah, A.; Limoa, E.; Nazmuddin, M. Neuroinflammation in Schizophrenia. J. Psikiatri Surabaya 2021, 10, 1–5. [Google Scholar] [CrossRef]
- Chang, L.; Munsaka, S.M.; Kraft-Terry, S.; Ernst, T. Magnetic resonance spectroscopy to assess neuroinflammation and neuropathic pain. J. Neuroimmune Pharmacol. 2013, 8, 576–593. [Google Scholar] [CrossRef]
- Wang, S.; Mason, J. Elevations of serum T3 levels and their association with symptoms in World War II veterans with combat-related posttraumatic stress disorder: Replication of findings in Vietnam combat veterans. Psychosom. Med. 1999, 61, 131–138. [Google Scholar] [CrossRef]
- Mason, J.; Weizman, R.; Laor, N.; Wang, S.; Schujovitsky, A.; Abramovitz-Schneider, P.; Feiler, D.; Charney, D. Serum triiodothyronine elevation with posttraumatic stress disorder: A cross-cultural study. Biol. Psychiatry 1996, 39, 835–838. [Google Scholar] [CrossRef]
- Mason, J.; Southwick, S.; Yehuda, R.; Wang, S.; Riney, S.; Bremner, D.; Johnson, D.; Lubin, H.; Blake, D.; Zhou, G. Elevation of serum free triiodothyronine, total triiodothyronine, thyroxine-binding globulin, and total thyroxine levels in combat-related posttraumatic stress disorder. Arch. Gen. Psychiatry 1994, 51, 629–641. [Google Scholar] [CrossRef]
- Spaggiari, G.; Setti, M.; Tagliavini, S.; Roli, L.; De Santis, M.C.; Trenti, T.; Rochira, V.; Santi, D. The hypothalamic-pituitary-adrenal and -thyroid axes activation lasting one year after an earthquake swarm: Results from a big data analysis. J. Endocrinol. Invest. 2021, 44, 1501–1513. [Google Scholar] [CrossRef]
- Haviland, M.G.; Sonne, J.L.; Anderson, D.L.; Nelson, J.C.; Sheridan-Matney, C.; Nichols, J.G.; Carlton, E.I.; Murdoch, W.G.C. Thyroid hormone levels and psychological symptoms in sexually abused adolescent girls. Child Abuse Negl. 2006, 30, 589–598. [Google Scholar] [CrossRef]
- Sæther, S.G.; Rø, A.D.B.; Larsen, J.B.; Vaaler, A.; Kondziella, D.; Reitan, S.K. Biomarkers of Autoimmunity in Acute Psychiatric Disorders. J. Neuropsychiatry Clin. Neurosci. 2019, 31, 246–253. [Google Scholar] [CrossRef]
- Carlsson, A. The neurochemical circuitry of schizophrenia. Pharmacopsychiatry 2006, 39 (Suppl. 1), S10–S14. [Google Scholar] [CrossRef]
- Collier, D.A.; Li, T. The genetics of schizophrenia: Glutamate not dopamine? Eur. J. Pharmacol. 2003, 480, 177–184. [Google Scholar] [CrossRef] [PubMed]
- Wiens, S.C.; Trudeau, V.L. Thyroid hormone and gamma-aminobutyric acid (GABA) interactions in neuroendocrine systems. Comp. Biochem. Physiol. Part A Mol. Integr. Physiol. 2006, 144, 332–344. [Google Scholar] [CrossRef] [PubMed]
- Delitala, A.P.; Fanciulli, G.; Maioli, M.; Delitala, G. Subclinical hypothyroidism, lipid metabolism and cardiovascular disease. Eur. J. Intern. Med. 2017, 38, 17–24. [Google Scholar] [CrossRef] [PubMed]


| Method | Reference | Description |
|---|---|---|
| Clinical data | ||
| Clinical history | n/a | Duration of untreated psychosis (DUP), number of episodes (QE), age of onset (AE), course of the first episode (AF), number of hospitalizations (QH), hospitalization length (HL). |
| PANSS (Positive and Negative Syndrome Scale) | [35] | A tool for assessing the severity of schizophrenia symptoms. Thirty items rated on a scale from 1 (asymptomatic) to 7 (extremely symptomatic) considering five factors: positive symptoms (PANSS pos), negative symptoms (PANSS neg), disorganized thoughts (PANSS dis), uncontrolled hostility/excitement (PANSS exc), anxiety/depression (PANSS emo). |
| BDI-II (Beck Depression Inventory, second ed.) | [36] | The scale of severity of depressive symptoms used in psychiatrically diagnosed patients. Includes 21 factors scored from 0 to 63. Cut-off points: minimal depression (0–13), mild depression (14–19), moderate depression (20–28), severe depression (29–63). |
| CDSS (Calgary Depression Scale for Schizophrenia) | [37,38] | Tool for assessing depressive symptoms in people with schizophrenia, including 9 issues assessed from 0 to 3 (total: 0–27). An increase in the score means an increase in the severity of depressive symptoms. A score above 6 has an 82% specificity and 85% sensitivity for predicting the presence of a major depressive episode. |
| CTQ (Childhood Trauma Questionnaire) | [39,40] | Specifies information about the experience of trauma in childhood and adolescence. Five trauma types subscales: emotional abuse (CTQ-EA), physical abuse (CTQ-PA), sexual abuse (CTQ-SA), emotional neglect (CTQ-EN), physical neglect (CTQ-PN), and the total trauma (CTQ-Total) scale, which is the sum of the individual subscales. An increase in the score indicates an increased risk and severity of the experience of trauma. |
| Routine laboratory tests including markers of HPT axis function | ||
| Routine laboratory tests | n/a | Thyroid and HPT markers (TSH, FT3, FT4), inflammation markers (CRP, ESR), ionogram (K+, Na+, Mg2+), full blood count, metabolic parameters (glucose and lipid profile: TC, HDL, LDL, TG), renal function markers (creatinine, urea, eGFR), liver function markers (AST, ALT, GGTP). |
| Specialized tests (performed outside the standard test protocol) | ||
| Specialized laboratory tests | [41,42,43,44] | The total antioxidant potential expressed as FRAP in saliva and blood serum, serum malondialdehyde (MDA), serum paraoxonase 1 (PON-1). |
| Specialized neuroimaging studies | n/a | MRI of the brain (T1W, T2W, FLAIR, DWI, SWI sequences), 1H-MRS for the quantitative and qualitative evaluation of the spectrum of neurometabolites (i.e., myoinositol). |
| Pharmacotherapy | n/a | Drugs used converted into a chlorpromazine equivalent |
| Variable | TSH | FT4 | FT3 | |||
|---|---|---|---|---|---|---|
| rs | p | rs | p | rs | p | |
| DUP | 0.17 | 0.29 | 0.29 | 0.08 | −0.12 | 0.47 |
| Number of hospitalizations (QH) | −0.07 | 0.68 | 0.17 | 0.30 | −0.36 * | 0.03 |
| Age of onset (AE) | 0.09 | 0.59 | −0.25 | 0.13 | 0.21 | 0.21 |
| Number of episodes (QE) | 0 | 0.98 | 0.05 | 0.76 | 0 | 0.98 |
| Hospitalization length (HL) | −0.01 | 0.96 | 0.14 | 0.40 | −0.07 | 0.69 |
| PANSS pos_1 | −0.33 * | 0.04 | 0.02 | 0.91 | −0.14 | 0.39 |
| PANSS neg_1 | 0.05 | 0.74 | −0.19 | 0.25 | −0.39 * | 0.01 |
| PANSS dis_1 | −0.22 | 0.18 | 0.28 | 0.09 | 0.01 | 0.97 |
| PANSS exc_1 | 0.08 | 0.64 | 0.01 | 0.96 | −0.25 | 0.14 |
| PANSS emo_1 | 0.17 | 0.31 | −0.22 | 0.19 | 0.17 | 0.31 |
| PANSS pos_12 | 0.01 | 0.95 | 0.09 | 0.58 | −0.36 * | 0.03 |
| PANSS neg_12 | −0.18 | 0.28 | −0.12 | 0.49 | −0.12 | 0.50 |
| PANSS dis_12 | −0.20 | 0.22 | 0.15 | 0.38 | −0.17 | 0.32 |
| PANSS exc_12 | 0.20 | 0.23 | −0.15 | 0.39 | −0.02 | 0.89 |
| PANSS emo_12 | 0.03 | 0.84 | −0.06 | 0.73 | 0.11 | 0.51 |
| BDI_1 | −0.18 | 0.29 | −0.07 | 0.66 | 0.23 | 0.16 |
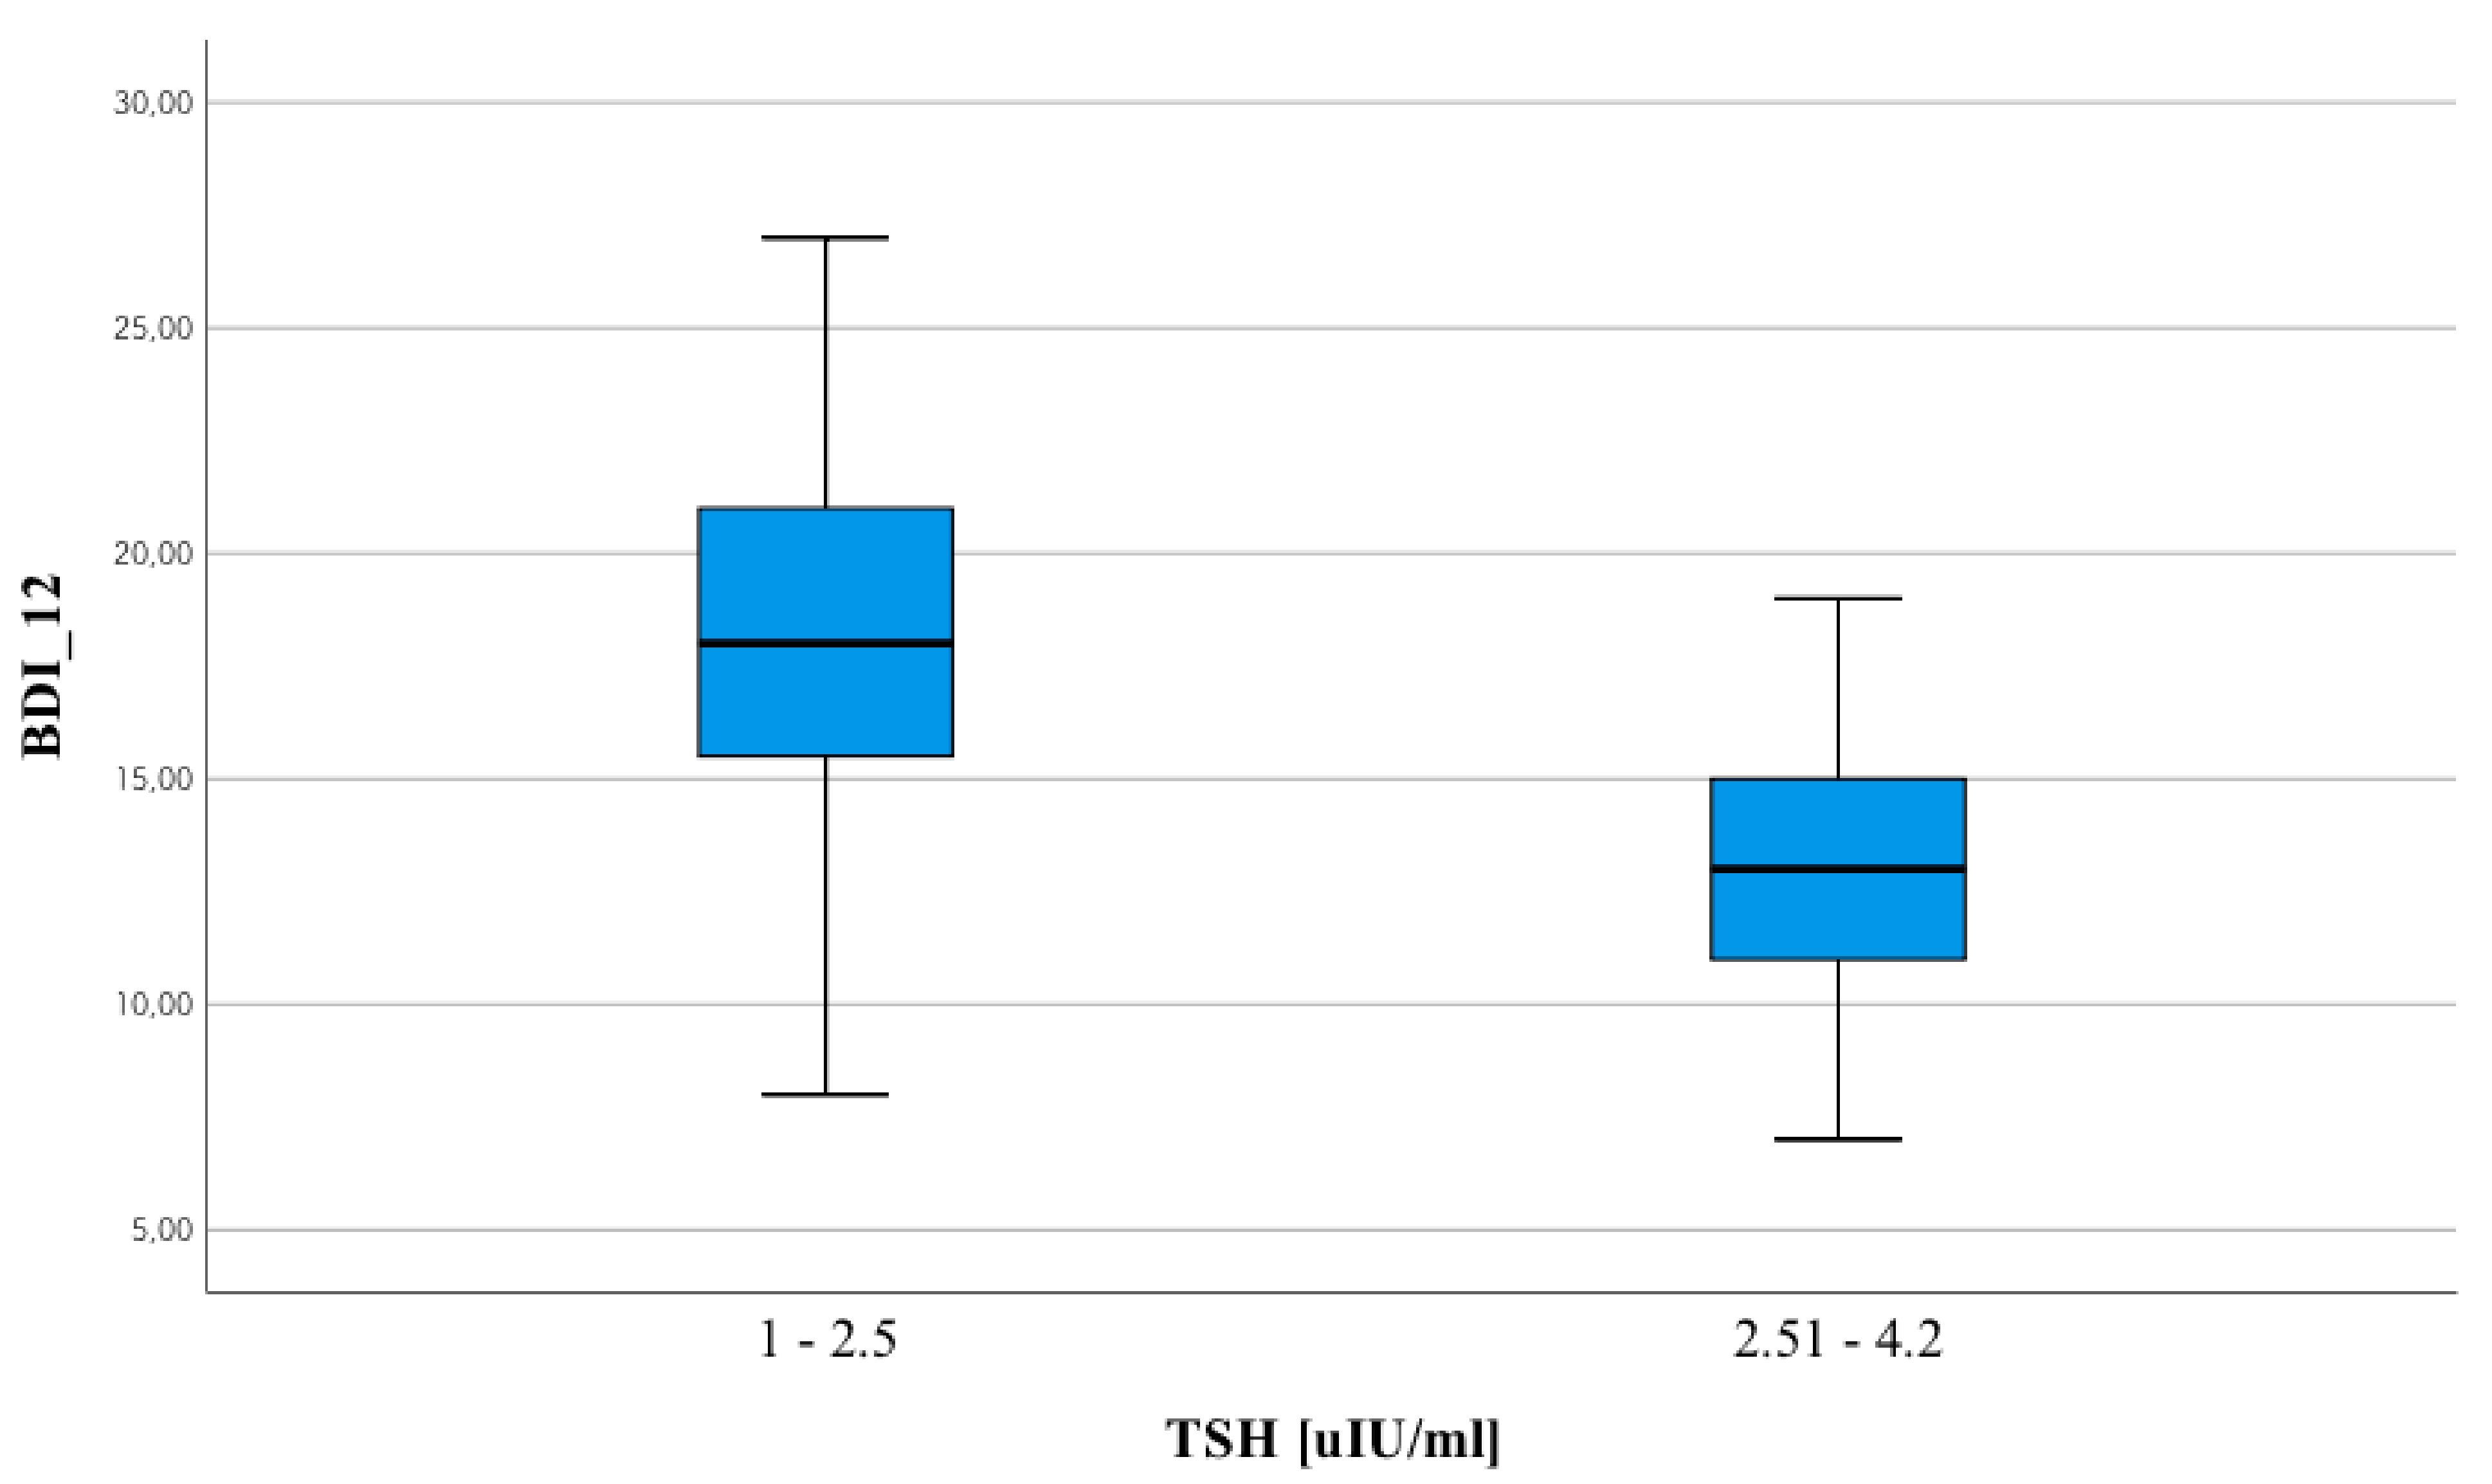
| BDI_12 | −0.44 ** | 0.01 | 0.05 | 0.77 | 0.18 | 0.29 |
| Calgary_1 | −0.19 | 0.24 | −0.09 | 0.61 | −0.05 | 0.78 |
| Calgary_12 | −0.28 | 0.09 | 0.05 | 0.75 | −0.16 | 0.33 |
| CTQ_EN | −0.19 | 0.24 | 0.30 | 0.07 | −0.09 | 0.59 |
| CTQ_EA | −0.14 | 0.41 | 0.46 ** | 0 | −0.11 | 0.52 |
| CTQ_PN | −0.26 | 0.12 | 0.39 * | 0.02 | −0.01 | 0.95 |
| CTQ_PA | −0.13 | 0.43 | 0.31 | 0.06 | 0.01 | 0.97 |
| CTQ_SA | −0.26 | 0.11 | 0.28 | 0.08 | 0.09 | 0.60 |
| CTQ_TOTAL | −0.17 | 0.31 | 0.38 | 0.02 | −0.10 | 0.55 |
| Variable | TSH | FT4 | FT3 | |||
|---|---|---|---|---|---|---|
| rs | p | rs | p | rs | p | |
| WBC (×103/µL)_1 | −0.11 | 0.50 | 0.08 | 0.64 | 0.17 | 0.30 |
| NEUT (×103/µL)_1 | −0.12 | 0.46 | 0.28 | 0.09 | −0.02 | 0.92 |
| LYMP (×103/µL)_1 | 0.39 * | 0.02 | 0.18 | 0.27 | −0.15 | 0.38 |
| MONO (×103/µL)_1 | −0.07 | 0.68 | −0.01 | 0.96 | 0.02 | 0.90 |
| RBC (×106/µL)_1 | 0.11 | 0.51 | −0.10 | 0.54 | 0.14 | 0.39 |
| HGB (g/dL)_1 | 0.04 | 0.83 | −0.03 | 0.84 | 0.10 | 0.56 |
| HCT%_1 | 0.05 | 0.78 | −0.01 | 0.95 | 0.08 | 0.63 |
| MCV (fL)_1 | 0.14 | 0.42 | 0.28 | 0.08 | −0.01 | 0.97 |
| MCH (pg)_1 | 0.19 | 0.24 | 0.21 | 0.21 | −0.13 | 0.44 |
| MCHC (g/dL)_1 | 0.14 | 0.39 | 0.04 | 0.83 | 0.07 | 0.68 |
| RDW-SD fL_1 | −0.09 | 0.59 | 0.12 | 0.46 | 0.02 | 0.91 |
| RDW-CV_1 | −0.22 | 0.19 | −0.14 | 0.39 | 0.10 | 0.53 |
| PLT (×103/µL)_1 | 0 | 0.98 | 0.26 | 0.12 | −0.09 | 0.59 |
| PDW (fL)_1 | 0 | 0.98 | −0.33 * | 0.04 | 0.10 | 0.54 |
| MPV (fL)_1 | −0.03 | 0.86 | −0.28 | 0.09 | 0.25 | 0.13 |
| WBC (×103/µL)_12 | 0.16 | 0.35 | 0.26 | 0.12 | −0.30 | 0.08 |
| NEUT (×103/µL)_12 | 0.08 | 0.63 | 0.35 * | 0.03 | −0.19 | 0.26 |
| LYMP (×103/µL)_12 | 0.01 | 0.97 | −0.10 | 0.57 | −0.07 | 0.71 |
| MONO (×103/µL)_12 | −0.09 | 0.62 | 0.12 | 0.48 | −0.18 | 0.30 |
| RBC (×106/µL)_12 | −0.01 | −0.01 | −0.12 | 0.49 | 0.06 | 0.72 |
| HGB (g/dL)_12 | 0.07 | 0.67 | −0.14 | 0.41 | 0.15 | 0.38 |
| HCT%_12 | 0.05 | 0.78 | −0.17 | 0.34 | 0.11 | 0.53 |
| MCV (fL)_12 | 0.19 | 0.26 | 0.07 | 0.69 | −0.10 | 0.58 |
| MCH (pg)_12 | −0.01 | 0.98 | −0.14 | −0.41 | −0.18 | 0.30 |
| MCHC (g/dL)_12 | −0.70 | 0.68 | −0.14 | 0.43 | 0.05 | 0.79 |
| RDW-SD (fL)_12 | −0.19 | 0.92 | −0.30 | 0.86 | 0.30 | 0.88 |
| RDW-CV_12 | −0.17 | 0.34 | −0.17 | 0.34 | −0.07 | 0.68 |
| PLT (×103/µL)_12 | −0.03 | 0.88 | 0.17 | 0.33 | −0.35 * | 0.04 |
| PDW(fL)_12 | 0.09 | 0.60 | −0.17 | 0.32 | 0.07 | 0.67 |
| MPV(fL)_12 | 0.14 | 0.42 | 0.03 | 0.86 | 0.11 | 0.51 |
| Variable | TSH | FT4 | FT3 | |||
|---|---|---|---|---|---|---|
| rs | p | rs | p | rs | p | |
| Cholesterol µmol/L_1 | −0.05 | 0.75 | 0.01 | 0.97 | −0.04 | 0.81 |
| HDL µmol/L_1 | −0.06 | 0.73 | 0 | 0.98 | −0.13 | 0.45 |
| LDL µmol/L_1 | −0.12 | 0.49 | −0.06 | 0.71 | 0.02 | 0.88 |
| Triglycerides µmol/L_1 | −0.07 | 0.66 | 0.08 | 0.63 | 0.04 | 0.81 |
| CRP mg/L_1 | 0.06 | 0.74 | 0.13 | 0.44 | −0.27 | 0.10 |
| FRAP µmol/L_1 | 0.02 | 0.89 | −0.10 | 0.56 | 0.13 | 0.44 |
| MDA µmol/L_1 | 0.07 | 0.67 | −0.25 | 0.13 | −0.07 | 0.67 |
| PON1 U/L_1 | −0.20 | 0.22 | −0.10 | 0.53 | 0.09 | 0.57 |
| FRAP saliva µmol/L_1 | 0.15 | 0.36 | 0.05 | 0.77 | 0.39 * | 0.02 |
| AVG | 0.11 | 0.56 | 0.32 | 0.08 | −0.28 | 0.12 |
| Cholesterol µmol/L_12 | −0.13 | 0.45 | −0.04 | 0.83 | −0.12 | 0.47 |
| HDL µmol/L_12 | −0.21 | 0.21 | −0.11 | 0.52 | 0.27 | 0.12 |
| LDL µmol/L_12 | −0.18 | 0.3 | 0.19 | 0.27 | 0.26 | 0.12 |
| Triglycerides µmol/L _12 | −0.25 | 0.14 | −0.18 | 0.30 | −0.32 | 0.06 |
| CRP mg/L_12 | 0.01 | 0.96 | 0.21 | 0.22 | −0.12 | 0.50 |
| FRAP µmol/L_12 | 0.17 | 0.3 | −0.20 | 0.23 | 0.21 | 0.21 |
| MDA µmol/L_12 | −0.11 | 0.5 | 0.04 | 0.80 | −0.41 | 0.01 |
| PON1 U/L_12 | −0.12 | 0.47 | −0.02 | 0.92 | 0.36 | 0.03 |
| FRAP saliva µmol/L_12 | 0.19 | 0.26 | 0.14 | 0.41 | 0.21 | 0.20 |
| Chlorpromazine sum_1 | −0.263 | 0.110 | −0.249 | 0.099 | −0.023 | 0.111 |
| Chlorpromazine sum_12 | −0.131 | 0.433 | 0.132 | 0.556 | 0.892 | 0.508 |
| Variable | TSH | FT4 | FT3 | |||
|---|---|---|---|---|---|---|
| rs | p | rs | p | rs | p | |
| FA right frontal lobe AVG | 0.07 | 0.7 | 0.05 | 0.80 | 0.07 | 0.68 |
| FA right frontal lobe DEV | −0.39 * | 0.02 | 0.13 | 0.47 | 0.27 | 0.12 |
| FA left frontal lobe AVG | 0.09 | 0.61 | −0.08 | 0.65 | 0.06 | 0.74 |
| FA left frontal lobe DEV | −0.17 | 0.34 | 0.06 | 0.74 | 0.22 | 0.22 |
| FA_ACC right AVG | 0.02 | 0.91 | 0.10 | 0.59 | 0.14 | 0.43 |
| FA_ACC right DEV | 0.30 | 0.08 | 0.20 | 0.26 | 0.24 | 0.18 |
| FA_ACC left AVG | 0.24 | 0.19 | −0.08 | 0.67 | −0.36 * | 0.04 |
| FA_ACC left DEV | 0.08 | 0.64 | −0.12 | 0.51 | −0.20 | 0.26 |
| ACC_LIPCR | 0.03 | 0.9 | −0.02 | 0.90 | 0.23 | 0.25 |
| ACC_LACCR | −0.05 | 0.79 | 0.01 | 0.97 | 0.08 | 0.69 |
| ACC_ALACR | 0.09 | 0.66 | −0.02 | 0.91 | −0.03 | 0.89 |
| ACC_NAACR | 0.10 | 0.6 | 0.14 | 0.50 | −0.11 | 0.58 |
| ACC_GLUCR | −0.12 | 0.54 | 0.13 | 0.51 | 0.44 * | 0.02 |
| ACC_GABACR | −0.16 | 0.44 | −0.08 | 0.68 | 0.19 | 0.35 |
| ACC_GLNCR | 0.28 | 0.16 | −0.07 | 0.74 | −0.13 | 0.52 |
| ACC_CHOCR | 0.22 | 0.26 | 0.10 | 0.61 | 0.25 | 0.20 |
| ACC_GLCCR | 0.32 | 0.1 | −0.06 | 0.76 | −0.37 | 0.06 |
| ACC_MICR | −0.10 | 0.62 | 0.48 * | 0.01 | 0.48 * | 0.01 |
| ACC_GLUGLNGSHCR | −0.21 | 0.29 | 0.24 | 0.23 | −0.23 | 0.25 |
| ACC_GLCCR_A | 0.12 | 0.54 | −0.14 | 0.49 | 0.27 | 0.17 |
| ACC_MICR_A | −0.30 | 0.12 | −0.18 | 0.37 | −0.07 | 0.73 |
| Value | 1 (Mean ± SD) | 2 (Mean ± SD) |
|---|---|---|
| DUP | 19.7 ± 19.92 | 32.47 ± 35.17 |
| Number of hospitalizations (QH) | 64.95 ± 31.07 | 63.88 ± 37.26 |
| Age of onset (AE) | 18.6 ± 3.07 | 19 ± 4.61 |
| Number of episodes (QE) | 3 ± 3.4 | 3.41 ± 3.97 |
| Hospitalization length (HL) | 3.49 ± 5.93 | 3.33 ± 4.79 |
| PANSS pos_1 | 21.8 ± 4.73 | 19.71 ± 5.02 |
| PANSS neg_1 | 25.95 ± 6.03 | 26.65 ± 7.23 |
| PANSS dis_1 | 21 ± 5.53 | 19 ± 5.2 |
| PANSS exc_1 | 12.25 ± 4.92 | 13.65 ± 4.57 |
| PANSS emo_1 | 12.2 ± 3.49 | 13.29 ± 2.64 |
| PANSS pos_12 | 9 ± 2.22 | 8.94 ± 2.62 |
| PANSS neg_12 | 19.25 ± 4.88 | 15.81 ± 5.27 |
| PANSS dis_12 | 10.75 ± 3.32 | 9.13 ± 2.96 |
| PANSS exc_12 | 5.85 ± 3.05 | 5.81 ± 1.68 |
| PANSS emo_12 | 8.55 ± 2.76 | 8.13 ± 1.41 |
| BDI_1 | 11.4 ± 4.19 | 8.94 ± 4.56 |
| BDI_12 | 17.95 ± 5.12 | 13.18 ± 3.13 |
| Calgary_1 | 4.25 ± 2.17 | 3.24 ± 1.99 |
| Calgary_12 | 9.6 ± 2.68 | 7.29 ± 3 |
| CTQ_EN | 18.1 ± 3.92 | 15.76 ± 5.18 |
| CTQ_EA | 14.85 ± 3.88 | 13.12 ± 5.01 |
| CTQ_PN | 13.1 ± 4.73 | 10.47 ± 4.17 |
| CTQ_PA | 9.55 ± 3.36 | 9.06 ± 4.49 |
| CTQ_SA | 6.5 ± 3.5 | 5.94 ± 3.4 |
| CTQ_TOTAL | 62,08 ± 3.45 | 54,32 ± 3.21 |
| FT4_1 | 12.78 ± 3.68 | 12.68 ± 1.31 |
| FT3_1 | 5.09 ± 1.07 | 4.6 ± 0.99 |
| Drug dose1_1 | 12.55 ± 44.25 | 2.41 ± 2.64 |
| Chlorpromazine1_1 | 100.83 ± 82.8 | 76.47 ± 73.14 |
| Drug dose 1_12 | 69.85 ± 112.13 | 101.65 ± 147.92 |
| Chlorpromazine 1_12 | 360.09 ± 86.82 | 327.45 ± 116.21 |
| WBC × 103/µL_1 | 5.83 ± 1.4 | 6.36 ± 3.5 |
| NEUT × 103/µL_1 | 3.34 ± 1.16 | 3.79 ± 2.79 |
| LYMPH × 103/µL_1 | 1.95 ± 0.54 | 2.36 ± 0.59 |
| MONO × 103/µL_1 | 0.56 ± 0.18 | 0.58 ± 0.23 |
| RBC × 106/µL_1 | 4.72 ± 0.59 | 4.81 ± 0.64 |
| HGB g/dL_1 | 13.61 ± 2.2 | 14.16 ± 1.69 |
| HCT%_1 | 40.11 ± 5.24 | 41.99 ± 3.27 |
| MCV fL_1 | 85.04 ± 4.15 | 85.52 ± 6.17 |
| MCH pg_1 | 28.78 ± 2.02 | 29.67 ± 1.78 |
| MCHC g/dL_1 | 33.63 ± 1.29 | 33.99 ± 1.14 |
| RDW-SD fL_1 | 40.01 ± 3.04 | 39.57 ± 4.86 |
| RDW-CV_1 | 13.02 ± 1.22 | 12.72 ± 1.6 |
| PLT × 103/µL_1 | 247.15 ± 48.5 | 236.94 ± 83.91 |
| PDW fL_1 | 12 ± 2.1 | 12.2 ± 1.69 |
| MPV fL_1 | 10.36 ± 0.98 | 10.5 ± 1.01 |
| PLCR_1 | 27.58 ± 8.2 | 28.03 ± 6.25 |
| PCT_1 | 0.26 ± 0.04 | 0.25 ± 0.08 |
| Variable | 1 (Mean ± SD) | 2 (Mean ± SD) |
|---|---|---|
| Cholesterol µmol/L_1 | 4.42 ± 0.76 | 4.62 ± 1.02 |
| HDL µmol/L_1 | 1.43 ± 0.42 | 1.29 ± 0.37 |
| LDL µmol/L_1 | 2.59 ± 0.74 | 2.54 ± 0.79 |
| Triglycerides µmol/L_1 | 1.26 ± 0.64 | 1.39 ± 1.11 |
| CRP mg/L_1 | 4.2 ± 4.26 | 7.64 ± 12.13 |
| WBC × 103/µL_12 | 8.73 ± 2.37 | 9.42 ± 3.1 |
| NEUT × 103/µL_12 | 5.22 ± 1.68 | 5.6 ± 2.47 |
| LYMPH × 103/µL_12 | 2.04 ± 0.54 | 2.15 ± 0.75 |
| MONO × 103/µL_12 | 0.74 ± 0.27 | 1.22 ± 2.03 |
| FRAP µmol/L_1 | 0.39 ± 0.22 | 0.41 ± 0.22 |
| MDA µmol/L_1 | 0.75 ± 0.16 | 0.78 ± 0.14 |
| PON1 U/L_1 | 102.08 ± 5.99 | 102.04 ± 3.3 |
| FRAP saliva_1 | 0.42 ± 0.25 | 0.57 ± 0.34 |
| AVG | 339.78 ± 40.8 | 336.86 ± 31.12 |
| DWI left frontal lobe DEV | 31.4 ± 6.42 | 30.04 ± 5.68 |
| DWI_ACC right AVG | 429.41 ± 49.67 | 441.41 ± 45.17 |
| DWI_ACC right DEV | 55.29 ± 10.24 | 52.12 ± 6.98 |
| DWI_ACC left AVG | 419.83 ± 35.17 | 434.89 ± 50.5 |
| DWI_ACC left DEV | 54.97 ± 9.85 | 52.15 ± 9.92 |
| FA right frontal lobe AVG | 0.39 ± 0.04 | 0.39 ± 0.04 |
| FA right frontal lobe DEV | 0.11 ± 0.01 | 0.1 ± 0.02 |
| FA left frontal lobe AVG | 0.36 ± 0.04 | 0.35 ± 0.1 |
| FA left frontal lobe DEV | 0.1 ± 0.03 | 0.1 ± 0.02 |
| FA_ACC right AVG | 0.21 ± 0.05 | 0.22 ± 0.04 |
| FA_ACC right DEV | 0.11 ± 0.04 | 0.13 ± 0.03 |
| FA_ACC left AVG | 0.19 ± 0.03 | 0.2 ± 0.04 |
| FA_ACC left DEV | 0.13 ± 0.13 | 0.11 ± 0.02 |
| ACC_MI | 9,539,129 ± 2,765,434 | 8,952,829 ± 3,612,834 |
| ACC_MICR | 0.77 ± 0.18 | 0.69 ± 0.17 |
| ACC_MICR_A | 0.37 ± 0.33 | 0.2 ± 0.13 |
| Variable | Result of the Statistical Test | |
|---|---|---|
| U | p | |
| DUP | 127.5 | 0.19 |
| Number of hospitalizations (QH) | 159 | 0.74 |
| Age of onset (AE) | 160 | 0.76 |
| Number of episodes (QE) | 155 | 0.61 |
| Hospitalization length (HL) | 169 | 0.98 |
| PANSS pos_1 | 130.5 | 0.23 |
| PANSS neg_1 | 159.5 | 0.75 |
| PANSS dis_1 | 134.5 | 0.28 |
| PANSS exc_1 | 139.5 | 0.35 |
| PANSS emo_1 | 135.5 | 0.29 |
| PANSS pos_12 | 156.5 | 0.91 |
| PANSS neg_12 | 82.5 | 0.01 ** |
| PANSS dis_12 | 110 | 0.11 |
| PANSS exc_12 | 131.5 | 0.35 |
| PANSS emo_12 | 142 | 0.56 |
| BDI_1 | 122 | 0.14 |
| BDI_12 | 68.5 | 0 ** |
| Calgary_1 | 122.5 | 0.14 |
| Calgary_12 | 101 | 0.03 * |
| CTQ_EN | 127.5 | 0.19 |
| CTQ_EA | 135.5 | 0.29 |
| CTQ_PN | 112.5 | 0.08 |
| CTQ_PA | 134.5 | 0.27 |
| CTQ_SA | 132.5 | 0.13 |
| FT4_1 | 159.5 | 0.75 |
| FT3_1 | 124.5 | 0.17 |
| Chlorpromazine1_1 | 140 | 0.34 |
| Chlorpromazine1_12 | 138 | 0.29 |
| WBC × 103/µL_1 | 162 | 0.81 |
| NEUT × 103/µL_1 | 158.5 | 0.73 |
| LYMPH × 103/µL_1 | 98.5 | 0.03 * |
| MONO × 103/µL _1 | 169 | 0.98 |
| RBC 106 uL_1 | 143 | 0.41 |
| HGB g/dL_1 | 151 | 0.56 |
| HCT_1 | 143 | 0.41 |
| MCV fL_1 | 144 | 0.43 |
| MCH pg_1 | 119.5 | 0.12 |
| MCHC g/dL_1 | 139.5 | 0.35 |
| RDW-SD fL_1 | 148.5 | 0.51 |
| RDW-CV_1 | 131.5 | 0.24 |
| PLT × 103/µL_1 | 154.5 | 0.64 |
| PDW fL_1 | 150 | 0.54 |
| MPV fL_1 | 155 | 0.65 |
| P-LCR_1 | 157 | 0.69 |
| PCT_1 | 141 | 0.37 |
| WBC × 103/µL_12 | 141 | 0.55 |
| NEUT × 103/µL_12 | 151 | 0.77 |
| LYMPH × 103/µL_12 | 158 | 0.95 |
| MONO × 103/µL_12 | 157.5 | 0.94 |
| FRAP saliva 1 | 118.5 | 0.12 |
| AVG | 107 | 0.61 |
| FA right frontal lobe AVG | 122.5 | 0.70 |
| FA right frontal lobe DEV | 79.5 | 0.05 |
| FA left frontal lobe AVG | 126.5 | 0.81 |
| FA left frontal lobe DEV | 95 | 0.17 |
| FA_ACC right AVG | 111.5 | 0.43 |
| FA_ACC right DEV | 94 | 0.16 |
| FA_ACC left AVG | 108.5 | 0.37 |
| FA_ACC left DEV | 105.5 | 0.32 |
| TSH Level | TSH Level | |||
|---|---|---|---|---|
| 1–2.5 mU/L | 2.51–4.2 mU/L | Cluster 1 | Cluster 2 | |
| n | 20 | 17 | 20 | 17 |
| % | 54.1 | 45.9 | 54.1 | 45.9 |
| Spearman Correlations | Chlorpromazine sum_1 | Chlorpromazine sum_12 | |
|---|---|---|---|
| TSH_1 | Correlation coefficient | −0.263 | −0.131 |
| Significance (bilateral) | 0.110 | 0.433 | |
| FT4_1 | Correlation coefficient | −0.249 | 0.099 |
| Significance (bilateral) | 0.132 | 0.556 | |
| FT3_1 | Correlation coefficient | −0.023 | 0.111 |
| Significance (bilateral) | 0.892 | 0.508 | |
| Cortisol μg/dL_1 | Correlation coefficient | 0.081 | −0.047 |
| Significance (bilateral) | 0.623 | 0.777 | |
| CRP mg/L_12 | Correlation coefficient | 0.183 | 0.291 |
| Significance (bilateral) | 0.277 | 0.080 | |
Publisher’s Note: MDPI stays neutral with regard to jurisdictional claims in published maps and institutional affiliations. |
© 2022 by the authors. Licensee MDPI, Basel, Switzerland. This article is an open access article distributed under the terms and conditions of the Creative Commons Attribution (CC BY) license (https://creativecommons.org/licenses/by/4.0/).
Share and Cite
Śmierciak, N.; Szwajca, M.; Popiela, T.J.; Bryll, A.; Karcz, P.; Donicz, P.; Turek, A.; Krzyściak, W.; Pilecki, M. Redefining the Cut-Off Ranges for TSH Based on the Clinical Picture, Results of Neuroimaging and Laboratory Tests in Unsupervised Cluster Analysis as Individualized Diagnosis of Early Schizophrenia. J. Pers. Med. 2022, 12, 247. https://doi.org/10.3390/jpm12020247
Śmierciak N, Szwajca M, Popiela TJ, Bryll A, Karcz P, Donicz P, Turek A, Krzyściak W, Pilecki M. Redefining the Cut-Off Ranges for TSH Based on the Clinical Picture, Results of Neuroimaging and Laboratory Tests in Unsupervised Cluster Analysis as Individualized Diagnosis of Early Schizophrenia. Journal of Personalized Medicine. 2022; 12(2):247. https://doi.org/10.3390/jpm12020247
Chicago/Turabian StyleŚmierciak, Natalia, Marta Szwajca, Tadeusz J. Popiela, Amira Bryll, Paulina Karcz, Paulina Donicz, Aleksander Turek, Wirginia Krzyściak, and Maciej Pilecki. 2022. "Redefining the Cut-Off Ranges for TSH Based on the Clinical Picture, Results of Neuroimaging and Laboratory Tests in Unsupervised Cluster Analysis as Individualized Diagnosis of Early Schizophrenia" Journal of Personalized Medicine 12, no. 2: 247. https://doi.org/10.3390/jpm12020247
APA StyleŚmierciak, N., Szwajca, M., Popiela, T. J., Bryll, A., Karcz, P., Donicz, P., Turek, A., Krzyściak, W., & Pilecki, M. (2022). Redefining the Cut-Off Ranges for TSH Based on the Clinical Picture, Results of Neuroimaging and Laboratory Tests in Unsupervised Cluster Analysis as Individualized Diagnosis of Early Schizophrenia. Journal of Personalized Medicine, 12(2), 247. https://doi.org/10.3390/jpm12020247