
Value of Strain-Ratio Elastography in the Diagnosis and Differentiation of Uterine Fibroids and Adenomyosis

 , and
, and
Abstract
:1. Introduction
2. Materials and Methods
2.1. Study Population and Groups
2.2. Ultrasound Examination
2.3. Strain Ratio Elastography Analysis
2.4. Statistical Analysis
3. Results
4. Discussion
5. Conclusions
Author Contributions
Funding
Institutional Review Board Statement
Informed Consent Statement
Data Availability Statement
Acknowledgments
Conflicts of Interest
References
- Vlahos, N.F.; Theodoridis, T.D.; Partsinevelos, G.A. Myomas and adenomyosis: Impact on reproductive outcome. Biomed. Res. Int. 2017, 2017, 5926470. [Google Scholar] [CrossRef] [PubMed]
- Van den Bosch, T.; Van Schoubroeck, D. Ultrasound diagnosis of endometriosis and adenomyosis: State of the art. Best Pract. Res. Clin. Obstet. Gynaecol. 2018, 51, 16–24. [Google Scholar] [CrossRef] [PubMed]
- Liu, X.; Ding, D.; Ren, Y.; Guo, S.-W. Transvaginal elastosonography as an imaging technique for diagnosing adenomyosis. Reprod. Sci. 2018, 25, 498–514. [Google Scholar] [CrossRef]
- Yu, O.; Schulze-Rath, R.; Grafton, J.; Hansen, K.; Scholes, D.; Reed, S.D. Adenomyosis incidence, prevalence and treatment: United States population-based study 2006–2015. Am. J. Obstet. Gynecol. 2020, 223, 94.e1–94.e10. [Google Scholar] [CrossRef] [PubMed]
- Exacoustos, C.; Brienza, L.; Di Giovanni, A.; Szabolcs, B.; Romanini, M.E.; Zupi, E.; Arduini, D. Adenomyosis: Three-dimensional sonographic findings of the junctional zone and correlation with histology. Ultrasound Obstet. Gynecol. 2011, 37, 471–479. [Google Scholar] [CrossRef] [Green Version]
- Cunningham, R.K.; Horrow, M.M.; Smith, R.J.; Springer, J. Adenomyosis: A Sonographic Diagnosis. RadioGraphics 2018, 38, 1576–1589. [Google Scholar] [CrossRef] [PubMed]
- Giuliani, E.; As-Sanie, S.; Marsh, E.E. Epidemiology and management of uterine fibroids. Int. J. Gynaecol. Obstet. 2020, 149, 3–9. [Google Scholar] [CrossRef]
- Laughlin-Tommaso, S.K.; Stewart, E.A. Moving toward individualized medicine for uterine leiomyomas. Obstet. Gynecol. 2018, 132, 961–971. [Google Scholar] [CrossRef] [PubMed]
- Van den Bosch, T.; de Bruijn, A.M.; de Leeuw, R.A.; Dueholm, M.; Exacoustos, C.; Valentin, L.; Bourne, T.; Timmerman, D.; Huirne, J.A.F. Sonographic classification and reporting system for diagnosing adenomyosis. Ultrasound Obstet. Gynecol. 2019, 53, 576–582. [Google Scholar] [CrossRef] [PubMed]
- den Bosch, T.V.; Dueholm, M.; Leone, F.P.G.; Valentin, L.; Rasmussen, C.K.; Votino, A.; Schoubroeck, D.V.; Landolfo, C.; Installé, A.J.F.; Guerriero, S.; et al. Terms, definitions and measurements to describe sonographic features of myometrium and uterine masses: A consensus opinion from the morphological uterus sonographic assessment (MUSA) group. Ultrasound. Obstet. Gynecol. 2015, 46, 284–298. [Google Scholar] [CrossRef]
- Ophir, J.; Céspedes, I.; Ponnekanti, H.; Yazdi, Y.; Li, X. Elastography: A quantitative method for imaging the elasticity of biological tissues. Ultrason. Imaging 1991, 13, 111–134. [Google Scholar] [CrossRef]
- Dietrich, C.F.; Barr, R.G.; Farrokh, A.; Dighe, M.; Hocke, M.; Jenssen, C.; Dong, Y.; Saftoiu, A.; Havre, R.F. Strain elastography—How to do it? Ultrasound Int. Open 2017, 3, E137–E149. [Google Scholar] [CrossRef] [PubMed] [Green Version]
- Zhang, M.; Wasnik, A.P.; Masch, W.R.; Rubin, J.M.; Carlos, R.C.; Quint, E.H.; Maturen, K.E. Transvaginal ultrasound shear wave elastography for the evaluation of benign uterine pathologies: A prospective pilot study. J. Ultrasound Med. 2019, 38, 149–155. [Google Scholar] [CrossRef] [Green Version]
- Che, D.; Wei, H.; Yang, Z.; Zhang, Y.; Ma, S.; Zhou, X. Application of transvaginal sonographic elastography to distinguish endometrial cancer from benign masses. Am. J. Transl. Res. 2019, 11, 1049–1057. [Google Scholar] [PubMed]
- Andres, M.P.; Borrelli, G.M.; Ribeiro, J.; Baracat, E.C.; Abrão, M.S.; Kho, R.M. Transvaginal ultrasound for the diagnosis of adenomyosis: Systematic review and meta-analysis. J. Minim. Invasive Gynecol. 2018, 25, 257–264. [Google Scholar] [CrossRef]
- Bian, J.; Zhang, J.; Hou, X. Diagnostic accuracy of ultrasound shear wave elastography combined with superb microvascular imaging for breast tumors: A protocol for systematic review and meta-analysis. Medicine 2021, 100, e26262. [Google Scholar] [CrossRef] [PubMed]
- Fuster, D.; García-Calvo, X.; Zuluaga, P.; Bolao, F.; Muga, R. Assessment of liver disease in patients with chronic hepatitis C and unhealthy alcohol use. World J. Gastroenterol. 2021, 27, 3223–3237. [Google Scholar] [CrossRef]
- Kuo, Y.-W.; Chen, Y.-L.; Wu, H.-D.; Chien, Y.-C.; Huang, C.-K.; Wang, H.-C. Application of transthoracic shear-wave ultrasound elastography in lung lesions. Eur. Respir. J. 2021, 57, 2002347. [Google Scholar] [CrossRef] [PubMed]
- Ageeli, W.; Wei, C.; Zhang, X.; Szewcyk-Bieda, M.; Wilson, J.; Li, C.; Nabi, G. Quantitative ultrasound shear wave elastography (USWE)-measured tissue stiffness correlates with PIRADS scoring of MRI and gleason score on whole-mount histopathology of prostate cancer: Implications for ultrasound image-guided targeting approach. Insights Imaging 2021, 12, 96. [Google Scholar] [CrossRef]
- Liu, C.; Li, T.T.; Hu, Z.; Li, Y.; Cheng, X.; Zhu, Y.; Lu, M. Transvaginal real-time shear wave elastography in the diagnosis of cervical disease. J. Ultrasound Med. 2019, 38, 3173–3181. [Google Scholar] [CrossRef]
- Tessarolo, M.; Bonino, L.; Camanni, M.; Deltetto, F. Elastosonography: A possible new tool for diagnosis of adenomyosis? Eur. Radiol. 2011, 21, 1546–1552. [Google Scholar] [CrossRef] [PubMed]
- Du, Y.-Y.; Yan, X.-J.; Guo, Y.-J.; Wang, J.; Wen, X.-D.; Wang, N.; Yang, Y. Transvaginal real-time shear wave elastography in the diagnosis of endometrial lesions. Int. J. Gen. Med. 2021, 14, 2849–2856. [Google Scholar] [CrossRef] [PubMed]
- Acar, S.; Millar, E.; Mitkova, M.; Mitkov, V. Value of ultrasound shear wave elastography in the diagnosis of adenomyosis. Ultrasound 2016, 24, 205–213. [Google Scholar] [CrossRef] [PubMed] [Green Version]
- Stoelinga, B.; Hehenkamp, W.J.K.; Nieuwenhuis, L.L.; Conijn, M.M.A.; van Waesberghe, J.H.T.M.; Brölmann, H.A.M.; Huirne, J.A.F. Accuracy and reproducibility of sonoelastography for the assessment of fibroids and adenomyosis, with magnetic resonance imaging as reference standard. Ultrasound Med. Biol. 2018, 44, 1654–1663. [Google Scholar] [CrossRef] [PubMed]
- Donnez, J.; Dolmans, M.-M. Uterine fibroid management: From the present to the future. Hum. Reprod. Update 2016, 22, 665–686. [Google Scholar] [CrossRef] [PubMed]
- Frank, M.L.; Schäfer, S.D.; Möllers, M.; Falkenberg, M.K.; Braun, J.; Möllmann, U.; Strube, F.; Fruscalzo, A.; Amler, S.; Klockenbusch, W.; et al. Importance of transvaginal elastography in the diagnosis of uterine fibroids and adenomyosis. Ultraschall Med. 2016, 37, 373–378. [Google Scholar] [CrossRef] [PubMed]
- Xie, M.; Yu, H.; Zhang, X.; Wang, W.; Ren, Y. Elasticity of adenomyosis is increased after GnRHa therapy and is associated with spontaneous pregnancy in infertile patents. J. Gynecol. Obstet. Hum. Reprod. 2019, 48, 849–853. [Google Scholar] [CrossRef] [PubMed]
- Görgülü, F.F.; Okçu, N.T. Which imaging method is better for the differentiation of adenomyosis and uterine fibroids? J. Gynecol. Obstet. Hum. Reprod. 2021, 50, 102002. [Google Scholar] [CrossRef]
- Meredith, S.M.; Sanchez-Ramos, L.; Kaunitz, A.M. Diagnostic accuracy of transvaginal sonography for the diagnosis of adenomyosis: Systematic review and metaanalysis. Am. J. Obstet. Gynecol. 2009, 201, 107.e1–107.e6. [Google Scholar] [CrossRef]
- Stoelinga, B.; Hehenkamp, W.J.K.; Brölmann, H.A.M.; Huirne, J.A.F. Real-time elastography for assessment of uterine disorders. Ultrasound Obstet. Gynecol. 2014, 43, 218–226. [Google Scholar] [CrossRef]
- Capozzi, V.A.; Merisio, C.; Rolla, M.; Pugliese, M.; Morganelli, G.; Cianciolo, A.; Gambino, G.; Armano, G.; Sozzi, G.; Riccò, M.; et al. Confounding factors of transvaginal ultrasound accuracy in endometrial cancer. J. Obstet. Gynaecol. 2021, 41, 779–784. [Google Scholar] [CrossRef] [PubMed]
- Tellum, T.; Matic, G.V.; Dormagen, J.B.; Nygaard, S.; Viktil, E.; Qvigstad, E.; Lieng, M. Diagnosing adenomyosis with MRI: A prospective study revisiting the junctional zone thickness cutoff of 12 mm as a diagnostic marker. Eur. Radiol. 2019, 29, 6971–6981. [Google Scholar] [CrossRef] [PubMed]
- Frühauf, F.; Zikan, M.; Semeradova, I.; Dundr, P.; Nemejcova, K.; Dusek, L.; Cibula, D.; Fischerova, D. The diagnostic accuracy of ultrasound in assessment of myometrial invasion in endometrial cancer: Subjective assessment versus objective techniques. Biomed. Res. Int. 2017, 2017, 1318203. [Google Scholar] [CrossRef] [PubMed] [Green Version]


| Uterine Fibroids—MUSA Features | |
|---|---|
| Well-defined round lesion | 64% |
| Within the myometrium | 58% |
| Nearby the myometrium | 43% |
| Shadows at the edge of the lesion | 24% |
| Inner fan-shaped shadowing | 47% |
| Symmetrical | 53% |
| Heterogeneous | 55% |
| Hypoechoic/hyperechoic | 47% |
| Circumferential blood flow | 66% |
| Adenomyosis—MUSA Features | |
|---|---|
| Ill-defined lesion | 52% |
| Echogenic striations or nodules | 60% |
| Myometrial cysts | 48% |
| Cystic striations | 56% |
| Interrupted junctional zone | 52% |
| Enlarged global uterus | 68% |
| Fan-shaped shadowing | 48% |
| Translesional blood flow | 20% |
| MUSA Group Criteria | Adenomyosis (%) | Uterine Fibroids (%) | p-Value | OR (95% CI for OR) | Sensitivity % (95% CI) | Specificity % (95% CI) | |
|---|---|---|---|---|---|---|---|
| Well-defined, round lesion | Yes | 12 | 64.15 | <0.01 | 0.07 (0.02–0.29) | 12 (4.16–29.96) | 35.85 (24.3–49.31) |
| No | 88 | 35.84 | |||||
| Fan shaped shadowing | Yes | 48 | 47.16 | 0.94 | 1.03 (0.39–2.69) | 48 (30.03–66.5) | 52.83 (39.66–65.62) |
| No | 52 | 52.83 | |||||
| Enlarged globular uterus | Yes | 68 | 58.49 | 0.42 | 1.50 (0.56–4.26) | 68 (48.41–82.79) | 41.51 (29.26–54.91) |
| No | 32 | 41.50 | |||||
| Heterogeneous lesion | Yes | 60 | 54.71 | 0.66 | 1.24 (0.47–3.04) | 60 (40.74–76.6) | 45.28 (32.66–58.55) |
| No | 40 | 45.28 |
| Parameter (Mean ± SD) | Adenomyosis (n = 25) | Uterine Fibroids (n = 53) | p-Value |
|---|---|---|---|
| Age | 45 ± 4.9 | 44 ± 5.6 | 0.552 |
| BMI | 25.88 ± 6.22 | 26.15 ± 4.02 | 0.266 |
| Mean SR | 11.42 ± 1.87 | 5.20 ± 1.81 | <0.001 |
| Max SR | 13.43 ± 4.10 | 5.78 ± 2.08 | <0.001 |
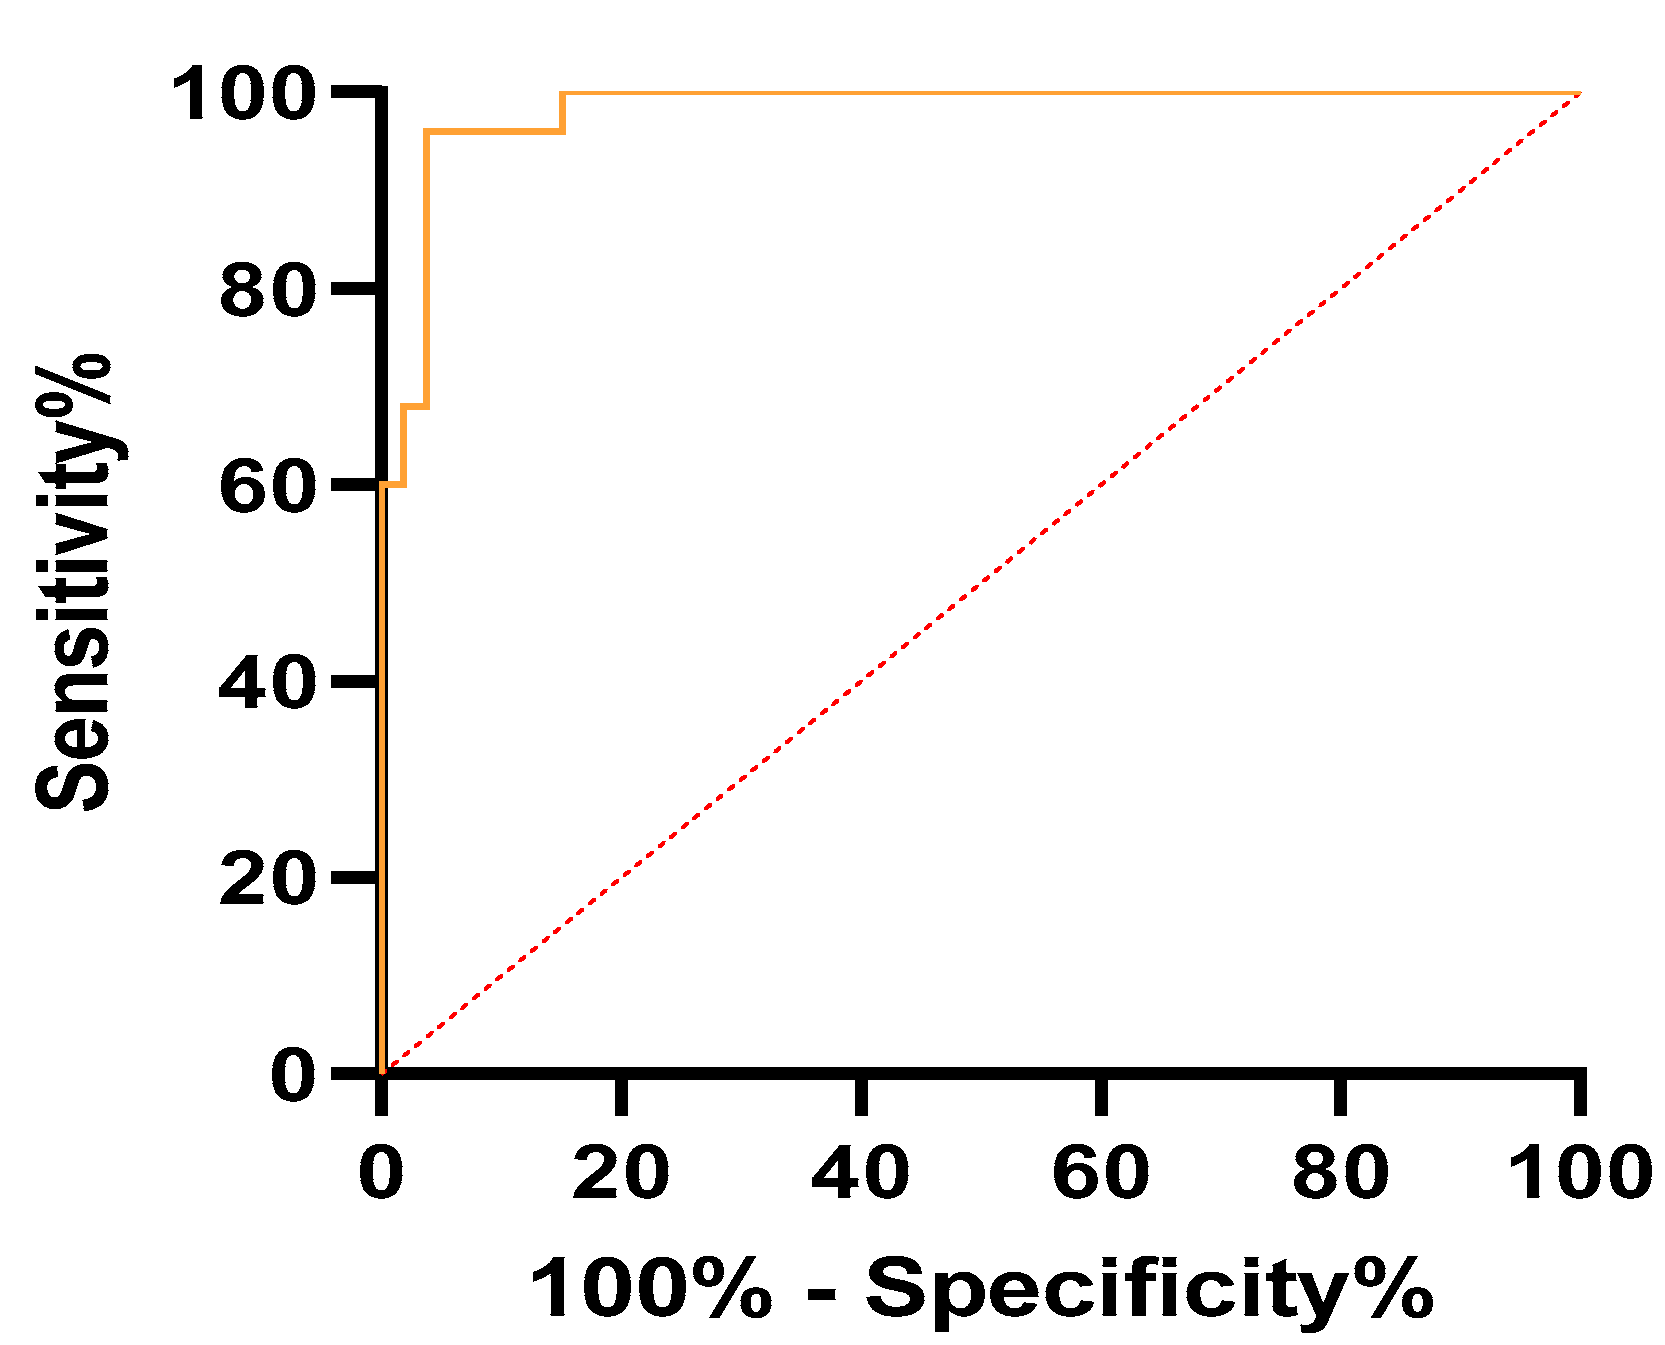
| Parameter | AUC (95% CI) | Cutoff | Sensitivity (95% CI) | Specificity (95% CI) | p-Value |
|---|---|---|---|---|---|
| mean SR | 0.99 (0.97–1) | >7.71 | 100% (86.68–100%) | 96.23% (87.25–99.33%) | <0.001 |
| max SR | 0.98 (0.96–1) | >8.91 | 96% (80.46–99.79%) | 96.23% (87.25–99.33%) | <0.001 |
Publisher’s Note: MDPI stays neutral with regard to jurisdictional claims in published maps and institutional affiliations. |
© 2021 by the authors. Licensee MDPI, Basel, Switzerland. This article is an open access article distributed under the terms and conditions of the Creative Commons Attribution (CC BY) license (https://creativecommons.org/licenses/by/4.0/).
Share and Cite
Săsăran, V.; Turdean, S.; Gliga, M.; Ilyes, L.; Grama, O.; Muntean, M.; Pușcașiu, L. Value of Strain-Ratio Elastography in the Diagnosis and Differentiation of Uterine Fibroids and Adenomyosis. J. Pers. Med. 2021, 11, 824. https://doi.org/10.3390/jpm11080824
Săsăran V, Turdean S, Gliga M, Ilyes L, Grama O, Muntean M, Pușcașiu L. Value of Strain-Ratio Elastography in the Diagnosis and Differentiation of Uterine Fibroids and Adenomyosis. Journal of Personalized Medicine. 2021; 11(8):824. https://doi.org/10.3390/jpm11080824
Chicago/Turabian StyleSăsăran, Vladut, Sabin Turdean, Marius Gliga, Levente Ilyes, Ovidiu Grama, Mihai Muntean, and Lucian Pușcașiu. 2021. "Value of Strain-Ratio Elastography in the Diagnosis and Differentiation of Uterine Fibroids and Adenomyosis" Journal of Personalized Medicine 11, no. 8: 824. https://doi.org/10.3390/jpm11080824
APA StyleSăsăran, V., Turdean, S., Gliga, M., Ilyes, L., Grama, O., Muntean, M., & Pușcașiu, L. (2021). Value of Strain-Ratio Elastography in the Diagnosis and Differentiation of Uterine Fibroids and Adenomyosis. Journal of Personalized Medicine, 11(8), 824. https://doi.org/10.3390/jpm11080824