Article

Multi-Omics Analysis of SOX4, SOX11, and SOX12 Expression and the Associated Pathways in Human Cancers

Department of Stem Cell and Regenerative Biotechnology, Incurable Disease Animal Model & Stem Cell Institute (IDASI), Konkuk University, 120 Neungdong-ro, Gwangjin-gu, Seoul 05029, Korea
*
Author to whom correspondence should be addressed.
These authors contributed equally to this study.
J. Pers. Med. 2021, 11(8), 823; https://doi.org/10.3390/jpm11080823
Submission received: 8 June 2021 / Revised: 6 August 2021 / Accepted: 20 August 2021 / Published: 23 August 2021
(This article belongs to the Special Issue Application of Bioinformatics in Precision Medicine)

Abstract

:
The Sry-related HMG BOX (SOX) gene family encodes transcription factors containing highly conserved high-mobility group domains that bind to the minor groove in DNA. Although some SOX genes are known to be associated with tumorigenesis and cancer progression, their expression and prognostic value have not been systematically studied. We performed multi-omic analysis to investigate the expression of SOX genes in human cancers. Expression and phylogenetic tree analyses of the SOX gene family revealed that the expression of three closely related SOX members, SOX4, SOX11, and SOX12, was increased in multiple cancers. Expression, mutation, and alteration of the three SOX members were evaluated using the Oncomine and cBioPortal databases, and the correlation between these genes and clinical outcomes in various cancers was examined using the Kaplan–Meier, PrognoScan, and R2 database analyses. The genes commonly correlated with the three SOX members were categorized in key pathways related to the cell cycle, mitosis, immune system, and cancer progression in liver cancer and sarcoma. Additionally, functional protein partners with three SOX proteins and their probable signaling pathways were explored using the STRING database. This study suggests the prognostic value of the expression of three SOX genes and their associated pathways in various human cancers.

Graphical Abstract

1. Introduction

Cancer is one of the leading causes of death worldwide and a major threat to human health. Approximately 24.5 million new cancer cases and 9.6 million cancer deaths were reported in 2017 [1]. Although there has been substantial improvement in diagnostic and treatment modalities, the cumulative risk of cancer death between birth and 74 years of age remained at approximately 10% in 2018 [2]. Oncogenic processes include accumulated mutations and changes in gene expression, which result in gain of tumor traits such as limitless proliferation, invasion, metastasis, and immortalization [3]. Therefore, identification of differentially expressed genes (DEGs) between cancers and their normal counterparts, which are related to patient survival, can be exploited as therapeutic targets and diagnostic or prognostic markers for cancer.
The Sry-related HMG BOX (SOX) gene family consists of 20 transcription factors, which have a highly conserved high-mobility group (HMG) domain that binds to the minor groove in DNA [4]. During embryonic development, the SOX family members play essential roles as regulators of specific lineage and tissue gene expression for stemness, cell differentiation, organogenesis, and sex determination [5]. Some SOX members play oncogenic roles in various cancers. Upregulation of SOX2 has been reported to be associated with poor clinical outcomes in breast [6], lung [7], renal [8], ovarian [9], and liver [10] cancers. Additionally, high expression of SOX4 is associated with poor prognosis in leukemia, bladder [11], and breast [12,13] cancers [14]. Highly upregulated expression of SOX9 is correlated with cancer progression in renal [15], liver [16], and colorectal [17] cancers. Furthermore, the relative mRNA expression levels of other SOX family members, such as SOX11 and SOX12, are elevated in breast [18,19,20], liver [21,22], and lung [23,24] cancers and have a positive correlation with poor prognosis. In contrast, SOX15 is a prospective tumor suppressor gene associated with the Wnt/β-catenin pathway in pancreatic cancer [25].
In this study, we systemically analyzed the expression of SOX family genes and their prognostic value in various cancers, using online bioinformatic databases. The expression of genes related to SOX4, SOX11, and SOX12, which are highly upregulated in various types of cancers, and their related signaling pathways were also examined using a gene meta-analysis database. The findings from these systemic analyses suggest the prognostic value of the expression of several SOX genes in human cancers and their potential as biomarkers for SOX gene-targeted cancer therapy.

2. Results

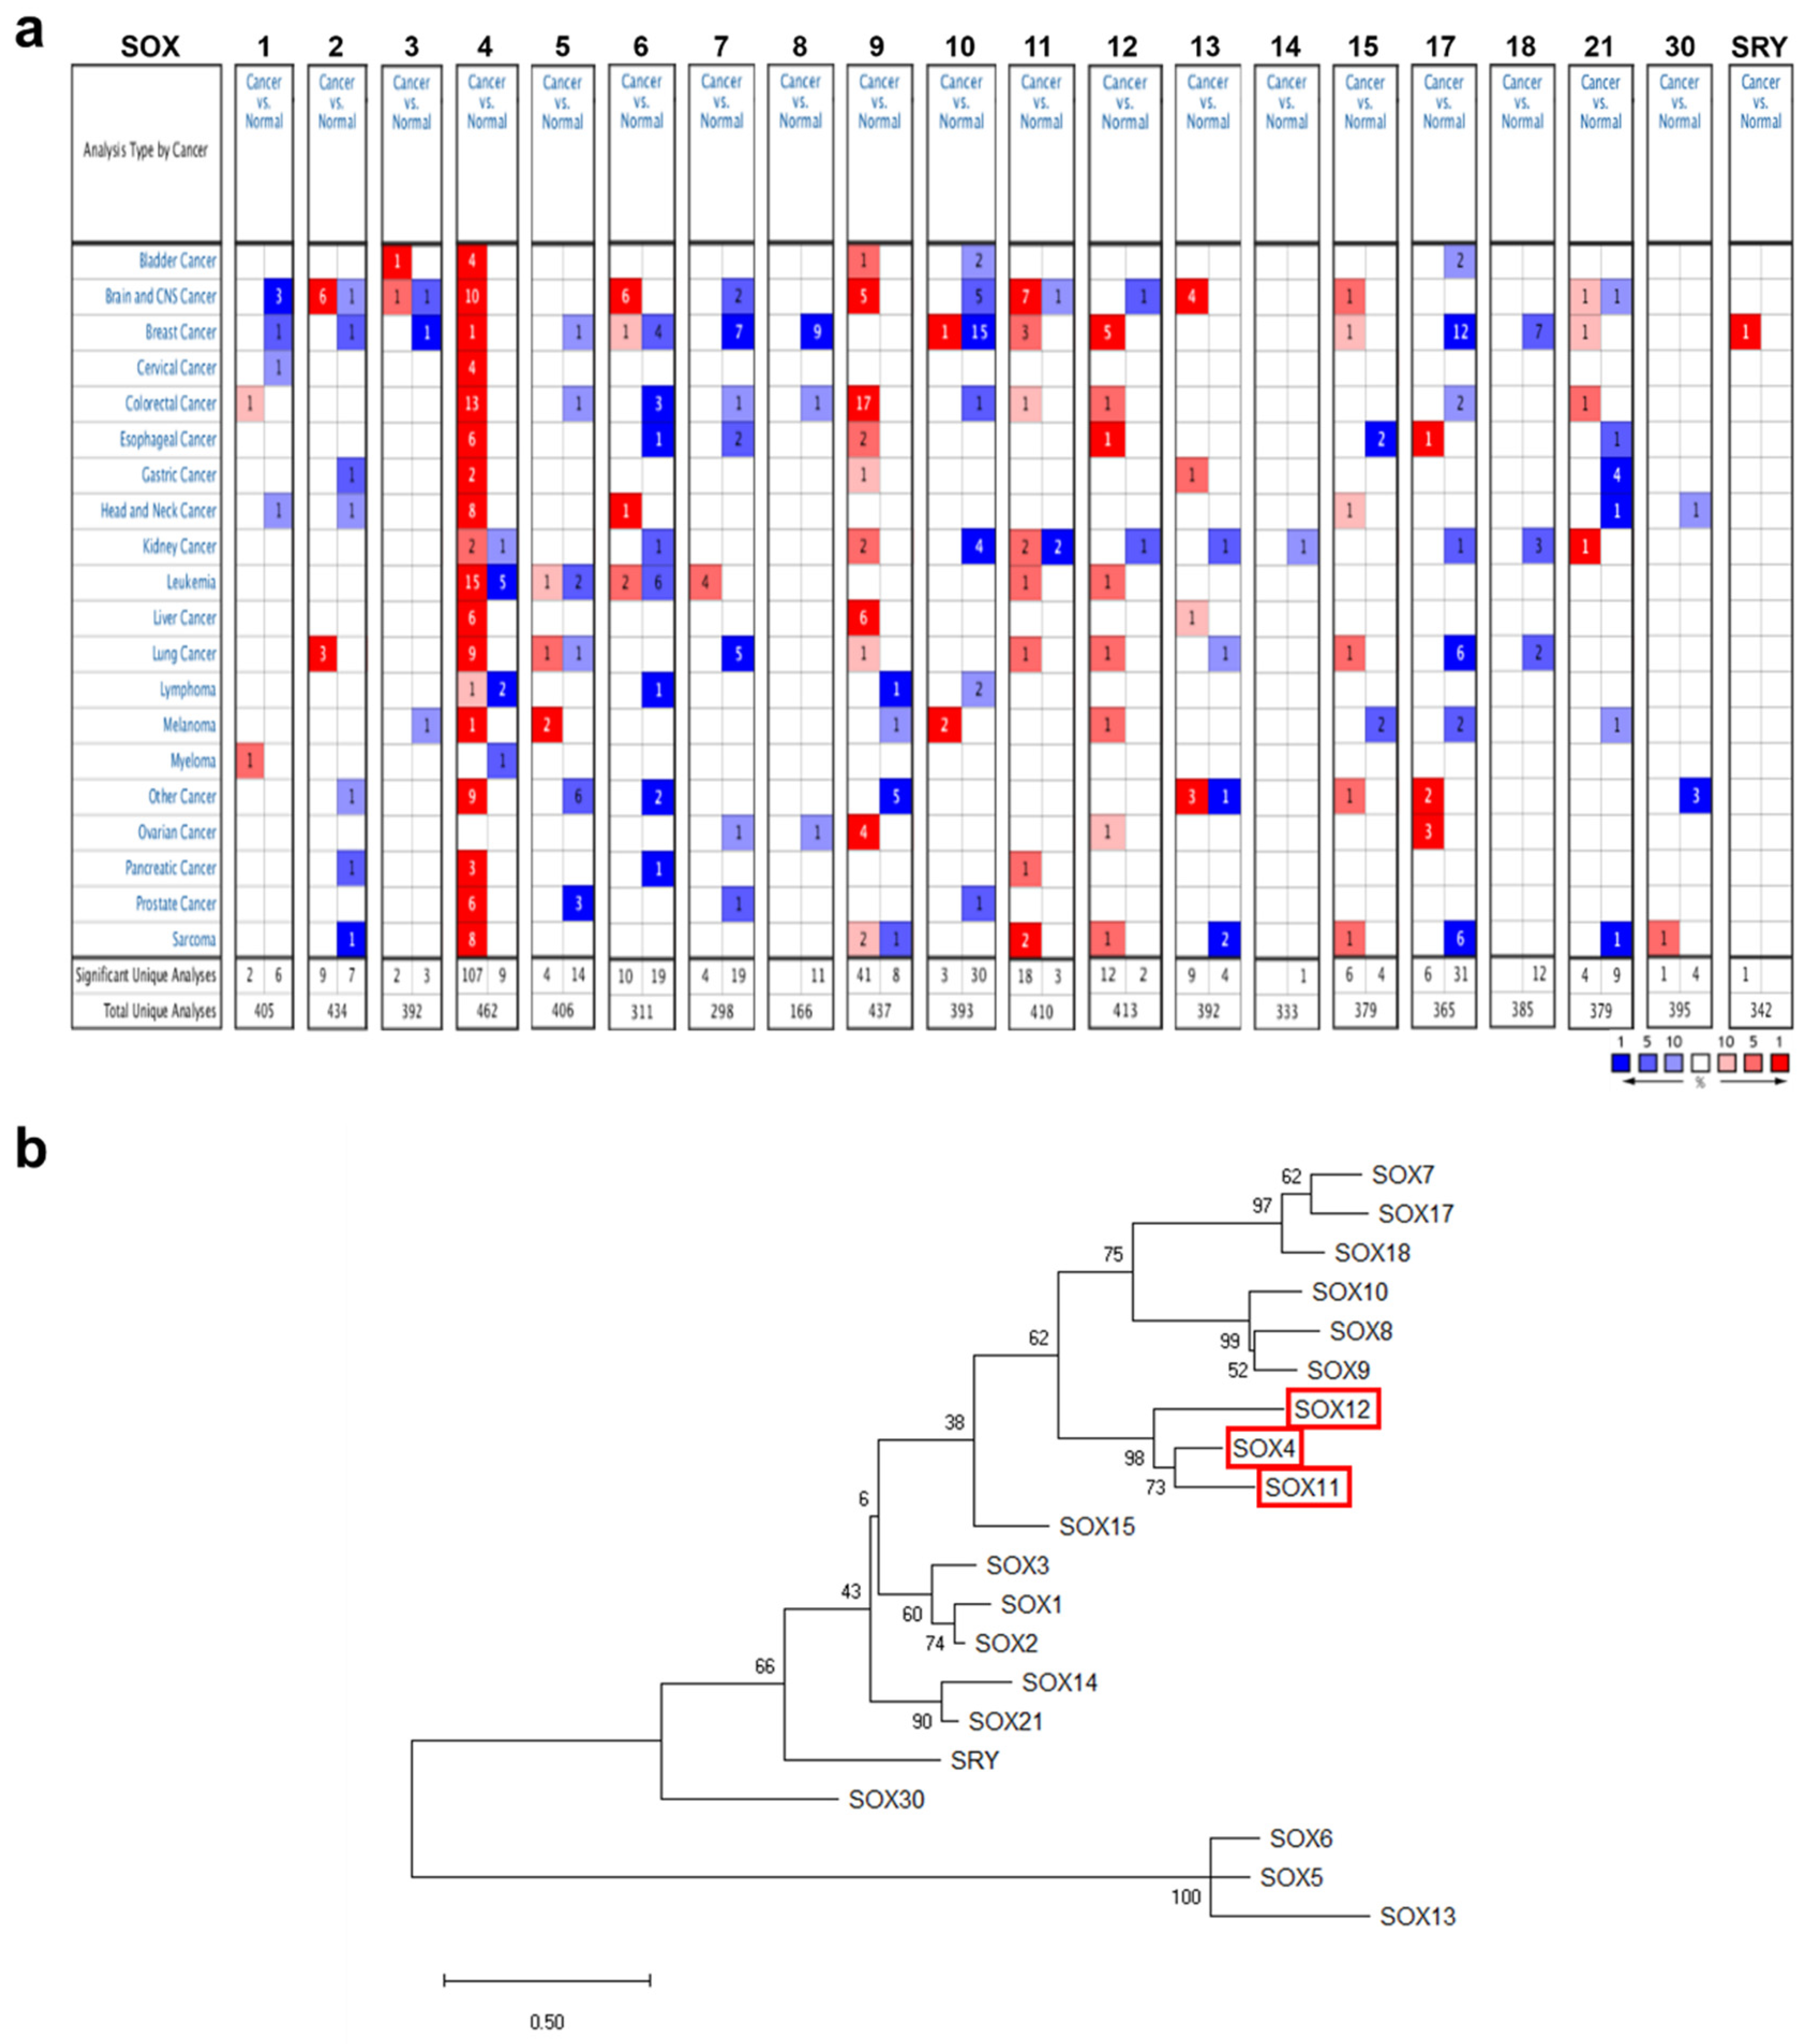
2.1. mRNA Expression of the SOX Gene Family in Various Cancers

The mRNA expression of the SOX gene family in different cancers and the corresponding normal tissues was analyzed using the Oncomine database (Version 4.5, Thermo Fisher, Waltham, MA, USA) with the following threshold parameters: p-value < 0.001, fold change of 2, and gene rank of 10%. Among the genes in the SOX family, the expression of SOX4, SOX9, SOX11, and SOX12 was higher in multiple types of cancers than in their normal counterparts. (Figure 1a).
The amino acid sequences of SOX family proteins were retrieved from the National Center for Biotechnology Information (NCBI) database and clustered to create a phylogenetic tree, employing the neighbor-joining method using the Molecular Evolutionary Genetics Analysis (MEGA) tool (Figure 1b). Phylogenetic tree analysis showed that the highly expressed SOX members in various cancers, i.e., SOX4, SOX11, and SOX12, were closely clustered, suggesting similarities in amino acid sequences among these three SOX members. Although expression of SOX9 was higher in various cancer types than their counterparts from the Oncomine database, the homology of SOX9 was not strictly grouped with other three SOX members. Accordingly, we selected the three SOX genes SOX4, SOX11, and SOX12 for further systematic analysis to determine their prognostic value and possible oncogenic role, using publicly available online databases.

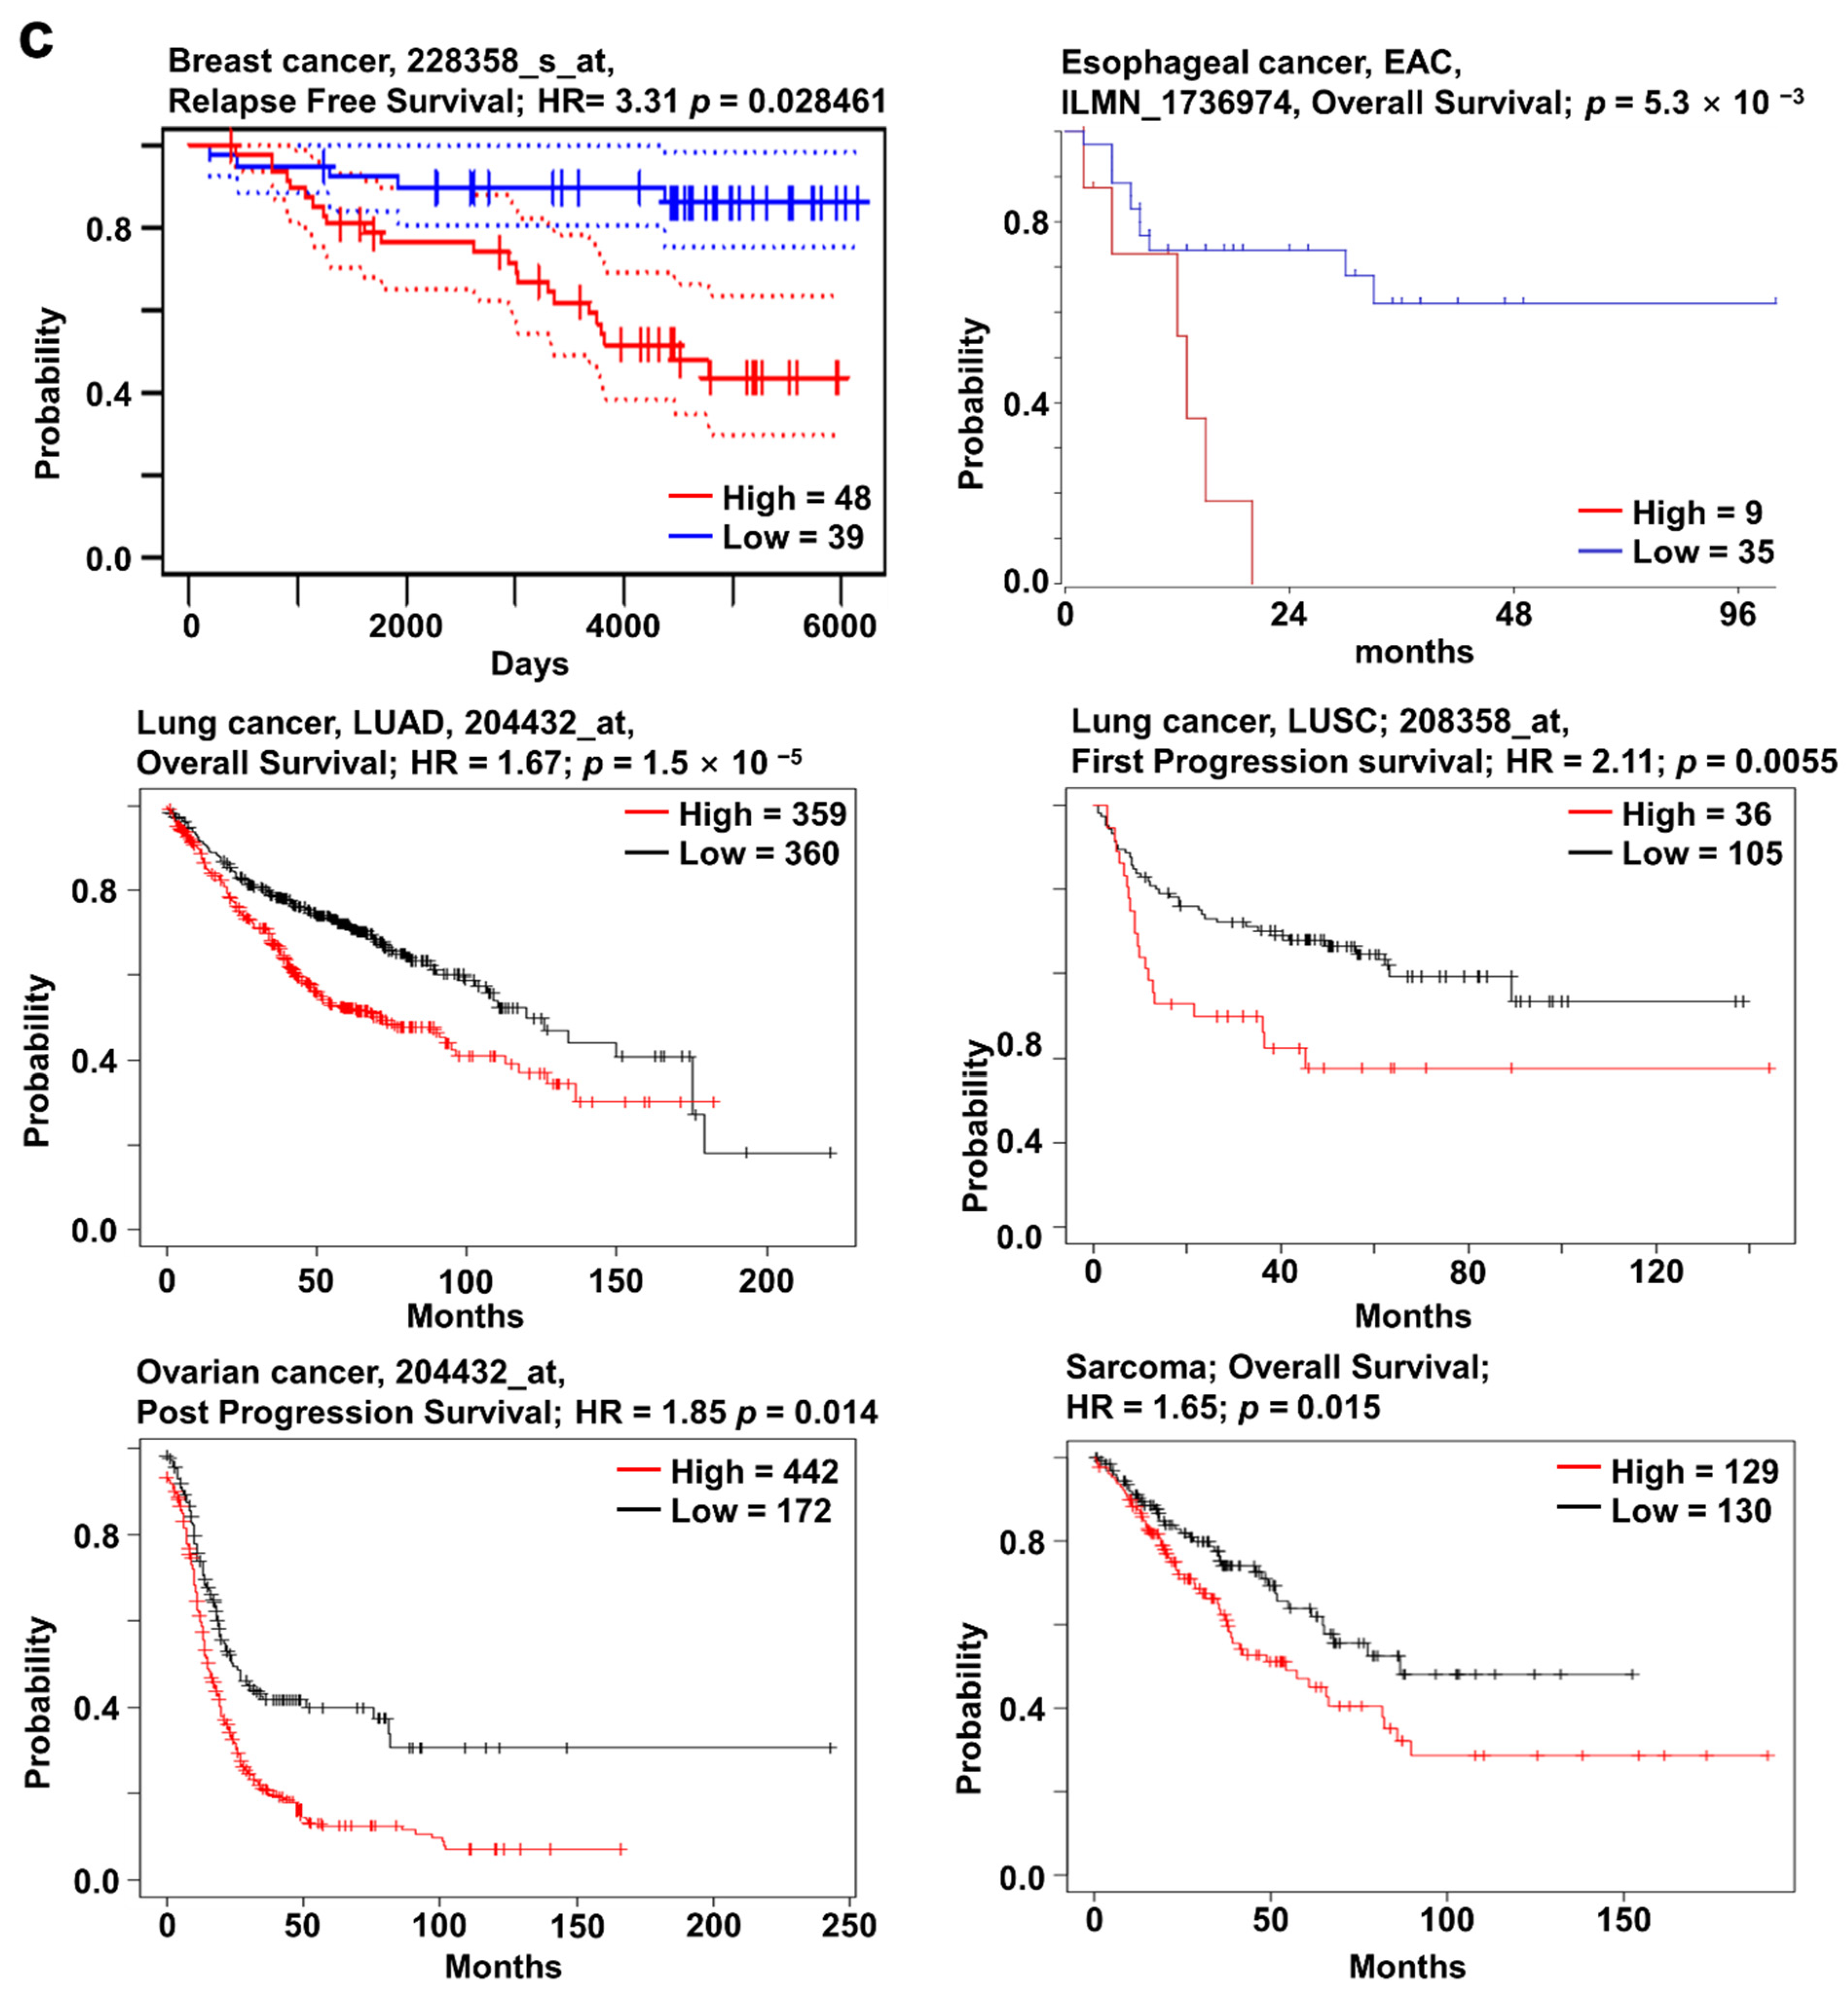
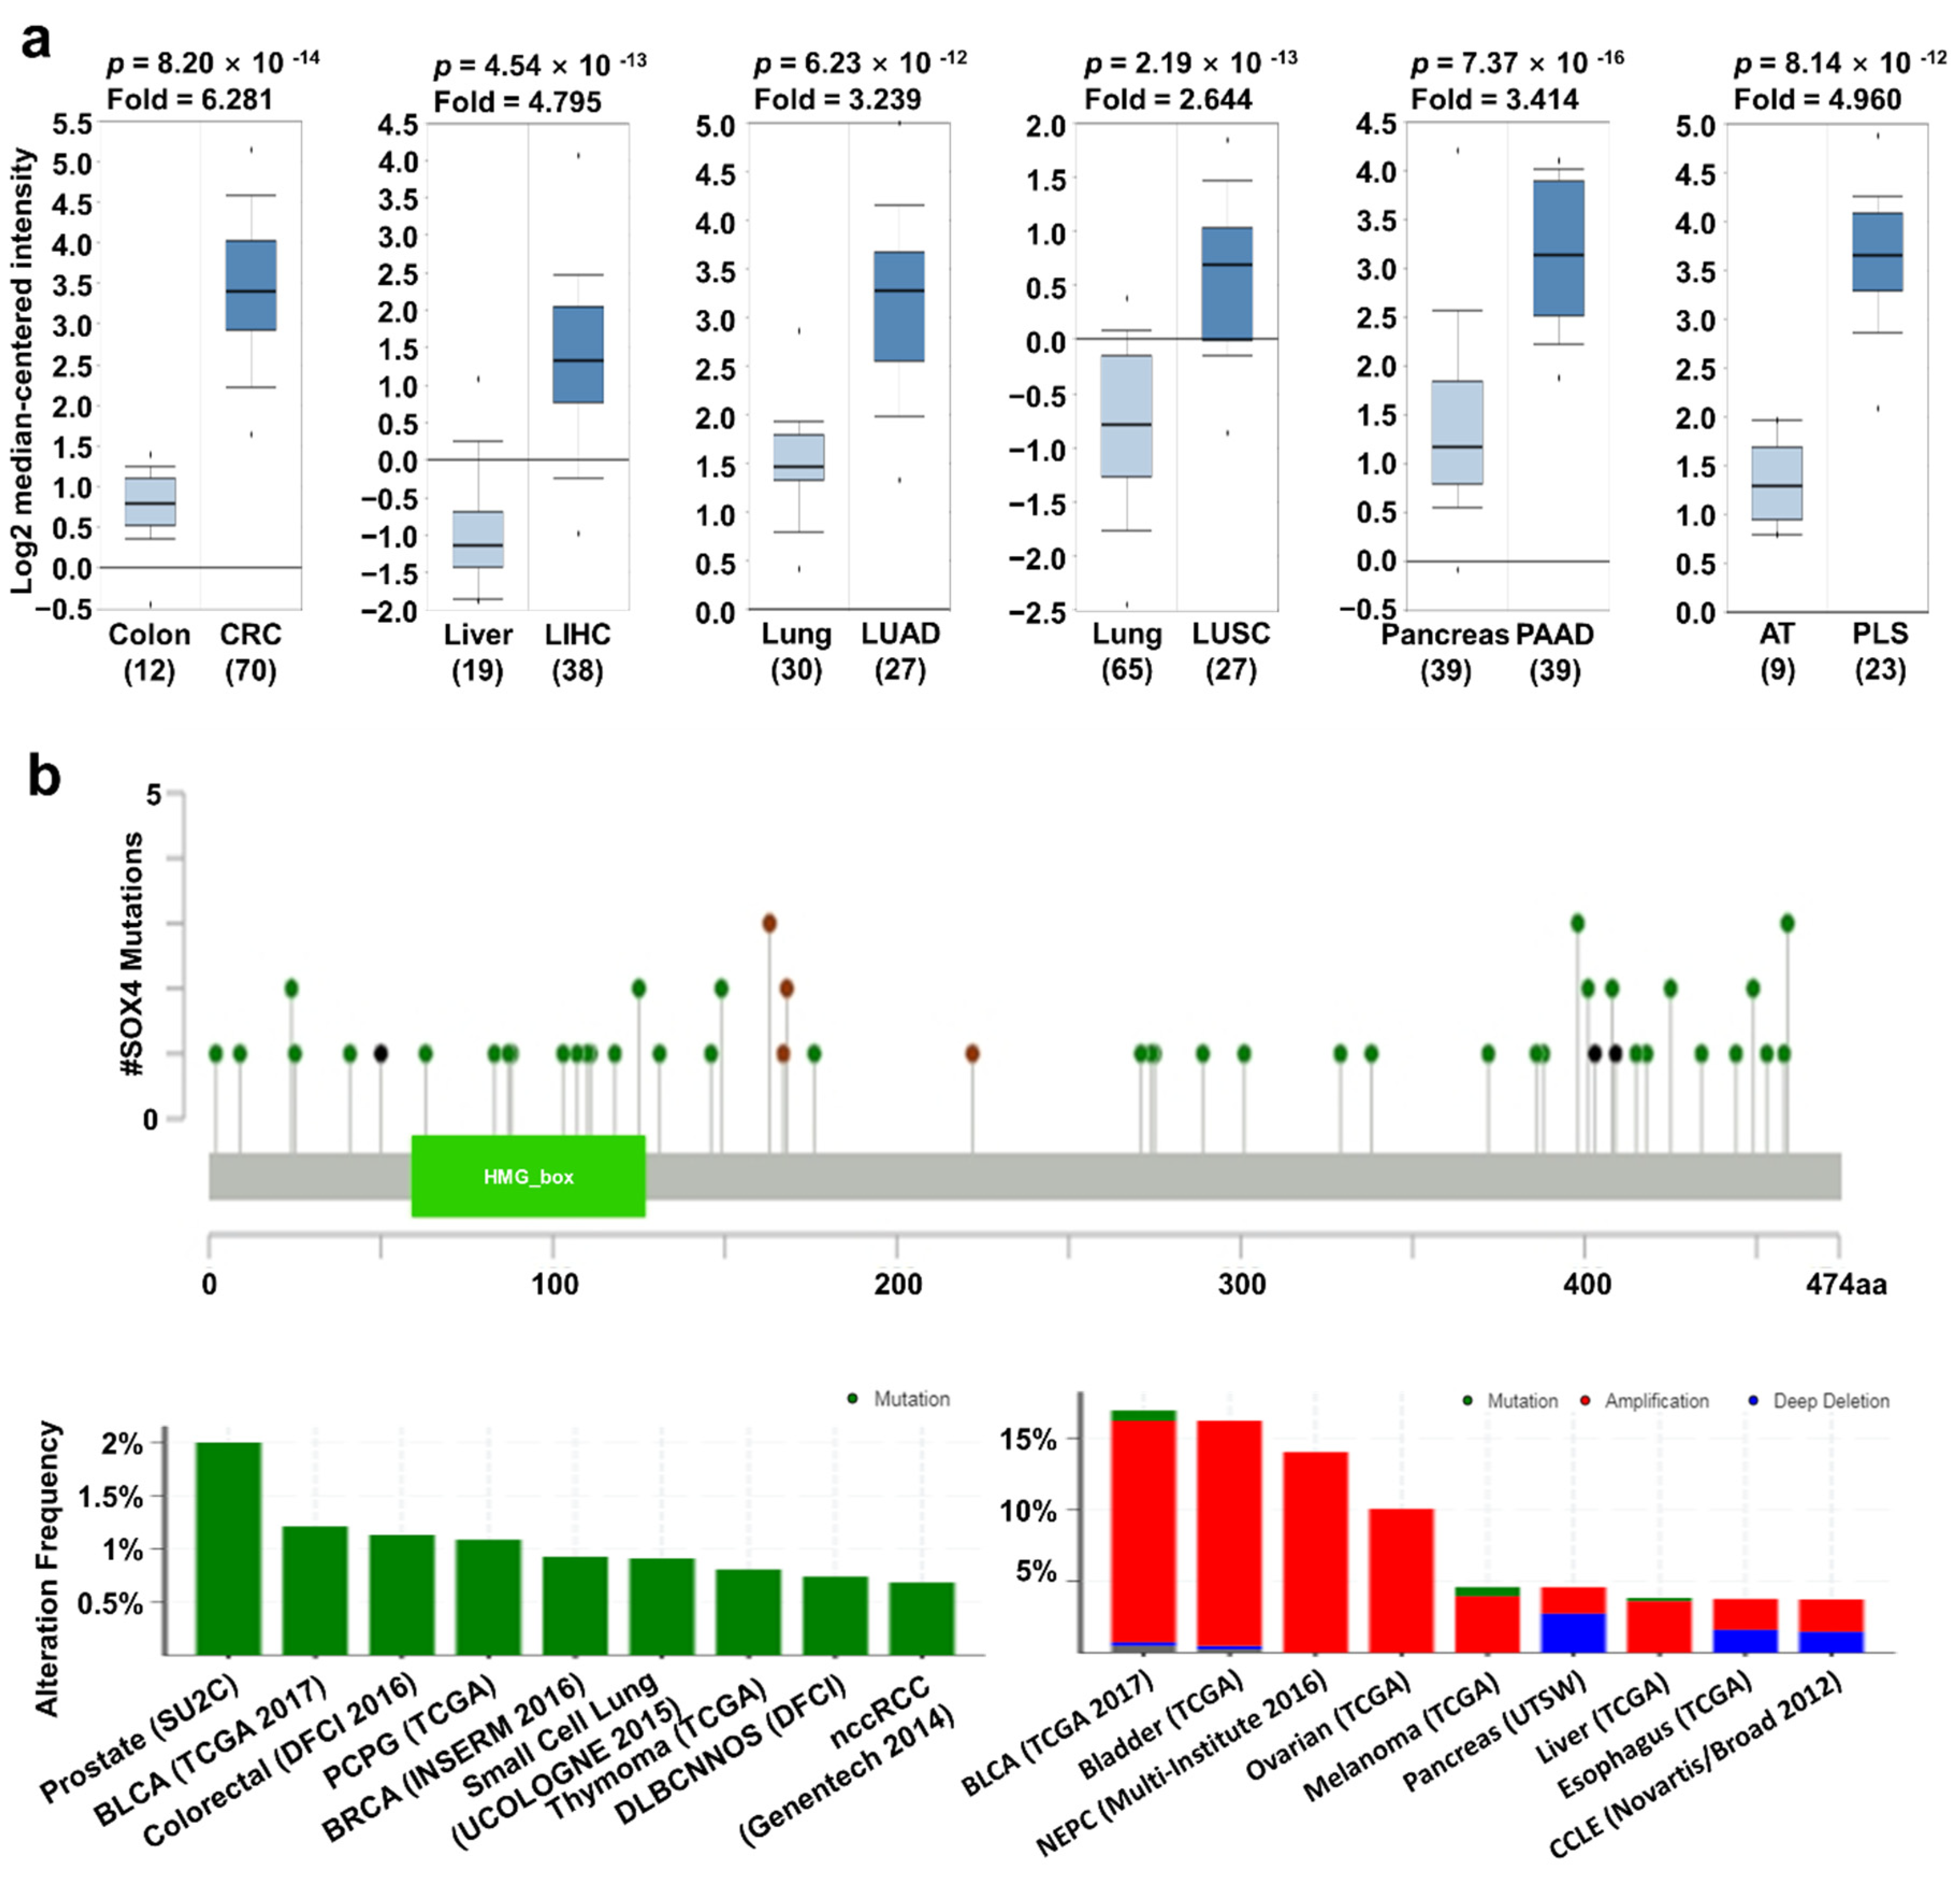
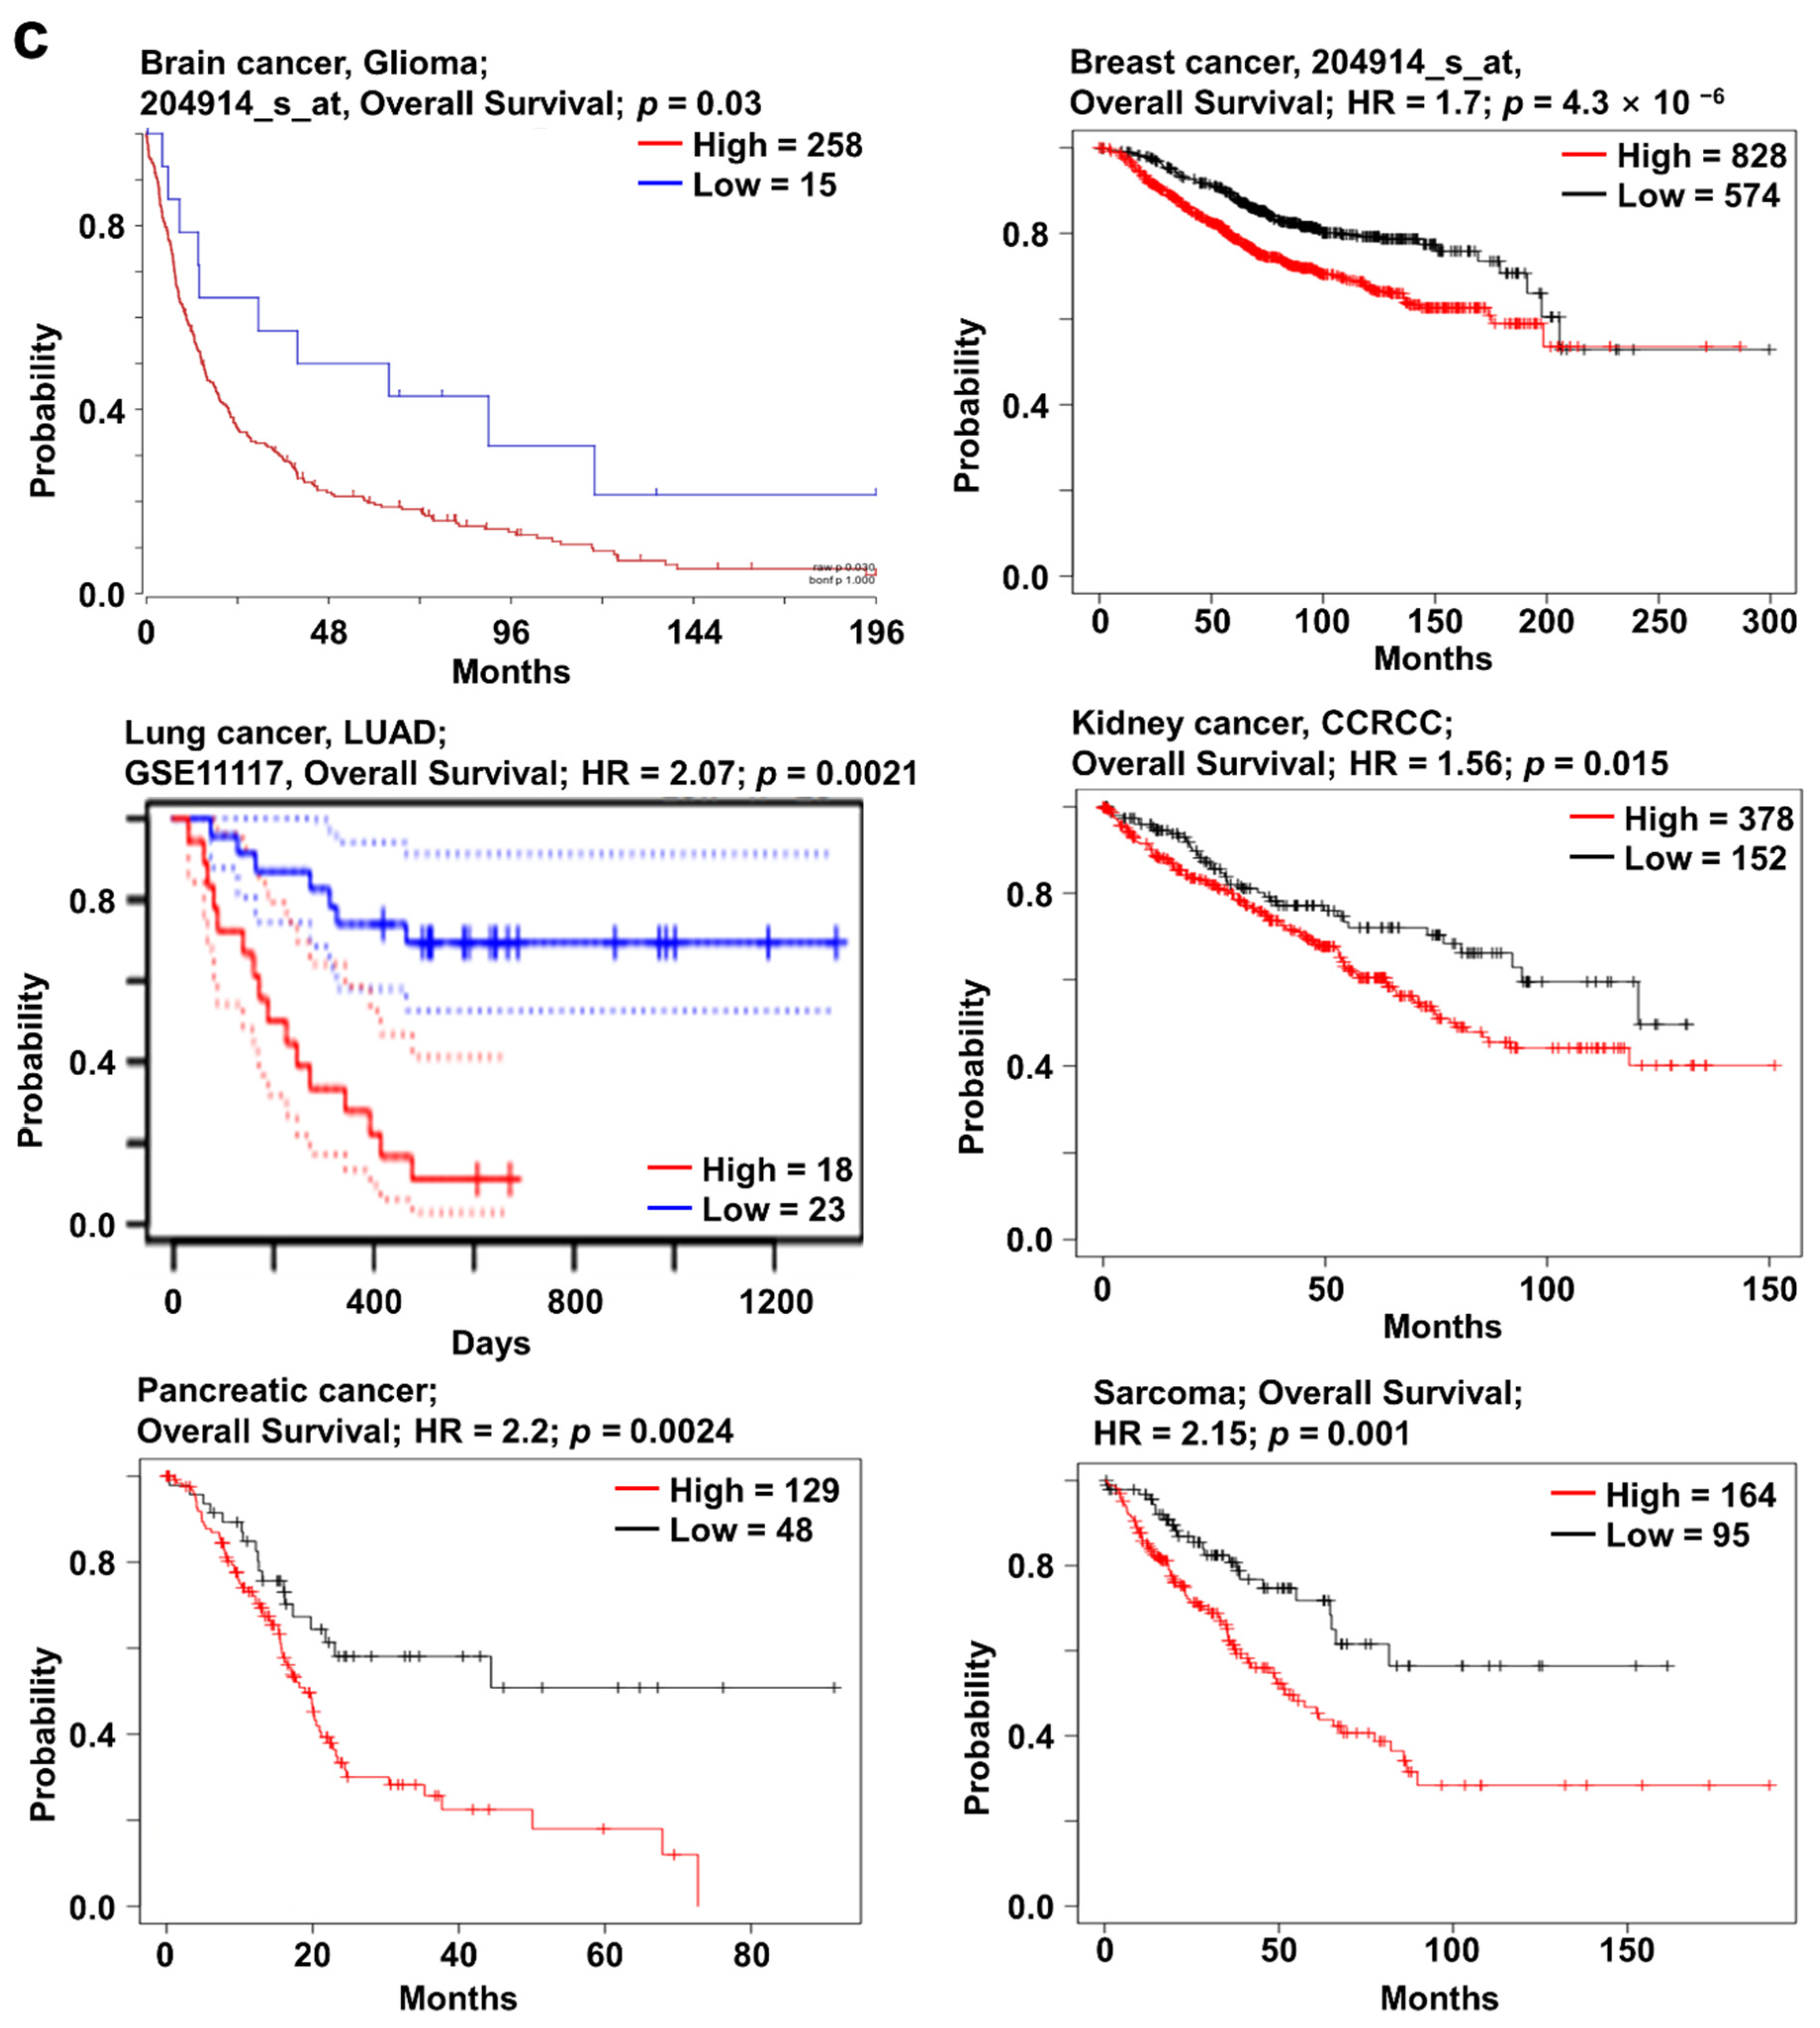
2.2. SOX4 Expression and Its Prognostic Value in Various Cancers

In the Oncomine database, SOX4 expression was upregulated in most types of cancer except melanoma and ovarian cancer (Figure 1a). In addition, the relative mRNA expression of SOX4 in breast, liver, ovarian, pancreatic, and thyroid cancer as well as sarcoma datasets in the Oncomine database, was visualized (Figure 2a). We also found the expression of SOX4 were significantly upregulated regardless of the stage of cancer including COAD, LIHC, LUAD, and LUSC (Supplementary Figure S3a). To investigate the protein expression level of SOX4, we accessed the CPTAC dataset using the UALCAN database (Preston, Lancashire, UK). In the CPTAC dataset, protein expression of SOX4 was highly increased in breast cancer, uterine corpus cancer, and lung cancer (Supplementary Figure S2a). These results indicated that the mRNA and protein expression levels of SOX4 were higher in three types of cancer tissues than in these neighboring normal tissues. Next, the mutation and copy number alterations of SOX4 were examined in various cancer types using the cBioPortal database (version 3.7.2, MSKCC, New York, NY, USA) (Figure 2b). The locations of mutations in SOX4 were distributed widely across the coding region. The alteration frequency of SOX4 was determined in various types of cancers. The results showed that SOX4 mutations were present in several cancer types, particularly in prostate and bladder cancer, with alteration frequencies of approximately 2% and 1.2%, respectively. Additionally, the alterations in SOX4, such as mutation, amplification, and deep deletion, showed a high percentage in various cancer types, including bladder, prostate, and ovarian cancer datasets, with alteration frequencies of 17%, 16%, and 14%, respectively. Further, the association between mRNA expression and clinical outcome was analyzed to determine the prognostic value of SOX4 expression in patients with various cancers, using the online survival analysis tools such as the Kaplan–Meier plotter (Balazs Gyorffy, Budapest, Hungary), PrognoScan (Kyushu Institute Technology, Kyushu, Japan), and R2 databases (the Academic Medical Center (AMC), Amsterdam, the Netherlands). In these databases, a positive correlation between SOX4 expression and poor patient survival was observed in colon, liver, lung, and pancreatic cancers, as well as sarcoma (Figure 2c). Overall, these results showed that the expression of SOX4 was increased and correlated with poor patient survival in various cancers, including colon, liver, lung, and pancreatic cancers and sarcoma.

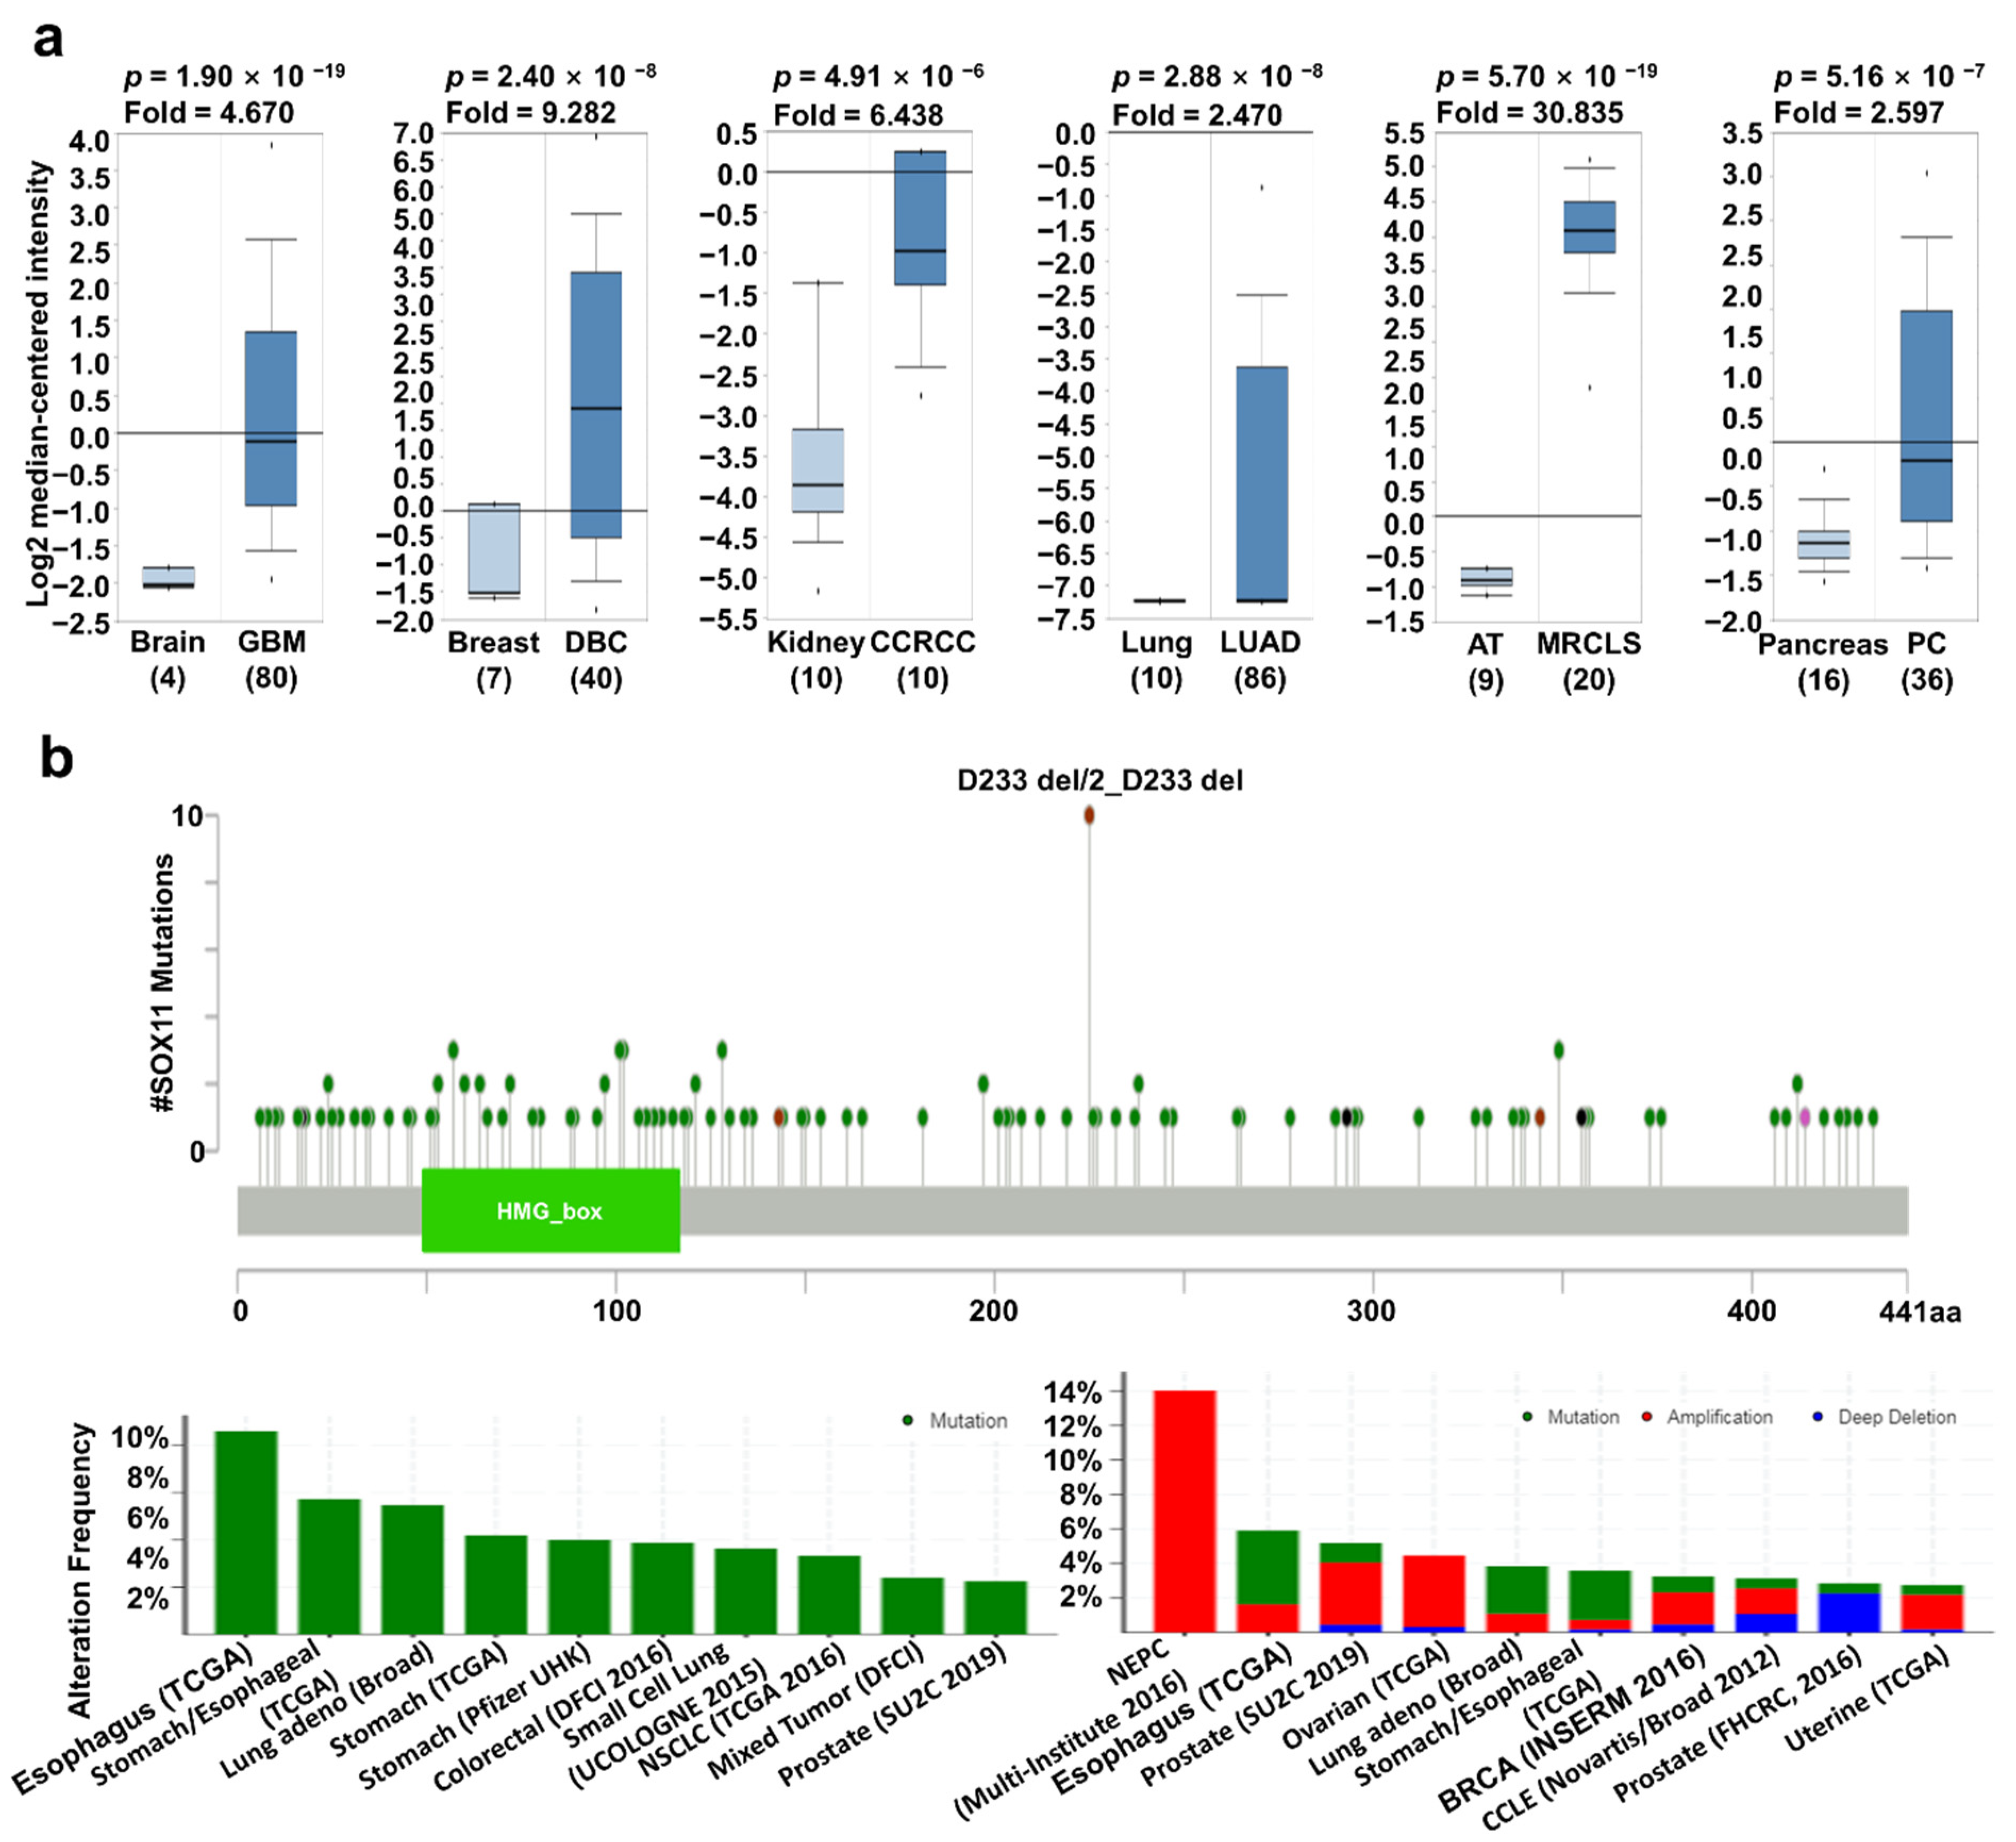
2.3. SOX11 Expression Pattern and Patient Survival in Various Cancers

It is well known that SOX11 expression may affect the progression of several types of cancers. Previously, elevated SOX11 expression was observed in various cancer types, including brain, breast, head and neck, and gastric cancers [18,19,26,27]. However, the correlation between SOX11 expression and patient survival has not yet been systematically investigated. The mRNA expression of SOX11 was significantly higher in brain, breast, kidney, lung, and pancreatic cancers as well as sarcoma (Figure 3a). In addition, SOX11 expression was significantly higher according to the stage of cancer, including BRCA, KIRC, and LUAD, than adjacent normal tissue from TCGA database using the UALCAN (Supplementary Figure S3b). Mutations in SOX11 frequently occurred in esophageal, stomach, and lung cancers with D233 del/2_D233 del hotspot. In addition, the highest alteration frequency (14%) was observed in neuroendocrine prostate cancer (NEPC), wherein amplification was the major form of alteration (Figure 3b). Analysis of the correlation of survival and SOX11 expression using Kaplan–Meier plotter, PrognoScan, and R2 databases revealed significantly higher survival in the low SOX11 expression group of cancer patients than in the high expression group (Figure 3c). These results suggest that upregulation of SOX11 is correlated with poor prognosis in various types of cancer.

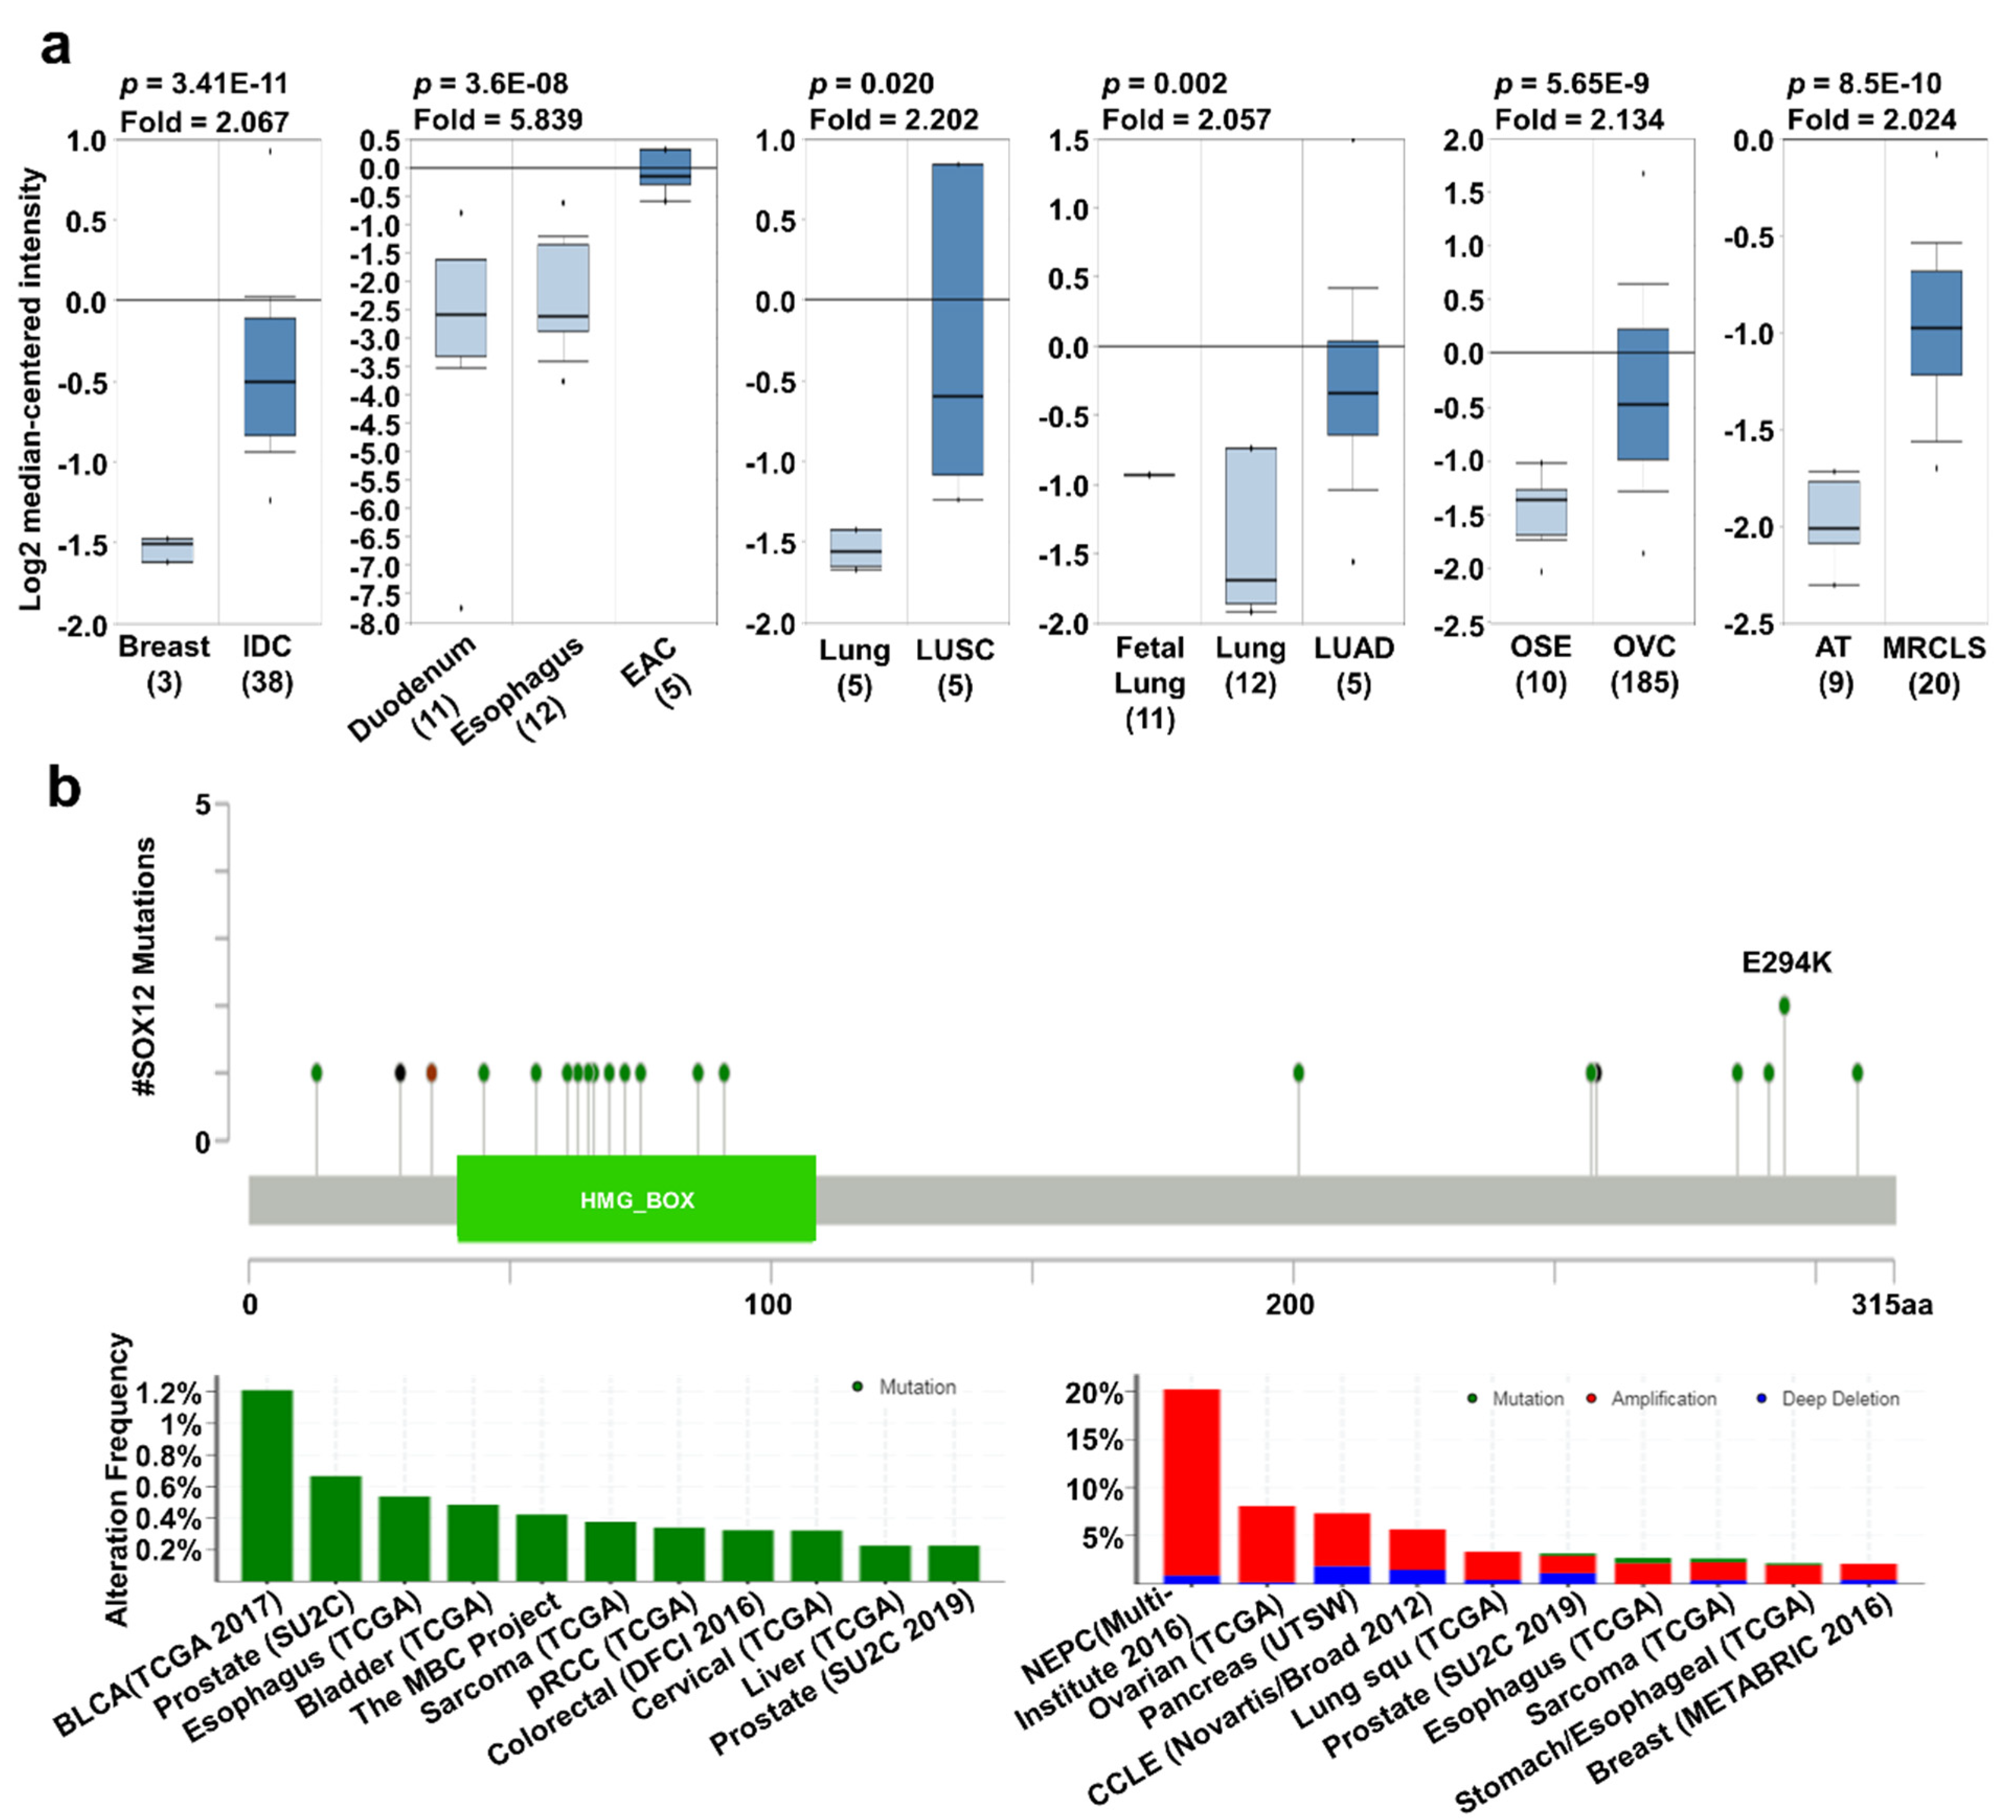
2.4. SOX12 Expression Pattern and Patient Survival in Various Cancers

SOX12 has been actively studied in recent years and is known to affect cancer characteristics. For example, the upregulation of SOX12 has been reported to promote cancer proliferation or migration in colorectal, lung, liver, gastric, and breast cancers [20,22,24,28,29]. Increased SOX12 expression was observed in breast, esophageal, lung, and ovarian cancers as well as sarcoma, compared to that in their corresponding normal tissues, using the Oncomine database (Figure 4a). In addition, the mRNA expression of SOX12 was significantly upregulated in BRCA, ESCA, LUSC, and LUAD regardless of the cancer stage compared to their normal tissues (Supplementary Figure S3c). SOX12 mutation mainly occurred in bladder cancer with a hot spot of E294K, but there were a few comparable differences with the other cancer types. Moreover, alterations in SOX12 were the highest in neuroendocrine prostate cancer, with an alteration frequency of 20% (Figure 4b). Survival curve analysis, using the PrognoScan, Kaplan–Meier plotter, and R2 databases, showed that the high-expression group had a significantly lower survival rate than the low-expression group (Figure 4c). Overall, these data suggest that the regulation of SOX12 expression in several types of cancers is significantly related to patient survival.

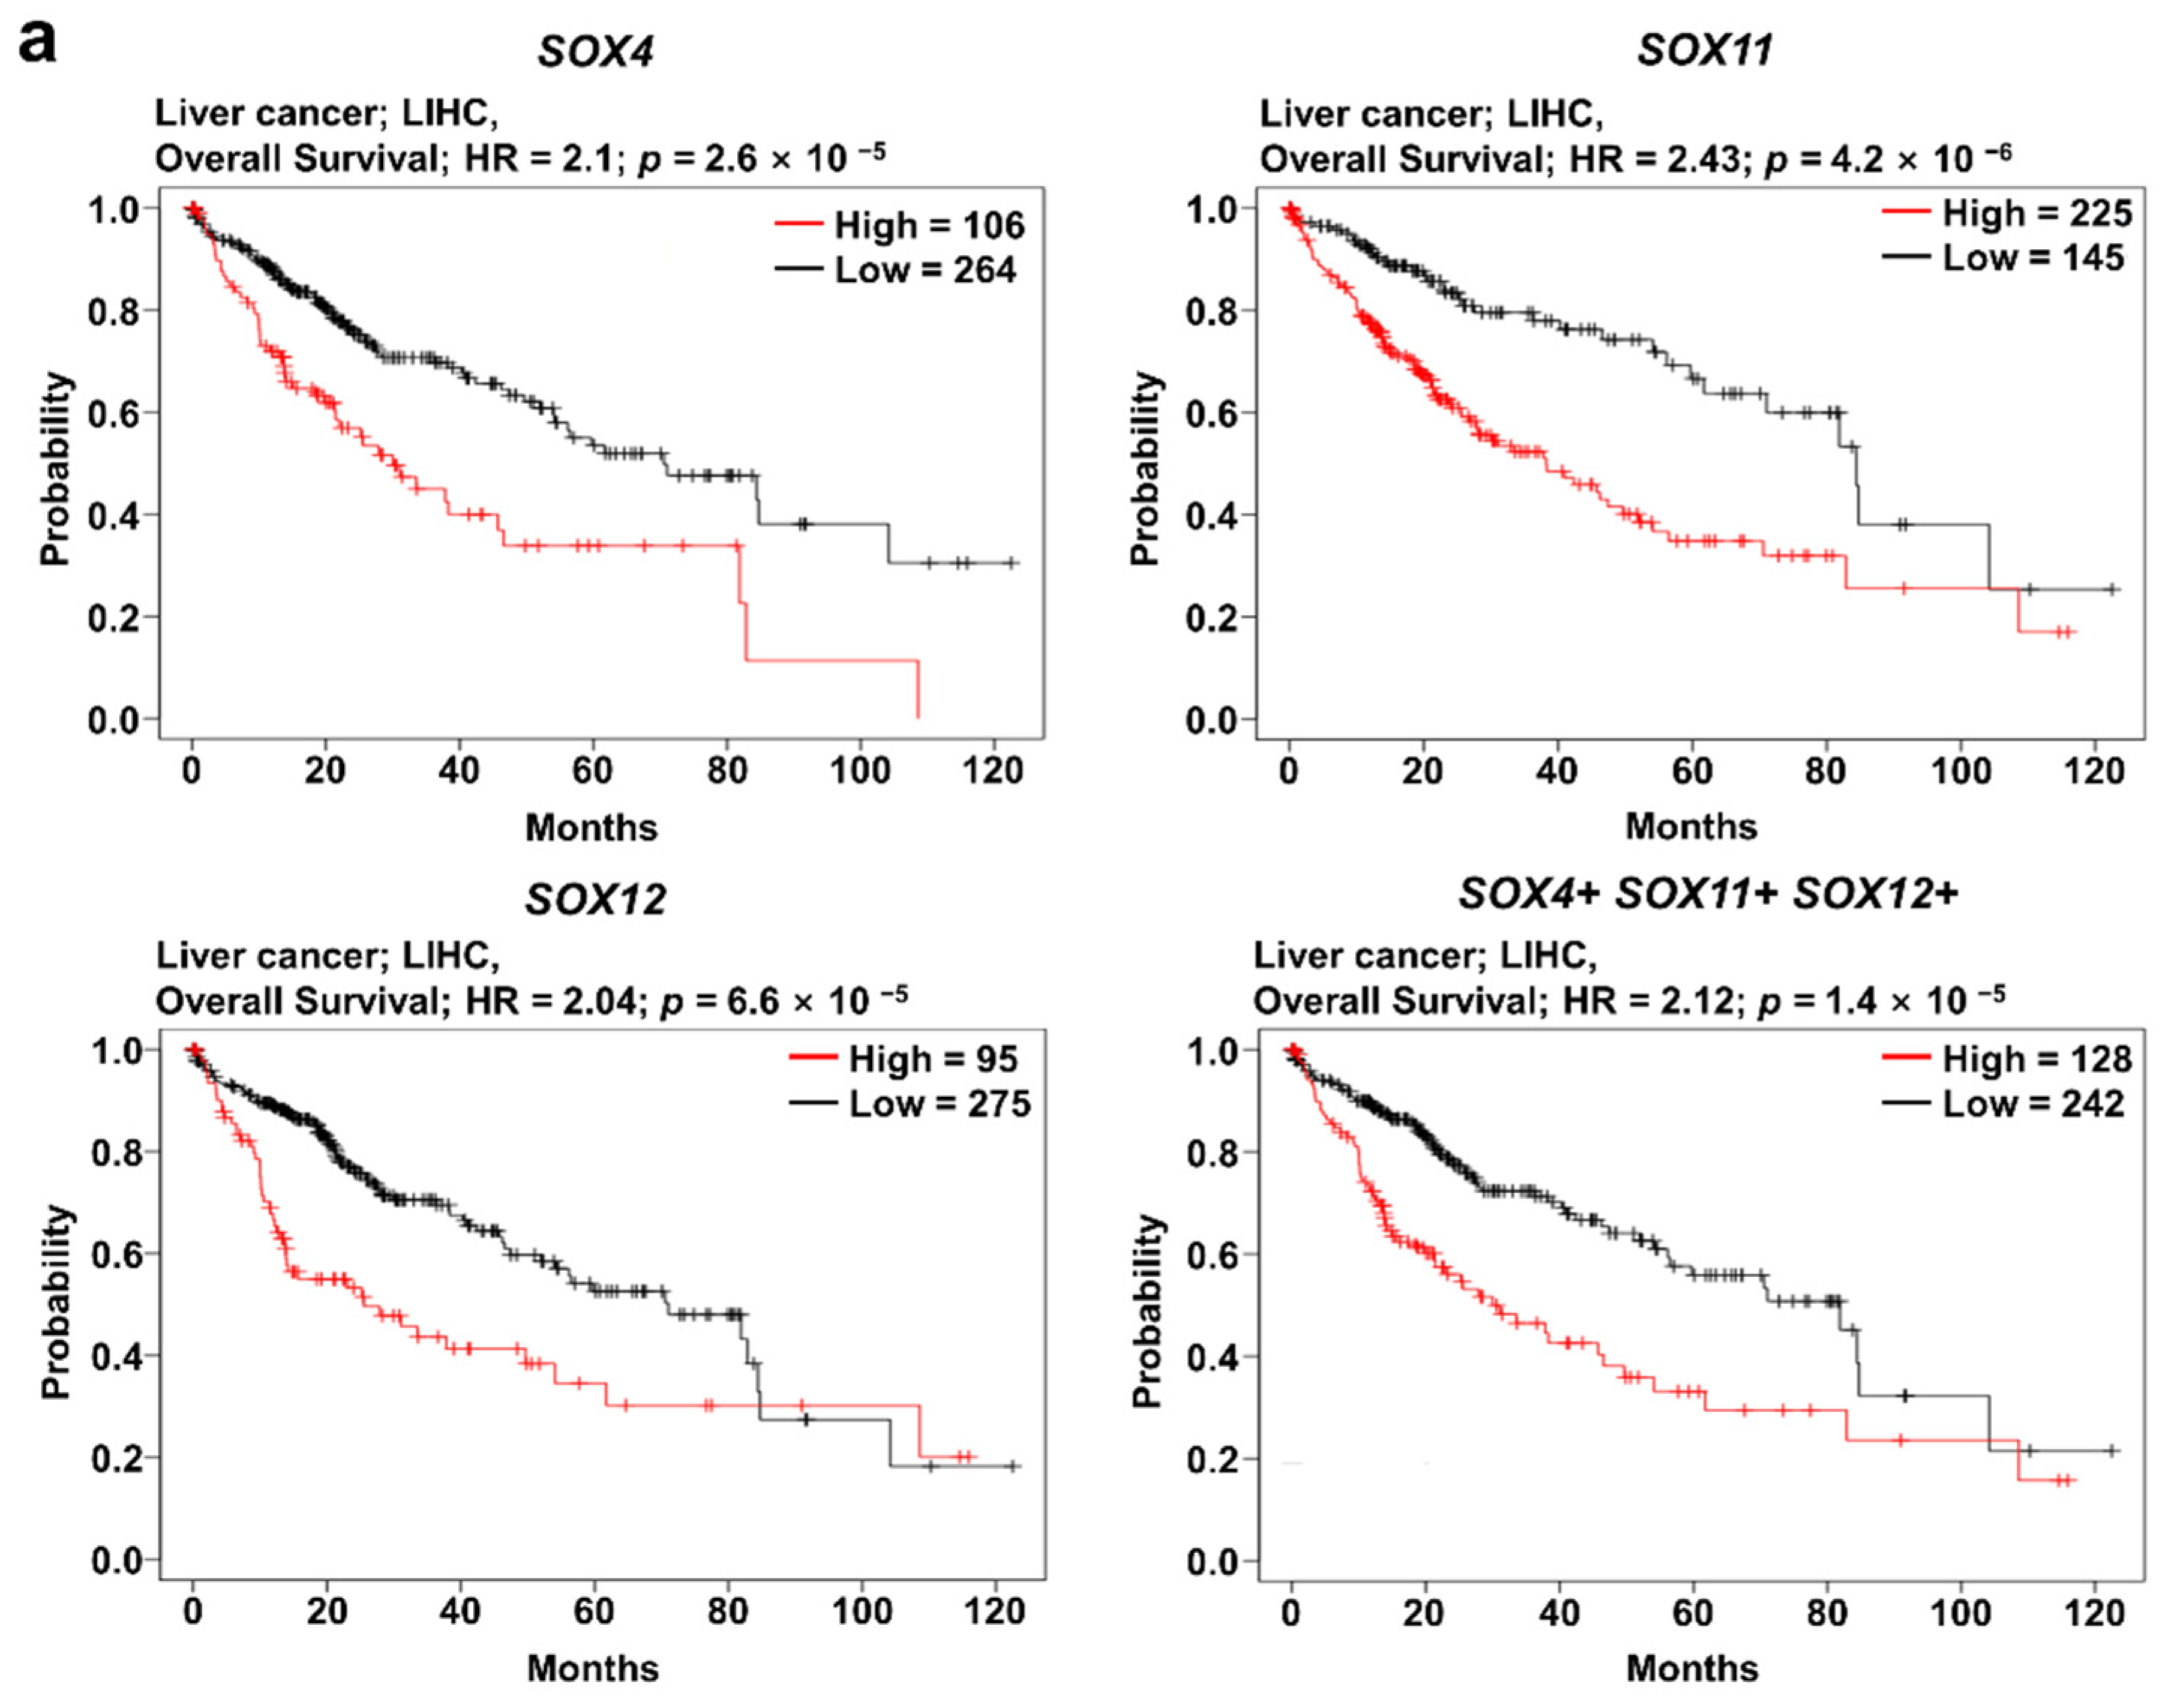
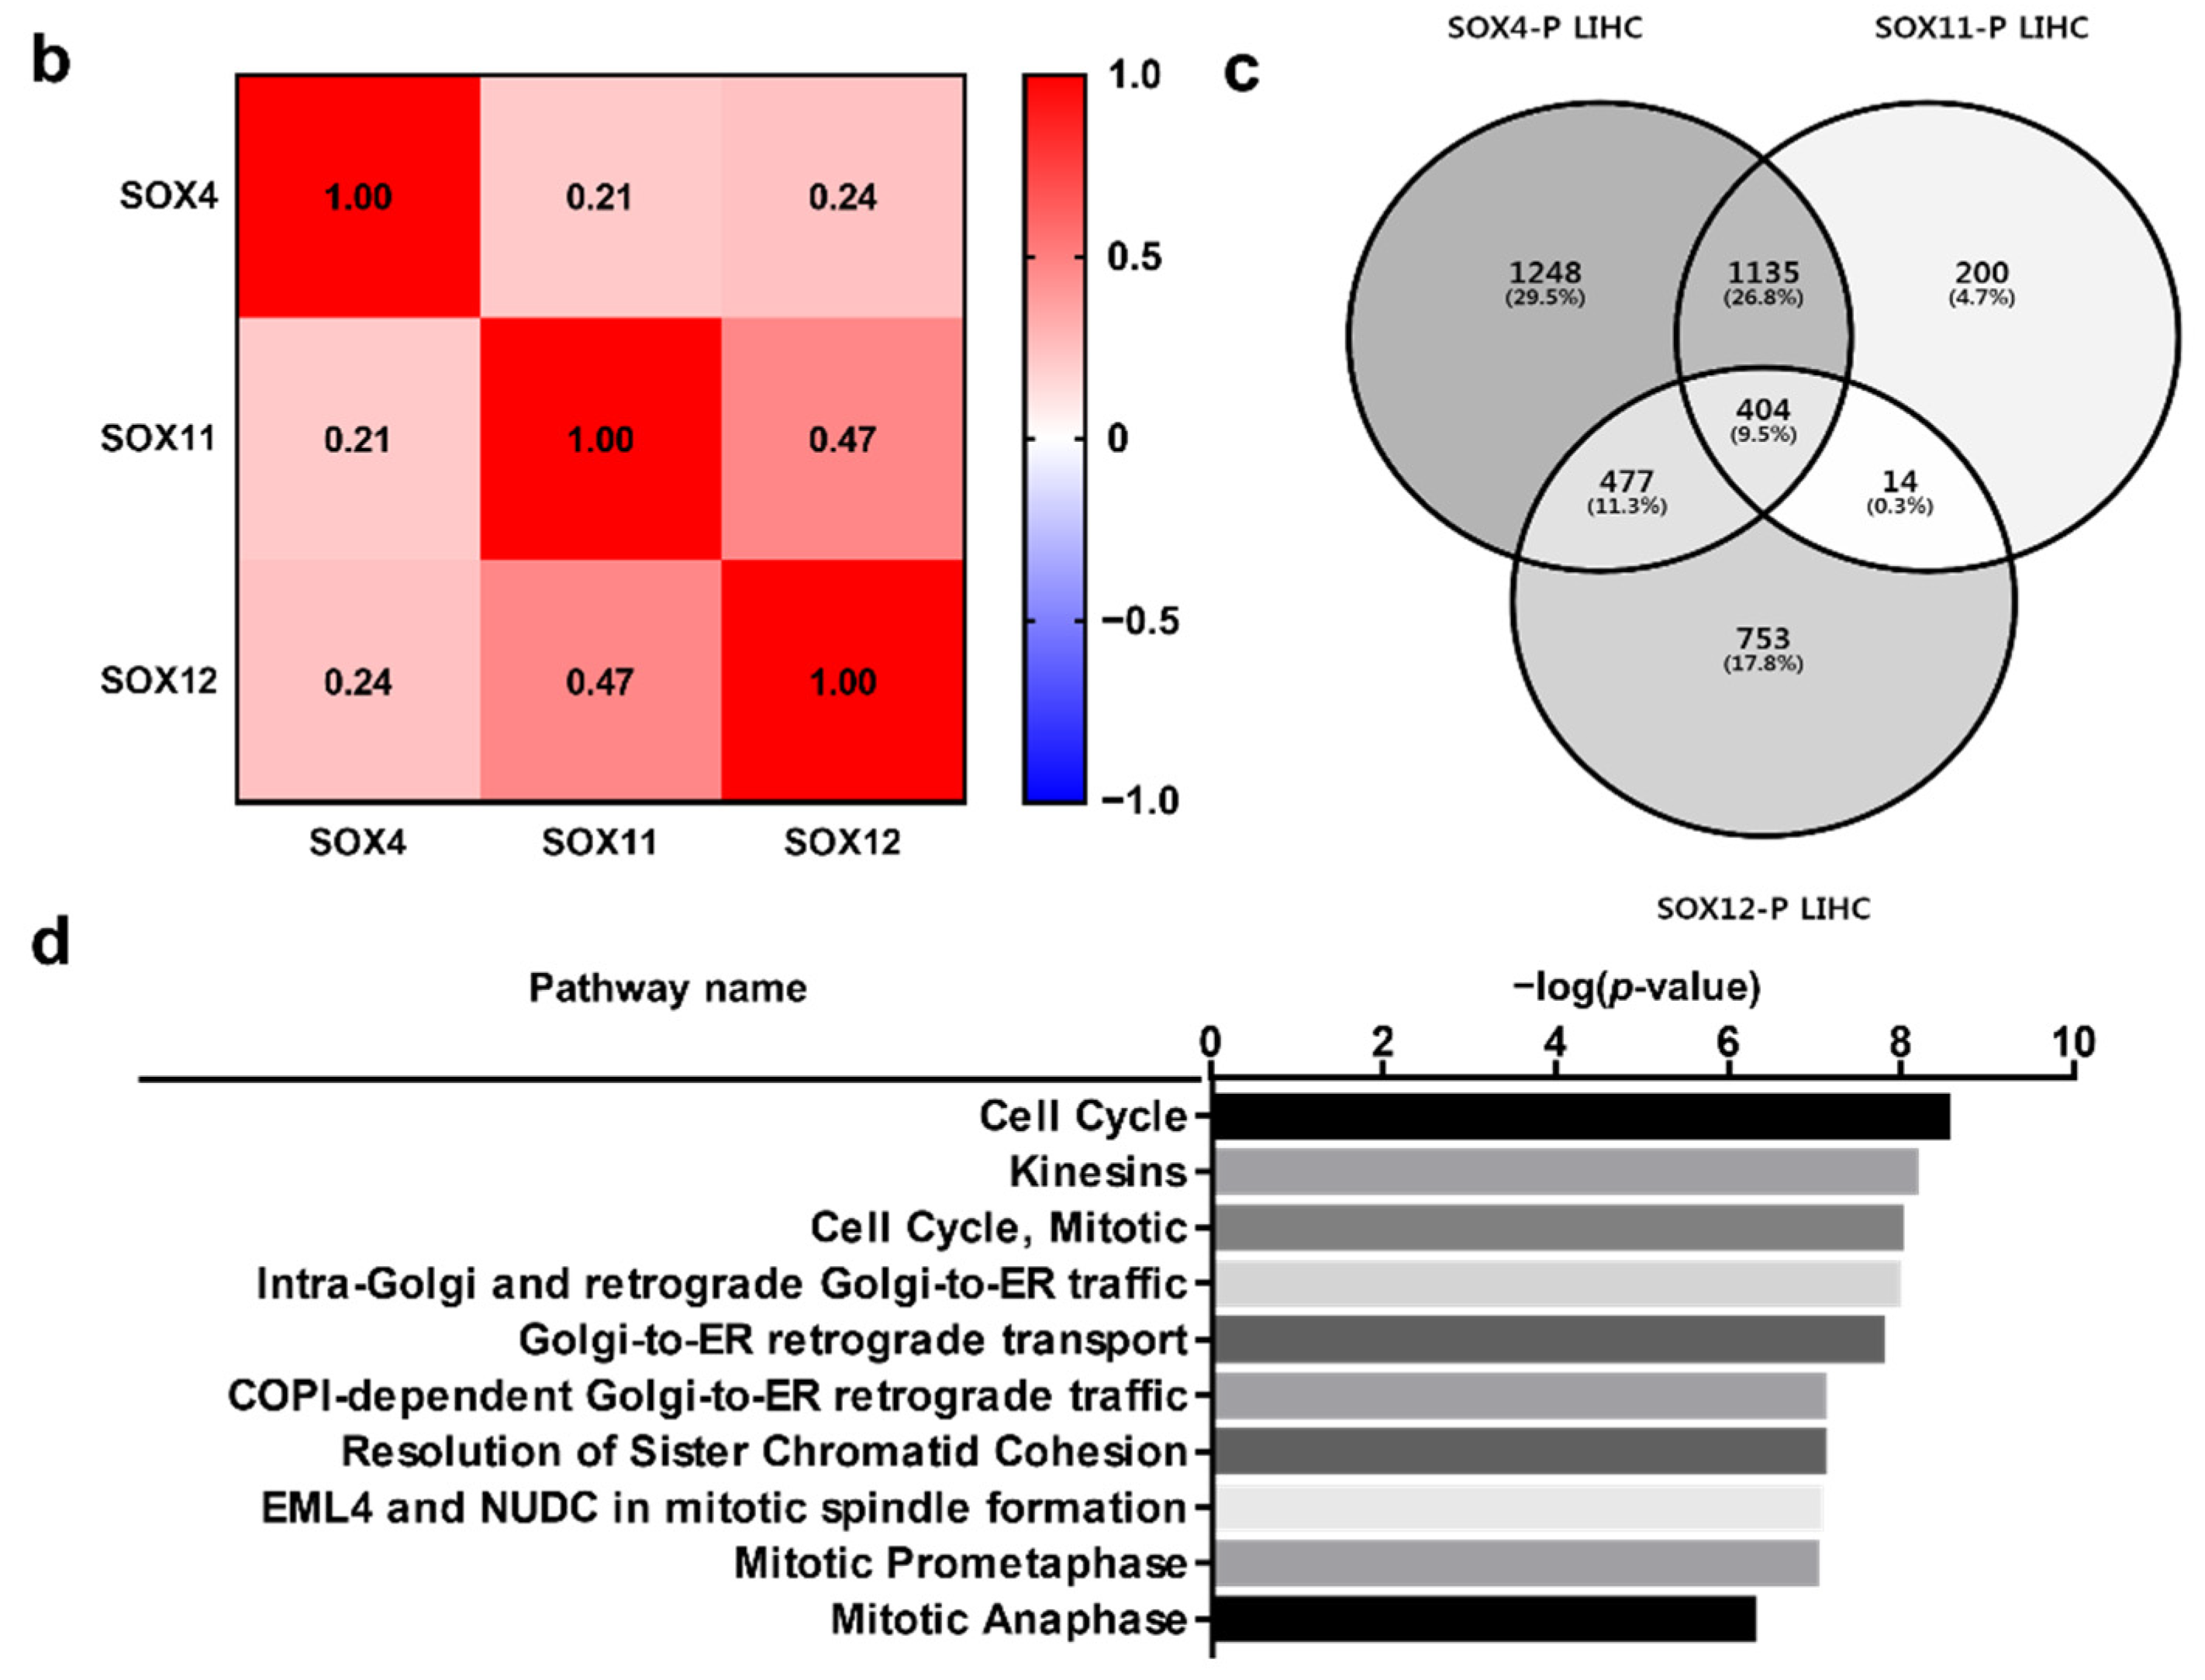
2.5. Clinical Prognosis of the Three SOX Genes in Liver Cancer

The analysis of SOX4, SOX11, and SOX12 expression revealed that their expression was correlated with patient survival in several types of cancers. To investigate the correlation between clinical prognosis and the co-expression of SOX4, SOX11, and SOX12, we used the Kaplan–Meier plotter database, wherein the overall survival of patients was compared between the two groups, classified based on the average expression level of the three SOX genes. Survival plot analysis of the three SOX genes was performed using pan-cancer RNA sequencing datasets in the Kaplan–Meier plotter. In this study, we found that co-expression of the three SOX genes in liver cancer was significantly related to poor overall survival of patients, indicating negative correlation of each SOX gene with overall survival (Figure 5a). Next, to investigate the correlation between expression of the three SOX genes in liver cancer, we examined their transcriptomic datasets in TCGA database using the cBioPortal platform. Correlation heatmap analysis was performed using the Pearson score of the three SOX genes (Figure 5b). The three SOX genes showed positive correlation with each other in the liver hepatocellular carcinoma dataset (TCGA-LIHC). To examine commonly related pathways of the three SOX genes, positively and negatively co-altered genes of each SOX gene in TCGA-LIHC dataset were retrieved and 404 commonly positively co-altered genes (Figure 5c) and 318 negatively co-altered genes (Supplementary Figure S1a) between the three SOX genes were represented by a Venn diagram. The Reactome pathway analysis with positively commonly correlated genes among the three SOX genes revealed pathways related to the cell cycle and Golgi to ER transport (Figure 5d). In the pathway analysis with commonly downregulated genes, certain correlated genes were classified in metabolic pathways, including metabolism of lipids, amino acids, and other macromolecules (Supplementary Table S1). Overall, these results suggest that the three SOX genes are commonly correlated with patient survival and are associated with several key pathways involved in cancer progression.

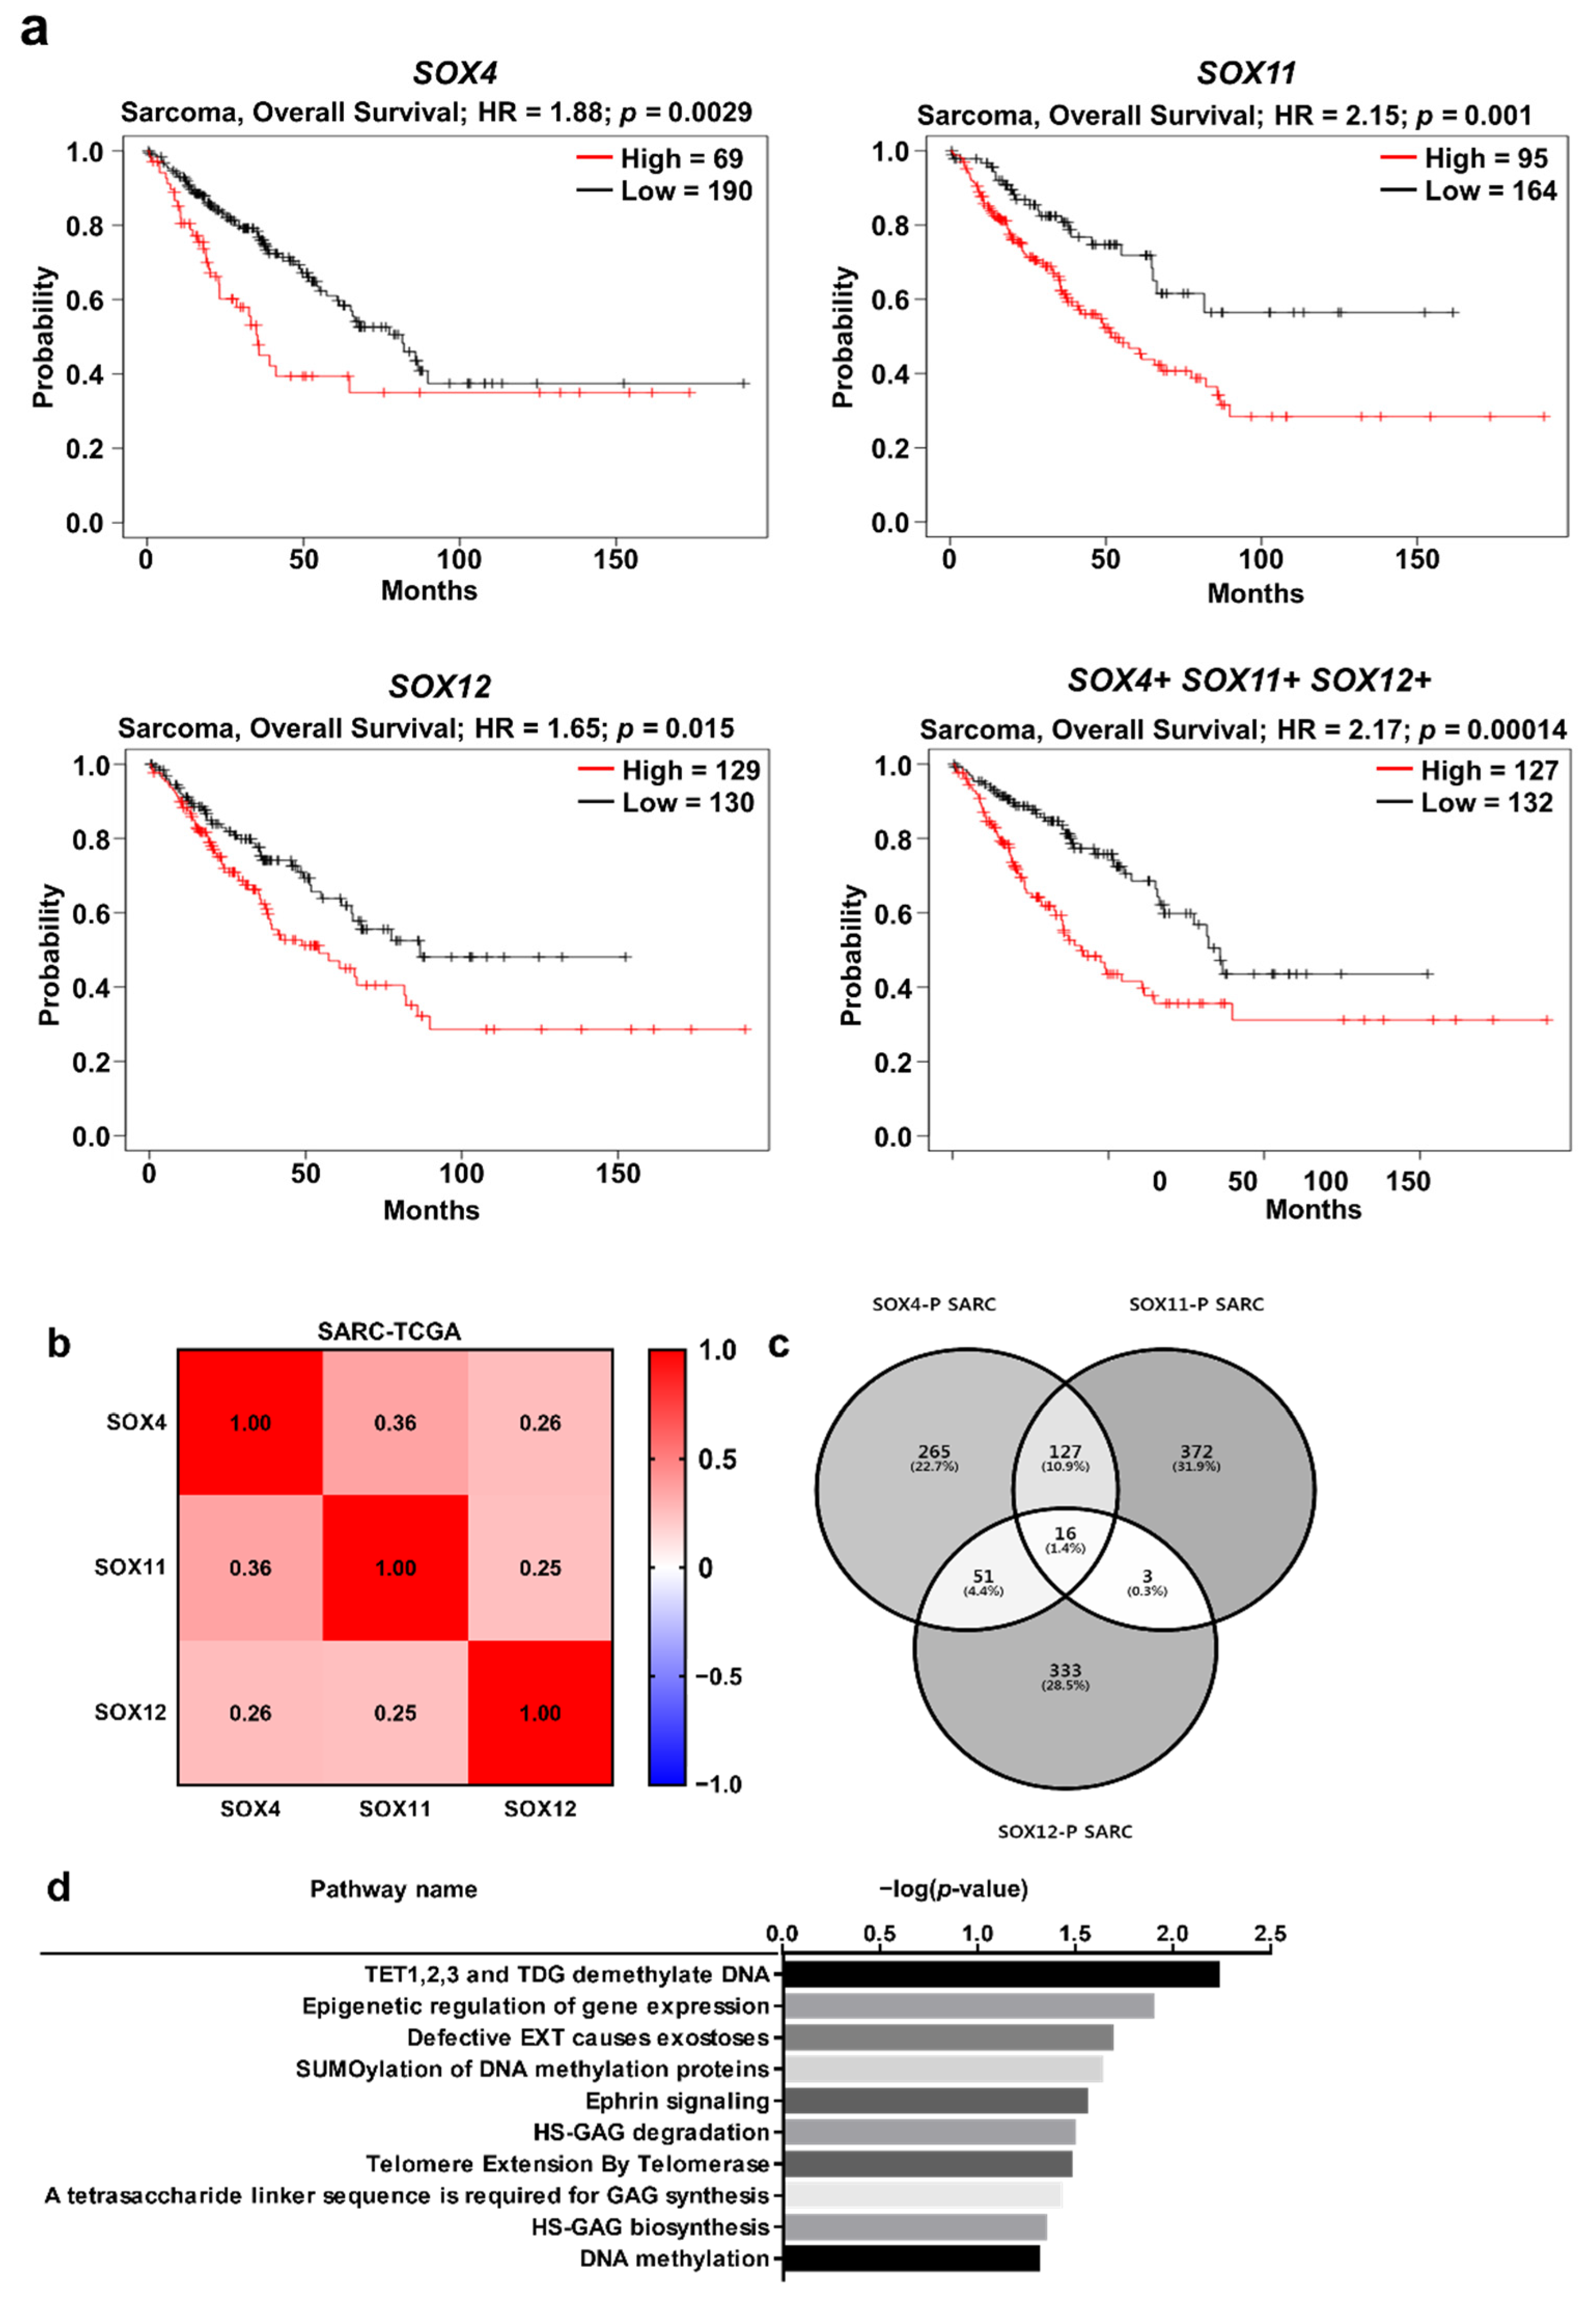
2.6. Clinical Prognosis of the Three SOX Genes in Sarcoma

Furthermore, we examined the prognostic value of co-expression of the three SOX genes in sarcoma. The overall survival of patients was significantly correlated with the co-expression of the three SOX genes, as well as the expression of individual SOX genes (Figure 6a). Survival analysis with co-expression of SOX genes indicated a lower p-value (0.00014) than the p-values (0.0029, 0.01, and 0.015, respectively) of individual SOX genes, thereby suggesting a stronger prognostic value of co-expression of the three SOX genes than individual SOX expression. Subsequently, to investigate the correlation of all SOXC members in sarcoma, we examined the transcriptome datasets of sarcomas using TCGA database through the cBioPortal platform. In the heatmap analysis using Pearson score, we found that the three SOX genes were positively correlated with each other in the sarcoma dataset (TCGA-SARC) (Figure 6b). Next, we aimed to identify commonly related pathways involving the three SOX genes that might play an oncogenic role in sarcoma. To investigate the genes correlated with the three SOX genes, we found a co-altered gene set with each SOX gene from the TCGA-SARC dataset through the R2 platform, and commonly co-altered genes were represented by a Venn diagram (Figure 6c). Compared to those in liver cancer, only 16 genes were commonly upregulated with the three SOX genes in sarcoma, as indicated in the Venn diagram, while 9 genes were commonly negatively correlated (Supplementary Figure S1b). The total commonly correlated DEGs were classified using the Reactome pathway analysis (Version 76, Ontario Institute for Cancer Research, Toronto, ON, Canada), which revealed pathways related to DNA methylation, exostosis, ephrin signaling, glycosaminoglycan metabolism, and telomere extension (Figure 6d). In addition, the Reactome pathway analysis with commonly downregulated genes revealed ontology terms such as neurodegenerative disease, FOX-mediated transcription, and immune system, including interleukin-12 signaling (Supplementary Table S2). Taken together, expression of the three SOX genes could have prognostic value and might be associated with certain essential pathways related to the immune system, defective glucuronosyltransferase activity, and DNA methylation, which result sarcoma progression.

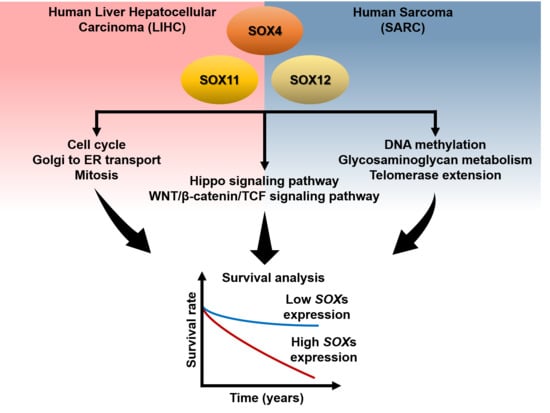
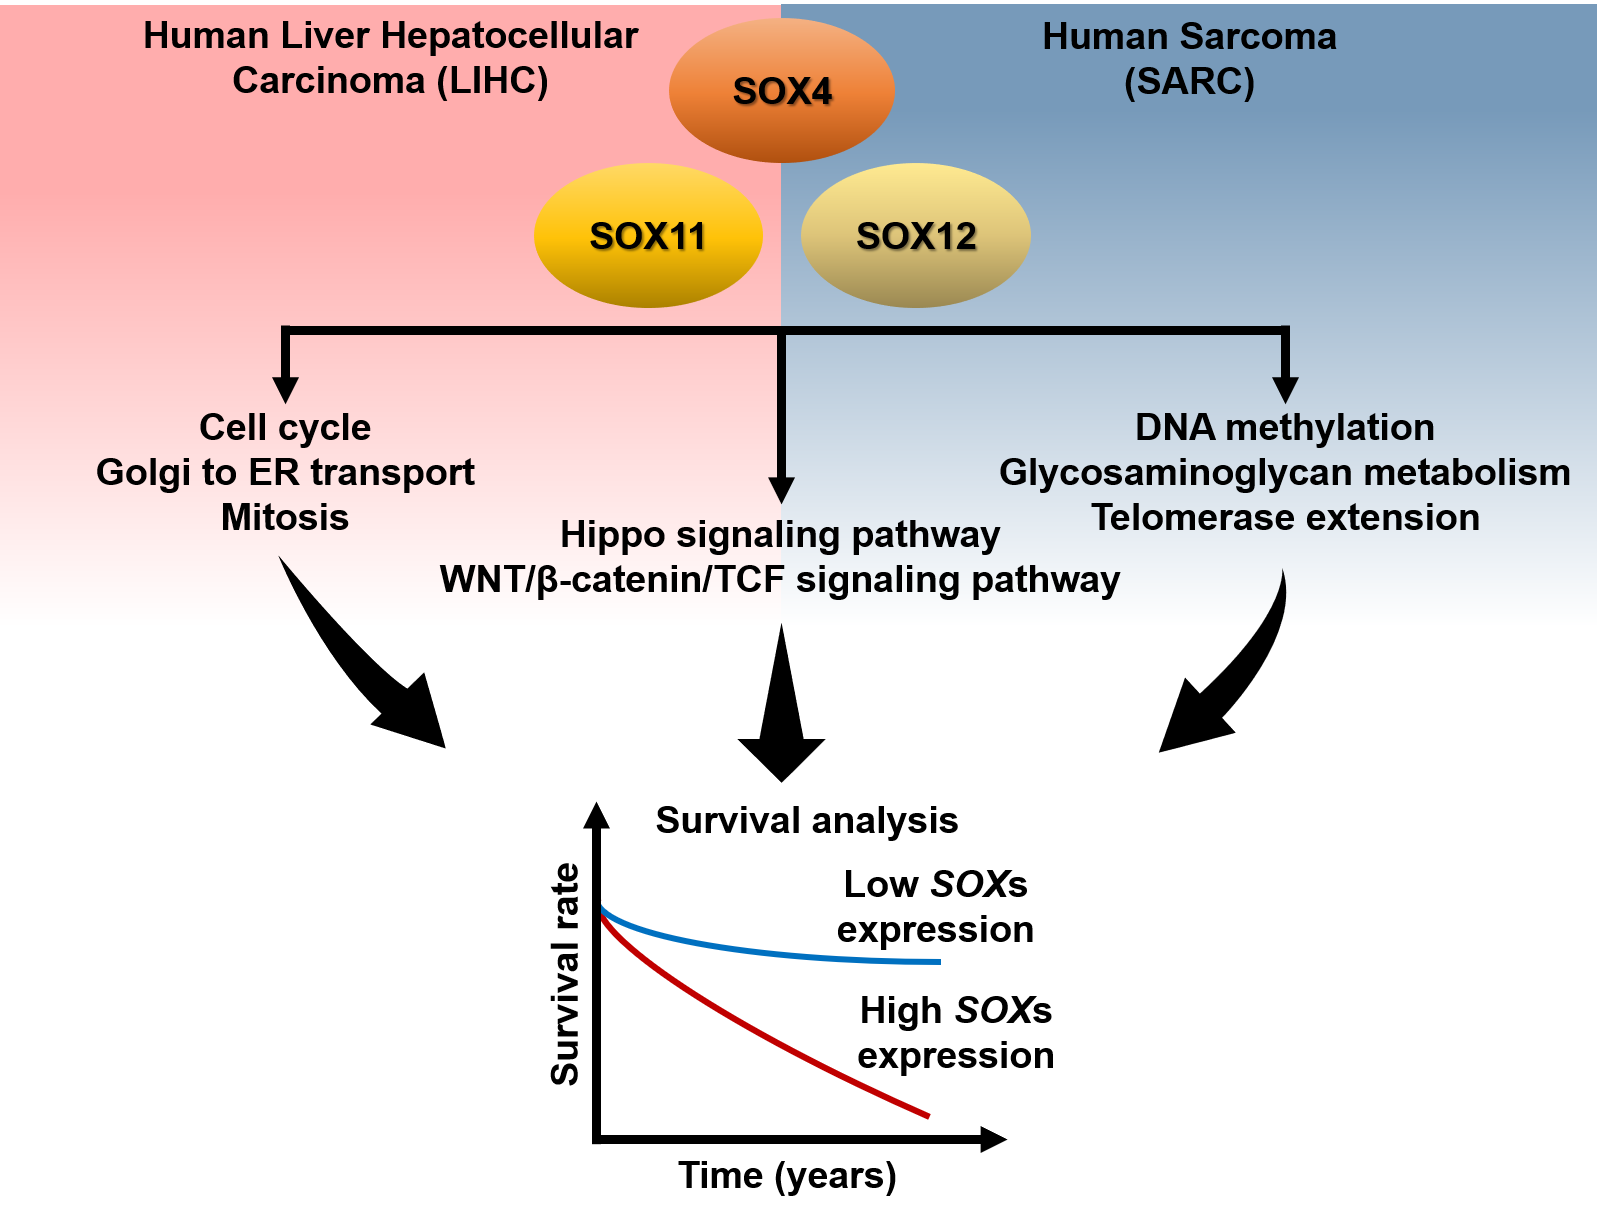
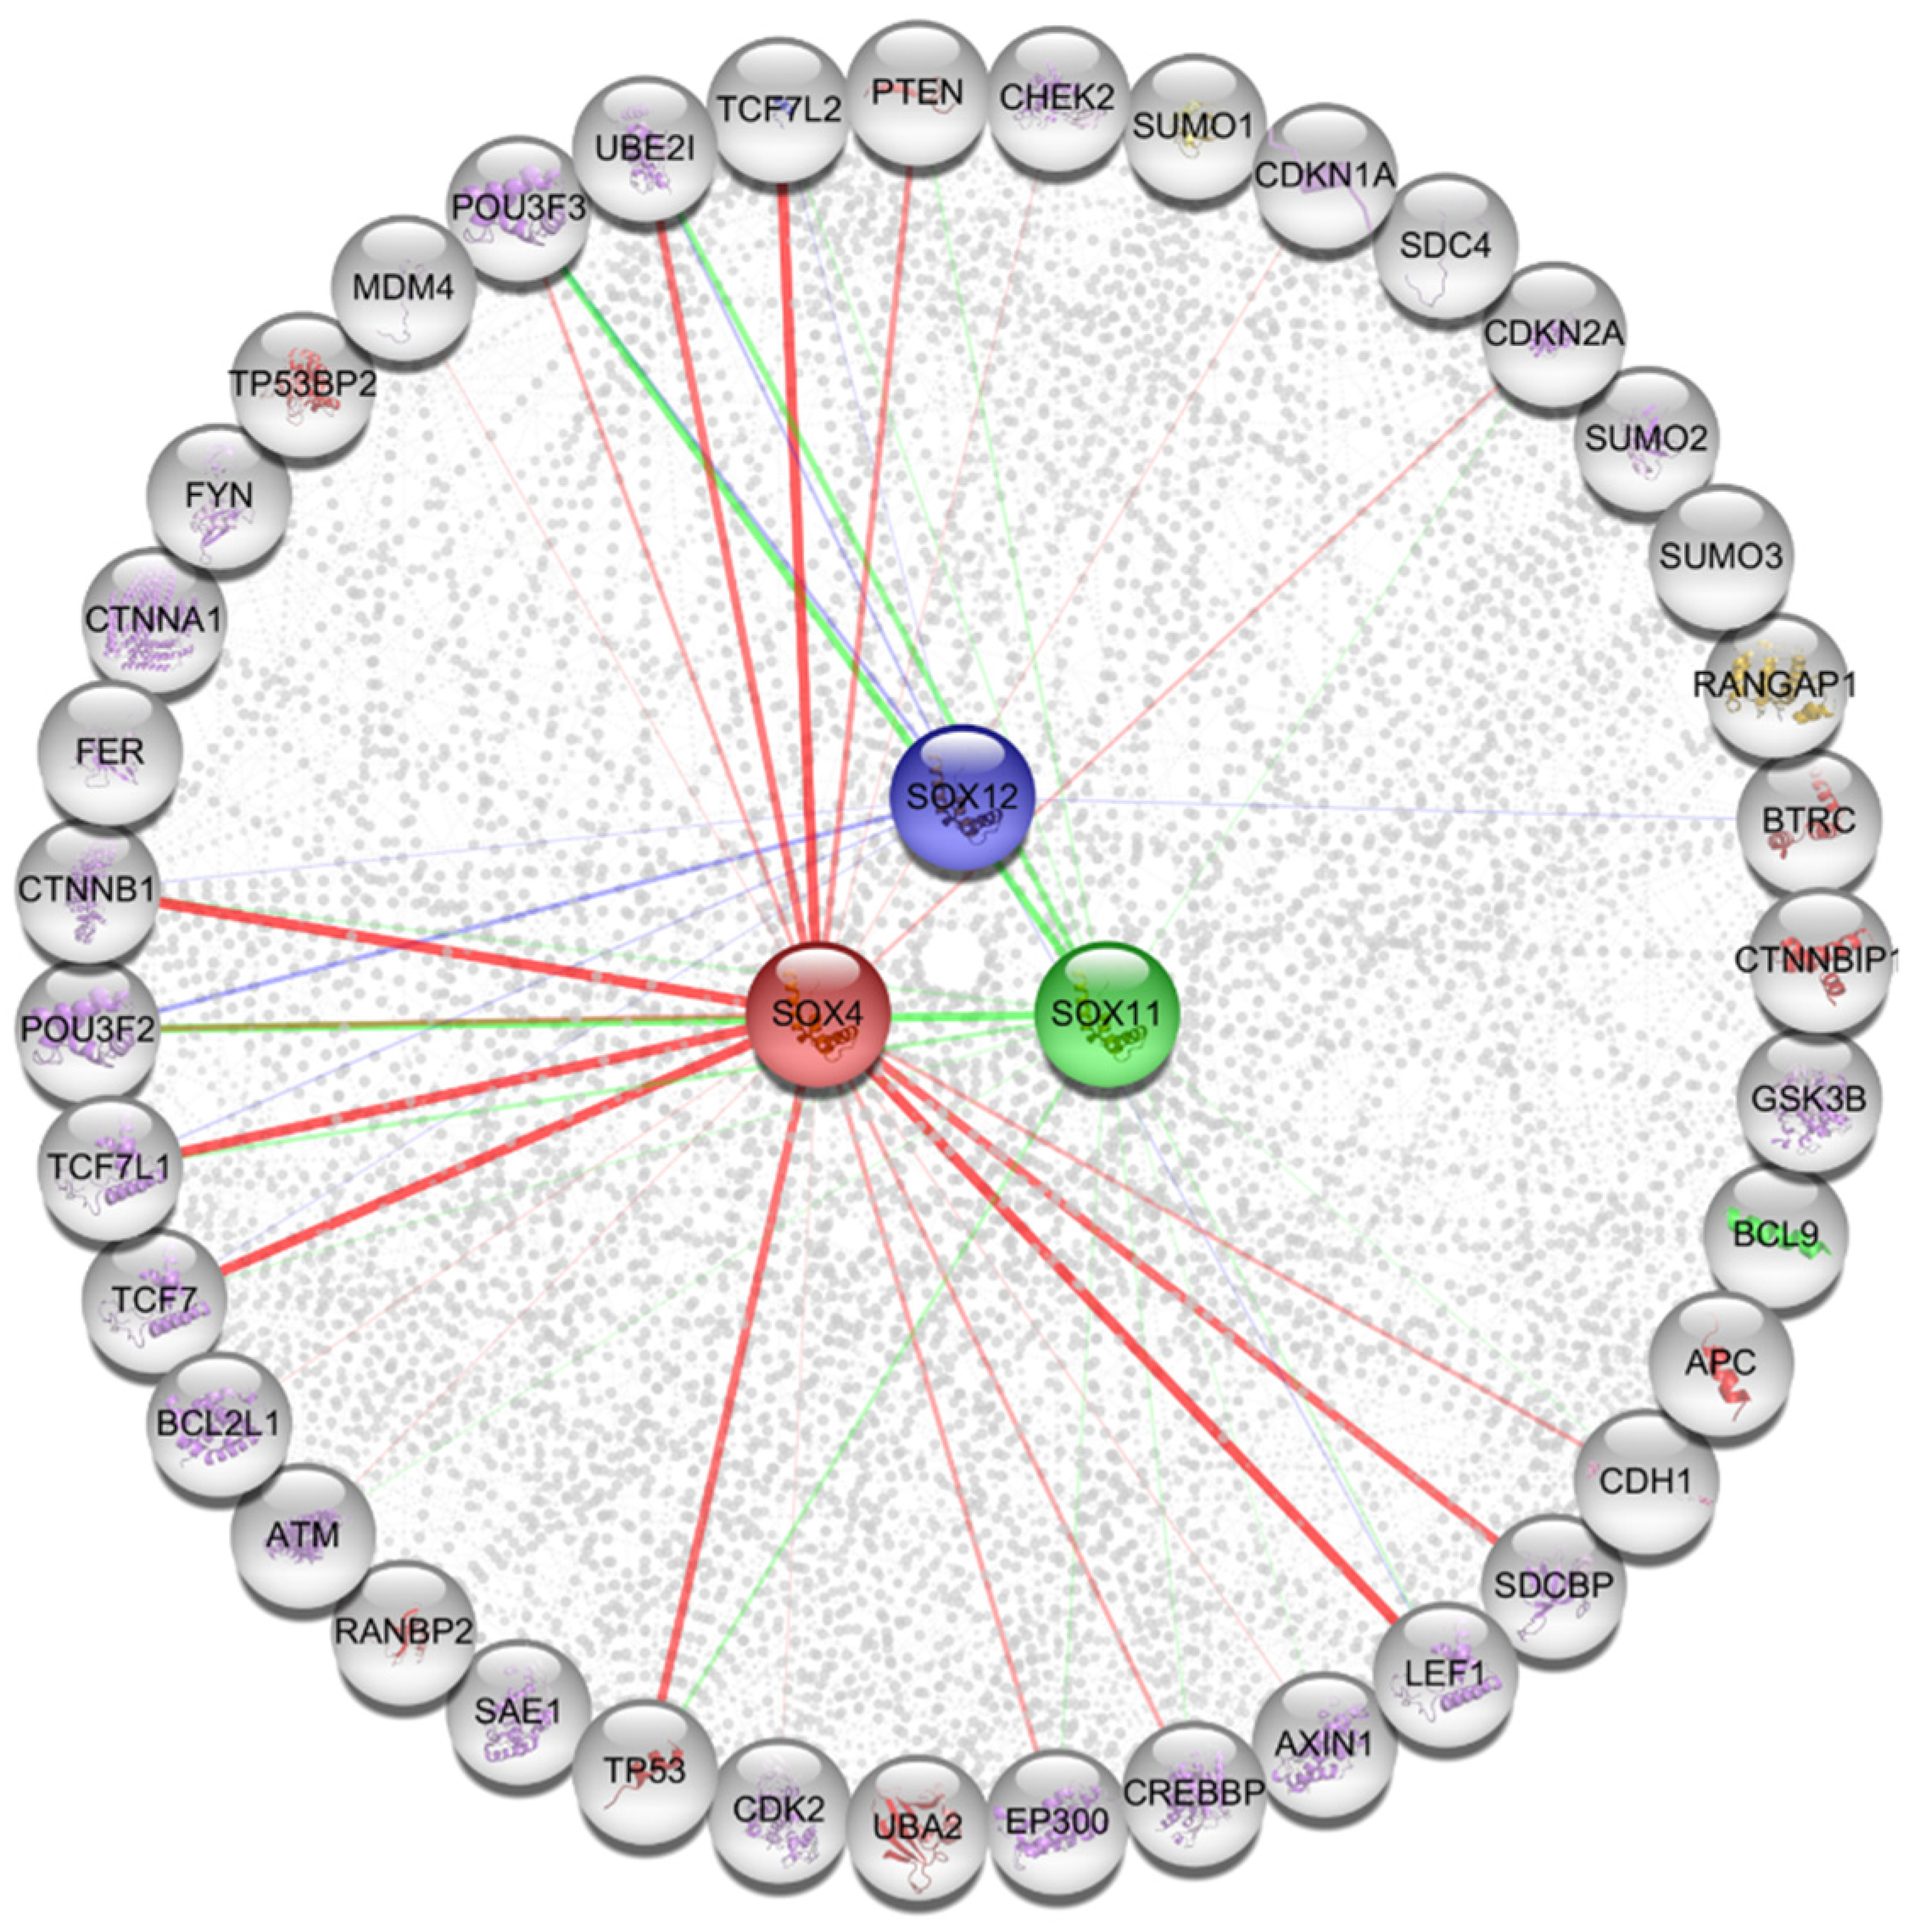
2.7. Functional Protein Partners and Their Predicted Signaling Pathways

To investigate the three SOX gene-related pathways that might play a role in various types of cancers, 40 proteins that commonly correlated with the three SOX genes were retrieved from the STRING database (version 11, Swiss Institute of Bioinformatics, Lausanne, Switzerland) (Figure 7). The predicted interacting proteins that showed high confidence included TP53, POU3F2, POU3F3, TCF7, TCF7L1, TCF7L2, CTNNB1, and PTEN. Next, association of the 40 proteins was analyzed to predict probable signaling pathways and gene ontology (GO) categories. The KEGG pathway analysis revealed that individual functional protein partners were categorized in pathways related to the Hippo signaling pathway, WNT signaling pathway, cell cycle signaling pathway, p53 signaling pathway, and several other cancer-related pathways (Table 1). In addition, the Reactome pathway analysis showed that some categories were related to TCF, β-catenin, and the WNT signaling pathway (Table 2). The GO categories obtained from the analysis using extracted functional protein partners, also contained terms related to the WNT signaling pathway, TCF/β-catenin complex, and other developmental processes. Furthermore, gene network analysis of three SOX genes was determined from the GeneMANIA database. In the GeneMANIA webtool, 20 genes showed high confidence with the SOXC members included SMARCA4, WT1, NF1, KRAS, GATA3, TERT, POU3F2, POU3F3, SOX3, and SOX5 (Supplementary Figure S4a). These findings suggest that the three SOX genes could be associated with specific critical pathways related to certain developmental processes, including the WNT signaling pathway and the TCF/βcatenin complex, in cancer progression.
Functional protein partners of SOX4, SOX11, and SOX12 were predicted using the Cytoscape string application. The line color implies that each SOX protein interacts separately with other proteins. The node and line colors of each SOX gene were the same. SOX4: red color; SOX11: green color; SOX12: navy color.

3. Discussion

Members of the SOX gene family are essential transcription factors for human developmental processes such as sex determination, cell differentiation, and organogenesis [3]. Nevertheless, it has been reported that the SOX family may participate in tumor progression as transcriptional activators or repressors depending on their specific binding partners [30]. In the present study, we revealed that phylogenetically close SOX members, SOX4, SOX11, and SOX12, have distinctively higher expression in various cancers, and analyzed the prognostic value and correlated pathways using various bioinformatic tools. These three SOX proteins belong to the SOXC subgroup and are evolutionarily conserved in vertebrates [30,31]. Although it has been reported previously that higher expression of SOX4, SOX11, and SOX12 is negatively correlated with patient survival in various cancers [9,10,11,12,13,14,15,16,17,18,19,20,21,22], the expression of SOXC members has not yet been analyzed systematically in multiple cancer datasets. In most types of cancer, SOXC members could serve as the oncogenic role and poor prognostic value, however previous studies have been reported that the function of SOX11 was associated both with an oncogenic or tumor-suppressive role in carcinoma [26,32]. In our study, the higher expression of three SOX genes was determined in various types of cancer regardless of their cancer stage compared to normal tissues. Our systematic analysis demonstrated that the expression of the three SOXC members was distinctively higher in various types of cancers than in their normal counterparts, thereby indicating a negative correlation of these proteins with patient survival in multiple cancer datasets. In particular, the poor prognostic value of SOX11 expression in pancreatic cancer and sarcoma and SOX12 expression in breast and ovarian cancer as well as sarcoma, has not been reported previously (Figure 2, Figure 3 and Figure 4). We also found strong correlations between mRNA and SOX4 protein expression in CPTAC datasets including breast, uterine corpus, and lung cancer from TCGA database. However, Protein expression of SOX11 and SOX12 was not detectable or significant in CPTAC datasets. In the Oncomine database, SOX9 was also highly expressed in multiple types of cancers than healthy counterparts and it has been reported previously that higher expression of SOX9 is correlated with poor prognosis in several cancers [15,16,17]. Although SOX9 has strong prognostic value in various types of cancers, phylogenetic tree analysis of the SOX gene family proteins has shown weak homology of SOX9 with SOXC members. Correlation between expression of SOX9 and poor patient prognosis strongly suggests that SOX9 might have an oncogenic role in several types of cancer, which remains to be explained in further studies.
Co-expression of all SOXC members largely occurs in mouse embryos, mid-organogenesis, and several tissues [31,33,34,35]. We also observed co-expression of SOXC members in the LIHC and SARC datasets (Figure 5b and Figure 6b). The increased expression of these three SOX members in cancers and sequence similarities raise the question that whether the expression of the three SOX genes has possible compensatory or synergic role in cancer progression. We examined the effect of co-expression of SOX4, SOX11, and SOX12 on patient survival in TCGA datasets. In TCGA-LIHC and TCGA-SARC datasets, co-expression of the three SOX genes was positively correlated with poor outcomes. We also observed that the expression levels of the three SOX members were positively correlated with each other in the LIHC and SARC datasets. In the SARC dataset, the p-value for correlation between co-expression of the three SOX members and patient survival was much less than that for correlation with individual SOX members, indicating that co-expression of the three SOX members has a stronger prognostic value than the expression of individual SOX members. The stronger prognostic value of co-expression than with each SOX member might reflect the synergic effect of the three SOX members. However, in the LIHC dataset, co-expression did not indicate a significantly higher prognostic value for patient survival. This indicates that co-expression of SOX proteins is more predictive in SARC than in LIHC.
The consistent prognostic value associated with the expression of the three SOX genes in cancers suggests shared functional pathways between these SOX genes in various cancer types. We analyzed the shared pathways among the genes co-expressed with SOX4, SOX11, and SOX12 in the LIHC and SARC datasets. In LIHC, the 404 commonly co-expressed genes (9.5% of analyzed correlated genes) were highly correlated with the cell cycle and mitosis-related pathways. However, in SARC, only 16 genes (1.4% of analyzed correlated genes) were identified as commonly significantly correlated genes, which were mainly related to pathways involved in epigenetic regulation. These commonly related pathways were highly associated with cancer progression. Lower number of commonly-related genes among the three SOX genes in SARC may reflect that independent pathways of each SOX member could cooperatively work, thereby leading to cancer progression in SARC, which could explain the stronger prognostic value of the three SOX genes than that of individual SOX genes in SARC.
PPI network analysis of the three SOX proteins revealed their functional protein partners to be categorized in several cancer-related pathways, including the TNF/β-catenin and WNT signaling pathways. Previous studies have described a single SOX gene-related canonical WNT/β-catenin signaling pathway in various cancers [36,37]. However, our analysis is the first to reveal a correlation between the three SOX genes and a group of genes that are related to several pathways. Our findings indicate an association between expression of the three SOX genes and their predicted signaling pathways in some cancers. In addition, our results of the PPI network analysis showed similar signaling pathways with correlated genes, including the cell cycle and SUMOylation, in LIHC and SARC. We also analyzed the gene network analysis of SOX4, SOX11, and SOX12 using GeneMANIA database. In this result, these commonly related genes including TERT, KRAS, and CDKN2A were also highly associated with cancer progression. Previous studies have reported that regulation of TERT, KRAS, and CDKN2A could serve as potential therapeutic targets in multiple cancer types [38,39,40]. However, the mechanisms of action of these genes in cancer progression remain unknown and need to be elucidated in the future.
The alterations in the three SOX genes were investigated to determine which types of cancers were related to significant alterations in the SOX members, using cBioPortal. Mutations in oncogenes, such as TP53, KRAS, and PIK3AC, are correlated with clinical outcomes in various cancers [41,42,43,44]. Alterations are associated with human cancers, and regions of structural variation in the human genome can be novel biomarkers for cancer progression [45]. In our study, we found amplification of SOX4 and their upregulated expression in multiple cancer types. In addition, previous studies have reported that amplification of SOX4 is associated with cancer progression [46,47,48]. Although the amplification of SOX4 can lead to upregulation of SOX4 expression, the association between mutations of SOX4 and their gene expression with various cancer phenotypes was unknown and should be pursued in further study. Indeed, the SOX11 and SOX12 gene-altered patient group had poorer survival than the unaltered group in the SARC dataset (unpublished data). However, the functional importance of mutations and alterations in SOX4, SOX11, and SOX12 remain unknown. In addition, more experimental and theoretical studies are recommended to support the outcomes of this study, since the clinical data mining-based analyses need to validate the underlying molecular mechanisms.

4. Materials and Methods

4.1. Oncomine Database Analysis

The differential mRNA expression of the SOX family members in various cancer tissues versus their normal counterparts, was examined using the Oncomine database (Thermo Fisher, Waltham, MA, USA) (https://www.oncomine.org/ (accessed on 11 May 2021); version 4.5) [49,50]. Fold-change in the mRNA expression of the SOX family genes in cancer tissues, compared to that in their normal counterparts, was calculated based on a threshold p-value < 0.05; fold-change of 2.

4.2. Molecular Evolutionary Genetics Analysis

The amino acid sequences of the SOX family proteins were retrieved from the NCBI database. Accession numbers of the SOX protein sequences are mentioned in Supplementary Table S3. Multiple sequence alignment was performed using the ClustalW program from the Molecular Evolutionary Genetics Analysis X (MEGA-X) tool. Multiple-aligned sequences were used to build a phylogenetic tree by employing the neighbor-joining method.

4.3. GEPIA2 Database Analysis

Gene expression profiling interactive analysis 2 (GEPIA2) (Peking University, Beijing, China) (http://gepia2.cancer-pku.cn/ (accessed on 11 May 2021)) is an online bioinformatic tool for analyzing RNA expression using The Cancer Genome Atlas (TCGA) data [51]. In this study, GEPIA2 was used to analyze the expression of SOX4, SOX11, and SOX12 and their association with the survival of patients in multiple cancer types. Differential gene expression between TCGA tumor samples and a combination of TCGA normal samples and Genotype-Tissue Expression (GTEx) normal samples, was visualized using boxplots. A survival curve was generated, using GEPIA, to determine the association of SOX gene expression with patient survival in different cancer types. The correlation between SOX gene expression and patient survival was analyzed using Kaplan–Meier survival curves and log-rank test using GEPIA2.

4.4. cBioPortal Database Analysis

cBioPortal (MSKCC, New York, NY, U.S.A.) (http://www.cbioportal.org (accessed on 11 May 2021); version 3.7.2) is a web-based genomic portal that provides visualization and analysis of TCGA datasets [52,53]. In this study, cBioPortal was used to analyze the mutation and alteration frequency of SOX genes with relevant parameter settings.

4.5. Kaplan–Meier Plotter

The Kaplan–Meier plotter (Balazs Gyorffy, Budapest, Hungary) (http://kmplot.com/analysis/ (accessed on 11 May 2021)) is a web-based database that provides survival curve of patients, based on 54,675 genes in 21 cancer types [54]. Comparison of survival between the two patient groups, classified according to the expression level of each SOX gene, with “auto select best cutoff” option was carried out using the survival curve. The survival curve indicating the co-occurrence of SOX genes was retrieved to investigate the prognostic value of co-expression of SOX genes in pan-cancer RNA sequencing data. Survival analysis was performed to determine the average expression levels of SOX4, SOX11, and SOX12.

4.6. R2: Genomic Analysis and Visualization Platform

The R2 platform (the Academic Medical Center (AMC), Amsterdam, Netherlands) (https://hgserver1.amc.nl/cgi-bin/r2/main.cgi (accessed on 11 May 2021)) is a publicly available web-based genomic analysis and visualization platform that uses information from the TCGA, Gene Expression Omnibus (GEO), and GTEx projects. In this study, we performed survival analysis of the mRNA expression of the three SOX genes in several types of cancers, using the R2 online tools.

4.7. Gene Correlation Analysis of SOX4, SOX11, and SOX12

Correlated genes of the three SOX members were determined from TCGA datasets of liver cancer and sarcoma, using the R2 platform (https://hgserver1.amc.nl/cgi-bin/r2/main.cgi (accessed on 11 May 2021)). The analysis was performed with the adjustment of the Bonferroni test using a threshold p-value < 0.01.
Next, Venn diagrams were used to identify common genes among the correlated genes of SOX4, SOX11, and SOX12 in liver cancer and sarcoma, using Venny 2.1.0 (Spanish National Biotechnology Centre (CNB)-CSIC, Madrid, Spain) (https://bioinfogp.cnb.csic.es/tools/venny/ (accessed on 11 May 2021)).
To explore pathways associated with the genes commonly correlated with SOX4, SOX11, and SOX12, we used the Reactome pathway database (Ontario Institute for Cancer Research, ON, USA) (https://reactome.org/ accessed on 11 May 2021; version 76) [55].

4.8. Identification of Functional Protein Partners of SOX4, SOX11, and SOX12, and Signaling Pathway Analysis

The functional protein partners of SOX4, SOX11, and SOX12 were analyzed using STRING database v11.0 (https://string-db.org/ (accessed on 11 May 2021)). Subsequently, these data were reorganized using the Cytoscape tool to visualize the interaction network of each protein. Pathway and gene ontology (GO) analyses were performed using the selected protein partners. Pathway analysis was classified based on the KEGG and REACTOME pathway databases [56].

4.9. Analysis of SOX Protein Expression Pattern in Various Types of Cancer

The protein expression levels of SOX protein in multiple cancer types were investigated from the UALCAN databases (Preston, Lancashire, UK) (https://ualcan.path.uab.edu/index.html (accessed on 11 May 2021)) [57]. Protein expression level of SOX4 was systematically analyzed according to cancer stage on the characteristics of patients with COAD, LIHC, LUAD, and LUSC, derived from the Clinical Proteomic Tumor Analysis Consortium (CPTAC). Differences with p-value < 0.05 were considered statistically significant.

4.10. Analysis of Gene Network with SOX4, SOX11, and SOX12

The gene network analysis with SOX4, SOX11, and SOX12 was conducted using GeneMANIA database (University of Toronto, TN, Canada) (https://genemania.org/ (accessed on 11 May 2021)) [58]. In this study, GeneMANIA was used to analyze the interaction gene network with three SOX genes.

5. Conclusions

In this multi-omics analysis of SOX genes expression in human cancer databases, we suggest the evidence of the correlation between the expression of three SOX genes and clinical outcomes in human cancer. Our study provides the importance of all SOXC members expression and possible three SOX genes related pathways in cancer progression. Therefore, our analysis may contribute valuable insights into SOX4, SOX11, and SOX12 as a potential therapeutic goal for various human cancers.

Supplementary Materials

The following are available online at https://www.mdpi.com/article/10.3390/jpm11080823/s1, Supplementary Figure S1: Venn diagram showing genes negatively correlated with SOX4, SOX11, and SOX12 in TCGA-LIHC and TCGA-SARC; Supplementary Figure S2: Protein expression profile of SOX4 in various types of cancers and their adjacent normal tissues; Supplementary Figure S3: mRNA expression level of SOX4, SOX11, and SOX12 in multiple cancer types; Supplementary Figure S4: gene network analysis with SOX4, SOX11, and SOX12 using GeneMANIA database; Supplementary Table S1: Reactome pathway analysis of commonly downregulated genes in TCGA-LIHC; Supplementary Table S2: Reactome pathway analysis of commonly downregulated genes in TCGA-SARC. Supplementary Table S3: Accession numbers of the SOX protein sequences (NCBI).

Author Contributions

Conceptualization, S.-G.C., S.K.S. and M.G.; methodology, S.K.S. and J.S.; software, J.S. and M.G.; validation, J.S., M.G. and S.-G.C.; formal analysis, J.S. and M.G.; investigation, J.S., M.G. and S.-G.C.; data curation, J.S., M.G. and S.-G.C.; writing—original draft preparation, J.S. and M.G.; writing—review and editing, J.S., M.G., A.A.D. and S.-G.C.; visualization, J.S.; supervision, S.-G.C.; project administration, S.-G.C.; funding acquisition, S.-G.C. All authors have read and agreed to the published version of the manuscript.

Funding

This study was supported by Konkuk University in 2018.

Institutional Review Board Statement

Not applicable.

Informed Consent Statement

Not applicable.

Data Availability Statement

The data presented in this study are available on request from the corresponding author.

Acknowledgments

We would like to thank the people who attempted to provide and update the data on the Internet-based multi-omics databases, including Oncomine, GEPIA2, Kaplan–Meier plotter, and cBioPortal.

Conflicts of Interest

The authors declare no conflict of interest.

References

  1. Global Burden of Disease Cancer Collaboration; Fitzmaurice, C.; Abate, D.; Abbasi, N.; Abbastabar, H.; Abd-Allah, F.; Abdel-Rahman, O.; Abdelalim, A.; Abdoli, A.; Abdollahpour, I.; et al. Global, Regional, and National Cancer Incidence, Mortality, Years of Life Lost, Years Lived With Disability, and Disability-Adjusted Life-Years for 29 Cancer Groups, 1990 to 2017: A Systematic Analysis for the Global Burden of Disease Study. JAMA Oncol. 2019, 5, 1749–1768. [Google Scholar] [CrossRef] [Green Version]
  2. Bray, F.; Ferlay, J.; Soerjomataram, I.; Siegel, R.L.; Torre, L.A.; Jemal, A. Global cancer statistics 2018: GLOBOCAN estimates of incidence and mortality worldwide for 36 cancers in 185 countries. CA Cancer J. Clin. 2018, 68, 394–424. [Google Scholar] [CrossRef] [Green Version]
  3. Hanahan, D.; Weinberg, R.A. Hallmarks of cancer: The next generation. Cell 2011, 144, 646–674. [Google Scholar] [CrossRef] [PubMed] [Green Version]
  4. Lefebvre, V.; Dumitriu, B.; Penzo-Méndez, A.; Han, Y.; Pallavi, B. Control of cell fate and differentiation by Sry-related high-mobility-group box (Sox) transcription factors. Int. J. Biochem. Cell Biol. 2007, 39, 2195–2214. [Google Scholar] [CrossRef] [Green Version]
  5. Kamachi, Y.; Kondoh, H. Sox proteins: Regulators of cell fate specification and differentiation. Development 2013, 140, 4129–4144. [Google Scholar] [CrossRef] [PubMed] [Green Version]
  6. Tang, H.; Song, C.; Liu, P.; Wang, J.; Chen, B.; Huang, X.; Pei, X.; Liu, L. SOX2 promotes cell proliferation and metastasis in triple negative breast cancer. Front. Pharmacol. 2018, 9, 942. [Google Scholar]
  7. Yang, F.; Gao, Y.; Geng, J.; Qu, D.; Han, Q.; Qi, J.; Chen, G. Elevated expression of SOX2 and FGFR1 in correlation with poor prognosis in patients with small cell lung cancer. Int. J. Clin. Exp. Pathol. 2013, 6, 2846. [Google Scholar] [PubMed]
  8. Gu, W.; Wang, B.; Wan, F.; Wu, J.; Lu, X.; Wang, H.; Zhu, Y.; Zhang, H.; Shi, G.; Dai, B. SOX2 and SOX12 are predictive of prognosis in patients with clear cell renal cell carcinoma. Oncol. Lett. 2018, 15, 4564–4570. [Google Scholar] [CrossRef]
  9. Wang, X.; Ji, X.; Chen, J.; Yan, D.; Zhang, Z.; Wang, Q.; Xi, X.; Feng, Y. SOX2 enhances the migration and invasion of ovarian cancer cells via Src kinase. PLoS ONE 2014, 9, e99594. [Google Scholar] [CrossRef]
  10. Sun, C.; Sun, L.; Li, Y.; Kang, X.; Zhang, S.; Liu, Y. Sox2 expression predicts poor survival of hepatocellular carcinoma patients and it promotes liver cancer cell invasion by activating Slug. Med. Oncol. 2013, 30, 503. [Google Scholar] [CrossRef]
  11. Shen, H.; Blijlevens, M.; Yang, N.; Frangou, C.; Wilson, K.E.; Xu, B.; Zhang, Y.; Zhang, L.; Morrison, C.D.; Shepherd, L. Sox4 expression confers bladder cancer stem cell properties and predicts for poor patient outcome. Int. J. Biol. Sci. 2015, 11, 1363. [Google Scholar] [CrossRef] [PubMed] [Green Version]
  12. Vervoort, S.J.; de Jong, O.G.; Roukens, M.G.; Frederiks, C.L.; Vermeulen, J.F.; Lourenço, A.R.; Bella, L.; Vidakovic, A.T.; Sandoval, J.L.; Moelans, C. Global transcriptional analysis identifies a novel role for SOX4 in tumor-induced angiogenesis. Elife 2018, 7, e27706. [Google Scholar] [CrossRef] [PubMed]
  13. Song, G.-D.; Sun, Y.; Shen, H.; Li, W. SOX4 overexpression is a novel biomarker of malignant status and poor prognosis in breast cancer patients. Tumor Biol. 2015, 36, 4167–4173. [Google Scholar] [CrossRef] [PubMed]
  14. Ramezani-Rad, P.; Geng, H.; Hurtz, C.; Chan, L.N.; Chen, Z.; Jumaa, H.; Melnick, A.; Paietta, E.; Carroll, W.L.; Willman, C.L. SOX4 enables oncogenic survival signals in acute lymphoblastic leukemia. Blood 2013, 121, 148–155. [Google Scholar] [CrossRef] [Green Version]
  15. Wan, Y.-P.; Xi, M.; He, H.-C.; Wan, S.; Hua, W.; Zen, Z.-C.; Liu, Y.-L.; Zhou, Y.-L.; Mo, R.-J.; Zhuo, Y.-J. Expression and clinical significance of SOX9 in renal cell carcinoma, bladder cancer and penile cancer. Oncol. Res. Treat. 2017, 40, 15–20. [Google Scholar] [CrossRef] [PubMed]
  16. Richtig, G.; Aigelsreiter, A.; Schwarzenbacher, D.; Ress, A.L.; Adiprasito, J.B.; Stiegelbauer, V.; Hoefler, G.; Schauer, S.; Kiesslich, T.; Kornprat, P. SOX9 is a proliferation and stem cell factor in hepatocellular carcinoma and possess widespread prognostic significance in different cancer types. PLoS ONE 2017, 12, e0187814. [Google Scholar] [CrossRef] [Green Version]
  17. Lü, B.; Fang, Y.; Xu, J.; Wang, L.; Xu, F.; Xu, E.; Huang, Q.; Lai, M. Analysis of SOX9 expression in colorectal cancer. Am. J. Clin. Pathol. 2008, 130, 897–904. [Google Scholar] [CrossRef] [Green Version]
  18. Oliemuller, E.; Kogata, N.; Bland, P.; Kriplani, D.; Daley, F.; Haider, S.; Shah, V.; Sawyer, E.J.; Howard, B.A. SOX11 promotes invasive growth and ductal carcinoma in situ progression. J. Pathol. 2017, 243, 193–207. [Google Scholar] [CrossRef]
  19. Shepherd, J.H.; Uray, I.P.; Mazumdar, A.; Tsimelzon, A.; Savage, M.; Hilsenbeck, S.G.; Brown, P.H. The SOX11 transcription factor is a critical regulator of basal-like breast cancer growth, invasion, and basal-like gene expression. Oncotarget 2016, 7, 13106. [Google Scholar] [CrossRef]
  20. Ding, H.; Quan, H.; Yan, W.; Han, J. Silencing of SOX12 by shRNA suppresses migration, invasion and proliferation of breast cancer cells. Biosci. Rep. 2016, 36, e00389. [Google Scholar] [CrossRef] [PubMed] [Green Version]
  21. Wang, Z.; Li, Z.; Zhu, J. Negative regulation of SOX11 in hepatocellular carcinoma. Int J. Clin. Exp. Med. 2017, 10, 2809–2817. [Google Scholar]
  22. Huang, W.; Chen, Z.; Shang, X.; Tian, D.; Wang, D.; Wu, K.; Fan, D.; Xia, L. Sox12, a direct target of FoxQ1, promotes hepatocellular carcinoma metastasis through up-regulating Twist1 and FGFBP1. Hepatology 2015, 61, 1920–1933. [Google Scholar] [CrossRef]
  23. Walter, R.F.H.; Mairinger, F.D.; Werner, R.; Ting, S.; Vollbrecht, C.; Theegarten, D.; Christoph, D.C.; Zarogoulidis, K.; Schmid, K.W.; Zarogoulidis, P. SOX4, SOX11 and PAX6 mRNA expression was identified as a (prognostic) marker for the aggressiveness of neuroendocrine tumors of the lung by using next-generation expression analysis (NanoString). Future Oncol. 2015, 11, 1027–1036. [Google Scholar] [CrossRef] [PubMed]
  24. Wang, L.; Hu, F.; Shen, S.; Xiao, H.; Li, G.; Wang, M.; Mei, J. Knockdown of SOX12 expression inhibits the proliferation and metastasis of lung cancer cells. Am. J. Transl. Res. 2017, 9, 4003. [Google Scholar]
  25. Thu, K.; Radulovich, N.; Becker-Santos, D.; Pikor, L.; Pusic, A.; Lockwood, W.; Lam, W.; Tsao, M. SOX15 is a candidate tumor suppressor in pancreatic cancer with a potential role in Wnt/β-catenin signaling. Oncogene 2014, 33, 279. [Google Scholar] [CrossRef] [Green Version]
  26. Yang, Z.; Jiang, S.; Lu, C.; Ji, T.; Yang, W.; Li, T.; Lv, J.; Hu, W.; Yang, Y.; Jin, Z. SOX11: Friend or foe in tumor prevention and carcinogenesis? Ther. Adv. Med Oncol. 2019, 11, 1758835919853449. [Google Scholar] [CrossRef] [PubMed]
  27. Huang, J.; Ji, E.H.; Zhao, X.; Cui, L.; Misuno, K.; Guo, M.; Huang, Z.; Chen, X.; Hu, S. Sox11 promotes head and neck cancer progression via the regulation of SDCCAG8. J. Exp. Clin. Cancer Res. 2019, 38, 138. [Google Scholar] [CrossRef]
  28. Du, F.; Chen, J.; Liu, H.; Cai, Y.; Cao, T.; Han, W.; Yi, X.; Qian, M.; Tian, D.; Nie, Y.; et al. SOX12 promotes colorectal cancer cell proliferation and metastasis by regulating asparagine synthesis. Cell Death Dis. 2019, 10, 1–19. [Google Scholar] [CrossRef]
  29. Du, F.; Feng, W.; Chen, S.; Wu, S.; Cao, T.; Yuan, T.; Tian, D.; Nie, Y.; Yu, K.; Fan, D.; et al. Sex determining region Y-box 12 (SOX12) promotes gastric cancer metastasis by upregulating MMP7 and IGF1. Cancer Lett. 2019, 452, 103–118. [Google Scholar] [CrossRef] [PubMed]
  30. Guth, S.; Wegner, M. Having it both ways: Sox protein function between conservation and innovation. Cell. Mol. Life Sci. 2008, 65, 3000–3018. [Google Scholar] [CrossRef]
  31. Dy, P.; Penzo-Mendez, A.; Wang, H.; Pedraza, C.E.; Macklin, W.B.; Lefebvre, V. The three SoxC proteins—Sox4, Sox11 and Sox12—exhibit overlapping expression patterns and molecular properties. Nucleic Acids Res. 2008, 36, 3101–3117. [Google Scholar] [CrossRef] [PubMed] [Green Version]
  32. Grimm, D.; Bauer, J.; Wise, P.; Krüger, M.; Simonsen, U.; Wehland, M.; Infanger, M.; Corydon, T.J. The Role of SOX Family Members in Solid Tumours and Metastasis. In Seminars in Cancer Biology; Elsevier: Amsterdam, The Netherlands, 2019. [Google Scholar]
  33. Hargrave, M.; Wright, E.; Kun, J.; Emery, J.; Cooper, L.; Koopman, P. Expression of the Sox11 gene in mouse embryos suggests roles in neuronal maturation and epithelio-mesenchymal induction. Dev. Dyn. 1997, 210, 79–86. [Google Scholar] [CrossRef]
  34. Sock, E.; Rettig, S.D.; Enderich, J.; Bösl, M.R.; Tamm, E.R.; Wegner, M. Gene targeting reveals a widespread role for the high-mobility-group transcription factor Sox11 in tissue remodeling. Mol. Cell. Biol. 2004, 24, 6635–6644. [Google Scholar] [CrossRef] [PubMed] [Green Version]
  35. Hoser, M.; Potzner, M.R.; Koch, J.M.; Bösl, M.R.; Wegner, M.; Sock, E. Sox12 deletion in the mouse reveals nonreciprocal redundancy with the related Sox4 and Sox11 transcription factors. Mol. Cell. Biol. 2008, 28, 4675–4687. [Google Scholar] [CrossRef] [PubMed] [Green Version]
  36. Dong, C.; Wilhelm, D.; Koopman, P. Sox genes and cancer. Cytogenet. Genome Res. 2004, 105, 442–447. [Google Scholar] [CrossRef]
  37. Leber, M.F.; Efferth, T. Molecular principles of cancer invasion and metastasis. Int. J. Oncol. 2009, 34, 881–895. [Google Scholar]
  38. Foulkes, W.D.; Flanders, T.Y.; Pollock, P.M.; Hayward, N.K. The CDKN2A (p16) gene and human cancer. Mol. Med. 1997, 3, 5–20. [Google Scholar] [CrossRef] [Green Version]
  39. Yuan, X.; Larsson, C.; Xu, D. Mechanisms underlying the activation of TERT transcription and telomerase activity in human cancer: Old actors and new players. Oncogene 2019, 38, 6172–6183. [Google Scholar] [CrossRef] [Green Version]
  40. Jančík, S.; Drábek, J.; Radzioch, D.; Hajdúch, M. Clinical relevance of KRAS in human cancers. J. Biomed. Biotechnol. 2010, 2010, 150960. [Google Scholar] [CrossRef] [Green Version]
  41. Soussi, T.; Wiman, K. TP53: An oncogene in disguise. Cell Death Differ. 2015, 22, 1239. [Google Scholar] [CrossRef]
  42. Porru, M.; Pompili, L.; Caruso, C.; Biroccio, A.; Leonetti, C. Targeting KRAS in metastatic colorectal cancer: Current strategies and emerging opportunities. J. Exp. Clin. Cancer Res. 2018, 37, 57. [Google Scholar] [CrossRef] [Green Version]
  43. Waters, A.M.; Der, C.J. KRAS: The critical driver and therapeutic target for pancreatic cancer. Cold Spring Harb. Perspect. Med. 2018, 8, a031435. [Google Scholar] [CrossRef] [PubMed]
  44. Samuels, Y.; Velculescu, V.E. Oncogenic mutations of PIK3CA in human cancers. Cell Cycle 2004, 3, 1221–1224. [Google Scholar] [CrossRef] [PubMed] [Green Version]
  45. Shlien, A.; Malkin, D. Copy number variations and cancer. Genome Med. 2009, 1, 62. [Google Scholar] [CrossRef] [PubMed] [Green Version]
  46. Mehta, G.A.; Parker, J.S.; Silva, G.O.; Hoadley, K.A.; Perou, C.M.; Gatza, M.L. Amplification of SOX4 promotes PI3K/Akt signaling in human breast cancer. Breast Cancer Res. Treat. 2017, 162, 439–450. [Google Scholar] [CrossRef]
  47. Medina, P.P.; Castillo, S.D.; Blanco, S.; Sanz-Garcia, M.; Largo, C.; Alvarez, S.; Yokota, J.; Gonzalez-Neira, A.; Benitez, J.; Clevers, H.C. The SRY-HMG box gene, SOX4, is a target of gene amplification at chromosome 6p in lung cancer. Hum. Mol. Genet. 2009, 18, 1343–1352. [Google Scholar] [CrossRef] [PubMed]
  48. Vervoort, S.J.; van Boxtel, R.; Coffer, P.J. The role of SRY-related HMG box transcription factor 4 (SOX4) in tumorigenesis and metastasis: Friend or foe? Oncogene 2013, 32, 3397–3409. [Google Scholar] [CrossRef] [Green Version]
  49. Rhodes, D.R.; Yu, J.; Shanker, K.; Deshpande, N.; Varambally, R.; Ghosh, D.; Barrette, T.; Pandey, A.; Chinnaiyan, A.M. ONCOMINE: A cancer microarray database and integrated data-mining platform. Neoplasia 2004, 6, 1–6. [Google Scholar] [CrossRef] [Green Version]
  50. Rhodes, D.R.; Kalyana-Sundaram, S.; Mahavisno, V.; Varambally, R.; Yu, J.; Briggs, B.B.; Barrette, T.R.; Anstet, M.J.; Kincead-Beal, C.; Kulkarni, P.; et al. Oncomine 3.0: Genes, pathways, and networks in a collection of 18,000 cancer gene expression profiles. Neoplasia 2007, 9, 166–180. [Google Scholar] [CrossRef] [Green Version]
  51. Tang, Z.; Li, C.; Kang, B.; Gao, G.; Li, C.; Zhang, Z. GEPIA: A web server for cancer and normal gene expression profiling and interactive analyses. Nucleic Acids Res. 2017, 45, W98–W102. [Google Scholar] [CrossRef] [Green Version]
  52. Gao, J.; Aksoy, B.A.; Dogrusoz, U.; Dresdner, G.; Gross, B.; Sumer, S.O.; Sun, Y.; Jacobsen, A.; Sinha, R.; Larsson, E.; et al. Integrative analysis of complex cancer genomics and clinical profiles using the cBioPortal. Sci. Signal. 2013, 6, pl1. [Google Scholar] [CrossRef] [Green Version]
  53. Cerami, E.; Gao, J.; Dogrusoz, U.; Gross, B.E.; Sumer, S.O.; Aksoy, B.A.; Jacobsen, A.; Byrne, C.J.; Heuer, M.L.; Larsson, E.; et al. The cBio cancer genomics portal: An open platform for exploring multidimensional cancer genomics data. Cancer Discov. 2012, 2, 401–404. [Google Scholar] [CrossRef] [PubMed] [Green Version]
  54. Nagy, A.; Lanczky, A.; Menyhart, O.; Gyorffy, B. Validation of miRNA prognostic power in hepatocellular carcinoma using expression data of independent datasets. Sci. Rep. 2018, 8, 9227. [Google Scholar] [CrossRef] [PubMed]
  55. Jassal, B.; Matthews, L.; Viteri, G.; Gong, C.; Lorente, P.; Fabregat, A.; Sidiropoulos, K.; Cook, J.; Gillespie, M.; Haw, R. The reactome pathway knowledgebase. Nucleic Acids Res. 2020, 48, D498–D503. [Google Scholar] [CrossRef] [PubMed]
  56. Szklarczyk, D.; Gable, A.L.; Lyon, D.; Junge, A.; Wyder, S.; Huerta-Cepas, J.; Simonovic, M.; Doncheva, N.T.; Morris, J.H.; Bork, P. STRING v11: Protein–protein association networks with increased coverage, supporting functional discovery in genome-wide experimental datasets. Nucleic Acids Res. 2019, 47, D607–D613. [Google Scholar] [CrossRef] [Green Version]
  57. Chandrashekar, D.S.; Bashel, B.; Balasubramanya, S.A.H.; Creighton, C.J.; Ponce-Rodriguez, I.; Chakravarthi, B.V.; Varambally, S. UALCAN: A portal for facilitating tumor subgroup gene expression and survival analyses. Neoplasia 2017, 19, 649–658. [Google Scholar] [CrossRef]
  58. Warde-Farley, D.; Donaldson, S.L.; Comes, O.; Zuberi, K.; Badrawi, R.; Chao, P.; Franz, M.; Grouios, C.; Kazi, F.; Lopes, C.T. The GeneMANIA prediction server: Biological network integration for gene prioritization and predicting gene function. Nucleic Acids Res. 2010, 38, W214–W220. [Google Scholar] [CrossRef]
Figure 1. mRNA expression levels of the SOX gene family in different cancer types. (a) Comparison of the expression of SOX gene family members from the Oncomine database, indicating the number of datasets with mRNA overexpression (red) or underexpression (blue), between various types of cancers and their normal counterparts. The threshold was determined based on the following parameters: p-value < 0.001, fold-change of 2, and gene ranking of 10%. (b) Phylogenetic tree analysis of the SOX gene family proteins was performed using the Molecular Evolutionary Genetic Analysis (MEGA) tool. The tree was derived from the maximum likelihood method.
Jpm 11 00823 g001
Figure 2. SOX4 expression pattern and patient survival in various cancers. SOX4 expression, alteration frequency of mutations, copy number alteration, and correlation with patient survival in various types of cancer. (a) Box plots comparing SOX4 expression in normal (left plot) and cancer tissues (right plot) were derived from the Oncomine database. The fold-changes in SOX4 expression in colon, lung, liver, and pancreatic cancers, as well as sarcoma are shown as box plots. (b) The mutations and alteration frequency of SOX4 were determined using the cBioPortal database. The diagram shows SOX4 mutation in different cancer types across protein domains. The alteration frequency of SOX4 was retrieved using cBioPortal and is shown at the bottom. Only those cancer types with more than 100 samples and an alteration frequency of over 3.7% are shown. The alterations comprised deletions (blue), amplification (red), or mutation (green). (c) The survival plot comparing patients with high (red) and low (blue) expression in various cancer types was plotted using the Kaplan–Meier plotter, PrognoScan, and R2 databases. Survival plot analysis was performed using a threshold Cox p-value of <0.05. Abbreviations. CRC: colorectal cancer; LIHC: liver hepatocellular carcinoma; LUAD: lung adenocarcinoma; LUSC: lung squamous cell carcinoma; PAAD: pancreatic adenocarcinoma; AT: adipose tissue; PLS: pleomorphic liposarcoma.
Jpm 11 00823 g002aJpm 11 00823 g002b
Figure 3. SOX11 expression pattern and patient survival in various cancers. SOX11 expression pattern, alteration frequency of mutations, copy number alteration, and patient survival in various types of cancers. (a) Box plots comparing SOX11 expression in normal (left plot) and cancer tissues (right plot) were derived from the Oncomine database. The fold-changes in SOX11 expression in brain, breast, lung, kidney, and pancreatic cancers as well as sarcoma, are shown as box plots. (b) Mutations and alteration frequency of SOX11 were determined using the cBioPortal database. The diagram shows SOX11 mutations in different cancer types across protein domains. SOX11 mutations mainly occurred in esophageal cancer with one hot spot (D233 del/2_D233 del) representing common founder mutations. The alteration frequency of SOX11 was determined using cBioPortal and is shown at the bottom. Only those cancer types with more than 100 samples and an alteration frequency of >2.73% are shown. The alterations comprised deletions (blue), amplification (red), or mutation (green). (c) Survival plots comparing patients with high (red) and low (blue) SOX11 expression in various cancer types were plotted using the Kaplan–Meier plotter, PrognoScan, and R2 databases. Patient survival analysis was performed using a threshold Cox p-value of <0.05. Abbreviations. GBM: glioblastoma; DBC: ductal breast carcinoma; CCRCC: clear cell renal cell carcinoma; MRCLS: myxoid/round cell liposarcoma; PC: pancreatic carcinoma.
Jpm 11 00823 g003aJpm 11 00823 g003b
Figure 4. SOX12 expression pattern and patient survival in various cancers. SOX12 expression pattern, alteration frequency of mutations, copy number alterations, and patient survival in various types of cancers. (a) Box plots comparing specific SOX12 expression in normal (left plot) and cancer tissues (right plot) were derived from the Oncomine database. The fold-changes in SOX12 expression in breast, esophageal, lung, and ovarian cancers and sarcoma were determined and are shown as box plots. (b) The mutations and alteration frequency of SOX12 were determined using the cBioPortal database. SOX12 mutation diagram of different cancer types across protein domains is shown. SOX11 mutation mainly occurred in bladder cancer with one hot spot (E294K) representing the common founder mutations. The alteration frequency of SOX12 was determined using the cBioPortal database and is shown at the bottom. Only cancer types containing more than 100 samples and an alteration frequency of >2.1% are shown. The alterations comprised deletions (blue), amplification (red), or mutation (green). (c) The survival plot comparing patients with high (red) and low (blue) expression in various cancer types was obtained using the Kaplan–Meier plotter, PrognoScan, and R2 databases. Survival plot analysis was performed using a threshold Cox p-value of <0.05. Abbreviations. IDC: invasive ductal carcinoma; OSE: ovarian surface epithelium; OVC: ovarian carcinoma; EAC: esophageal adenocarcinoma.
Jpm 11 00823 g004aJpm 11 00823 g004b
Figure 5. Prognostic value of co-expression of the three SOX genes in liver cancer. Correlation of SOX4, SOX11, and SOX12 expression with the prognosis of liver cancer, and analysis of commonly positively correlated genes of the three SOX genes. (a) Survival curve comparing patients with high (red) and low (black) expression of each SOX gene using the Kaplan–Meier plotter. The plotters were analyzed for liver cancer. (b) Correlation heat map of SOX4, SOX11, and SOX12 expression data, generated using TCGA-LIHC RNA sequencing data from the cBioPortal database. Pearson’s correlation was calculated among the three SOX genes to determine the co-expression pattern of genes in the heat map. (c) Venn diagram of the genes positively correlated with the three SOX genes, generated using the TCGA-LIHC transcriptome dataset from the R2 database. (d) Reactome pathway analysis of the genes positively correlated with the three SOX genes, using the TCGA-LIHC transcriptome dataset.
Jpm 11 00823 g005aJpm 11 00823 g005b
Figure 6. Correlation of SOX4, SOX11, and SOX12 expression with the prognosis of sarcoma, and analysis of positively correlated genes with the three SOX genes. (a) Survival curve comparing patients with high (red) and low (black) expression of each SOX gene from the Kaplan–Meier plotter. The plotters were analyzed for sarcoma. (b) Correlation heat map of SOX4, SOX11, and SOX12 expression data, generated using TCGA-SARC RNA sequencing data from cBioPortal database. Pearson’s correlation was calculated among the three SOX genes to determine the co-expression pattern of genes in the heat map. (c) Venn diagram of the genes positively correlated with the three SOX genes, generated using the -TCGA-SARC dataset from the R2 database. (d) Reactome pathway analysis of the genes positively correlated with the three SOX genes, using TCGA-SARC transcriptome dataset.
Jpm 11 00823 g006
Figure 7. Functional protein partners and their predicted signaling pathways.
Jpm 11 00823 g007
Table 1. KEGG pathway analysis of individual functional protein partners correlated with the three SOX genes.
#Term IDTerm DescriptionFalse Discovery Rate
hsa05213Endometrial cancer2.20 × 10−20
hsa05215Prostate cancer4.75 × 10−18
hsa05200Pathways in cancer2.24 × 10−17
hsa04310Wnt signaling pathway2.61 × 10−16
hsa05226Gastric cancer2.92 × 10−16
hsa04520Adherens junction3.34 × 10−16
hsa05225Hepatocellular carcinoma7.38 × 10−16
hsa05165Human papillomavirus infection2.76 × 10−15
hsa05217Basal cell carcinoma5.93 × 10−15
hsa05206MicroRNAs in cancer8.70 × 10−15
hsa04390Hippo signaling pathway9.90 × 10−15
hsa05210Colorectal cancer6.99 × 10−14
hsa05224Breast cancer2.64 × 10−13
hsa04934Cushing’s syndrome3.71 × 10−13
hsa05216Thyroid cancer4.14 × 10−13
hsa04115p53 signaling pathway4.94 × 10−13
hsa04110Cell cycle1.55 × 10−12
hsa05166HTLV-I infection4.71 × 10−11
hsa04916Melanogenesis4.15 × 10−10
hsa04218Cellular senescence4.27 × 10−10
Table 2. Reactome pathway analysis of individual functional protein partners correlated with the three SOX genes.
#Term IDTerm DescriptionFalse Discovery Rate
HSA-201681TCF-dependent signaling in response to WNT4.69 × 10−15
HSA-3769402Deactivation of the β-catenin transactivating complex4.69 × 10−15
HSA-8878159Transcriptional regulation by RUNX31.63 × 10−12
HSA-212436Generic Transcription Pathway3.64 × 10−12
HSA-2990846SUMOylation5.69 × 10−12
HSA-74160Gene expression (Transcription)9.40 × 10⁻¹²
HSA-195253Degradation of β-catenin by the destruction complex1.42 × 10−11
HSA-162582Signal Transduction3.63 × 10−11
HSA-1640170Cell Cycle4.88 × 10−11
HSA-201722Formation of the β-catenin/TCF transactivating complex7.06 × 10−11
HSA-6804760Regulation of TP53 activity through methylation4.81 × 10−10
HSA-3065678SUMO is transferred from E1 to E2 (UBE2I, UBC9)6.14 × 10⁻¹⁰
HSA-4411364Binding of TCF/LEF: CTNNB1 to target gene promoters1.59 × 10−9
HSA-8951430RUNX3 regulates WNT signaling1.59 × 10−9
HSA-3108232SUMO E3 ligases SUMOylate target proteins1.86 × 10−9
HSA-69563p53-dependent G1 DNA Damage Response3.53 × 10−9
HSA-1643685Disease4.70 × 10−9
HSA-3700989Transcriptional Regulation by TP536.39 × 10−9
HSA-5663202Diseases of signal transduction6.39 × 10−9
HSA-6804757Regulation of TP53 Degradation6.39 × 10−9
Publisher’s Note: MDPI stays neutral with regard to jurisdictional claims in published maps and institutional affiliations.

