Abstract
Patients with end-stage renal disease have a high prevalence of cardiovascular disease. Chest radiography can be used to assess cardiothoracic ratio (CTR) and aortic arch calcification (AoAC). The aims of this longitudinal follow-up study were to investigate factors associated with changes in CTR and AoAC and understand whether these changes are associated with overall and cardiovascular mortality in hemodialysis (HD) patients. We enrolled 260 patients undergoing HD who had at least two available chest X-rays from 2008 to 2015. CTR and AoAC were assessed in each patient using measurements from baseline and annual chest X-rays. The CTR increased from 49.05% to 51.86% and the AoAC score increased from 3.84 to 9.73 over 7 years. The estimated slopes were 0.24 (p < 0.0001) for CTR and 0.08 (p = 0.0441) for AoAC. Increased AoAC, older age, female sex, coronary artery disease, and decreased albumin were associated with an increase in CTR, and older age, cerebrovascular disease, decreased albumin, increased Kt/V, and the use of antiplatelet agents were associated with an increase in AoAC. During follow-up, 136 of the 260 (52.3%) patients died, of whom 72 died due to cardiovascular causes. The change in CTR was greater in those who died (p = 0.0125) than in those who survived. The AoAC score was also higher in those who died than in those who survived, although there was no significant difference in the change in AoAC between the two groups (p = 0.8035). CTR and AoAC increased significantly over time in the HD patients in this longitudinal follow-up study, and the change in CTR was greater in those who died than in those who survived. Chest radiography is a simple and useful tool to assess the progression of CTR and AoAC as a prognostic marker.
1. Introduction
Cardiovascular disease is the leading cause of mortality in patients with end-stage renal disease (ESRD), accounting for 43% of all deaths [1]. Compared to the general population in whom coronary heart disease is the leading cause of cardiac death, cardiomyopathy is the most common cardiovascular-related cause of death in dialysis patients [1]. As many as 75% of dialysis patients have been reported to have left ventricular hypertrophy (LVH) [2], which is characterized by an increased cardiothoracic ratio (CTR) on chest radiograph. A 4-year cohort study suggested an association between a high baseline CTR and increased overall mortality and cardiovascular events [3].
The pathogenesis of cardiovascular disease in patients with chronic kidney disease (CKD) is a multifactorial process. In addition to traditional cardiovascular risk factors, mineral metabolism abnormalities, lower levels of circulating and locally produced calcification inhibitors, and the use of calcium-based phosphorus binders and vitamin D have also been shown to lead to the development of vascular calcification [4]. Several studies have demonstrated that aortic arch calcification (AoAC) can be used to predict cardiovascular events and overall mortality in dialysis patients [5,6,7]. Clinically, vascular calcification can be detected using various imaging modalities, including plain radiography, computed tomography (CT), sonography, magnetic resonance imaging, and 18F-fluoride positron emission tomography [8]. Of these modalities, chest radiography is non-invasive and widely available, and it can be used to evaluate both CTR and AoAC.
Despite the documented associations of CTR and AoAC with overall and cardiovascular mortality in hemodialysis (HD) patients, the significance of their changes over time and their clinical application still remain unclear. Therefore, the aims of this study were to investigate factors associated with changes in CTR and AoAC and explore whether these changes are associated with overall and cardiovascular mortality in HD patients.
2. Study Patients and Methods
2.1. Study Patients and Design
This longitudinal follow-up study was performed at a dialysis clinic in Kaohsiung Medical University Hospital (KMUH) in Taiwan, and the methods were conducted following the relevant guidelines. The Institutional Review Board of KMUH approved the study protocol. All of the study patients provided written informed consent before being enrolled into this study.
Patients were included if they (1) were >20 years of age, (2) had been receiving maintenance HD therapy three times a week for ≥3 months, and (3) had been prescribed with anti-hypertensive or oral hypoglycemic agents for ≥1 month. Patients with only one chest X-ray measurement during the follow-up period were excluded (n = 63). Patients who had been transferred to another hospital (n = 51) and those who had received a renal transplantation (n = 4) were also excluded. Finally, a total of 260 patients were enrolled from December 2008 to December 2015. For the patients who started HD during or before 2008, their baseline data were defined as those recorded in 2008; for the patients who entered the study from 2009 to 2015, their baseline data were considered to be those recorded in the year of entry.
2.2. Evaluation of CTR and AoAC by Chest X-ray
Chest plain film X-rays of the enrolled patients were reviewed by one experienced radiologist who was blinded to the patients’ clinical data. CTR was calculated by dividing the transverse cardiac diameter by the transverse thoracic diameter as measured by chest X-ray. AoAC was measured using the scale developed by Ogawa et al. [9], in which the aortic arch as visualized on chest X-ray is divided into 16 sections by circumference, and the number of calcified sections was counted. Chest X-ray measurements were done for each patient every December. The CTR was defined as the ratio of a transverse diameter of the cardiac shadow to the transverse diameter of the chest on chest X-ray, with cardiomegaly defined as CTR > 50% [10]. Besides, in this study, we used the median score of AoAC to classify abnormal values of AoAC.
2.3. Laboratory, Medica, and Demographic Data
Data including age, sex, smoking history (ever vs. never), and comorbidities were obtained from patient interviews and a review of medical records. Fasting blood samples were obtained ≤1 month of enrollment into the study and processed using an autoanalyzer (COBAS Integra 400, Roche Diagnostics GmbH, D-68298, Mannheim, Germany). Dialysis efficiency was assessed according to Kt/V, which was determined using the Daugirdas formula [11]. The ultrafiltration rate was calculated as the volume of fluid removed per second of HD adjusted for the patients’ body weight before HD. In addition, data on prescribed medications, including angiotensin-converting enzyme inhibitors, angiotensin II receptor blockers, antiplatelet agents, and HMG-CoA reductase inhibitors (statins) during the study period, were obtained from the patients’ medical records.
2.4. Definitions of Overall and Cardiovascular Mortality
Data on mortality were obtained from the medical records of the patients. The causes of death (overall and cardiovascular) were confirmed by two cardiologists, with any disagreements being resolved through consensus with a third cardiologist. The patients were followed until death or March 2021, whichever occurred first.
2.5. Reproducibility
Reproducibility of AoAC measurements was assessed in 30 randomly selected patients by one trained medical doctor and one experienced radiologist. The mean percentage error was calculated by dividing the absolute difference by the average of two observations.
2.6. Statistical Analysis
Data were expressed as percentages or mean ± standard deviation. Characteristics of the study patients for the continuous and categorical variables were analyzed by t-test/Wilcoxon rank sum test, and the chi-squared test/Fisher exact test, as appropriate, for comparisons between groups. A repeated-measures generalized model analysis was used to evaluate yearly changes in CTR and AoAC. This approach treated each CTR and AoAC measure from each participant as a separate observation and was adjusted for within-participant correlations. Subjects were treated as random effects so the analysis was adjusted to each individual’s own CTR and AoAC levels. An exchangeable working correlation structure was accounted for within-patient correlation. This model also explored the significance of risk factors at individual yearly measures for the CTR and AoAC change in death and non-death groups separately as well as between cardiovascular death and non-death groups. Potential confounding factors were also included in the analysis model as covariates, which included age, sex, smoking history, diabetes mellitus, hypertension, coronary artery disease, cerebrovascular disease, duration of HD, albumin, total cholesterol, triglyceride, fasting glucose, glycated hemoglobin (HbA1c), uric acid, calcium–phosphorus product, Kt/V, and medications use. Statistical significance was set at p < 0.05. The Kaplan–Meier method was used to plot survival curves for overall and cardiovascular survival. Statistical analysis was performed using the SAS statistical package version 9.4 (SAS Institutes, Cary, NC, USA).
3. Results
A total of 260 HD patients were included. The mean age was 57.3 ± 12.4 years, with 127 men and 136 women. The median CTR and AoAC scores were 50% and 3, respectively. The mean percent error for AoAC measurements was 12.3 ± 12.3%.
3.1. Comparison of the Clinical Characteristics among These Study Groups
A comparison of the clinical characteristics among these study groups is shown in Table 1. Compared to patients with CTR ≤ 50%, patients with CTR > 50% have higher CTR, higher AoAC, older age, more female, lower smoking history, shorter duration of HD, lower albumin, and higher fasting glucose. Besides, compared to patients with AoAC ≤ 3, patients with AoAC > 3 have higher CTR, higher AoAC, older age, higher prevalence of coronary artery disease, higher prevalence of cerebrovascular disease, lower albumin, higher total calcium, and higher prevalence of antiplatelet agent use.

Table 1.
Comparison of baseline characteristics between patients with CTR > 50 or ≤50 and AoAC >3 or ≤3.
3.2. Time Course of Mean Change in CTR or AoAC from Baseline (0 Year) to 7 Years
Figure 1 illustrates mean CTR (blue) and AoAC (red) at each follow-up year in the study patients. The CTR (unadjusted β: 0.35, SE: 0.06, p < 0.0001) and AoAC (unadjusted β: 0.19, SE: 0.04, p < 0.0001) increased yearly.
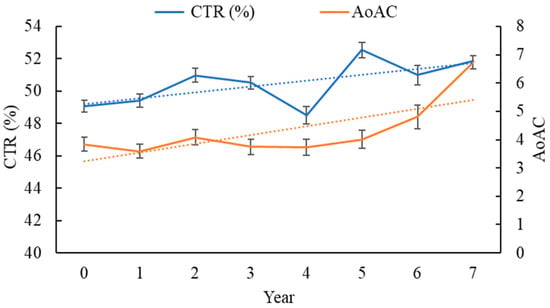
Figure 1.
Mean CTR (blue) and AoAC (red) at each follow-up year in study patients (n = 260).
Table 2 shows the time course of mean change in CTR or AoAC from baseline (0 year) to 7 years. In terms of CTR changes in HD patients, the CTR increased from 49.05% to 51.86% and AoAC score increased from 3.84 to 6.73 over 7 years. When adjusting by all potential confounders in the repeated-measures generalized model, including age, sex, smoking history, diabetes mellitus, hypertension, coronary artery disease, cerebrovascular disease, duration of HD, albumin, total cholesterol, triglyceride, fasting glucose, HbA1c, uric acid, calcium–phosphorous product, Kt/V, ultrafiltration rate, and medications use, using the estimated slopes by a repeated-measures generalized model showed 0.24 (95% CI, 0.13 to 0.35; p < 0.0001) for CTR and 0.08 (95% CI, 0.002 to 0.16; p = 0.0441) for AoAC.
Table 2.
Time course of mean change in CTR or AoAC from baseline (0 year) to 7 years.
3.3. Determinants of CTR and AoAC Yearly Change in Study Patients
Table 3 shows the main effects of the variables on CTR or AoAC change over year in HD patients. In the multivariable analysis, using the repeated-measures generalized model, the main effects of the variables on CTR change in HD patients are increased AoAC (coefficient: 0.11; p = 0.0183), age > 60 years old (coefficient: 1.55; p = 0.0019), female (vs. male; coefficient: −3.51; p < 0.0001), coronary artery disease (coefficient: 1.88; p = 0.0038), and decreased albumin (coefficient: −1.86; p = 0.0006) were significantly associated with an increase in CTR. As for AoAC, the main effects of the variables on AoAC change in HD patients are age > 60 years old (coefficient: 1.13; p = 0.0001), cerebrovascular disease (coefficient: 1.79; p = 0.0089), decreased albumin (coefficient: −1.17; p < 0.0001), increased Kt/V (coefficient: 1.60; p < 0.0001), and antiplatelet agent use (coefficient: 1.01; p = 0.0262) were significantly associated with an increase in AoAC.
Table 3.
Main effects of the variables on CTR or AoAC change over year in hemodialysis patients.
3.4. Risk of Overall Mortality
During the follow-up period, 136 deaths were recorded among these 260 patients (52.3%), including cardiovascular deaths (n = 72), malignancy (n = 14), infectious disease (n = 33), gastrointestinal bleeding (n = 7), and others (n = 10).
A comparison of the clinical characteristics between patients with or without death is shown in Table 4. Compared to patients with non-death, patients with death have higher baseline CTR, higher baseline AoAC, older age, higher smoking history, higher prevalence of diabetes mellitus, higher prevalence of coronary artery disease, higher prevalence of cerebrovascular disease, shorter duration of HD, lower albumin, higher fasting glucose, and higher percentage of antiplatelet agent use.
Table 4.
Comparison of baseline characteristics between patients with or without death.
3.5. Time Course of Mean Change in CTR or AoAC from Baseline (0 Year) to 7 Years in Death and Non-Death Groups
Figure 2 illustrates mean CTR (A) and AoAC (B) at each follow-up year for death (blue, n = 136) and non-death (red, n = 124) patients. The CTR (unadjusted β: 0.60, SE: 0.11, p < 0.0001) increased yearly in the death group, and significantly more than in the non-death group (unadjusted β: 0.21, SE: 0.06, p = 0.0002). The AoAC (unadjusted β: 0.23, SE: 0.06, p = 0.0002) increased yearly in the death group, and more than in the non-death group (unadjusted β: 0.18, SE: 0.05, p = 0.0002), but without achieving significance (p = 0.5006).
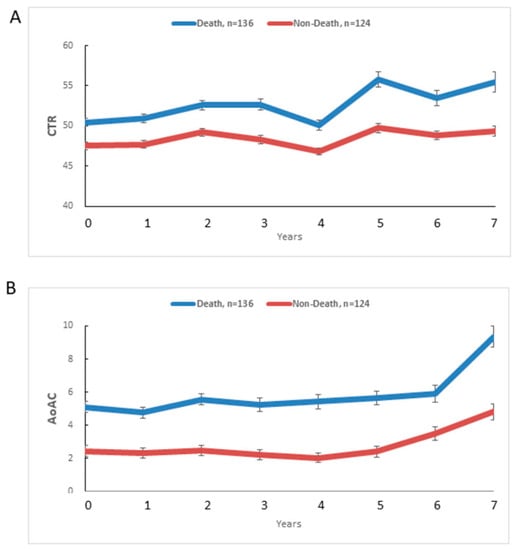
Figure 2.
Mean CTR (A) and AoAC (B) at each follow-up year for death (blue, n = 136) and non-death (red, n = 124) patients.
Table 5 shows the time course of mean change in CTR or AoAC from baseline (0 year) to 7 year in death and non-death groups. In terms of CTR changes, the CTR increased from 50.43% to 55.46% over 7 years in the death group, and from 47.54% to 49.34% in the non-death group. When adjusting by all potential confounders in the repeated-measures generalized model, including age > 60 years old, smoking history, diabetes mellitus, coronary artery disease, cerebrovascular disease, duration of HD, albumin, fasting glucose, and antiplatelet agent use (significant variables in Table 4), using the estimated slopes by a repeated-measures generalized model, the adjusted difference between the death and non-death groups showed 0.30 (95% CI, 0.06 to 0.53; p = 0.0125) for CTR.
Table 5.
Time course of mean change in CTR or AoAC from baseline (0 year) to 7 years in the death and non-death groups.
As for AoAC changes, the AoAC increased from 5.10 to 9.34 over 7 years in the death group, and from 2.45 to 4.81 in the non-death group. The adjusted difference of AoAC in the death group was significantly higher than that in the non-death group at each year (from 0 year to 7 years, p ≤ 0.0156), but the yearly change in AoAC between the death and the non-death groups did not achieve significance (p = 0.8035). We further performed the time course of logarithmic transformation change in AoAC from baseline (0 year) to 7 years in the death and non-death groups and found similar results.
3.6. Risk of Cardiovascular Mortality
The 72 cardiovascular deaths documented during the follow-up included heart failure (n = 30), myocardial infarction (n = 10), ventricular fibrillation (n = 22), and hemorrhagic stroke (n = 10).
3.7. Time Course of Mean Change in CTR or AoAC from Baseline (0 Year) to 7 Years in Cardiovascular Death and Non-Death Groups
Figure 3 illustrates mean CTR (A) and AoAC (B) at each follow-up year for cardiovascular death (blue, n = 72) and non-death (red, n = 124) patients. The CTR (unadjusted β: 0.50, SE: 0.14, p = 0.0003) increased yearly in the cardiovascular death group, and significantly more than in the non-death group (unadjusted β: 0.21, SE: 0.06, p = 0.0002). The AoAC (unadjusted β: 0.17, SE: 0.07, p = 0.0185) increased yearly in the cardiovascular death group, and more than in the non-death group (unadjusted β: 0.18, SE: 0.05, p = 0.0002), but without achieving significance (p = 0.9103).
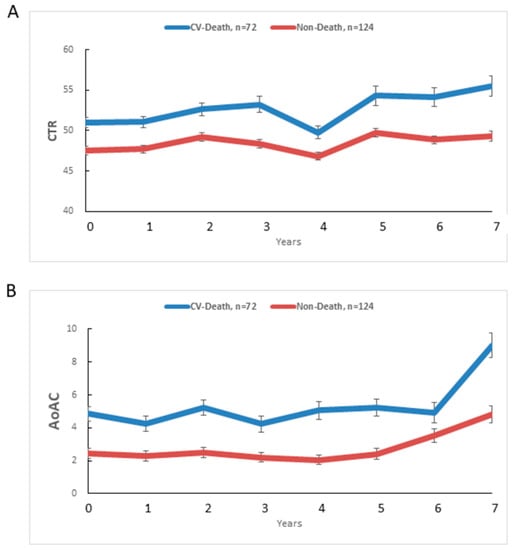
Figure 3.
Mean CTR (A) and AoAC (B) at each follow-up year for cardiovascular death (blue, n = 72) and non-death (red, n = 124) patients.
Table 6 shows the time course of mean change in CTR or AoAC from baseline (0 year) to 7 years in cardiovascular death and non-death groups. In terms of CTR changes, the CTR increased from 50.98% to 55.49% over 7 years in the cardiovascular death group, and from 47.54% to 49.34% in the non-death group. The adjusted difference of CTR in the cardiovascular death group was significantly higher than that in the non-death group at 0, 1, 3, 6, and 7 years, but the yearly change in CTR between cardiovascular death and non-death groups did not achieve significance (p = 0.0917).
Table 6.
Time course of mean change in CTR or AoAC from baseline (0 year) to 7 years in cardiovascular death and non-death groups.
As for AoAC changes, the AoAC increased from 4.86 to 9.00 over 7 years in the cardiovascular death group, and from 2.45 to 4.81 in the non-death group. The adjusted difference of AoAC in the cardiovascular death group was significantly higher than that in the non-death group at 0, 2, 4, 5, and 7 years, but the yearly change in AoAC between cardiovascular death and non-death groups was not achieving significance (p = 0.7461). We further performed the time course of logarithmic transformation change in AoAC from baseline (0 year) to 7 years in cardiovascular death and non-death groups and found similar results.
3.8. Correlation between Baseline CTR and Baseline AoAC with Overall Mortality
Table 7 shows the association between baseline CTR and baseline AoAC with overall mortality. After multivariable analysis, baseline CTR (per 1%; odds ratio [OR] = 1.09; 95% confidence interval [CI] = 1.02 to 1.17; p = 0.0133), and baseline AoAC (per 1 score; OR = 1.23; 95% CI = 1.11 to 1.37; p < 0.0001) were significantly associated with increased overall mortality.
Table 7.
Association between baseline CTR and AoAC with overall mortality.
We further performed Kaplan–Meier survival curve for overall and cardiovascular mortality. Figure 4 illustrates the Kaplan–Meier curves of overall survival (log-rank p < 0.0001) according to (A) CTR > 50% or ≤ 50%, and (B) AoAC > 3 or ≤3 in study patients. The CTR > 50% group had worse overall survival than the ≤ 50% group. The AoAC > 3 group had worse overall survival than the AoAC ≤ 3 group. Figure 5 illustrates the Kaplan–Meier curves of cardiovascular survival (log-rank p < 0.0001) according to (A) CTR > 50% or ≤50%, and (B) AoAC > 3 or ≤3 in study patients. The CTR > 50% group had worse cardiovascular survival than the ≤50% group. The AoAC > 3 group had worse cardiovascular survival than the AoAC ≤ 3 group.
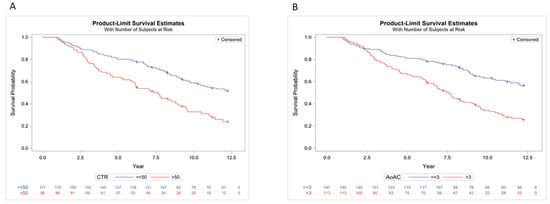
Figure 4.
Kaplan–Meier analysis of overall mortality according to (A) CTR > 50% or ≤50%, and (B) AoAC > 3 or ≤3 in study patients (all log-rank p < 0.0001).
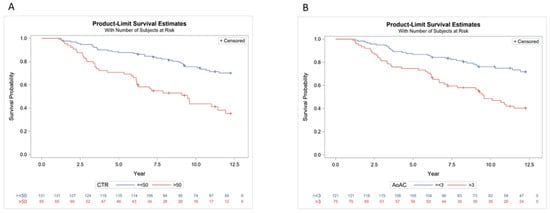
Figure 5.
Kaplan–Meier analysis of CV mortality according to (A) CTR > 50% or ≤50%, and (B) AoAC > 3 or ≤3 in study patients (all log-rank p < 0.0001).
3.9. Correlation between ΔCTR and ΔAoAC with Overall Mortality
Table 8 shows the association between ΔCTR and ΔAoAC with overall mortality. ΔCTR or ΔAoAC are defined as last year CTR or AoAC minus baseline CTR or AoAC over time. After multivariable analysis, ΔCTR (per 1%; OR = 1.13; 95% CI = 1.06 to 1.21; p = 0.0003) was significantly associated with increased overall mortality. However, ΔAoAC (per 1 score; OR = 0.97; 95% CI = 0.88 to 1.08; p = 0.6084) was not.
Table 8.
Association of ΔCTR and ΔAoAC with overall mortality.
4. Discussion
In this cohort study, we demonstrated that CTR increased significantly over time in patients undergoing HD, and that the change in CTR was greater in those who died than in those who survived. In addition, AoAC significantly increased over time, and the AoAC score was higher in those who died than in those who survived, although there was no significant difference in the change in AoAC between the two groups.
There are several important findings in this study. First, CTR increased over time in the HD patients, and the change in CTR was greater in those who died. An increase in CTR on chest radiography has been reported to indicate cardiomegaly, which is associated with cardiac hypertrophy and volume overload. LVH is common in patients with CKD, and starts early in the disease [12]. Foley et al. reported that progressive concentric LVH occurred in 596 incident HD patients without symptomatic cardiac diseases after 2 years of follow-up, and that left ventricular (LV) mass increased in 326 (62.6%) patients and LV volume increased in 258 (49.2%) patients [13]. In addition, several studies have reported associations between LVH and cardiovascular events and mortality in dialysis patients [3,14]. The increase in LV mass in ESRD patients is caused by increases in the LV end-diastolic diameter and LV wall thickness, which is often combined with the features of eccentric and concentric hypertrophy [15]. The mechanisms underlying LVH are complex, and include chronic volume overload, arterial stiffness, elevated systolic blood pressure, anemia, activation of the renin–angiotensin and sympathetic nervous systems, and CKD-related mineral and bone disorders [16]. Although CTR provided a simple and cheap method for detecting patients with LVH and cardiac overload, it could not completely replace echocardiography. Echocardiography could yield important additional information, such as valve function, valve calcification, and regional left ventricular wall motion.
The second important finding of this study is that AoAC significantly increased over time, and that the AoAC score was higher in those who died than in those who survived. Vascular calcification develops early and progresses over time in patients with CKD [17]. Braun et al. were the first to report a marked increase in coronary artery calcium score in HD patients after only 1 year as measured by CT [18]. In addition, Goodman et al. reported that the average calcification score nearly doubled in under 2 years in young patients undergoing dialysis, indicating the rapid progression of coronary artery calcification [19]. These findings suggest that vascular calcification progresses over time after the initiation of HD. However, the degree and rate of vascular calcification varies widely between patients. Bellasi et al. demonstrated that patients with CKD without or with low coronary artery calcification at baseline had minimal progression after 30 months of follow-up [20]. The development of vascular calcification depends on the transdifferentiation of vascular smooth muscle cells to osteoblast-like cells. This can be caused by high calcium and phosphorus burden due to abnormal bone metabolism, oxidative stress, inflammatory cytokines, imbalance in pro-calcific and anti-calcific mediators, cellular apoptosis, the presence of matrix vesicles, uremia, and the use of calcium-containing phosphate binders or calcitriol [4,21].
Analysis of the risk factors affecting the change in CTR and vascular calcification over time showed that an increase in AoAC, older age, female sex, coronary artery disease, and decreased albumin were associated with a greater change in CTR. Age is a non-modifiable cardiovascular risk factor that contributes to arterial stiffness, increased LV afterload, and exacerbated LVH. Hence, an older age may be associated with increased CTR [22]. We also found that the female patients had a higher risk of CTR progression, which is consistent with a study by Cheng et al., who reported that female patients had a 2.5- to 4-fold higher likelihood of developing LVH than male patients after adjusting for potential confounding factors [23]. This may be because a significant difference in cardiac adaptation to pressure overload between males and females has been shown [24]. In addition, we found that a faster decline in albumin was associated with a faster increase in CTR. Chen et al. and Yen et al. reported negative correlations between serum albumin level and CTR in patients without [22] and with diabetes [25] undergoing HD. Furthermore, previous studies have demonstrated relationships among inflammation, malnutrition, and fluid overload in patients undergoing dialysis [26,27,28]. Fluid overload can cause gastrointestinal edema and deficient ingestion, subsequently leading to malnutrition [26]. Inflammatory status can also worsen malnutrition and artherosclerosis [25,28]. Consequently, both fluid overload and artherosclerosis may contribute to the progression of CTR, and partially explain our findings.
Regarding AoAC, older age, cerebrovascular disease, decreased albumin, increased Kt/V, and the use of antiplatelet agents were associated with an increase in AoAC. In addition, we found that a faster decline in albumin was associated with a faster increase in AoAC. The inter-relationships among malnutrition, inflammatory status, and progression of vascular calcification in patients with CKD, which is known as malnutrition–inflammation–atherosclerosis syndrome, have been demonstrated in previous studies [28,29,30]. Another interesting finding in our study is that an increase in ΔKt/V was associated with a higher AoAC, which is consistent with the study by Park et al. [31]. The positive association between high dialysis dose and hemodiafiltration and the severity of vascular calcification may be due to a higher dialysis dose resulting in greater changes in hemodynamics and promoting the loss of fetuin-A, an inhibitor of vascular calcification. Another possible explanation may be that Kt/V is negatively correlated to body weight, and a smaller body size may be associated with malnutrition, chronic inflammation, and atherosclerosis. Another important finding of our study is that the progression of AoAC was positively correlated with the change in CTR. Several studies have shown associations among vascular calcification, arterial stiffness and LVH [32,33]. Vascular calcification results in arterial stiffness, which then increases LV afterload and contributes to LVH. Vascular calcification and LVH have been shown to exacerbate each other and have a longitudinal relationship [33], and the synergistic interaction between vascular calcification and LVH has also been shown to increase the risk of mortality and cardiovascular events [33].
Another major finding of the present study is that the changes in CTR and AoAC over time were more severe in the patients who died than in those who survived, but that only the change in CTR was significant. Previous studies have reported associations between higher baseline CTR and vascular calcification with adverse outcomes in patients undergoing dialysis [3,14,34,35,36]. Other studies have also reported that changes in LVH and AoAC during follow-up were independently associated with cardiovascular events in dialysis patients [37,38,39,40]. Several possible mechanisms may explain how the progression of LVH increases the risk of unfavorable outcomes. LVH is associated with myocardial fibrosis and diastolic dysfunction, both of which contribute to the development of heart failure. In addition, LVH decreases coronary perfusion, leading to cardiac ischemia, myocardial infarction, and life-threatening arrhythmias [37]. In addition, the progression of vascular calcification is associated with arterial stiffness, which then leads to LVH and diastolic heart failure, and ultimately compromised coronary perfusion [36]. However, in our study, there was no significant difference in progression of AoAC between those who died and survived. We hypothesize that one possible mechanism is different types of vascular calcification. AoAC cannot be completely differentiated from intimal and medial vascular calcification on chest radiography, and arterial medial calcification is a much stronger risk factor for the development of arterial stiffness, heart failure, and lethal arrhythmias, leading to cardiovascular events and mortality in dialysis patients. On the other hand, AoAC could be associated with other parallel physiopathological factors that lead to an increase in cardiovascular death.
A strength of this study is that we used repeated measurements to evaluate changes in CTR and AoAC over a longitudinal follow-up period, and few previous studies have investigated the prognostic value of longitudinal changes in CTR and AoAC in dialysis patients. However, there are still several limitations. First, the relatively small study population may have reduced the statistical power of the study. Further studies with a larger sample size are needed to verify our findings. Second, measuring AoAC on plain chest radiographs cannot discriminate between intimal or medial layer calcification. The etiology of vascular calcification contributes to the diverse pathogenesis and clinical outcomes, which may affect the therapeutic strategy. Third, evaluating AoAC on plain chest X-ray is less sensitive than CT, although chest radiography is a simple and non-invasive tool. In addition, body size, overlapping structures, and experience of the observer may influence the assessment of AoAC. Despite prior research indicating that AoAC is positively connected with coronary artery calcium score, it is important to note that coronary artery calcium score is a more accurate tool for predicting cardiovascular events and guiding therapy. Fourth, we did not control for some confounders in this observation study, including body size, fluid status, use of vitamin D, calcium-containing or non-calcium-containing phosphate binders, and cinacalcet, which have been reported to affect survival.
In conclusion, we found that CTR and AoAC increased significantly over time in the HD patients in this study, and that the change in CTR was greater in those who died than in those who survived. Our findings indicate that changes in CTR and AoAC as assessed on simple chest radiography may be a useful marker to predict clinical outcomes in HD patients.
Author Contributions
Conceptualization, T.-L.C., Y.-H.L.,J.-C.H., P.-Y.W., H.-P.T., S.-C.C. and J.-M.C.; methodology, Y.-H.L., J.-C.H., P.-Y.W., S.-C.C. and J.-M.C., formal analysis, H.-P.T. and S.-C.C., investigation, T.-L.C., Y.-H.L., J.-C.H., P.-Y.W., H.-P.T., S.-C.C. and J.-M.C.; writing—original draft preparation, T.-L.C.; writing—review and editing, S.-C.C.; supervision, S.-C.C. and J.-M.C.; project administration, S.-C.C.; funding acquisition, S.-C.C. All authors have read and agreed to the published version of the manuscript.
Funding
The research presented in this article is supported by grants from the Kaohsiung Municipal Hsiao-Kang Hospital (S-109-06), Kaohsiung Medical University, Kaohsiung, Taiwan.
Institutional Review Board Statement
The study was conducted according to the guidelines of the Declaration of Helsinki, and approved by the Institutional Review Board of Kaohsiung Medical University Chung-Ho Memorial Hospital (KMUHIRB-E(II)-20150246) and 2015/12/22 approval.
Informed Consent Statement
Informed consent was obtained from all subjects involved in the study.
Data Availability Statement
Data may be available upon request to interested researchers. Please send data requests to: Szu-Chia Chen, PhD, MD. Division of Nephrology, Department of Internal Medicine, Kaohsiung Medical University Hospital, Kaohsiung Medical University.
Conflicts of Interest
We have no financial interest in the information contained in the manuscript.
References
- Ritz, E.; Bommer, J. Cardiovascular problems on hemodialysis: Current deficits and potential improvement. Clin. J. Am. Soc. Nephrol. 2009, 4 (Suppl. 1), S71–S78. [Google Scholar] [CrossRef] [Green Version]
- Sarnak, M.J. Cardiovascular complications in chronic kidney disease. Am. J. Kidney Dis. 2003, 41 (Suppl. 5), 11–17. [Google Scholar] [CrossRef]
- Yotsueda, R.; Taniguchi, M.; Tanaka, S.; Eriguchi, M.; Fujisaki, K.; Torisu, K.; Masutani, K.; Hirakata, H.; Kitazono, T.; Tsuruya, K. Cardiothoracic Ratio and All-Cause Mortality and Cardiovascular Disease Events in Hemodialysis Patients: The Q-Cohort Study. Am. J. Kidney Dis. 2017, 70, 84–92. [Google Scholar] [CrossRef] [PubMed]
- Moe, S.M.; Chen, N.X. Mechanisms of vascular calcification in chronic kidney disease. J. Am. Soc. Nephrol. 2008, 19, 213–216. [Google Scholar] [CrossRef] [Green Version]
- Komatsu, M.; Okazaki, M.; Tsuchiya, K.; Kawaguchi, H.; Nitta, K. Aortic arch calcification predicts cardiovascular and all-cause mortality in maintenance hemodialysis patients. Kidney Blood Press Res. 2014, 39, 658–667. [Google Scholar] [CrossRef] [PubMed] [Green Version]
- Lee, C.T.; Huang, C.C.; Hsu, C.Y.; Chiou, T.T.; Ng, H.Y.; Wu, C.H.; Kuo, W.H.; Lee, Y.T. Calcification of the aortic arch predicts cardiovascular and all-cause mortality in chronic hemodialysis patients. Cardiorenal Med. 2014, 4, 34–42. [Google Scholar] [CrossRef] [Green Version]
- Ogawa, T.; Ishida, H.; Akamatsu, M.; Matsuda, N.; Fujiu, A.; Ito, K.; Ando, Y.; Nitta, K. Progression of aortic arch calcification and all-cause and cardiovascular mortality in chronic hemodialysis patients. Int. Urol. Nephrol. 2010, 42, 187–194. [Google Scholar] [CrossRef] [PubMed]
- Smith, E.R.; Hewitson, T.D.; Holt, S.G. Diagnostic Tests for Vascular Calcification. Adv. Chronic Kidney Dis. 2019, 26, 445–463. [Google Scholar] [CrossRef]
- Ogawa, T.; Ishida, H.; Matsuda, N.; Fujiu, A.; Matsuda, A.; Ito, K.; Ando, Y.; Nitta, K. Simple evaluation of aortic arch calcification by chest radiography in hemodialysis patients. Hemodial. Int. Int. Symp. Home Hemodial. 2009, 13, 301–306. [Google Scholar] [CrossRef]
- Kearney, M.T.; Fox, K.A.; Lee, A.J.; Prescott, R.J.; Shah, A.M.; Batin, P.D.; Baig, W.; Lindsay, S.; Callahan, T.S.; Shell, W.E.; et al. Predicting death due to progressive heart failure in patients with mild-to-moderate chronic heart failure. J. Am. Coll. Cardiol. 2002, 40, 1801–1808. [Google Scholar] [CrossRef] [Green Version]
- Daugirdas, J.T.; Depner, T.A.; Gotch, F.A.; Greene, T.; Keshaviah, P.; Levin, N.W.; Schulman, G. Comparison of methods to predict equilibrated Kt/V in the HEMO Pilot Study. Kidney Int. 1997, 52, 1395–1405. [Google Scholar] [PubMed] [Green Version]
- Lopez-Gomez, J.M.; Verde, E.; Perez-Garcia, R. Blood pressure, left ventricular hypertrophy and long-term prognosis in hemodialysis patients. Kidney Int. Suppl. 1998, 68, S92–S98. [Google Scholar] [CrossRef] [Green Version]
- Foley, R.N.; Curtis, B.M.; Randell, E.W.; Parfrey, P.S. Left ventricular hypertrophy in new hemodialysis patients without symptomatic cardiac disease. Clin. J. Am. Soc. Nephrol. 2010, 5, 805–813. [Google Scholar] [CrossRef] [PubMed] [Green Version]
- McCullough, P.A.; Chan, C.T.; Weinhandl, E.D.; Burkart, J.M.; Bakris, G.L. Intensive Hemodialysis, Left Ventricular Hypertrophy, and Cardiovascular Disease. Am. J. Kidney Dis. 2016, 68, S5–S14. [Google Scholar] [CrossRef] [PubMed] [Green Version]
- Gross, M.L.; Ritz, E. Hypertrophy and fibrosis in the cardiomyopathy of Uremia—Beyond coronary heart disease. Semin. Dial. 2008, 21, 308–318. [Google Scholar] [CrossRef] [PubMed]
- Di Lullo, L.; Gorini, A.; Russo, D.; Santoboni, A.; Ronco, C. Left Ventricular Hypertrophy in Chronic Kidney Disease Patients: From Pathophysiology to Treatment. Cardiorenal Med. 2015, 5, 254–266. [Google Scholar] [CrossRef] [Green Version]
- Karohl, C.; D’Marco Gascon, L.; Raggi, P. Noninvasive imaging for assessment of calcification in chronic kidney disease. Nat. Rev. Nephrol. 2011, 7, 567–577. [Google Scholar] [CrossRef]
- Braun, J.; Oldendorf, M.; Moshage, W.; Heidler, R.; Zeitler, E.; Luft, F.C. Electron beam computed tomography in the evaluation of cardiac calcification in chronic dialysis patients. Am. J. Kidney Dis. 1996, 27, 394–401. [Google Scholar] [CrossRef]
- Goodman, W.G.; Goldin, J.; Kuizon, B.D.; Yoon, C.; Gales, B.; Sider, D.; Wang, Y.; Chung, J.; Emerick, A.; Greaser, L.; et al. Coronary-artery calcification in young adults with end-stage renal disease who are undergoing dialysis. N. Engl. J. Med. 2000, 342, 1478–1483. [Google Scholar] [CrossRef]
- Bellasi, A.; Kooienga, L.; Block, G.A.; Veledar, E.; Spiegel, D.M.; Raggi, P. How long is the warranty period for nil or low coronary artery calcium in patients new to hemodialysis? J. Nephrol. 2009, 22, 255–262. [Google Scholar]
- Nelson, A.J.; Raggi, P.; Wolf, M.; Gold, A.M.; Chertow, G.M.; Roe, M.T. Targeting Vascular Calcification in Chronic Kidney Disease. JACC Basic Transl. Sci. 2020, 5, 398–412. [Google Scholar] [CrossRef] [PubMed]
- Chen, K.H.; Lin-Tan, D.T.; Huang, W.H.; Hung, C.C.; Chang, C.T.; Huang, J.Y.; Lin, J.L. Cardiothoracic ratio, malnutrition, inflammation, and two-year mortality in non-diabetic patients on maintenance hemodialysis. Kidney Blood Press Res. 2008, 31, 143–151. [Google Scholar] [CrossRef]
- Cheng, L.T.; Gao, Y.L.; Tian, J.P.; Gu, Y.; Zhang, L.; Bi, S.H.; Tang, W.; Lindholm, B.; Wang, T. Sex difference in the prevalence of left ventricular hypertrophy in dialysis patients. Am. J. Nephrol. 2009, 29, 398–405. [Google Scholar] [CrossRef] [PubMed]
- Zabalgoitia, M.; Ur Rahman, S.N.; Haley, W.E.; Oneschuk, L.; Yarrows, S.; Yunis, C.; Lucas, C.; Linn, W.; Krause, L.; Amerena, J. Gender dimorphism in cardiac adaptation to hypertension is unveiled by prior treatment and efficacy. Am. J. Cardiol. 1996, 78, 838–840. [Google Scholar] [CrossRef]
- Yen, T.H.; Lin, J.L.; Lin-Tan, D.T.; Hsu, K.H. Cardiothoracic ratio, inflammation, malnutrition, and mortality in diabetes patients on maintenance hemodialysis. Am. J. Med. Sci. 2009, 337, 421–428. [Google Scholar] [CrossRef]
- Cheng, L.T.; Tang, W.; Wang, T. Strong association between volume status and nutritional status in peritoneal dialysis patients. Am. J. Kidney Dis. 2005, 45, 891–902. [Google Scholar] [CrossRef] [PubMed]
- Dekker, M.J.E.; Konings, C.; Canaud, B.; van der Sande, F.M.; Stuard, S.; Raimann, J.G.; Ozturk, E.; Usvyat, L.; Kotanko, P.; Kooman, J.P. Interactions Between Malnutrition, Inflammation, and Fluid Overload and Their Associations with Survival in Prevalent Hemodialysis Patients. J. Ren. Nutr. 2018, 28, 435–444. [Google Scholar] [CrossRef]
- Stenvinkel, P.; Heimburger, O.; Lindholm, B.; Kaysen, G.A.; Bergstrom, J. Are there two types of malnutrition in chronic renal failure? Evidence for relationships between malnutrition, inflammation and atherosclerosis (MIA syndrome). Nephrol. Dial. Transplant. 2000, 15, 953–960. [Google Scholar] [CrossRef] [Green Version]
- Okamoto, T.; Hatakeyama, S.; Kodama, H.; Horiguchi, H.; Kubota, Y.; Kido, K.; Momota, M.; Hosogoe, S.; Tanaka, Y.; Takashima, T.; et al. The relationship between poor nutritional status and progression of aortic calcification in patients on maintenance hemodialysis. BMC Nephrol. 2018, 19, 71. [Google Scholar] [CrossRef]
- Choi, S.R.; Lee, Y.K.; Cho, A.J.; Park, H.C.; Han, C.H.; Choi, M.J.; Koo, J.R.; Yoon, J.W.; Noh, J.W. Malnutrition, inflammation, progression of vascular calcification and survival: Inter-relationships in hemodialysis patients. PLoS ONE 2019, 14, e0216415. [Google Scholar] [CrossRef]
- Park, S.K.; Kim, W.J.; Kim, H.J.; Kim, H.W.; Kim, B.; Lee, H.J.; Lee, S.Y.; Lee, Y.H.; Kim, D.J.; Jeong, K.H.; et al. High dose haemodialysis and haemodiafiltration parameters and the relationship with advanced vascular calcification. BMC Nephrol. 2020, 21, 86. [Google Scholar] [CrossRef]
- Nitta, K.; Akiba, T.; Uchida, K.; Otsubo, S.; Otsubo, Y.; Takei, T.; Ogawa, T.; Yumura, W.; Kabaya, T.; Nihei, H. Left ventricular hypertrophy is associated with arterial stiffness and vascular calcification in hemodialysis patients. Hypertens. Res. 2004, 27, 47–52. [Google Scholar] [CrossRef] [PubMed] [Green Version]
- Hwang, H.S.; Cho, J.S.; Hong, Y.A.; Chang, Y.K.; Kim, S.Y.; Shin, S.J.; Yoon, H.E. Vascular calcification and left ventricular hypertrophy in hemodialysis patients: Interrelationship and clinical impacts. Int. J. Med. Sci. 2018, 15, 557–563. [Google Scholar] [CrossRef] [Green Version]
- London, G.M.; Guerin, A.P.; Marchais, S.J.; Metivier, F.; Pannier, B.; Adda, H. Arterial media calcification in end-stage renal disease: Impact on all-cause and cardiovascular mortality. Nephrol. Dial. Transplant. 2003, 18, 1731–1740. [Google Scholar] [CrossRef]
- Iijima, K.; Hashimoto, H.; Hashimoto, M.; Son, B.K.; Ota, H.; Ogawa, S.; Eto, M.; Akishita, M.; Ouchi, Y. Aortic arch calcification detectable on chest X-ray is a strong independent predictor of cardiovascular events beyond traditional risk factors. Atherosclerosis 2010, 210, 137–144. [Google Scholar] [CrossRef]
- Lee, M.J.; Shin, D.H.; Kim, S.J.; Oh, H.J.; Yoo, D.E.; Ko, K.I.; Koo, H.M.; Kim, C.H.; Doh, F.M.; Park, J.T.; et al. Progression of aortic arch calcification over 1 year is an independent predictor of mortality in incident peritoneal dialysis patients. PLoS ONE 2012, 7, e48793. [Google Scholar] [CrossRef]
- Zoccali, C.; Benedetto, F.A.; Mallamaci, F.; Tripepi, G.; Giacone, G.; Stancanelli, B.; Cataliotti, A.; Malatino, L.S. Left ventricular mass monitoring in the follow-up of dialysis patients: Prognostic value of left ventricular hypertrophy progression. Kidney Int. 2004, 65, 1492–1498. [Google Scholar] [CrossRef] [Green Version]
- Paoletti, E.; De Nicola, L.; Gabbai, F.B.; Chiodini, P.; Ravera, M.; Pieracci, L.; Marre, S.; Cassottana, P.; Luca, S.; Vettoretti, S.; et al. Associations of Left Ventricular Hypertrophy and Geometry with Adverse Outcomes in Patients with CKD and Hypertension. Clin. J. Am. Soc. Nephrol. 2016, 11, 271–279. [Google Scholar] [CrossRef]
- Noordzij, M.; Cranenburg, E.M.; Engelsman, L.F.; Hermans, M.M.; Boeschoten, E.W.; Brandenburg, V.M.; Bos, W.J.; Kooman, J.P.; Dekker, F.W.; Ketteler, M.; et al. Progression of aortic calcification is associated with disorders of mineral metabolism and mortality in chronic dialysis patients. Nephrol. Dial. Transplant. 2011, 26, 1662–1669. [Google Scholar] [CrossRef] [Green Version]
- Jean, G.; Mayor, B.; Deleaval, P.; Lorriaux, C.; Hurot, J.M.; Bresson, E.; Chazot, C. Vascular Calcification Progression Is an Independent Predictor of Mortality in Patients on Haemodialysis. Nephron 2015, 130, 169–174. [Google Scholar] [CrossRef] [PubMed]
Publisher’s Note: MDPI stays neutral with regard to jurisdictional claims in published maps and institutional affiliations. |
© 2021 by the authors. Licensee MDPI, Basel, Switzerland. This article is an open access article distributed under the terms and conditions of the Creative Commons Attribution (CC BY) license (https://creativecommons.org/licenses/by/4.0/).