
A Transcriptomic Analysis of Head and Neck Squamous Cell Carcinomas for Prognostic Indications


Abstract
:
1. Introduction
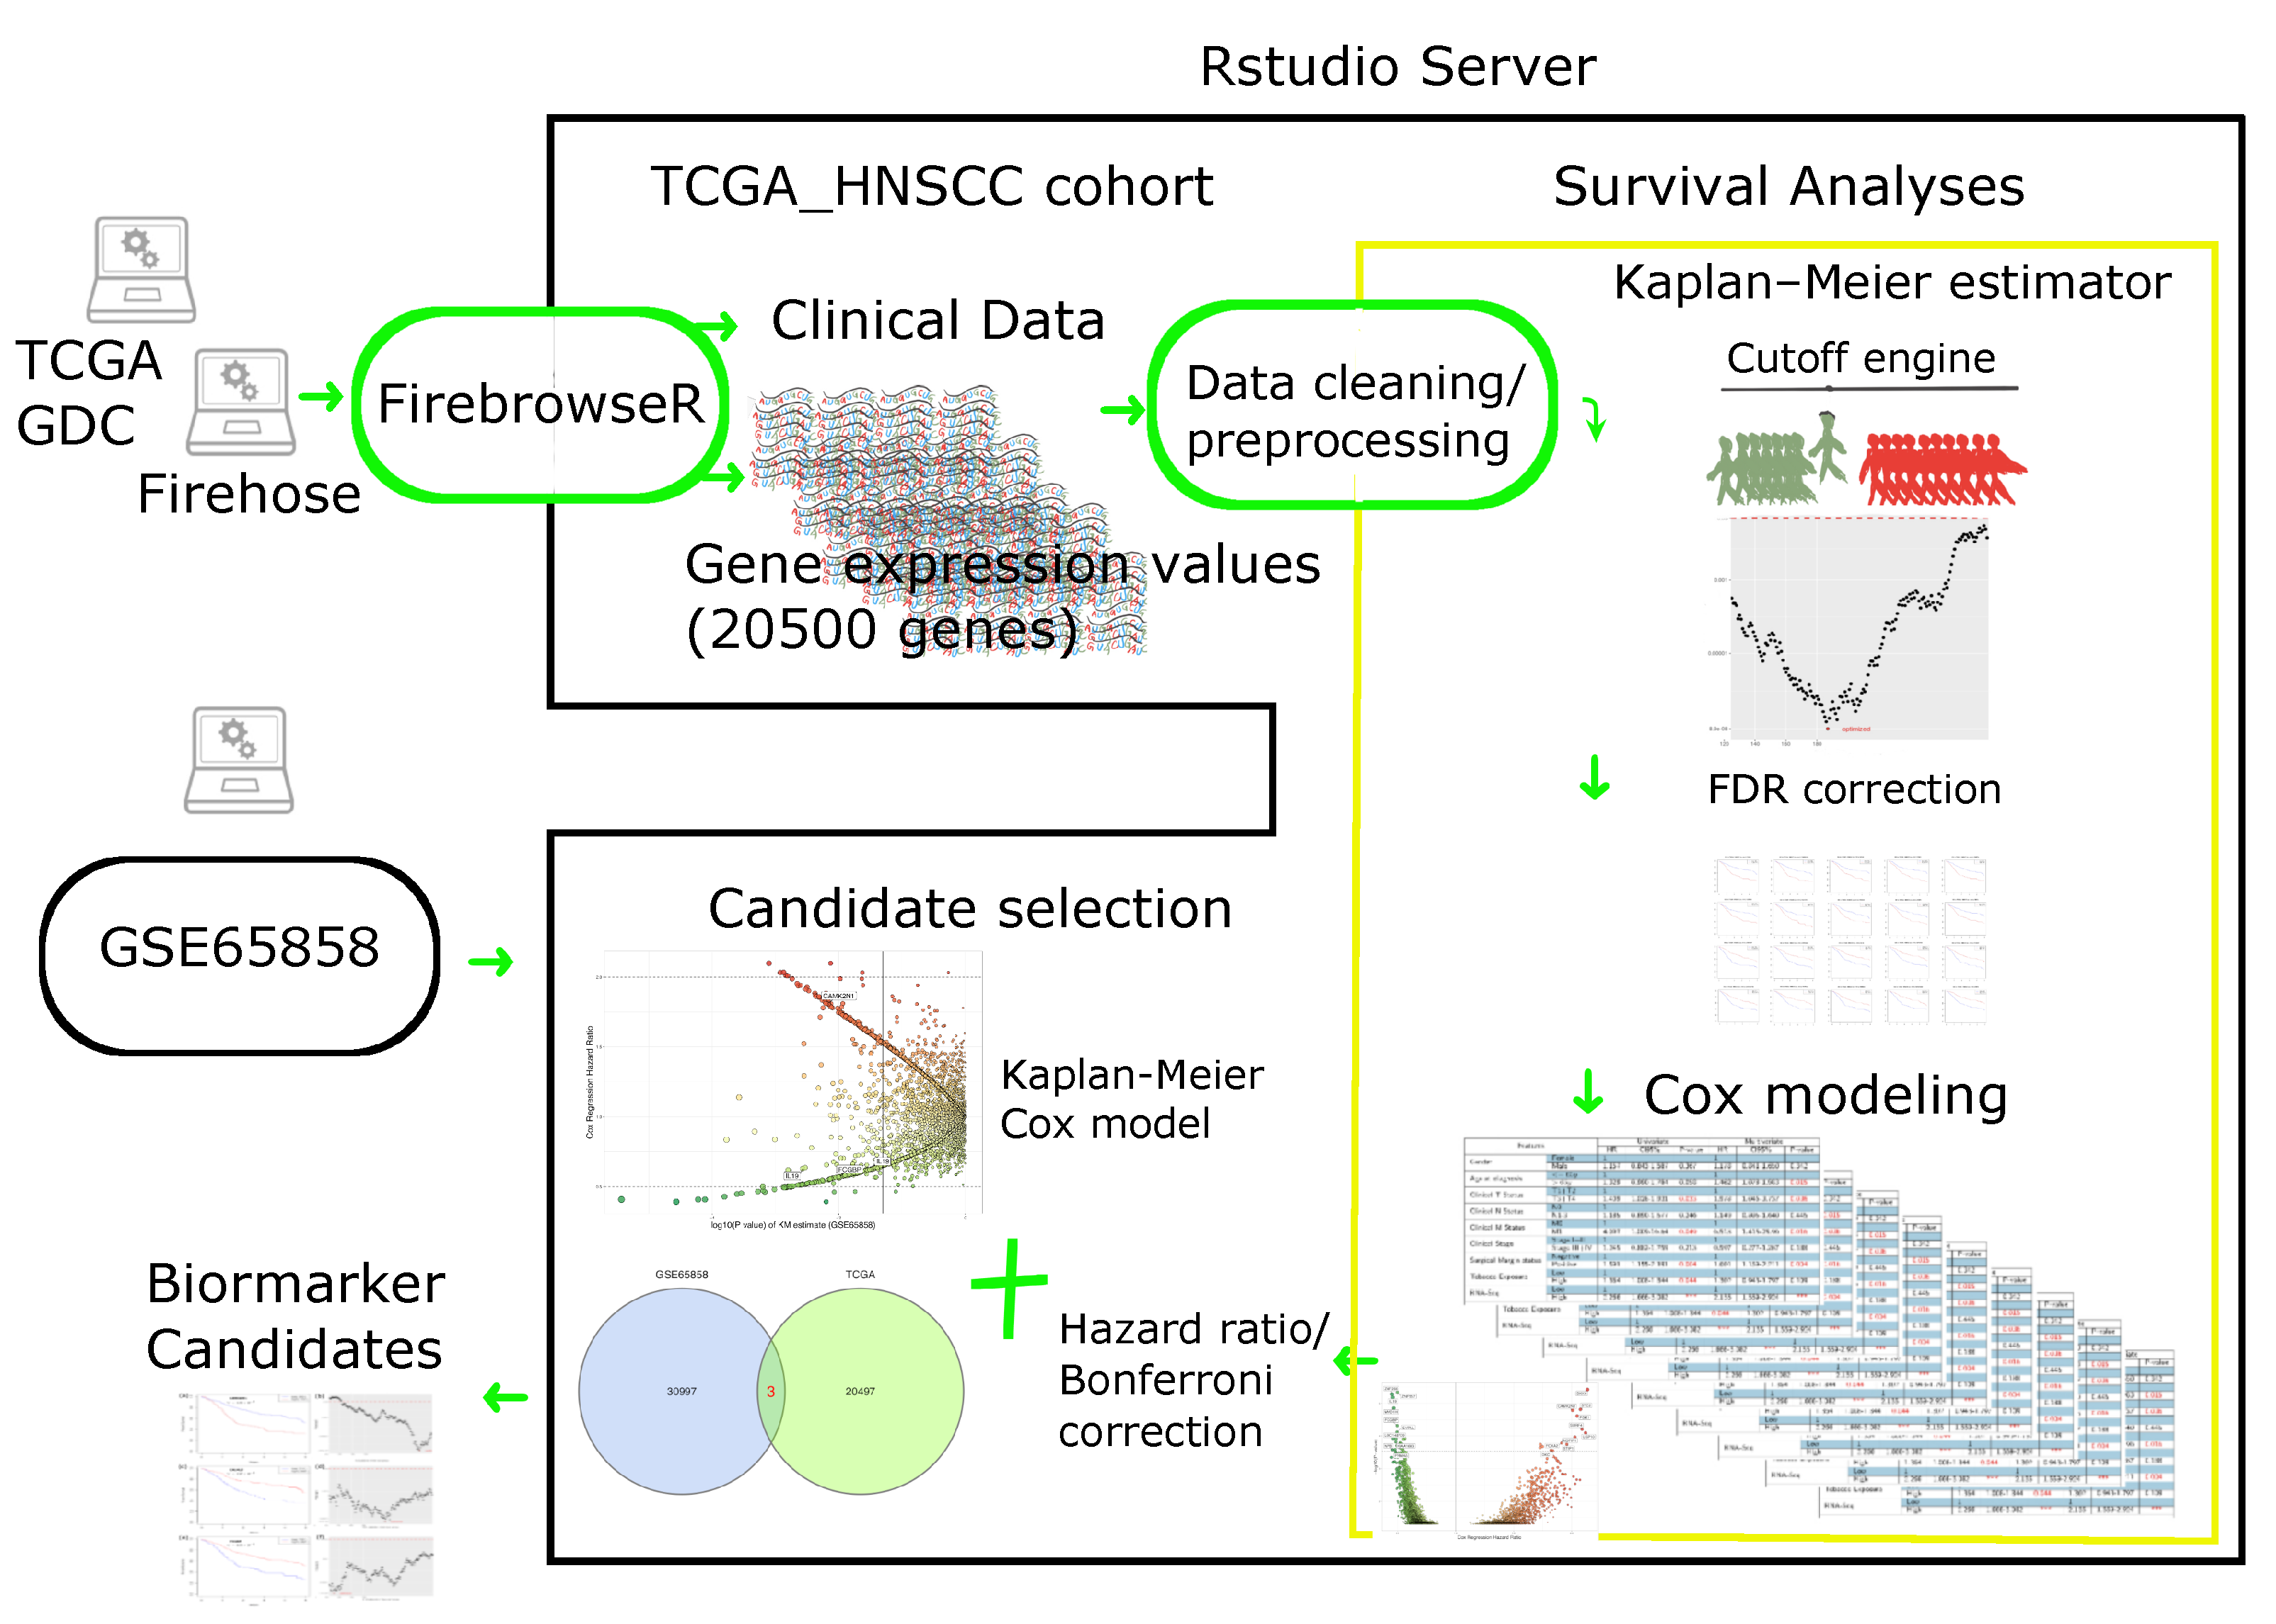
- To the best of our knowledge, the TCGA database is the largest collection (in terms of both cancer types and cohort size, especially in HNSCC) of comprehensive genomics with survival data available in the field of cancer research. The whole-genome sequencing data were harmonized across all genome data analysis centers. Many databases adopt the essential demographic data from TCGA, since it has comprehensive physical and social features of patients, such as exposure to alcohol, asbestos, radioactive radon, tobacco smoking, and cigarettes.
- TCGA has a remarkable advantage for computational and life scientists who study cancer, since useful web-based tools and APIs are ready to analyze and visualize TCGA data. It might be getting help soon from the research community for trouble-shooting purposes.
- Many achievements in diagnosis, treatment, and prevention that relied on the TCGA data have already been published and keep increasing in number [32].
2. Results
3. Discussion
3.1. The Three Biomarkers in Cancer
3.1.1. The Protein/Pathology Atlas
3.1.2. Literature Review
3.2. Feature Selection for Survival Modeling
3.3. The Purpose of Sliding-Window Cutoff Selection
- A random error, defined as the variability in data, is not considered a bias but rather occurs randomly across the entire study population and can distort the measurement process (e.g., RNA-Seq experiments). A larger sample size could reduce the random error.
- A systematic error is a bias, a selection biases, an information bias, or a confounder. It could deleteriously impact the statistical significance. A larger sample size could not affect the systematic error.
3.4. Technical Considerations
- HNSCC samples without complete clinical information were removed;
- Null expressed genes in more than 30% of the HNSCC samples were excluded;
- The updated number of protein-coding genes in the TCGA HNSCC was 20,500.
- If 32.2% of events had a “one group” issue in the confusion matrix of Chi-square test in Cox regression (coxph), due to a zero in the M (distant metastasis) patient subgroup;
- If 21.05% of errors occurred via “one group” issues in log-rank test (survdiff or survdiff.fit function in R package “survival”) in the Kaplan–Meier estimate;
- If 0.78% had unknown reasons (so those 159 genes were excluded in our workflow).
3.5. Limitations of the Study
3.6. Future Directions in Translational Medicine
3.6.1. Proteomics Validation
3.6.2. Laboratory Validation
3.6.3. Cancer Type-Agnostic Study
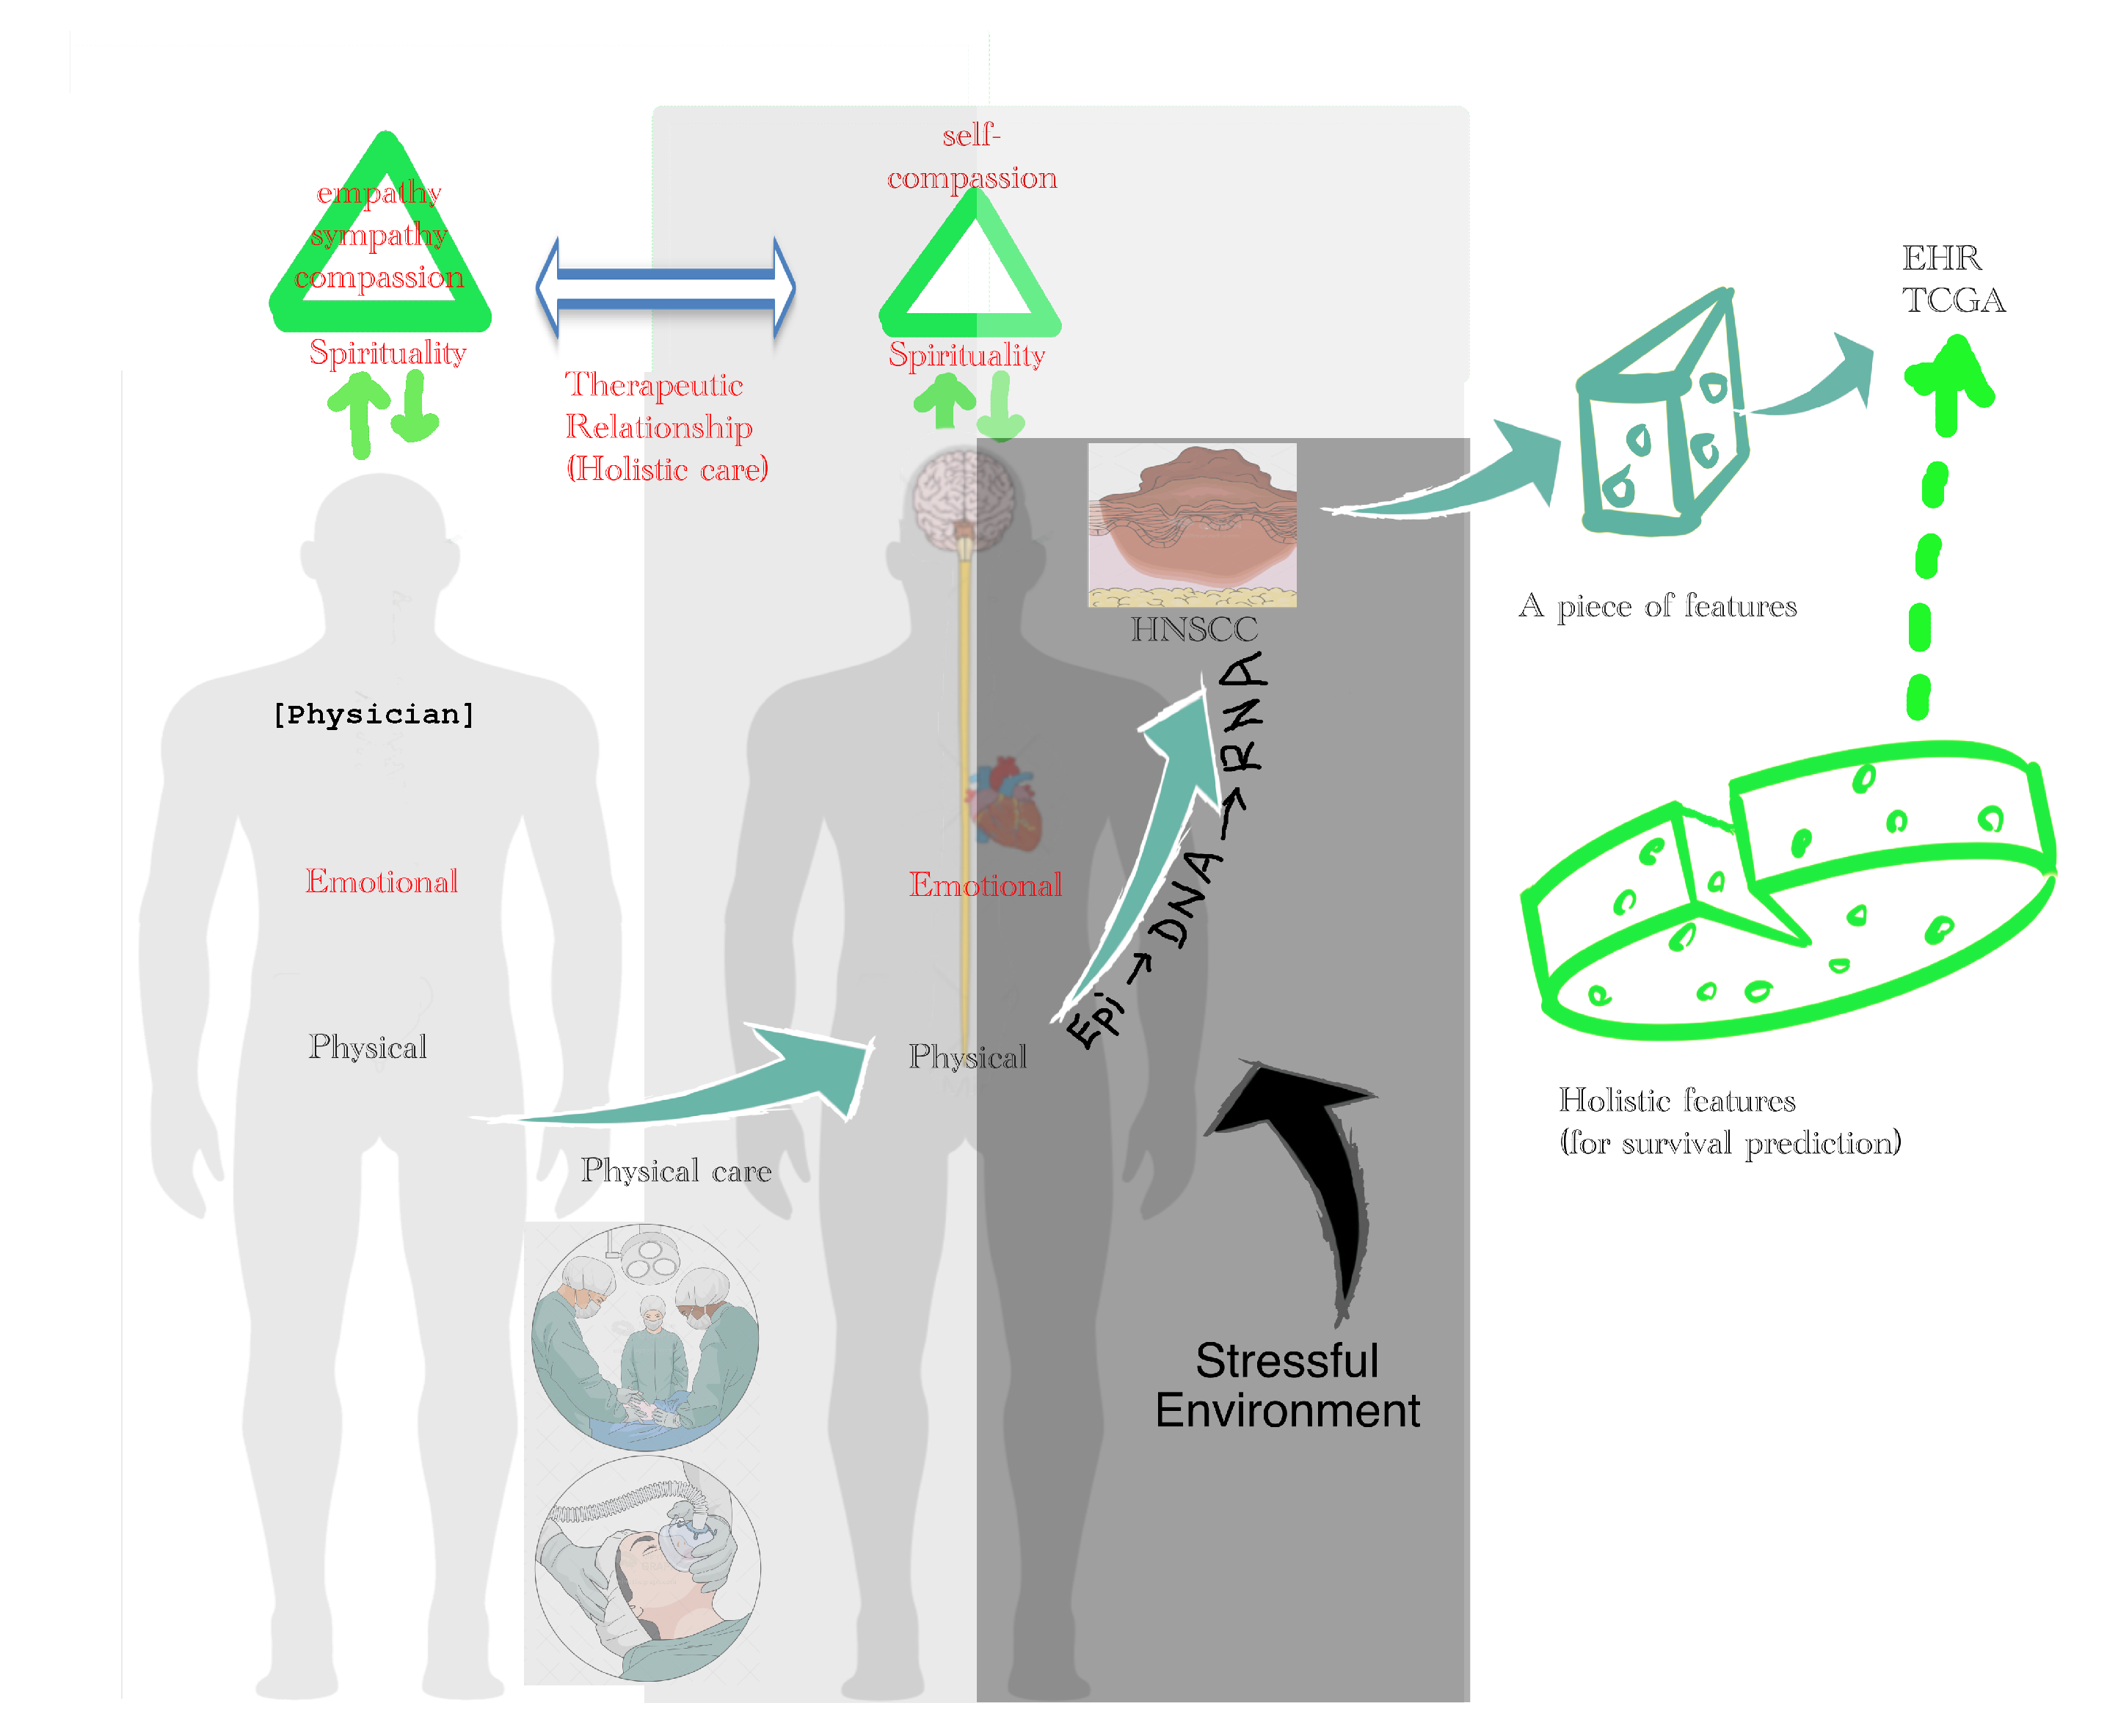
3.6.4. Holistic Cancer Care
4. Materials and Methods
4.1. Patient Cohort
4.1.1. RNA Sequencing Data
4.1.2. Clinical Data
4.2. Cutoff Finder Core Engine
4.3. Statistical Consideration for Survival Analysis
- t represents the survival time;
- is the hazard function determined by a set of n covariates ()—e.g., clinicopathological features, including age, gender, gene expression, cancer stage (tumor size, nodal metastases, distant metastases), surgical margin, smoking, and alcohol; unfortunately, spiritual, emotional, and social status are not available in TCGA database;
- The coefficients () measure the impacts—the effect sizes of covariates;
- The term is called the baseline hazard. It corresponds to the hazard value if all the are equal to zero. The “t” in indicates the hazard may vary over time.
4.4. Biomarker Selection and Validation
5. Conclusions
Supplementary Materials
Author Contributions
Funding
Institutional Review Board Statement
Informed Consent Statement
Data Availability Statement
Acknowledgments
Conflicts of Interest
References
- MOHW. 2017 Statistics of Causes of Death; Department of Statistics, Ministry of Health and Welfare: Taipei, Taiwan, 2018.
- MOHW. 2018 Statistics of General Health and Welfare; Department of Statistics, Ministry of Health and Welfare: Taipei, Taiwan, 2018.
- Pfister, D.G.; Spencer, S.; Adelstein, D.; Adkins, D.; Anzai, Y.; Brizel, D.M.; Bruce, J.Y.; Busse, P.M.; Caudell, J.J.; Cmelak, A.J.; et al. Head and Neck Cancers, Version 2.2020, NCCN Clinical Practice Guidelines in Oncology. J. Natl. Compr. Cancer Netw. 2020, 18, 873–898. [Google Scholar] [CrossRef]
- HPA. Statistics of Health Promotion 2017; Health Promotion Administration, Ministry of Health and Welfare: Taipei, Taiwan, 2019.
- De Vicente, J.C.; Gutiérrez, L.M.J.; Zapatero, A.H.; Forcelledo, M.F.F.; Hernández-Vallejo, G.; López Arranz, J.S. Prognostic significance of p53 expression in oral squamous cell carcinoma without neck node metastases. Head Neck 2004, 26, 22–30. [Google Scholar] [CrossRef]
- Aebersold, D.M.; Burri, P.; Beer, K.T.; Laissue, J.; Djonov, V.; Greiner, R.H.; Semenza, G.L. Expression of hypoxia-inducible factor-1α: A novel predictive and prognostic parameter in the radiotherapy of oropharyngeal cancer. Cancer Res. 2001, 61, 2911–2916. [Google Scholar]
- Couture, C.; Raybaud-Diogène, H.; Têtu, B.; Bairati, I.; Murry, D.; Allard, J.; Fortin, A. p53 and Ki-67 as markers of radioresistance in head and neck carcinoma. Cancer 2002, 94, 713–722. [Google Scholar] [CrossRef] [Green Version]
- O-charoenrat, P.; Modjtahedi, H.; Rhys-Evans, P.; Court, W.J.; Box, G.M.; Eccles, S.A. Epidermal growth factor-like ligands differentially up-regulate matrix metalloproteinase 9 in head and neck squamous carcinoma cells. Cancer Res. 2000, 60, 1121–1128. [Google Scholar] [PubMed]
- Bentzen, S.M.; Atasoy, B.M.; Daley, F.M.; Dische, S.; Richman, P.I.; Saunders, M.I.; Trott, K.R.; Wilson, G.D. Epidermal growth factor receptor expression in pretreatment biopsies from head and neck squamous cell carcinoma as a predictive factor for a benefit from accelerated radiation therapy in a randomized controlled trial. J. Clin. Oncol. 2005, 23, 5560–5567. [Google Scholar] [CrossRef]
- Harrington, K.J. Chemotherapy and Targeted Agents. In Maxillofacial Surgery; Elsevier: Amsterdam, The Netherlands, 2017; pp. 339–354. [Google Scholar] [CrossRef]
- Bonner, J.A.; Harari, P.M.; Giralt, J.; Azarnia, N.; Shin, D.M.; Cohen, R.B.; Jones, C.U.; Sur, R.; Raben, D.; Jassem, J.; et al. Radiotherapy plus cetuximab for squamous-cell carcinoma of the head and neck. N. Engl. J. Med. 2006, 354, 567–578. [Google Scholar] [CrossRef] [PubMed] [Green Version]
- Vermorken, J.B.; Mesia, R.; Rivera, F.; Remenar, E.; Kawecki, A.; Rottey, S.; Erfan, J.; Zabolotnyy, D.; Kienzer, H.R.; Cupissol, D.; et al. Platinum-based chemotherapy plus cetuximab in head and neck cancer. N. Engl. J. Med. 2008, 359, 1116–1127. [Google Scholar] [CrossRef] [Green Version]
- Rivera, F.; García-Castaño, A.; Vega, N.; Vega-Villegas, M.E.; Gutiérrez-Sanz, L. Cetuximab in metastatic or recurrent head and neck cancer: The EXTREME trial. Expert Rev. Anticancer Ther. 2009, 9, 1421–1428. [Google Scholar] [CrossRef] [PubMed]
- Blanchard, P.; Bourhis, J.; Lacas, B.; Posner, M.R.; Vermorken, J.B.; Hernandez, J.J.C.; Bourredjem, A.; Calais, G.; Paccagnella, A.; Hitt, R.; et al. Taxane-Cisplatin-Fluorouracil As Induction Chemotherapy in Locally Advanced Head and Neck Cancers: An Individual Patient Data Meta-Analysis of the Meta-Analysis of Chemotherapy in Head and Neck Cancer Group. J. Clin. Oncol. 2013, 31, 2854–2860. [Google Scholar] [CrossRef] [PubMed] [Green Version]
- Rampias, T.; Giagini, A.; Siolos, S.; Matsuzaki, H.; Sasaki, C.; Scorilas, A.; Psyrri, A. RAS/PI3K crosstalk and cetuximab resistance in head and neck squamous cell carcinoma. Clin. Cancer Res. 2014, 20, 2933–2946. [Google Scholar] [CrossRef] [Green Version]
- Gazzah, A.; Boni, V.; Soria, J.C.; Calles, A.; Even, C.; Doger, B.; Mahjoubi, L.; Bahleda, R.; Ould-Kaci, M.; Esler, A.; et al. A phase 1b study of afatinib in combination with standard-dose cetuximab in patients with advanced solid tumours. Eur. J. Cancer 2018, 104, 1–8. [Google Scholar] [CrossRef]
- Taberna, M.; Oliva, M.; Mesía, R. Cetuximab-containing combinations in locally advanced and recurrent or metastatic head and neck squamous cell carcinoma. Front. Oncol. 2019, 9, 383. [Google Scholar] [CrossRef]
- Seiwert, T.Y.; Burtness, B.; Weiss, J.; Gluck, I.; Eder, J.P.; Pai, S.I.; Dolled-Filhart, M.; Emancipator, K.; Pathiraja, K.; Gause, C.; et al. A phase Ib study of MK-3475 in patients with human papillomavirus (HPV)-associated and non-HPV-associated head and neck (H/N) cancer. J. Clin. Oncol. 2014, 32, 6011. [Google Scholar] [CrossRef]
- Swanson, M.S.; Sinha, U.K. Rationale for combined blockade of PD-1 and CTLA-4 in advanced head and neck squamous cell cancer—Review of current data. Oral Oncol. 2015, 51, 12–15. [Google Scholar] [CrossRef]
- Mei, Z.; Huang, J.; Qiao, B.; yin Lam, A.K. Immune checkpoint pathways in immunotherapy for head and neck squamous cell carcinoma. Int. J. Oral Sci. 2020, 12, 16. [Google Scholar] [CrossRef] [PubMed]
- Cramer, J.D.; Burtness, B.; Le, Q.T.; Ferris, R.L. The changing therapeutic landscape of head and neck cancer. Nat. Rev. Clin. Oncol. 2019, 16, 669–683. [Google Scholar] [CrossRef]
- Burtness, B.; Harrington, K.J.; Greil, R.; Soulières, D.; Tahara, M.; de Castro, G.; Psyrri, A.; Basté, N.; Neupane, P.; Bratland, Å.; et al. Pembrolizumab alone or with chemotherapy versus cetuximab with chemotherapy for recurrent or metastatic squamous cell carcinoma of the head and neck (KEYNOTE-048): A randomised, open-label, phase 3 study. Lancet 2019, 394, 1915–1928. [Google Scholar] [CrossRef]
- Gavrielatou, N.; Doumas, S.; Economopoulou, P.; Foukas, P.G.; Psyrri, A. Biomarkers for immunotherapy response in head and neck cancer. Cancer Treat. Rev. 2020, 84, 101977. [Google Scholar] [CrossRef] [PubMed]
- Chi, L.H.H.; Chang, W.M.M.; Chang, Y.C.C.; Chan, Y.C.C.; Tai, C.C.C.; Leung, K.W.W.; Chen, C.L.L.; Wu, A.T.; Lai, T.C.C.; Li, Y.C.C.; et al. Global Proteomics-based Identification and Validation of Thymosin Beta-4 X-Linked as a Prognostic Marker for Head and Neck Squamous Cell Carcinoma. Sci. Rep. 2017, 7, 9031. [Google Scholar] [CrossRef] [PubMed] [Green Version]
- Zhang, Y.; Feurino, L.W.; Zhai, Q.; Wang, H.; Fisher, W.E.; Chen, C.; Yao, Q.; Li, M. Thymosin beta 4 is overexpressed in human pancreatic cancer cells and stimulates proinflammatory cytokine secretion and JNK activation. Cancer Biol. Ther. 2008, 7, 419–423. [Google Scholar] [CrossRef] [PubMed] [Green Version]
- Ryu, Y.K.; Lee, Y.S.; Lee, G.H.; Song, K.S.; Kim, Y.S.; Moon, E.Y. Regulation of glycogen synthase kinase-3 by thymosin beta-4 is associated with gastric cancer cell migration. Int. J. Cancer 2012, 131, 2067–2077. [Google Scholar] [CrossRef]
- Gemoll, T.; Strohkamp, S.; Schillo, K.; Thorns, C.; Jens, K. MALDI-imaging reveals thymosin beta-4 as an independent prognostic marker for colorectal cancer. Oncotarget 2015, 6, 43869–43880. [Google Scholar] [CrossRef] [PubMed] [Green Version]
- Huang, D.; Wang, S.; Wang, A.; Chen, X.; Zhang, H. Thymosin beta 4 silencing suppresses proliferation and invasion of non-small cell lung cancer cells by repressing Notch1 activation. Acta Biochim. Biophys. Sin. 2016, 48, 788–794. [Google Scholar] [CrossRef] [PubMed] [Green Version]
- Chu, Y.; You, M.; Zhang, J.; Gao, G.; Han, R.; Luo, W.; Liu, T.; Zuo, J.; Wang, F. Adipose-Derived Mesenchymal Stem Cells Enhance Ovarian Cancer Growth and Metastasis by Increasing Thymosin Beta 4X-Linked Expression. Stem Cells Int. 2019, 2019, 9037197. [Google Scholar] [CrossRef] [PubMed] [Green Version]
- Makowiecka, A.; Malek, N.; Mazurkiewicz, E.; Mrówczyńska, E.; Nowak, D.; Mazur, A.J. Thymosin β4 Regulates Focal Adhesion Formation in Human Melanoma Cells and Affects Their Migration and Invasion. Front. Cell Dev. Biol. 2019, 7, 304. [Google Scholar] [CrossRef] [PubMed] [Green Version]
- Yan, L.; Zhang, W. Precision medicine becomes reality-tumor type-agnostic therapy. Cancer Commun. 2018, 38, 6. [Google Scholar] [CrossRef] [Green Version]
- Tomczak, K.; Czerwińska, P.; Wiznerowicz, M. The Cancer Genome Atlas (TCGA): An immeasurable source of knowledge. Contemp. Oncol. 2015, 19, A68–A77. [Google Scholar] [CrossRef]
- Loraine, A.E.; Blakley, I.C.; Jagadeesan, S.; Harper, J.; Miller, G.; Firon, N. Analysis and visualization of RNA-Seq expression data using RStudio, Bioconductor, and Integrated Genome Browser. Methods Mol. Biol. 2015, 1284, 481–501. [Google Scholar] [CrossRef] [Green Version]
- Tonella, L.; Giannoccaro, M.; Alfieri, S.; Canevari, S.; De Cecco, L. Gene Expression Signatures for Head and Neck Cancer Patient Stratification: Are Results Ready for Clinical Application? Curr. Treat. Options Oncol. 2017, 18, 32. [Google Scholar] [CrossRef]
- Zhao, X.; Sun, S.; Zeng, X.; Cui, L. Expression profiles analysis identifies a novel three-mRNA signature to predict overall survival in oral squamous cell carcinoma. Am. J. Cancer Res. 2018, 8, 450–461. [Google Scholar] [PubMed]
- Li, R.; Qu, H.; Wang, S.; Wei, J.; Zhang, L.; Ma, R.; Lu, J.; Zhu, J.; Zhong, W.D.D.; Jia, Z.; et al. GDCRNATools: An R/Bioconductor package for integrative analysis of lncRNA, miRNA and mRNA data in GDC. Bioinformatics 2018, 34, 2515–2517. [Google Scholar] [CrossRef] [PubMed] [Green Version]
- Huang, G.Z.; Wu, Q.Q.; Zheng, Z.N.; Shao, T.R.; Lv, X.Z. Identification of Candidate Biomarkers and Analysis of Prognostic Values in Oral Squamous Cell Carcinoma. Front. Oncol. 2019, 9, 1054. [Google Scholar] [CrossRef] [PubMed]
- Shen, Y.; Liu, J.; Zhang, L.; Dong, S.; Zhang, J.; Liu, Y.; Zhou, H.; Dong, W. Identification of Potential Biomarkers and Survival Analysis for Head and Neck Squamous Cell Carcinoma Using Bioinformatics Strategy: A Study Based on TCGA and GEO Datasets. BioMed Res. Int. 2019, 2019, 7376034. [Google Scholar] [CrossRef] [PubMed] [Green Version]
- Schmitt, K.; Molfenter, B.; Laureano, N.K.; Tawk, B.; Bieg, M.; Hostench, X.P.; Weichenhan, D.; Ullrich, N.D.; Shang, V.; Richter, D.; et al. Somatic mutations and promotor methylation of the ryanodine receptor 2 is a common event in the pathogenesis of head and neck cancer. Int. J. Cancer 2019, 145, 3299–3310. [Google Scholar] [CrossRef]
- Xu, C.; Zhang, Y.; Shen, Y.; Shi, Y.; Zhang, M.; Zhou, L. Integrated Analysis Reveals ENDOU as a Biomarker in Head and Neck Squamous Cell Carcinoma Progression. Front. Oncol. 2020, 10, 3151. [Google Scholar]
- Tang, Z.; Li, C.; Kang, B.; Gao, G.; Li, C.; Zhang, Z. GEPIA: A web server for cancer and normal gene expression profiling and interactive analyses. Nucleic Acids Res. 2017, 45, W98–W102. [Google Scholar] [CrossRef] [Green Version]
- Tang, Z.; Kang, B.; Li, C.; Chen, T.; Zhang, Z. GEPIA2: An enhanced web server for large-scale expression profiling and interactive analysis. Nucleic Acids Res. 2019, 47, W556–W560. [Google Scholar] [CrossRef] [Green Version]
- Li, C.; Tang, Z.; Zhang, W.; Ye, Z.; Liu, F. GEPIA2021: Integrating multiple deconvolution-based analysis into GEPIA. Nucleic Acids Res. 2021, 49, W242–W246. [Google Scholar] [CrossRef]
- Uhlen, M.; Zhang, C.; Lee, S.; Sjöstedt, E.; Fagerberg, L.; Bidkhori, G.; Benfeitas, R.; Arif, M.; Liu, Z.; Edfors, F.; et al. A pathology atlas of the human cancer transcriptome. Science 2017, 357, eaan2507. [Google Scholar] [CrossRef] [Green Version]
- Aguirre-Gamboa, R.; Gomez-Rueda, H.; Martínez-Ledesma, E.; Martínez-Torteya, A.; Chacolla-Huaringa, R.; Rodriguez-Barrientos, A.; Tamez-Peña, J.G.; Treviño, V. SurvExpress: An online biomarker validation tool and database for cancer gene expression data using survival analysis. PLoS ONE 2013, 8, e74250. [Google Scholar] [CrossRef] [Green Version]
- Abel, U.; Berger, J.; Wiebelt, H. CRITLEVEL: An Exploratory Procedure for the Evaluation of Quantitative Prognostic Factors. Methods Inf. Med. 1984, 23, 154–156. [Google Scholar] [CrossRef] [PubMed]
- Mizuno, H.; Kitada, K.; Nakai, K.; Sarai, A. PrognoScan: A new database for meta-analysis of the prognostic value of genes. BMC Med. Genom. 2009, 2, 18. [Google Scholar] [CrossRef] [PubMed] [Green Version]
- Budczies, J.; Klauschen, F.; Sinn, B.V.; Gyorffy, B.; Schmitt, W.D.; Darb-Esfahani, S.; Denkert, C. Cutoff Finder: A Comprehensive and Straightforward Web Application Enabling Rapid Biomarker Cutoff Optimization. PLoS ONE 2012, 7, e51862. [Google Scholar] [CrossRef] [Green Version]
- Chang, C.; Hsieh, M.K.; Chang, W.Y.; Chiang, A.J.; Chen, J. Determining the optimal number and location of cutoff points with application to data of cervical cancer. PLoS ONE 2017, 12, e0176231. [Google Scholar] [CrossRef] [Green Version]
- Cristina, V.; Herrera-Gómez, R.G.; Szturz, P.; Espeli, V.; Siano, M. Immunotherapies and future combination strategies for head and neck squamous cell carcinoma. Int. J. Mol. Sci. 2019, 20, 5399. [Google Scholar] [CrossRef] [PubMed] [Green Version]
- Wichmann, G.; Rosolowski, M.; Krohn, K.; Kreuz, M.; Boehm, A.; Reiche, A.; Scharrer, U.; Halama, D.; Bertolini, J.; Bauer, U.; et al. The role of HPV RNA transcription, immune response-related gene expression and disruptive TP53 mutations in diagnostic and prognostic profiling of head and neck cancer. Int. J. Cancer 2015, 137, 2846–2857. [Google Scholar] [CrossRef]
- Wirsing, A.M.; Bjerkli, I.H.; Steigen, S.E.; Rikardsen, O.; Magnussen, S.N.; Hegge, B.; Seppola, M.; Uhlin-Hansen, L.; Hadler-Olsen, E. Validation of Selected Head and Neck Cancer Prognostic Markers from the Pathology Atlas in an Oral Tongue Cancer Cohort. Cancers 2021, 13, 2387. [Google Scholar] [CrossRef]
- Russo, E.; Salzano, M.; De Falco, V.; Mian, C.; Barollo, S.; Secondo, A.; Bifulco, M.; Vitale, M. Calcium/Calmodulin-Dependent Protein Kinase II and Its Endogenous Inhibitor α in Medullary Thyroid Cancer. Clin. Cancer Res. 2014, 20, 1513–1520. [Google Scholar] [CrossRef] [Green Version]
- Györffy, B.; Lanczky, A.; Eklund, A.C.; Denkert, C.; Budczies, J.; Li, Q.; Szallasi, Z. An online survival analysis tool to rapidly assess the effect of 22,277 genes on breast cancer prognosis using microarray data of 1809 patients. Breast Cancer Res. Treat. 2010, 123, 725–731. [Google Scholar] [CrossRef] [PubMed] [Green Version]
- Nagy, Á.; Munkácsy, G.; Győrffy, B. Pancancer survival analysis of cancer hallmark genes. Sci. Rep. 2021, 11, 6047. [Google Scholar] [CrossRef]
- Méhul, B.; Bernard, D.; Simonetti, L.; Bernard, M.A.; Schmidt, R. Identification and cloning of a new calmodulin-like protein from human epidermis. J. Biol. Chem. 2000, 275, 12841–12847. [Google Scholar] [CrossRef] [Green Version]
- Misawa, K.; Imai, A.; Matsui, H.; Kanai, A.; Misawa, Y.; Mochizuki, D.; Mima, M.; Yamada, S.; Kurokawa, T.; Nakagawa, T.; et al. Identification of novel methylation markers in HPV-associated oropharyngeal cancer: Genome-wide discovery, tissue verification and validation testing in ctDNA. Oncogene 2020, 39, 4741–4755. [Google Scholar] [CrossRef]
- O’Donovan, N.; Fischer, A.; Abdo, E.M.; Simon, F.; Peter, H.; Gerber, H.; Buergi, U.; Marti, U. Differential expression of IgG Fc binding protein (FcgammaBP) in human normal thyroid tissue, thyroid adenomas and thyroid carcinomas. J. Endocrinol. 2002, 174, 517–524. [Google Scholar] [CrossRef] [PubMed] [Green Version]
- Griffith, O.L.; Melck, A.; Jones, S.J.; Wiseman, S.M. Meta-Analysis and Meta-Review of Thyroid Cancer Gene Expression Profiling Studies Identifies Important Diagnostic Biomarkers. J. Clin. Oncol. 2006, 24, 5043–5051. [Google Scholar] [CrossRef] [PubMed]
- Xiong, L.; Wen, Y.; Miao, X.; Yang, Z. NT5E and FcGBP as key regulators of TGF-1-induced epithelial-mesenchymal transition (EMT) are associated with tumor progression and survival of patients with gallbladder cancer. Cell Tissue Res. 2014, 355, 365–374. [Google Scholar] [CrossRef] [PubMed] [Green Version]
- Cheraghlou, S.; Otremba, M.; Kuo Yu, P.; Agogo, G.O.; Hersey, D.; Judson, B.L. Prognostic Value of Lymph Node Yield and Density in Head and Neck Malignancies. Otolaryngol. Head Neck Surg. 2018, 158, 1016–1023. [Google Scholar] [CrossRef]
- Amin, M.B.; Greene, F.L.; Edge, S.B.; Compton, C.C.; Gershenwald, J.E.; Brookland, R.K.; Meyer, L.; Gress, D.M.; Byrd, D.R.; Winchester, D.P. The Eighth Edition AJCC Cancer Staging Manual: Continuing to build a bridge from a population-based to a more “personalized” approach to cancer staging. CA Cancer J. Clin. 2017, 67, 93–99. [Google Scholar] [CrossRef]
- Brandwein-Gensler, M.; Smith, R.V.; Wang, B.; Penner, C.; Theilken, A.; Broughel, D.; Schiff, B.; Owen, R.P.; Smith, J.; Sarta, C.; et al. Validation of the histologic risk model in a new cohort of patients with head and neck squamous cell carcinoma. Am. J. Surg. Pathol. 2010, 34, 676–688. [Google Scholar] [CrossRef]
- Sinha, N.; Rigby, M.H.; McNeil, M.L.; Taylor, S.M.; Trites, J.R.; Hart, R.D.; Bullock, M.J. The histologic risk model is a useful and inexpensive tool to assess risk of recurrence and death in stage i or II squamous cell carcinoma of tongue and floor of mouth. Mod. Pathol. 2018, 31, 772–779. [Google Scholar] [CrossRef] [PubMed]
- Bulbul, M.G.; Tarabichi, O.; Sethi, R.K.; Parikh, A.S.; Varvares, M.A. Does Clearance of Positive Margins Improve Local Control in Oral Cavity Cancer? A Meta-analysis. Otolaryngol. Head Neck Surg. 2019, 161, 235–244. [Google Scholar] [CrossRef]
- Scholl, P.; Byers, R.M.; Batsakis, J.G.; Wolf, P.; Santini, H. Microscopic cut-through of cancer in the surgical treatment of squamous carcinoma of the tongue. Prognostic and therapeutic implications. Am. J. Surg. 1986, 152, 354–360. [Google Scholar] [CrossRef]
- Sutton, D.N.; Brown, J.S.; Rogers, S.N.; Vaughan, E.D.; Woolgar, J.A. The prognostic implications of the surgical margin in oral squamous cell carcinoma. Int. J. Oral Maxillofac. Surg. 2003, 32, 30–34. [Google Scholar] [CrossRef]
- Shaw, R.J.; Brown, J.S.; Woolgar, J.A.; Lowe, D.; Rogers, S.N.; Vaughan, E.D. The influence of the pattern of mandibular invasion on recurrence and survival in oral squamous cell carcinoma. Head Neck J. Sci. Spec. Head Neck 2004, 26, 861–869. [Google Scholar] [CrossRef] [PubMed]
- Guillemaud, J.P.; Patel, R.S.; Goldstein, D.P.; Higgins, K.M.; Enepekides, D.J. Prognostic impact of intraoperative microscopic cut-through on frozen section in oral cavity squamous cell carcinoma. J. Otolaryngol. Head Neck Surg. 2010, 39, 370–377. [Google Scholar] [CrossRef]
- Patel, R.S.; Goldstein, D.P.; Guillemaud, J.; Bruch, G.A.; Brown, D.; Gilbert, R.W.; Gullane, P.J.; Higgins, K.M.; Irish, J.; Enepekides, D.J.; et al. Impact of positive frozen section microscopic tumor cut-through revised to negative on oral carcinoma control and survival rates. Head Neck 2010, 32, 1444–1451. [Google Scholar] [CrossRef] [PubMed]
- Kuriakose, M.A.; Trivedi, N.P. Contemporary Oral Oncology, 1st ed.; Springer International Publishing: Cham, Switzerland, 2017; Volume 2, pp. 147–187. [Google Scholar] [CrossRef]
- Shapiro, M.; Salama, A. Margin Analysis: Squamous Cell Carcinoma of the Oral Cavity. Oral Maxillofac. Surg. Clin. N. Am. 2017, 29, 259–267. [Google Scholar] [CrossRef] [PubMed]
- Saidak, Z.; Clatot, F.; Chatelain, D.; Galmiche, A. A gene expression profile associated with perineural invasion identifies a subset of HNSCC at risk of post-surgical recurrence. Oral Oncol. 2018, 86, 53–60. [Google Scholar] [CrossRef] [PubMed]
- Migueláñez-Medrán, B.D.C.; Pozo-Kreilinger, J.J.; Cebrián-Carretero, J.L.; Martínez-García, M.Á.; López-Sánchez, A.F. Oral squamous cell carcinoma of tongue: Histological risk assessment. A pilot study. Med. Oral Patol. Oral Cir. Bucal 2019, 24, e603–e609. [Google Scholar] [CrossRef]
- Saidak, Z.; Pascual, C.; Bouaoud, J.; Galmiche, L.; Clatot, F.; Dakpé, S.; Page, C.; Galmiche, A. A three-gene expression signature associated with positive surgical margins in tongue squamous cell carcinomas: Predicting surgical resectability from tumour biology? Oral Oncol. 2019, 94, 115–120. [Google Scholar] [CrossRef]
- Sullivan, G.M.; Feinn, R. Using Effect Size—Or Why the P Value Is Not Enough. J. Grad. Med. Educ. 2012, 4, 279–282. [Google Scholar] [CrossRef] [Green Version]
- Thiese, M.S.; Ronna, B.; Ott, U. P value interpretations and considerations. J. Thorac. Dis. 2016, 8, E928–E931. [Google Scholar] [CrossRef] [Green Version]
- Grünwald, V.; Chirovsky, D.; Cheung, W.Y.; Bertolini, F.; Ahn, M.J.; Yang, M.H.; Castro, G.; Berrocal, A.; Sjoquist, K.; Kuyas, H.; et al. Global treatment patterns and outcomes among patients with recurrent and/or metastatic head and neck squamous cell carcinoma: Results of the GLANCE H&N study. Oral Oncol. 2020, 102, 104526. [Google Scholar] [CrossRef] [PubMed]
- Seby, S.; Rossi, M.R.; Magliocca, K.R.; Patel, M.; Griffith, C.C.; Steuer, C.E.; Wang, X.; El-Deiry, M.; Shin, D.M.; Kowalski, J.; et al. Landscape of genetic alterations in oropharyngeal squamous cell carcinoma (OPSCC) based on RNA-seq and WES analysis of FFPE samples and correlation with data from TCGA. J. Clin. Oncol. 2018, 35, e17527. [Google Scholar] [CrossRef]
- Chan, Y.H. Biostatistics 104: Correlational analysis. Singap. Med. J. 2003, 44, 614–619. [Google Scholar]
- Schober, P.; Schwarte, L.A. Correlation coefficients: Appropriate use and interpretation. Anesth. Analg. 2018, 126, 1763–1768. [Google Scholar] [CrossRef]
- Li, J.; Lu, Y.; Akbani, R.; Ju, Z.; Roebuck, P.L.; Liu, W.; Yang, J.Y.; Broom, B.M.; Verhaak, R.G.; Kane, D.W.; et al. TCPA: A resource for cancer functional proteomics data. Nat. Methods 2013, 10, 1046–1047. [Google Scholar] [CrossRef] [Green Version]
- Li, J.; Akbani, R.; Zhao, W.; Lu, Y.; Weinstein, J.N.; Mills, G.B.; Liang, H. Explore, Visualize, and Analyze Functional Cancer Proteomic Data Using the Cancer Proteome Atlas. Cancer Res. 2017, 77, e51–e54. [Google Scholar] [CrossRef] [PubMed] [Green Version]
- Chen, M.J.M.; Li, J.; Wang, Y.; Akbani, R.; Lu, Y.; Mills, G.B.; Liang, H. TCPA v3.0: An integrative platform to explore the pan-cancer analysis of functional proteomic data. Mol. Cell. Proteomics 2019, 18, S15–S25. [Google Scholar] [CrossRef] [Green Version]
- Stodden, V. Implementing Reproducible Research; Chapman and Hall/CRC: Boca Raton, FL, USA, 2014; Chapter 1; pp. 185–218. [Google Scholar] [CrossRef]
- Kulkarni, N.; Alessandrì, L.; Panero, R.; Arigoni, M.; Olivero, M.; Ferrero, G.; Cordero, F.; Beccuti, M.; Calogero, R.A. Reproducible bioinformatics project: A community for reproducible bioinformatics analysis pipelines. BMC Bioinform. 2018, 19, 349. [Google Scholar] [CrossRef]
- Yang, J.M.; Chen, C.C. GEMDOCK: A Generic Evolutionary Method for Molecular Docking. Proteins Struct. Funct. Genet. 2004, 55, 288–304. [Google Scholar] [CrossRef] [PubMed]
- Hsu, K.C.; Chen, Y.F.; Lin, S.R.; Yang, J.M. Igemdock: A graphical environment of enhancing gemdock using pharmacological interactions and post-screening analysis. BMC Bioinform. 2011, 12, S33. [Google Scholar] [CrossRef] [Green Version]
- Pathak, N.; Chen, Y.T.; Hsu, Y.C.; Hsu, N.Y.; Kuo, C.J.; Tsai, H.P.; Kang, J.J.; Huang, C.H.; Chang, S.Y.; Chang, Y.H.; et al. Uncovering flexible active site conformations of SARS-COV-2 3Cl proteases through protease pharmacophore clusters and covid-19 drug repurposing. ACS Nano 2021, 15, 857–872. [Google Scholar] [CrossRef] [PubMed]
- Warburg, O. On the Origin of Cancer Cells. Science 1956, 123, 309–314. [Google Scholar] [CrossRef]
- Chang, Y.C.; Chi, L.H.; Chang, W.M.; Su, C.Y.; Lin, Y.F.; Chen, C.L.; Chen, M.H.; Chang, P.M.H.; Wu, A.T.H.; Hsiao, M. Glucose transporter 4 promotes head and neck squamous cell carcinoma metastasis through the TRIM24-DDX58 axis. J. Hematol. Oncol. 2017, 10, 11. [Google Scholar] [CrossRef] [PubMed] [Green Version]
- Mani, S.; Swargiary, G.; Singh, K.K. Natural agents targeting mitochondria in cancer. Int. J. Mol. Sci. 2020, 21, 6992. [Google Scholar] [CrossRef] [PubMed]
- Prado-Garcia, H.; Campa-Higareda, A.; Romero-Garcia, S. Lactic Acidosis in the Presence of Glucose Diminishes Warburg Effect in Lung Adenocarcinoma Cells. Front. Oncol. 2020, 10, 807. [Google Scholar] [CrossRef]
- Neal, M.E.H.; Haring, C.T.; Mann, J.E.; Brenner, J.C.; Spector, M.E.; Swiecicki, P.L. Novel immunotherapeutic approaches in head and neck cancer. J. Cancer Metastasis Treat. 2019, 5, 76. [Google Scholar] [CrossRef] [Green Version]
- Rendleman, M.C.; Buatti, J.M.; Braun, T.A.; Smith, B.J.; Nwakama, C.; Beichel, R.R.; Brown, B.; Casavant, T.L. Machine learning with the TCGA-HNSC dataset: Improving usability by addressing inconsistency, sparsity, and high-dimensionality. BMC Bioinform. 2019, 20, 339. [Google Scholar] [CrossRef]
- Woodward, S.J.R.; Beukes, P.C.; Hanigan, M.D. Molly reborn in C++ and R. Animal 2020, 14, s250–s256. [Google Scholar] [CrossRef]
- Mehta, R.; Sharma, K.; Potters, L.; Wernicke, A.G.; Parashar, B. Evidence for the Role of Mindfulness in Cancer: Benefits and Techniques. Cureus 2019, 11, e4629. [Google Scholar] [CrossRef] [Green Version]
- Iftikhar, A.; Islam, M.; Shepherd, S.; Jones, S.; Ellis, I. Cancer and stress: Does it make a difference to the patient when these two challenges collide? Cancers 2021, 13, 163. [Google Scholar] [CrossRef] [PubMed]
- Lutgendorf, S.K.; Sood, A.K.; Antoni, M.H. Host factors and cancer progression: Biobehavioral signaling pathways and interventions. J. Clin. Oncol. 2010, 28, 4094. [Google Scholar] [CrossRef]
- Powell, N.D.; Tarr, A.J.; Sheridan, J.F. Psychosocial stress and inflammation in cancer. Brain Behav. Immunity 2013, 30, S41–S47. [Google Scholar] [CrossRef] [PubMed]
- Moreno-Smith, M.; Lutgendorf, S.K.; Sood, A.K. Impact of stress on cancer metastasis. Future Oncol. 2010, 6, 1863–1881. [Google Scholar] [CrossRef] [PubMed] [Green Version]
- Du, P.; Zeng, H.; Xiao, Y.; Zhao, Y.; Zheng, B.; Deng, Y.; Liu, J.; Huang, B.; Zhang, X.; Yang, K.; et al. Chronic stress promotes EMT-mediated metastasis through activation of STAT3 signaling pathway by miR-337-3p in breast cancer. Cell Death Dis. 2020, 11, 761. [Google Scholar] [CrossRef]
- Xu, X.R.; Xiao, Q.; Hong, Y.C.; Liu, Y.H.; Liu, Y.; Tu, J. Activation of dopaminergic VTA inputs to the mPFC ameliorates chronic stress-induced breast tumor progression. CNS Neurosci. Ther. 2021, 27, 206–219. [Google Scholar] [CrossRef]
- Chida, Y.; Hamer, M.; Wardle, J.; Steptoe, A. Do stress-related psychosocial factors contribute to cancer incidence and survival? Nat. Clin. Pract. Oncol. 2008, 5, 466–475. [Google Scholar] [CrossRef]
- Hsiao, F.H.; Jow, G.M.; Kuo, W.H.; Chang, K.J.; Liu, Y.F.; Ho, R.T.H.; Ng, S.M.; Chan, C.L.W.; Lai, Y.M.; Chen, Y.T. The Effects of Psychotherapy on Psychological Well-Being and Diurnal Cortisol Patterns in Breast Cancer Survivors. Psychother. Psychosom. 2012, 81, 173–182. [Google Scholar] [CrossRef]
- Weinstein, J.N.; Collisson, E.A.; Mills, G.B.; Shaw, K.R.; Ozenberger, B.A.; Ellrott, K.; Sander, C.; Stuart, J.M.; Chang, K.; Creighton, C.J.; et al. The cancer genome atlas pan-cancer analysis project. Nat. Genet. 2013, 45, 1113. [Google Scholar] [CrossRef]
- NCI Genomic Data Commons. GDC Data Dictionary; The National Cancer Institute (NCI): Bethesda, MD, USA, 2019.
- Zhang, Z.; Li, H.; Jiang, S.; Li, R.; Li, W.; Chen, H.; Bo, X. A survey and evaluation of Web-based tools/databases for variant analysis of TCGA data. Brief. Bioinform. 2018, 20, 1524–1541. [Google Scholar] [CrossRef] [PubMed]
- Deng, M.; Brägelmann, J.; Kryukov, I.; Saraiva-Agostinho, N.; Perner, S. FirebrowseR: An R client to the Broad Institute’s Firehose Pipeline. Database 2017, 2017, baw160. [Google Scholar] [CrossRef] [PubMed] [Green Version]
- Lawrence, M.S.M.M.S.; Sougnez, C.; Lichtenstein, L.; Cibulskis, K.; Lander, E.; Gabriel, S.S.B.; Getz, G.; Ally, A.; Balasundaram, M.; Birol, I.; et al. Comprehensive genomic characterization of head and neck squamous cell carcinomas. Nature 2015, 517, 576–582. [Google Scholar] [CrossRef] [Green Version]
- Clamp, M.; Fry, B.; Kamal, M.; Xie, X.; Cuff, J.; Lin, M.F.; Kellis, M.; Lindblad-Toh, K.; Lander, E.S. Distinguishing protein-coding and noncoding genes in the human genome. Proc. Natl. Acad. Sci. USA 2007, 104, 19428–19433. [Google Scholar] [CrossRef] [PubMed] [Green Version]
- NCI Genomic Data Commons. mRNA Analysis Pipeline; The National Cancer Institute (NCI): Bethesda, MD, USA, 2017.
- GDAC. Samples Report; Broad Institute: Cambridge, MA, USA, 2016. [Google Scholar]
- Brierley, J.D.; Gospodarowicz, M.K.; Wittekind, C. TNM Classification of Malignant Tumours, 8th ed.; Wiley-Blackwell: Hoboken, NJ, USA, 2016; p. 272. [Google Scholar]
- Halpern, J. Maximally Selected Chi Square Statistics for Small Samples. Biometrics 1982, 38, 1017. [Google Scholar] [CrossRef]
- Benjamini, Y.; Hochberg, Y. Controlling the False Discovery Rate: A Practical and Powerful Approach to Multiple Testing. J. R. Stat. Soc. Ser. B (Methodol.) 1995, 57, 289–300. [Google Scholar] [CrossRef]
- Cox, D.R. Regression Models and Life-Tables. J. R. Stat. Soc. Ser. B (Methodol.) 1972, 34, 187–202. [Google Scholar] [CrossRef]
- Andersen, P.K.; Gill, R.D. Cox’s Regression Model for Counting Processes: A Large Sample Study. Ann. Stat. 1982, 10, 1100–1120. [Google Scholar] [CrossRef]
- Bradburn, M.J.; Clark, T.G.; Love, S.B.; Altman, D.G. Survival analysis part II: Multivariate data analysis—An introduction to concepts and methods. Br. J. Cancer 2003, 89, 431–436. [Google Scholar] [CrossRef]
- Magen, A.; Das Sahu, A.; Lee, J.S.; Sharmin, M.; Lugo, A.; Gutkind, J.S.; Schäffer, A.A.; Ruppin, E.; Hannenhalli, S. Beyond Synthetic Lethality: Charting the Landscape of Pairwise Gene Expression States Associated with Survival in Cancer. Cell Rep. 2019, 28, 938–948.e6. [Google Scholar] [CrossRef]
- Chung, C.H.; Parker, J.S.; Ely, K.; Carter, J.; Yi, Y.; Murphy, B.A.; Ang, K.K.; El-Naggar, A.K.; Zanation, A.M.; Cmelak, A.J.; et al. Gene expression profiles identify epithelial-to-mesenchymal transition and activation of nuclear factor-kappaB signaling as characteristics of a high-risk head and neck squamous cell carcinoma. Cancer Res. 2006, 66, 8210–8218. [Google Scholar] [CrossRef] [PubMed] [Green Version]
- Sean, D.; Meltzer, P.S. GEOquery: A bridge between the Gene Expression Omnibus (GEO) and BioConductor. Bioinformatics 2007, 23, 1846–1847. [Google Scholar] [CrossRef] [Green Version]


| Features | Univariate | Multivariate | |||||
|---|---|---|---|---|---|---|---|
| HR | CI95% | p Value | HR | CI95% | p Value | ||
| Gender | Female | 1 | 1 | ||||
| Male | 1.157 | 0.843–1.587 | 0.367 | 1.076 | 0.767–1.510 | 0.671 | |
| Age at diagnosis | y | 1 | 1 | ||||
| y | 1.329 | 0.990–1.784 | 0.058 | 1.391 | 1.025–1.888 | 0.034 | |
| Clinical T Status | T1 + T2 | 1 | 1 | ||||
| T3 + T4 | 1.409 | 1.028–1.931 | 0.033 | 1.982 | 1.048–3.745 | 0.035 | |
| Clinical N Status | N0 | 1 | 1 | ||||
| N1-3 | 1.185 | 0.890–1.577 | 0.246 | 1.145 | 0.801–1.636 | 0.457 | |
| Clinical M Status | M0 | 1 | 1 | ||||
| M1 | 4.097 | 1.009–16.644 | 0.049 | 7.314 | 1.590–33.631 | 0.011 | |
| Clinical Stage | Stage I + II | 1 | 1 | ||||
| Stage III + IV | 1.245 | 0.882–1.759 | 0.213 | 0.621 | 0.287–1.343 | 0.226 | |
| Surgical Margin status | Negative | 1 | 1 | ||||
| Positive | 1.591 | 1.155–2.191 | 0.004 | 1.631 | 1.182–2.250 | 0.003 | |
| Tobacco Exposure | Low | 1 | 1 | ||||
| High | 1.364 | 1.008–1.844 | 0.044 | 1.363 | 0.990–1.875 | 0.058 | |
| Gene Expression | Low | 1 | 1 | ||||
| High | 2.101 | 1.572–2.809 | < 0.001 | 2.007 | 1.490–2.704 | <0.001 | |
| Gene ID | Gene Description | Kaplan–Meier Survival | Cox Univariate | Cox Multivariate | |||
|---|---|---|---|---|---|---|---|
| FDR p Value | Bonferroni p Value | HR * | CI95% | HR * | CI95% | ||
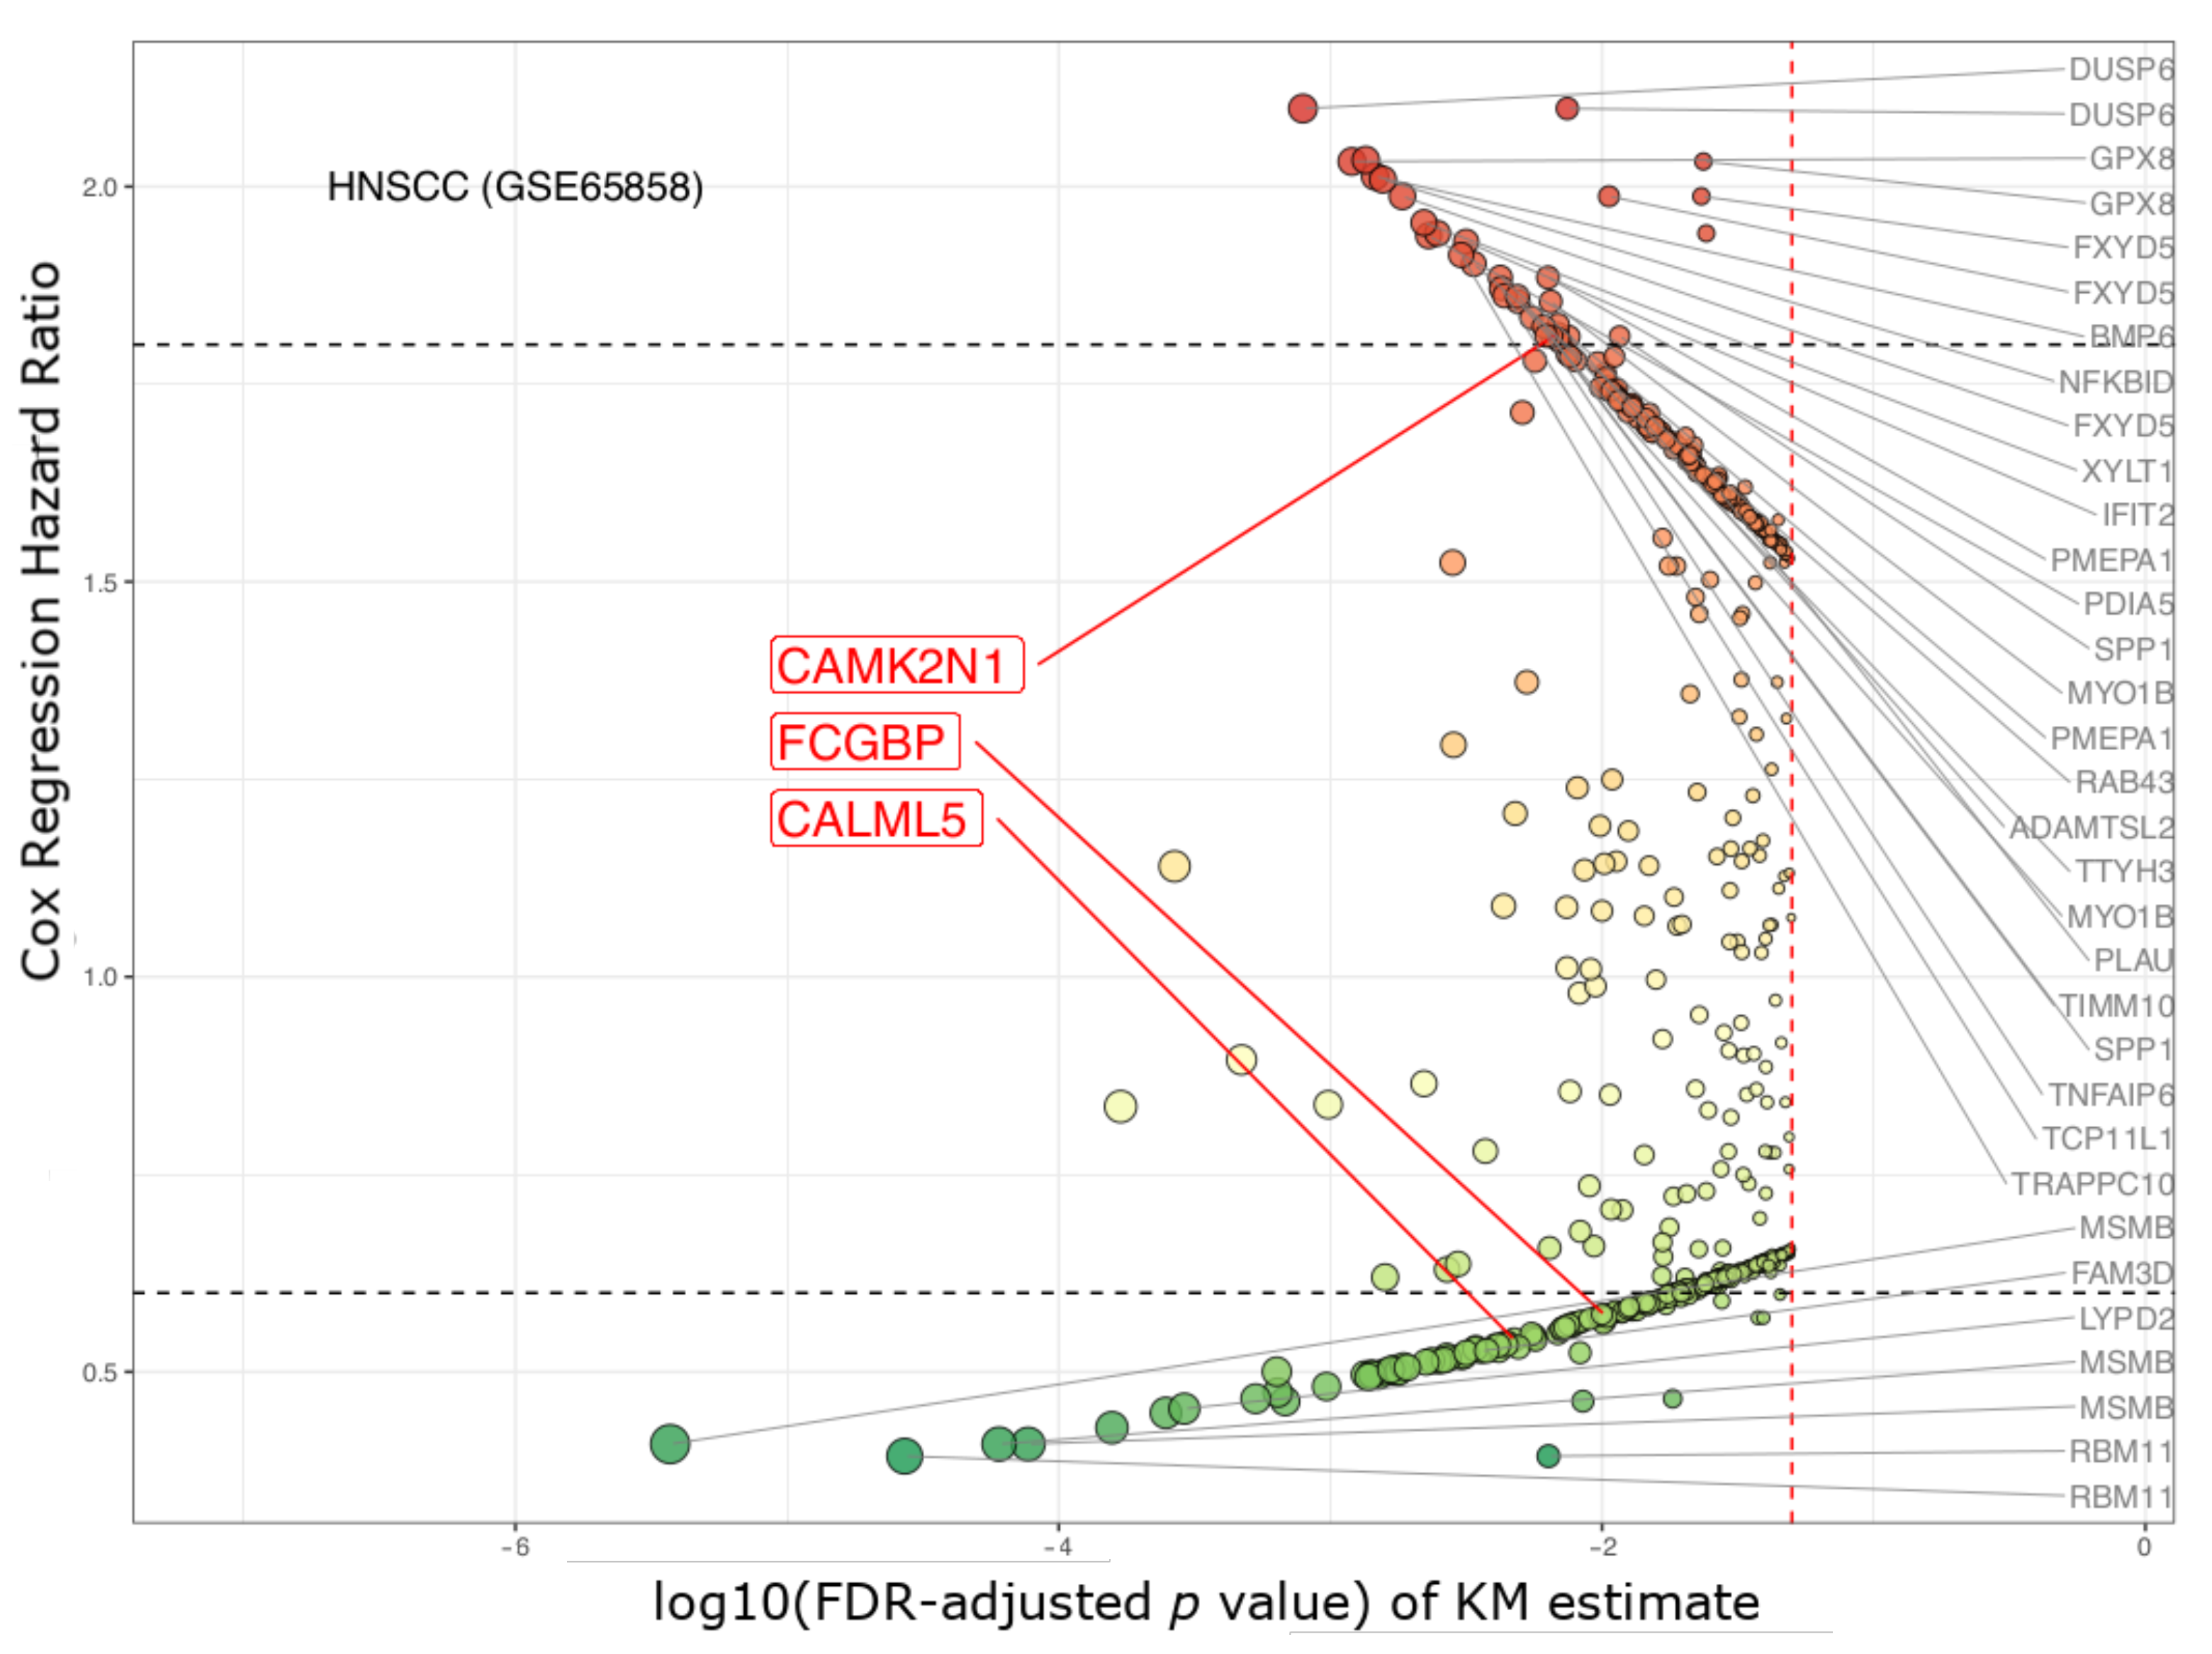
| CAMK2N1 | calcium/calmodulin- dependent protein kinase II inhibitor 1 | 1.63 × 10⁻⁵ | 0.002 | 2.101 | 1.572–2.809 | 2.007 | 1.490–2.704 |
| CALML5 | calmodulin like 5 | 1.97 × 10⁻⁴ | 0.039 | 0.51 | 0.379–0.686 | 0.493 | 0.364–0.667 |
| FCGBP | Fc fragment of IgG binding protein | 4.83× 10⁻⁵ | 0.008 | 0.484 | 0.359–0.653 | 0.496 | 0.366–0.674 |
Publisher’s Note: MDPI stays neutral with regard to jurisdictional claims in published maps and institutional affiliations. |
© 2021 by the authors. Licensee MDPI, Basel, Switzerland. This article is an open access article distributed under the terms and conditions of the Creative Commons Attribution (CC BY) license (https://creativecommons.org/licenses/by/4.0/).
Share and Cite
Chi, L.-H.; Wu, A.T.H.; Hsiao, M.; Li, Y.-C. A Transcriptomic Analysis of Head and Neck Squamous Cell Carcinomas for Prognostic Indications. J. Pers. Med. 2021, 11, 782. https://doi.org/10.3390/jpm11080782
Chi L-H, Wu ATH, Hsiao M, Li Y-C. A Transcriptomic Analysis of Head and Neck Squamous Cell Carcinomas for Prognostic Indications. Journal of Personalized Medicine. 2021; 11(8):782. https://doi.org/10.3390/jpm11080782
Chicago/Turabian StyleChi, Li-Hsing, Alexander T. H. Wu, Michael Hsiao, and Yu-Chuan (Jack) Li. 2021. "A Transcriptomic Analysis of Head and Neck Squamous Cell Carcinomas for Prognostic Indications" Journal of Personalized Medicine 11, no. 8: 782. https://doi.org/10.3390/jpm11080782
APA StyleChi, L.-H., Wu, A. T. H., Hsiao, M., & Li, Y.-C. (2021). A Transcriptomic Analysis of Head and Neck Squamous Cell Carcinomas for Prognostic Indications. Journal of Personalized Medicine, 11(8), 782. https://doi.org/10.3390/jpm11080782