
Cardiorenal Syndrome: Emerging Role of Medical Imaging for Clinical Diagnosis and Management


Abstract

1. Introduction
2. Classification, Pathophysiology, and Clinical Management of CRS
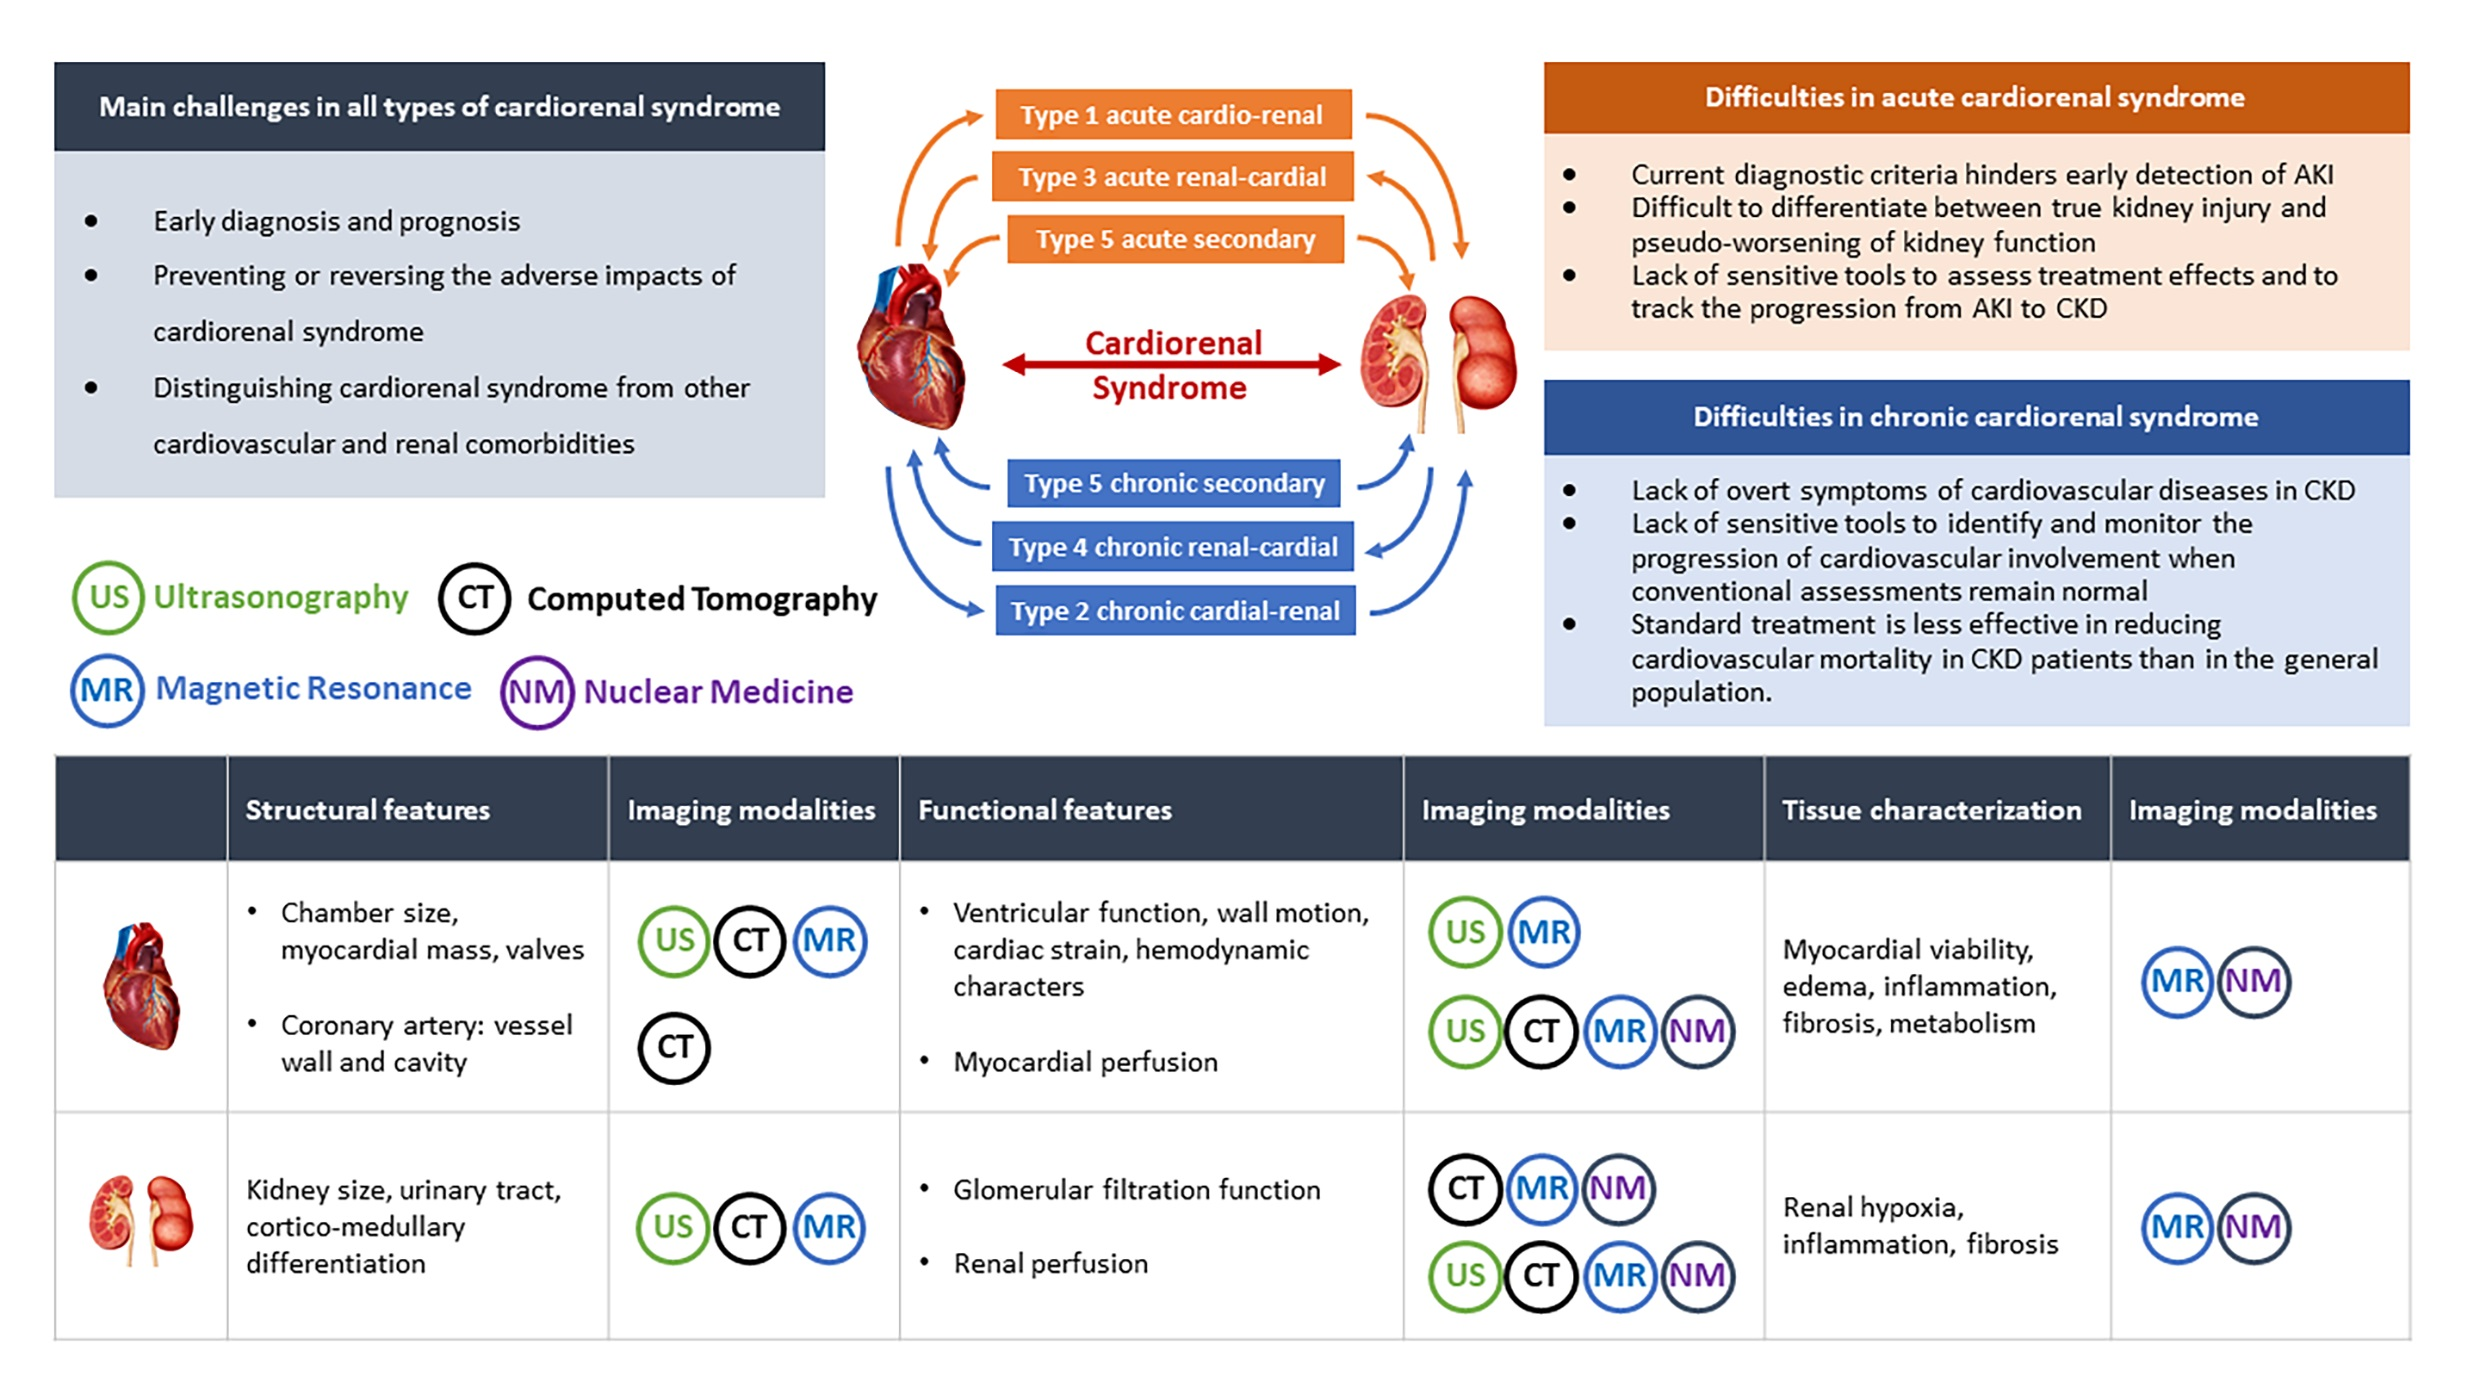
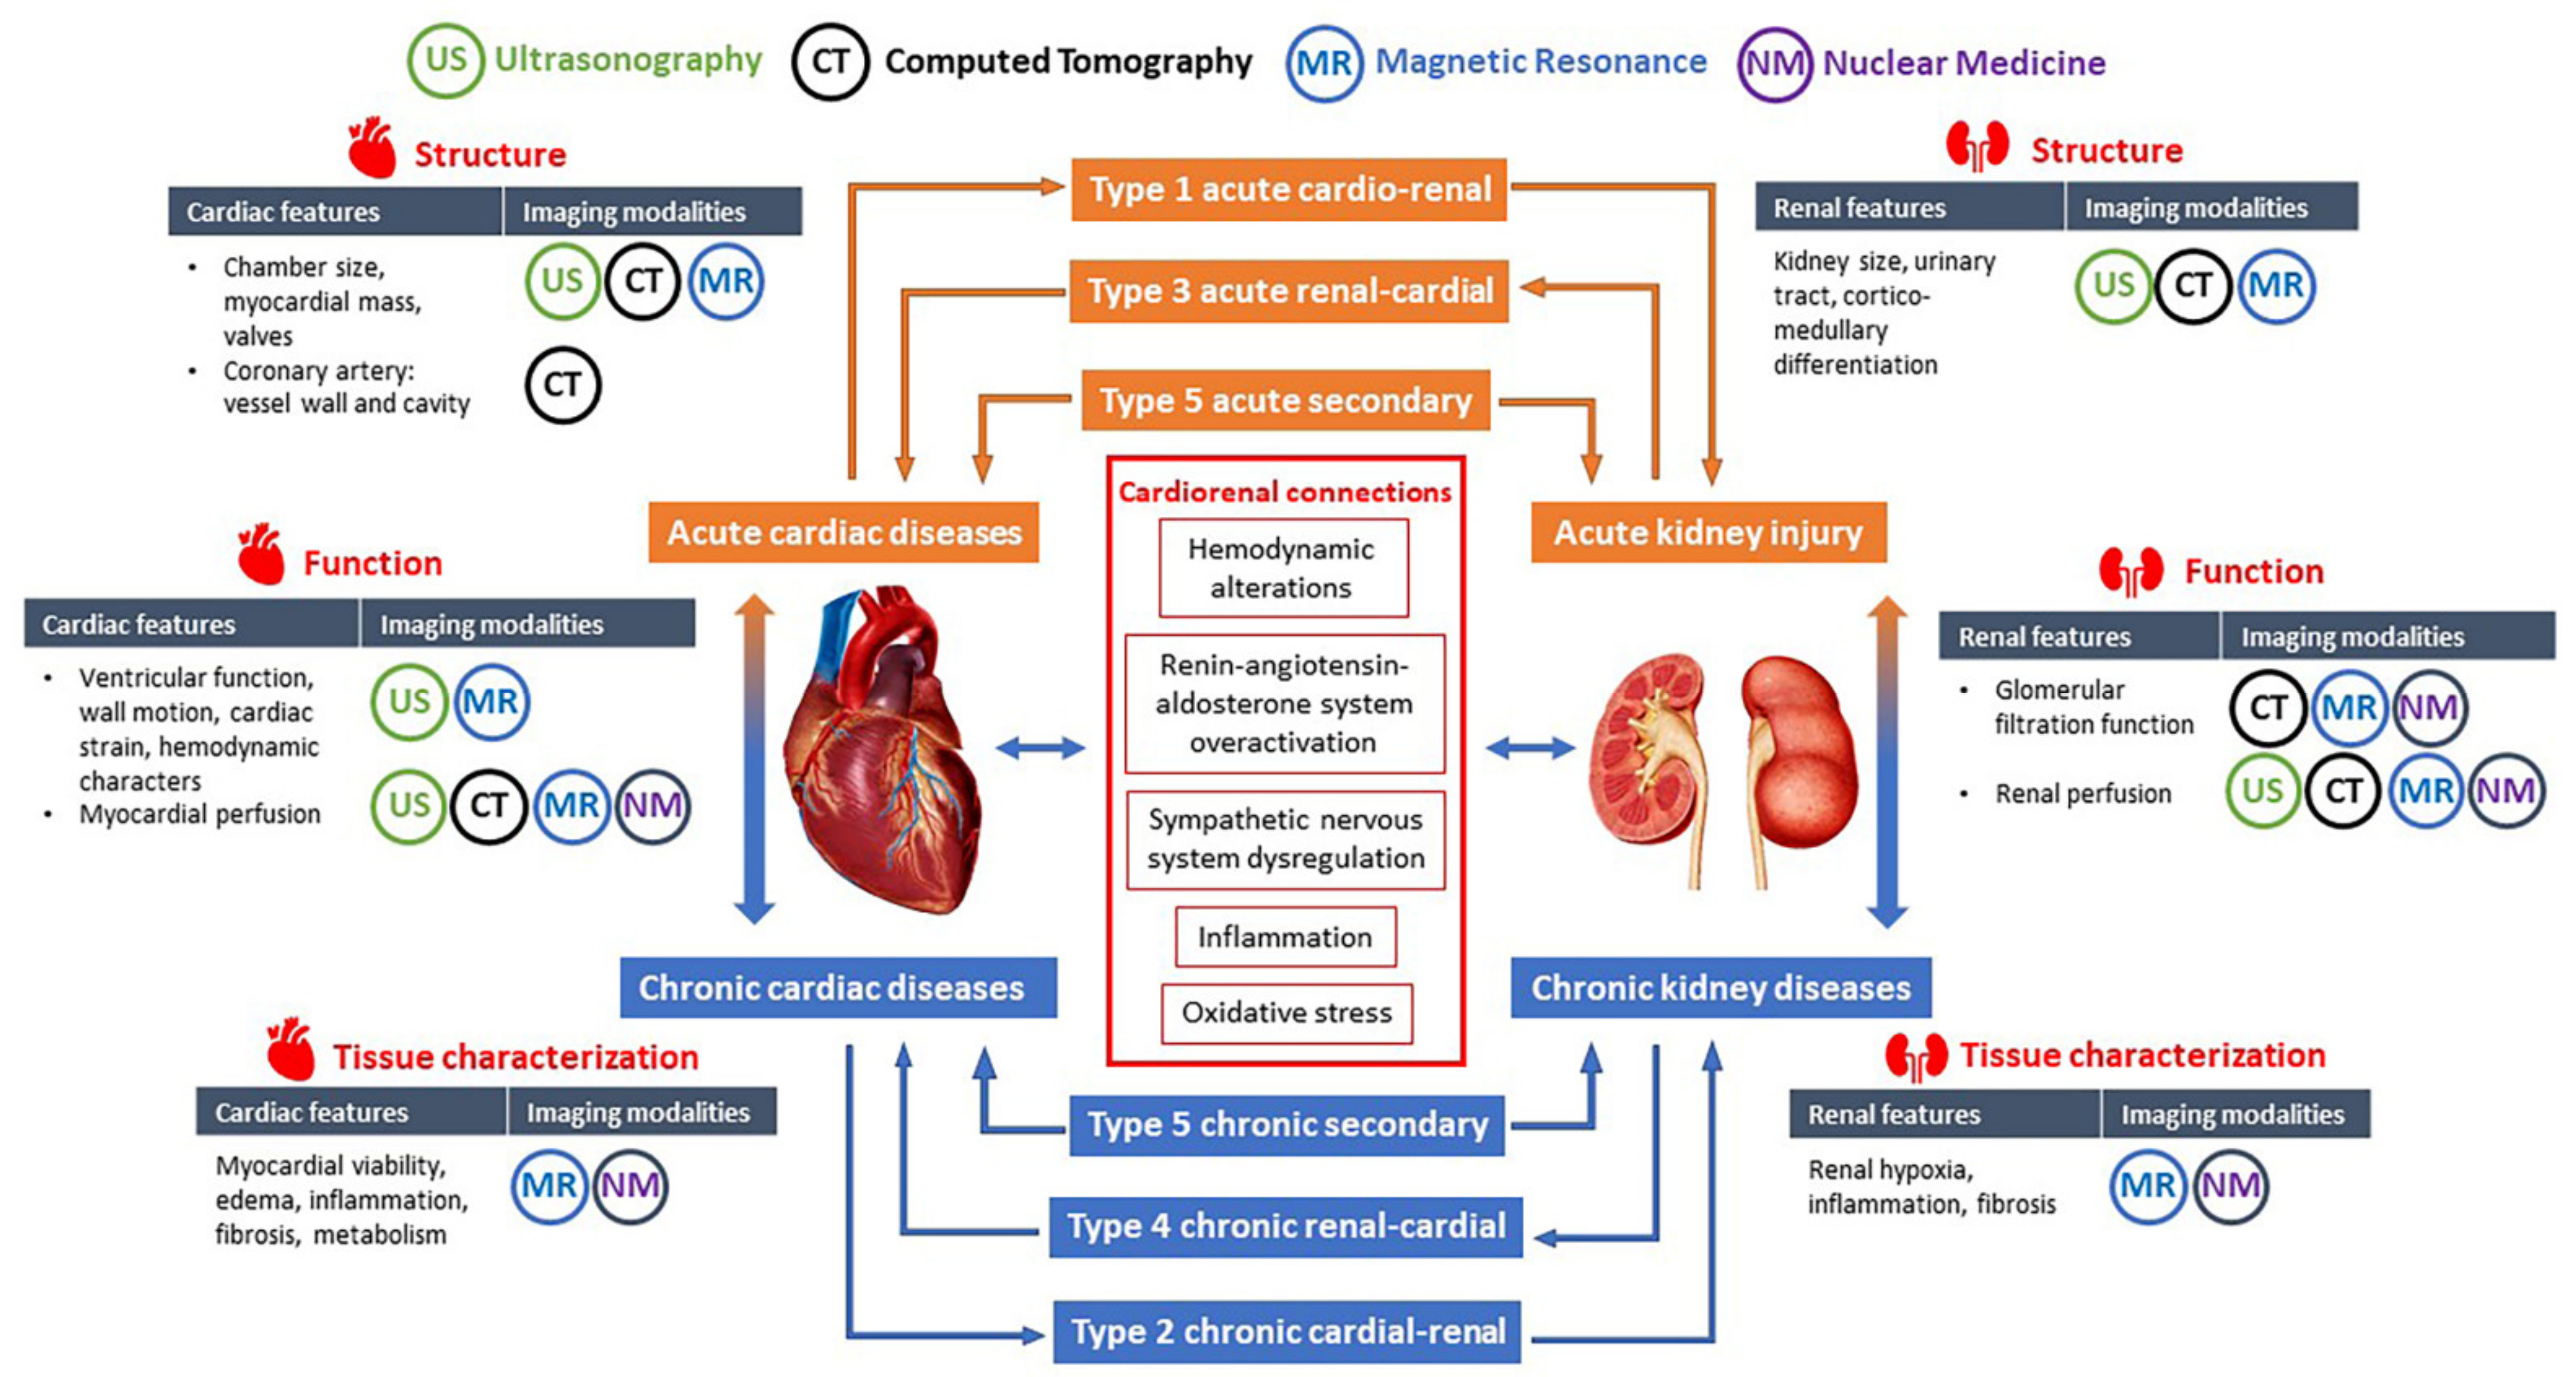
2.1. Classification of CRS
2.2. Pathophysiology of CRS
2.3. Current Difficulties in Diagnosis and Management of CRS
3. Cardiovascular and Renal Imaging Techniques Related to CRS
3.1. Cardiovascular Imaging Techniques
3.1.1. Transthoracic Echocardiography
3.1.2. Cardiovascular Magnetic Resonance
3.1.3. Cardiac Computed Tomography
3.1.4. Nuclear Cardiac Imaging
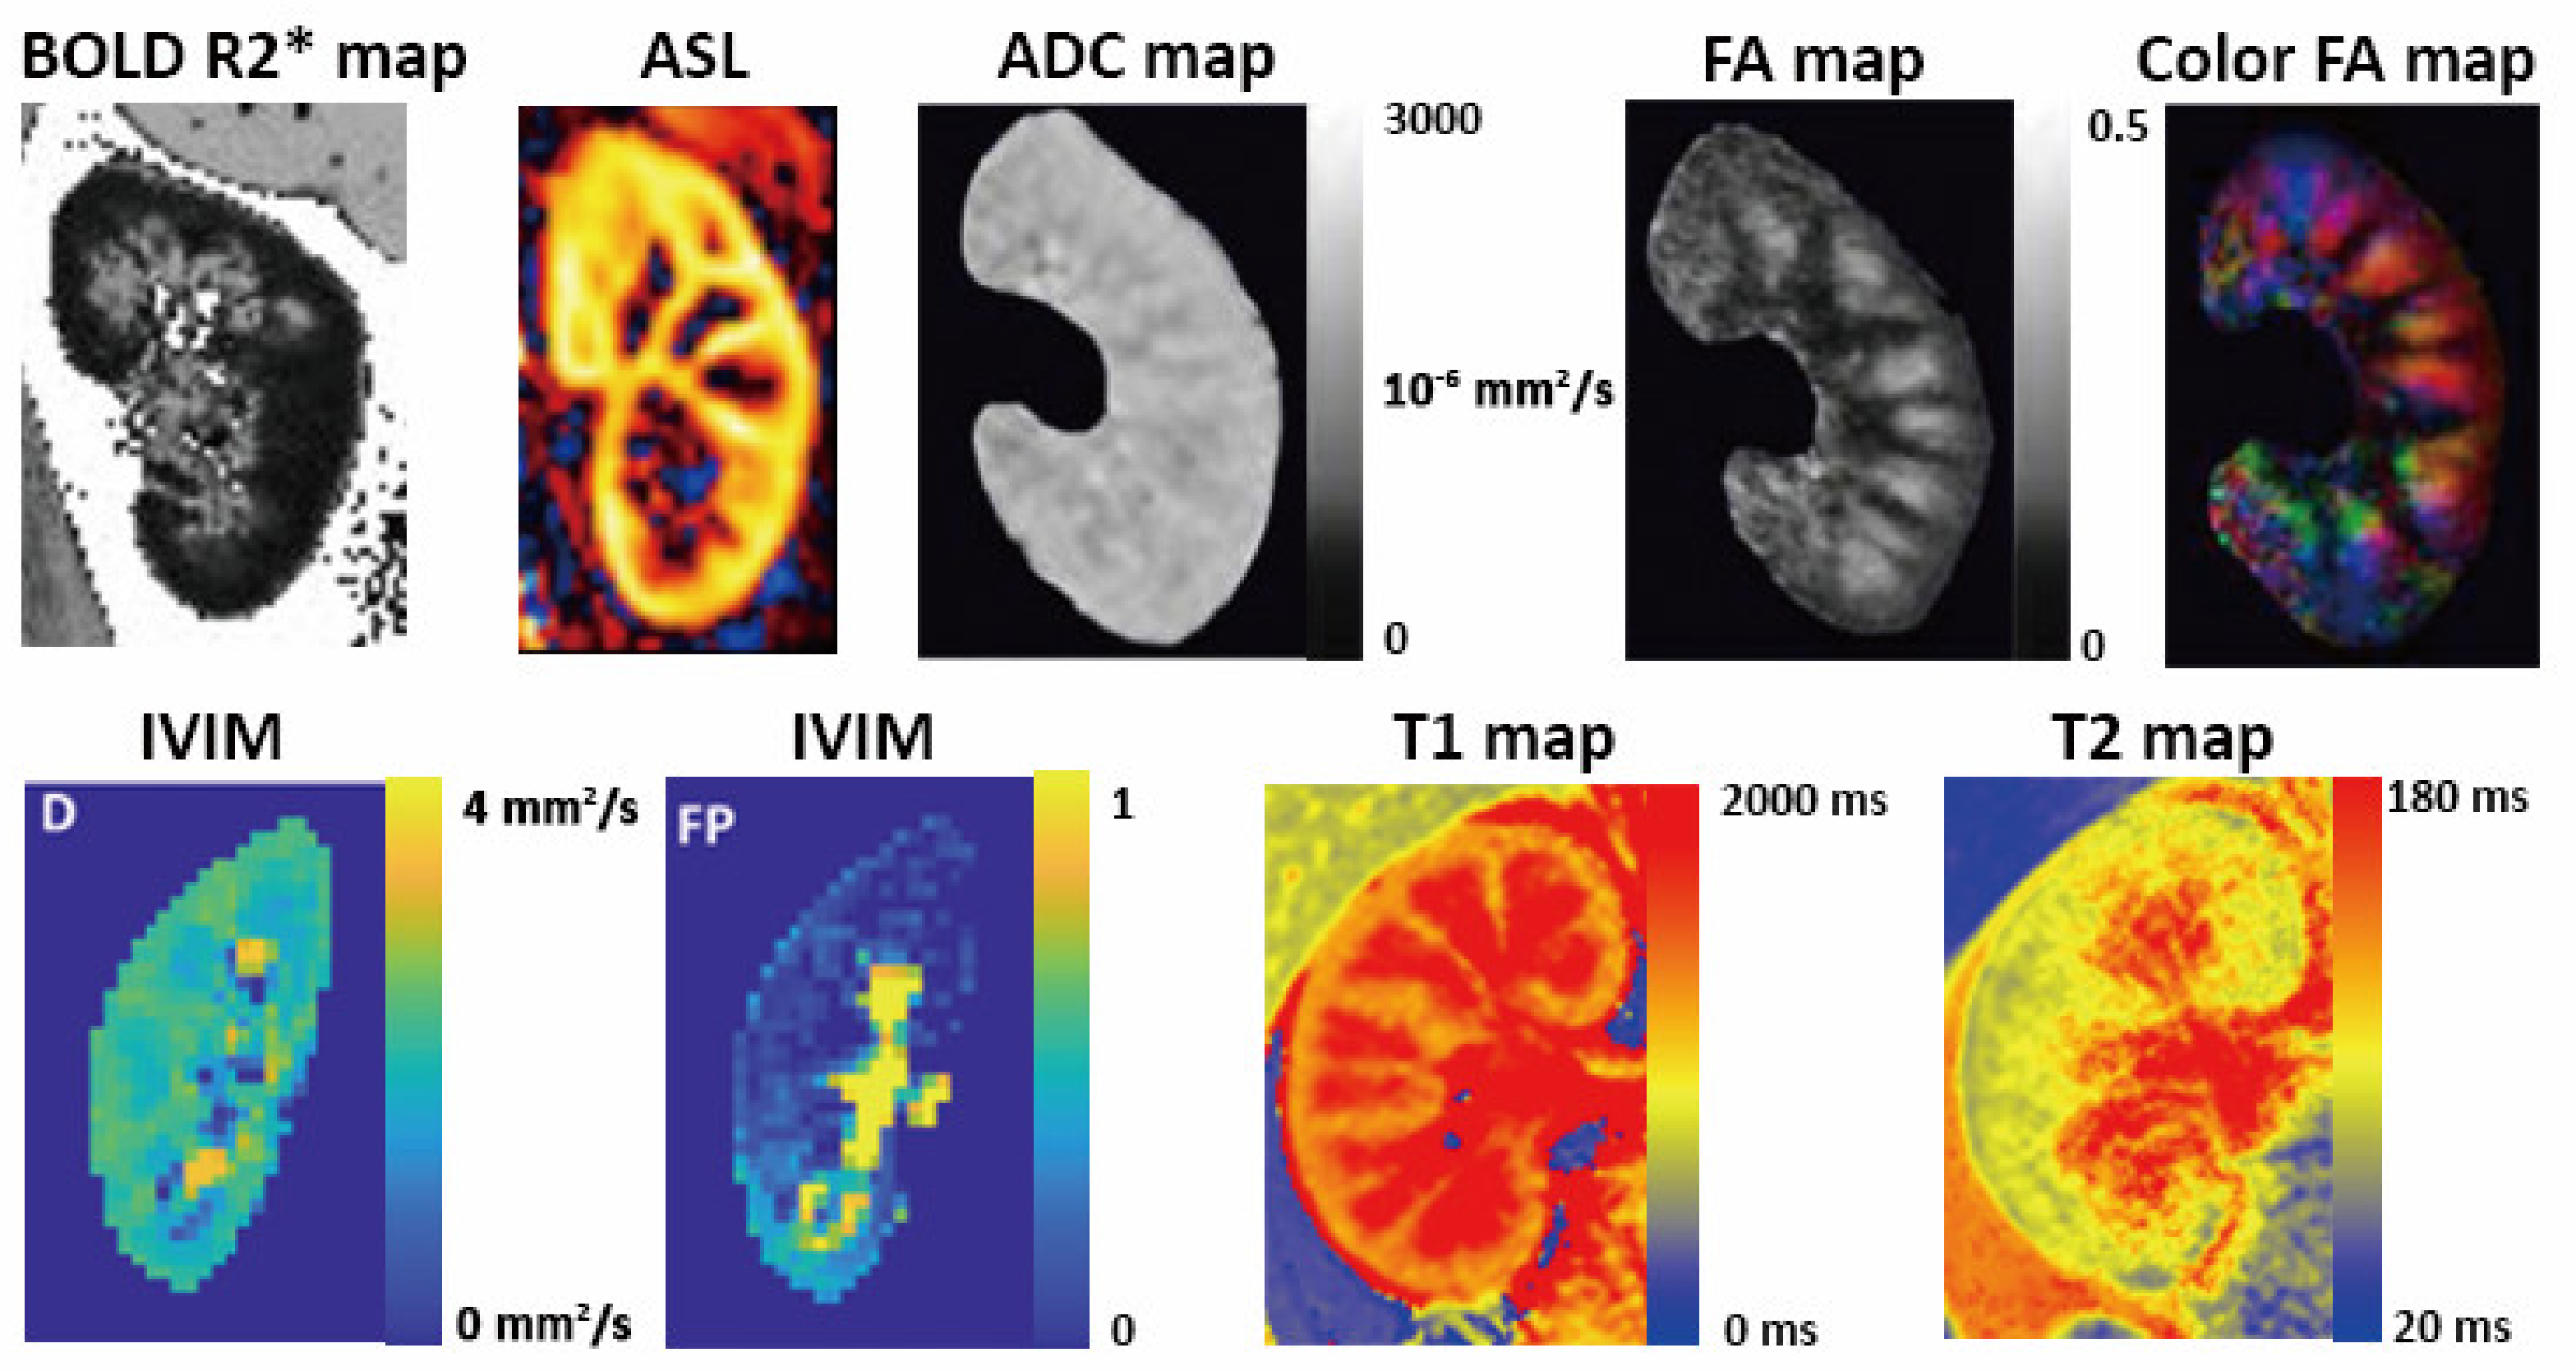
3.2. Renal Imaging Techniques
3.2.1. Renal Ultrasonography
3.2.2. Renal Magnetic Resonance Imaging
3.2.3. CT and Nuclear Medicine for Renal Imaging
4. Application of Imaging Biomarkers in Acute CRS
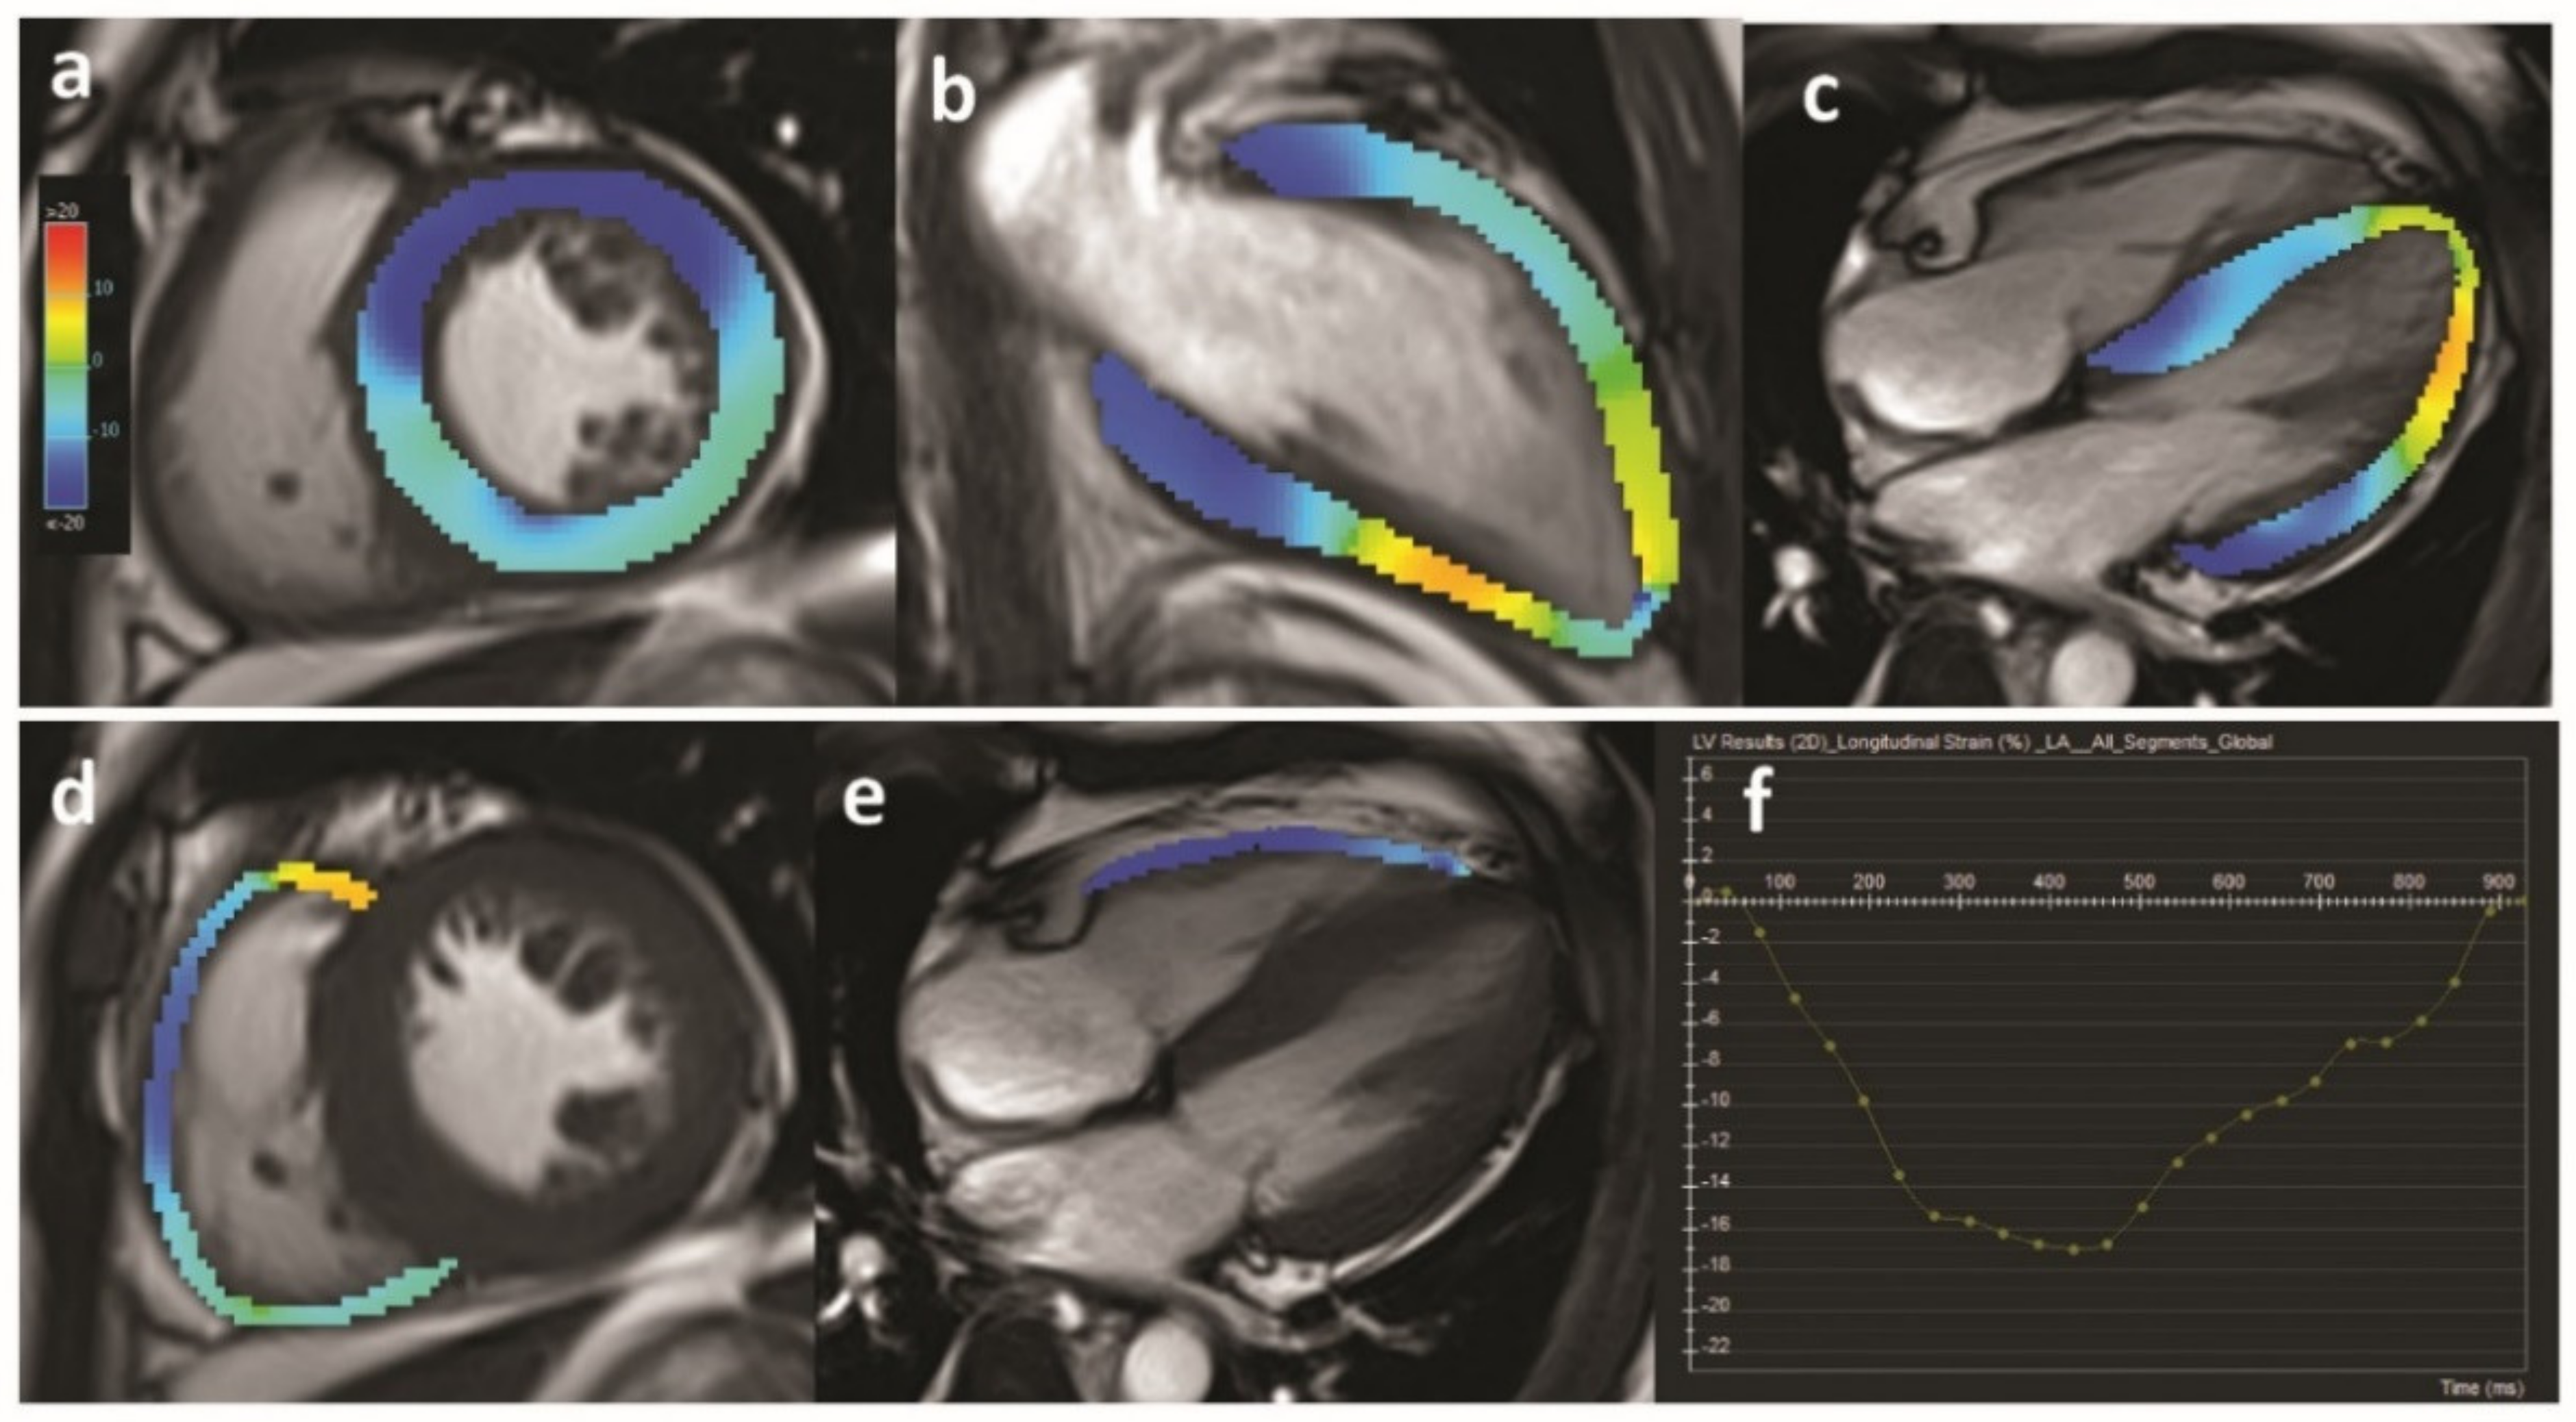
4.1. Echocardiographic and CMR Biomarkers for Diagnosis and Prognosis
4.2. Kidney Sonographic Biomarkers for Prognosis
4.3. Preclinical Kidney MRI Biomarkers of AKI
5. Application of Imaging Biomarkers in Chronic CRS
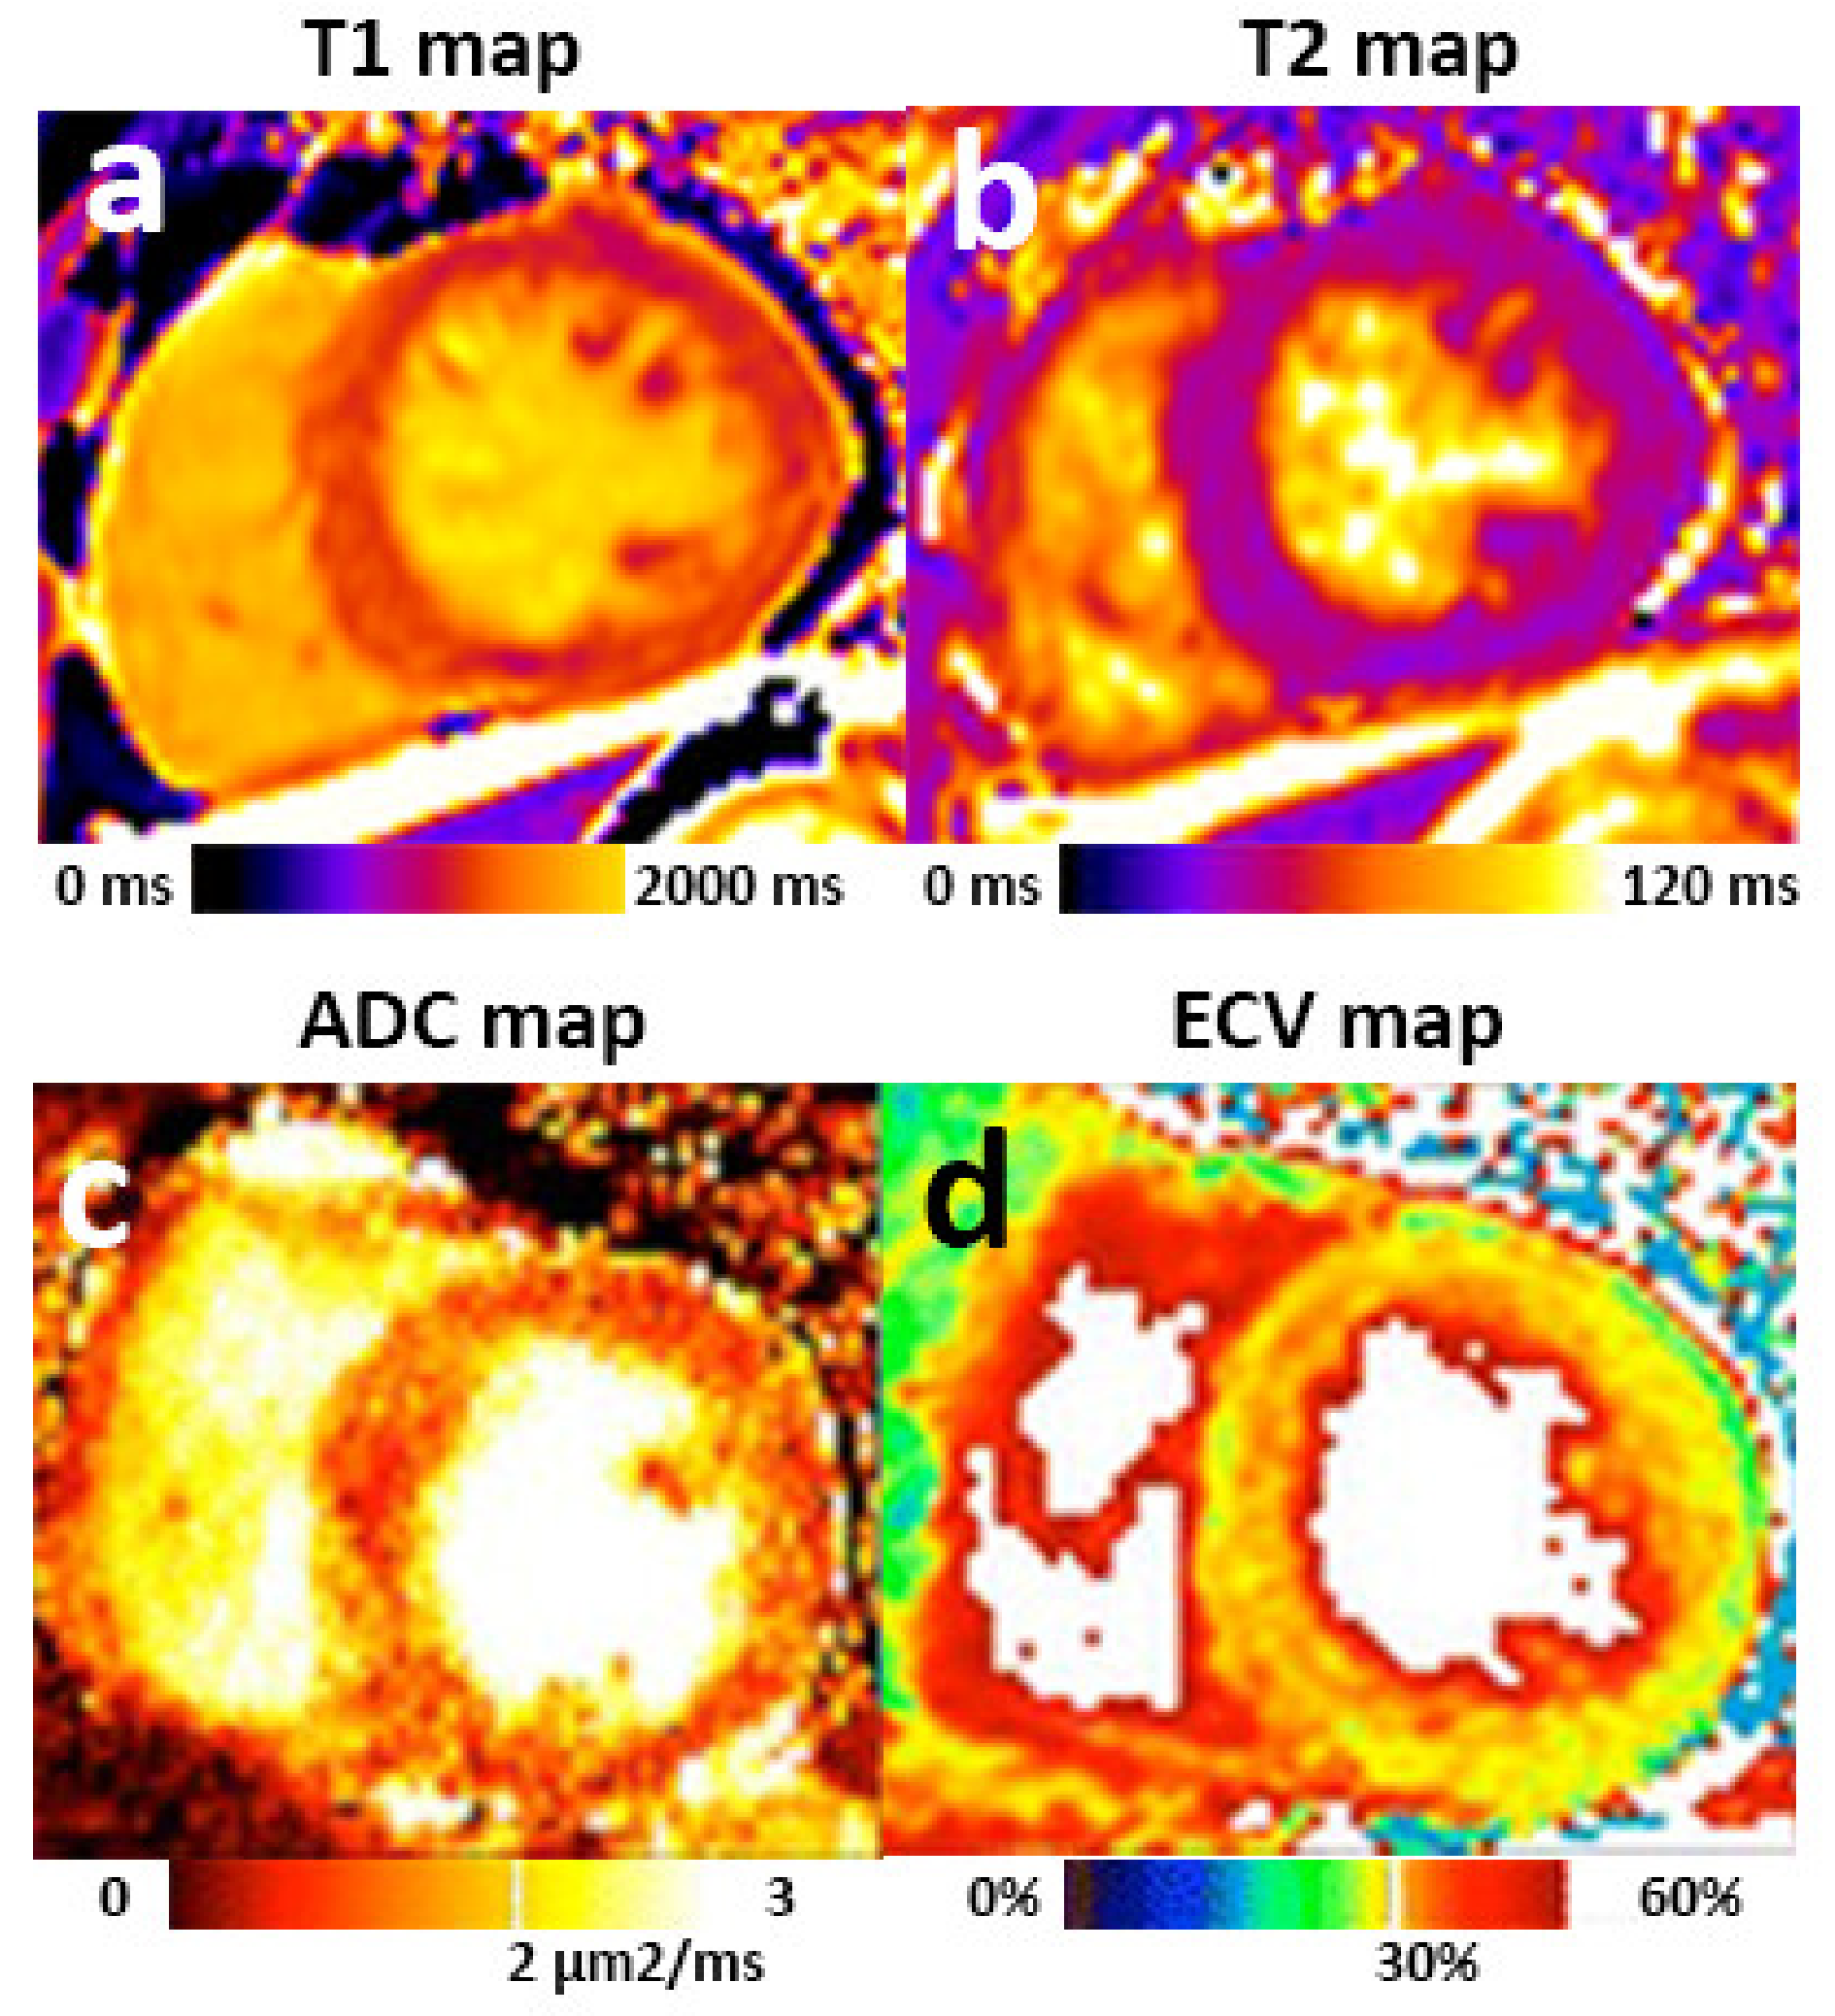
5.1. Cardiac Imaging Biomarkers of CKD-Associated Cardiomyopathy
5.2. Preclinical Kidney MRI Biomarkers of CKD with Potential Value in CRS
6. Opportunities for Comprehensive Imaging Assessment of Heart and Kidneys in Future Studies
7. Summary
Author Contributions
Funding
Institutional Review Board Statement
Informed Consent Statement
Conflicts of Interest
References
- Ronco, C.; McCullough, P.; Anker, S.D.; Anand, I.; Aspromonte, N.; Bagshaw, S.M.; Bellomo, R.; Berl, T.; Bobek, I.; Cruz, D.N.; et al. Cardio-renal syndromes: Report from the consensus conference of the acute dialysis quality initiative. Eur. Heart J. 2010, 31, 703–711. [Google Scholar] [CrossRef]
- Bagshaw, S.M.; Cruz, D.N.; Aspromonte, N.; Daliento, L.; Ronco, F.; Sheinfeld, G.; Anker, S.D.; Anand, I.; Bellomo, R.; Berl, T.; et al. Epidemiology of cardio-renal syndromes: Workgroup statements from the 7th ADQI Consensus Conference. Nephrol. Dial. Transplant. 2010, 25, 1406–1416. [Google Scholar] [CrossRef]
- Ismail, Y.; Kasmikha, Z.; Green, H.L.; McCullough, P.A. Cardio-renal syndrome type 1: Epidemiology, pathophysiology, and treatment. Semin. Nephrol. 2012, 32, 18–25. [Google Scholar] [CrossRef]
- Deferrari, G.; Cipriani, A.; La Porta, E. Renal dysfunction in cardiovascular diseases and its consequences. J. Nephrol. 2020. [Google Scholar] [CrossRef] [PubMed]
- Jois, P.; Mebazaa, A. Cardio-renal syndrome type 2: Epidemiology, pathophysiology, and treatment. Semin. Nephrol. 2012, 32, 26–30. [Google Scholar] [CrossRef]
- Shastri, S.; Sarnak, M.J. Cardiovascular disease and CKD: Core curriculum. Am. J. Kidney Dis. 2010, 56, 399–417. [Google Scholar] [CrossRef] [PubMed]
- Soni, S.S.; Ronco, C.; Pophale, R.; Bhansali, A.S.; Nagarik, A.P.; Barnela, S.R.; Saboo, S.S.; Raman, A. Cardio-renal syndrome type 5: Epidemiology, pathophysiology, and treatment. Semin. Nephrol. 2012, 32, 49–56. [Google Scholar] [CrossRef] [PubMed]
- Rangaswami, J.; Bhalla, V.; Blair, J.E.A.; Chang, T.I.; Costa, S.; Lentine, K.L.; Lerma, E.V.; Mezue, K.; Molitch, M.; Mullens, W.; et al. Cardiorenal Syndrome: Classification, Pathophysiology, Diagnosis, and Treatment Strategies: A Scientific Statement From the American Heart Association. Circulation 2019, 139, e840–e878. [Google Scholar] [CrossRef]
- Mavrakanas, T.A.; Khattak, A.; Singh, K.; Charytan, D.M. Epidemiology and Natural History of the Cardiorenal Syndromes in a Cohort with Echocardiography. Clin. J. Am. Soc. Nephrol. 2017, 12, 1624–1633. [Google Scholar] [CrossRef]
- Heywood, J.T.; Fonarow, G.C.; Costanzo, M.R.; Mathur, V.S.; Wigneswaran, J.R.; Wynne, J.; ADHERE Scientific Advisory Committee and Investigators. High prevalence of renal dysfunction and its impact on outcome in 118,465 patients hospitalized with acute decompensated heart failure: A report from the ADHERE database. J. Card Fail. 2007, 13, 422–430. [Google Scholar] [CrossRef]
- Campbell, R.C.; Sui, X.; Filippatos, G.; Love, T.E.; Wahle, C.; Sanders, P.W.; Ahmed, A. Association of chronic kidney disease with outcomes in chronic heart failure: A propensity-matched study. Nephrol. Dial. Transplant. 2009, 24, 186–193. [Google Scholar] [CrossRef]
- Hatamizadeh, P.; Fonarow, G.C.; Budoff, M.J.; Darabian, S.; Kovesdy, C.P.; Kalantar-Zadeh, K. Cardiorenal syndrome: Pathophysiology and potential targets for clinical management. Nat. Rev. Nephrol. 2013, 9, 99–111. [Google Scholar] [CrossRef]
- Schrier, R.W.; Abraham, W.T. Hormones and hemodynamics in heart failure. N. Engl. J. Med. 1999, 341, 577–585. [Google Scholar] [CrossRef]
- Rosner, M.H.; Ronco, C.; Okusa, M.D. The role of inflammation in the cardio-renal syndrome: A focus on cytokines and inflammatory mediators. Semin. Nephrol. 2012, 32, 70–78. [Google Scholar] [CrossRef] [PubMed]
- Schefold, J.C.; Filippatos, G.; Hasenfuss, G.; Anker, S.D.; von Haehling, S. Heart failure and kidney dysfunction: Epidemiology, mechanisms and management. Nat. Rev. Nephrol. 2016, 12, 610–623. [Google Scholar] [CrossRef]
- Bongartz, L.G.; Cramer, M.J.; Doevendans, P.A.; Joles, J.A.; Braam, B. The severe cardiorenal syndrome:‘Guyton revisited’. Eur. Heart J. 2005, 26, 11–17. [Google Scholar] [CrossRef] [PubMed]
- Haase, M.; Mueller, C.; Damman, K.; Murray, P.T.; Kellum, J.A.; Ronco, C.; McCullough, P.A.; Acute Dialysis Quality Initiative. Pathogenesis of cardiorenal syndrome type 1 in acute decompensated heart failure: Workgroup statements from the eleventh consensus conference of the Acute Dialysis Quality Initiative (ADQI). In ADQI Consensus on AKI Biomarkers and Cardiorenal Syndromes; Karger Publishers: Basel, Switzerland, 2013; Volume 182, pp. 99–116. [Google Scholar]
- Zannad, F.; Rossignol, P. Cardiorenal Syndrome Revisited. Circulation 2018, 138, 929–944. [Google Scholar] [CrossRef]
- Tabucanon, T.; Tang, W.H.W. Right Heart Failure and Cardiorenal Syndrome. Cardiol. Clin. 2020, 38, 185–202. [Google Scholar] [CrossRef] [PubMed]
- Jentzer, J.C.; Bihorac, A.; Brusca, S.B.; Del Rio-Pertuz, G.; Kashani, K.; Kazory, A.; Kellum, J.A.; Mao, M.; Moriyama, B.; Morrow, D.A.; et al. Contemporary Management of Severe Acute Kidney Injury and Refractory Cardiorenal Syndrome: JACC Council Perspectives. J. Am. Coll. Cardiol. 2020, 76, 1084–1101. [Google Scholar] [CrossRef]
- Chuasuwan, A.; Kellum, J.A. Cardio-renal syndrome type 3: Epidemiology, pathophysiology, and treatment. Semin. Nephrol. 2012, 32, 31–39. [Google Scholar] [CrossRef]
- Yogasundaram, H.; Chappell, M.C.; Braam, B.; Oudit, G.Y. Cardiorenal Syndrome and Heart Failure-Challenges and Opportunities. Can. J. Cardiol. 2019, 35, 1208–1219. [Google Scholar] [CrossRef] [PubMed]
- Hostetter, T.H.; Ibrahim, H.N. Aldosterone in chronic kidney and cardiac disease. J. Am. Soc. Nephrol. 2003, 14, 2395–2401. [Google Scholar] [CrossRef]
- Giam, B.; Kaye, D.M.; Rajapakse, N.W. Role of renal oxidative stress in the pathogenesis of the cardiorenal syndrome. Heart Lung Circ. 2016, 25, 874–880. [Google Scholar] [CrossRef]
- Hedayat, M.; Mahmoudi, M.J.; Rose, N.R.; Rezaei, N. Proinflammatory cytokines in heart failure: Double-edged swords. Heart Fail. Rev. 2010, 15, 543–562. [Google Scholar] [CrossRef] [PubMed]
- Rockey, D.C.; Bell, P.D.; Hill, J.A. Fibrosis—A common pathway to organ injury and failure. N. Engl. J. Med. 2015, 372, 1138–1149. [Google Scholar] [CrossRef]
- Travers, J.G.; Kamal, F.A.; Robbins, J.; Yutzey, K.E.; Blaxall, B.C. Cardiac Fibrosis: The Fibroblast Awakens. Circ. Res. 2016, 118, 1021–1040. [Google Scholar] [CrossRef]
- Kellum, J.A.; Lameire, N.; Aspelin, P.; Barsoum, R.S.; Burdmann, E.A.; Goldstein, S.L.; Herzog, C.A.; Joannidis, M.; Kribben, A.; Levey, A.S. Kidney disease: Improving global outcomes (KDIGO) acute kidney injury work group. KDIGO clinical practice guideline for acute kidney injury. Kidney Int. Suppl. 2012, 2, 1–138. [Google Scholar]
- Coca, S.; Yalavarthy, R.; Concato, J.; Parikh, C.R. Biomarkers for the diagnosis and risk stratification of acute kidney injury: A systematic review. Kidney Int. 2008, 73, 1008–1016. [Google Scholar] [CrossRef] [PubMed]
- Damman, K.; Tang, W.W.; Testani, J.M.; McMurray, J.J. Terminology and definition of changes renal function in heart failure. Eur. Heart J. 2014, 35, 3413–3416. [Google Scholar] [CrossRef]
- Ikizler, T.A.; Parikh, C.R.; Himmelfarb, J.; Chinchilli, V.M.; Liu, K.D.; Coca, S.G.; Garg, A.X.; Hsu, C.Y.; Siew, E.D.; Wurfel, M.M.; et al. A prospective cohort study that examined acute kidney injury and kidney outcomes, cardiovascular events and death informs on long-term clinical outcomes. Kidney Int. 2020. [Google Scholar] [CrossRef]
- House, A.A. Cardio-renal syndrome type 4: Epidemiology, pathophysiology and treatment. Semin. Nephrol. 2012, 32, 40–48. [Google Scholar] [CrossRef] [PubMed]
- Edwards, N.C.; Moody, W.E.; Chue, C.D.; Ferro, C.J.; Townend, J.N.; Steeds, R.P. Defining the natural history of uremic cardiomyopathy in chronic kidney disease: The role of cardiovascular magnetic resonance. JACC 2014, 7, 703–714. [Google Scholar] [PubMed]
- Consortium, C.K.D.P. Association of estimated glomerular filtration rate and albuminuria with all-cause and cardiovascular mortality in general population cohorts: A collaborative meta-analysis. Lancet 2010, 375, 2073–2081. [Google Scholar]
- Baigent, C.; Landray, M.J.; Reith, C.; Emberson, J.; Wheeler, D.C.; Tomson, C.; Wanner, C.; Krane, V.; Cass, A.; Craig, J. The effects of lowering LDL cholesterol with simvastatin plus ezetimibe in patients with chronic kidney disease (Study of Heart and Renal Protection): A randomised placebo-controlled trial. Lancet 2011, 377, 2181–2192. [Google Scholar] [CrossRef]
- Sosnov, J.; Lessard, D.; Goldberg, R.J.; Yarzebski, J.; Gore, J.M. Differential symptoms of acute myocardial infarction in patients with kidney disease: A community-wide perspective. Am. J. Kidney Dis. 2006, 47, 378–384. [Google Scholar] [CrossRef] [PubMed]
- Gentile, G.; Remuzzi, G. Novel Biomarkers for Renal Diseases? None for the Moment (but One). J. Biomol. Screen. 2016, 21, 655–670. [Google Scholar] [CrossRef]
- Ponikowski, P.; Voors, A.A.; Anker, S.D.; Bueno, H.; Cleland, J.G.; Coats, A.J.; Falk, V.; Gonzalez-Juanatey, J.R.; Harjola, V.-P.; Jankowska, E.A. 2016 ESC Guidelines for the diagnosis and treatment of acute and chronic heart failure: The Task Force for the diagnosis and treatment of acute and chronic heart failure of the European Society of Cardiology (ESC) Developed with the special contribution of the Heart Failure Association (HFA) of the ESC. Eur. Heart J. 2016, 37, 2129–2200. [Google Scholar]
- Mitchell, C.; Rahko, P.S.; Blauwet, L.A.; Canaday, B.; Finstuen, J.A.; Foster, M.C.; Horton, K.; Ogunyankin, K.O.; Palma, R.A.; Velazquez, E.J. Guidelines for performing a comprehensive transthoracic echocardiographic examination in adults: Recommendations from the American Society of Echocardiography. J. Am. Soc. Echocardiogr. 2019, 32, 1–64. [Google Scholar] [CrossRef]
- Pellicori, P.; Kallvikbacka-Bennett, A.; Khaleva, O.; Carubelli, V.; Costanzo, P.; Castiello, T.; Wong, K.; Zhang, J.; Cleland, J.G.; Clark, A.L. Global longitudinal strain in patients with suspected heart failure and a normal ejection fraction: Does it improve diagnosis and risk stratification? Int. J. Cardiovasc. Imaging 2014, 30, 69–79. [Google Scholar] [CrossRef]
- Porter, T.R.; Mulvagh, S.L.; Abdelmoneim, S.S.; Becher, H.; Belcik, J.T.; Bierig, M.; Choy, J.; Gaibazzi, N.; Gillam, L.D.; Janardhanan, R. Clinical applications of ultrasonic enhancing agents in echocardiography: 2018 American Society of Echocardiography guidelines update. J. Am. Soc. Echocardiogr. 2018, 31, 241–274. [Google Scholar] [CrossRef]
- Von Knobelsdorff-Brenkenhoff, F.; Schulz-Menger, J. Role of cardiovascular magnetic resonance in the guidelines of the European Society of Cardiology. J. Cardiovasc. Magn. Reson. 2015, 18, 6. [Google Scholar] [CrossRef]
- Leiner, T.; Bogaert, J.; Friedrich, M.G.; Mohiaddin, R.; Muthurangu, V.; Myerson, S.; Powell, A.J.; Raman, S.V.; Pennell, D.J. SCMR Position Paper (2020) on clinical indications for cardiovascular magnetic resonance. J. Cardiovasc. Magn. Reson. 2020, 22. [Google Scholar] [CrossRef]
- MEMBERS, W.C.; Hundley, W.G.; Bluemke, D.A.; Finn, J.P.; Flamm, S.D.; Fogel, M.A.; Friedrich, M.G.; Ho, V.B.; Jerosch-Herold, M.; Kramer, C.M. ACCF/ACR/AHA/NASCI/SCMR 2010 expert consensus document on cardiovascular magnetic resonance: A report of the American College of Cardiology Foundation Task Force on Expert Consensus Documents. Circulation 2010, 121, 2462–2508. [Google Scholar] [CrossRef] [PubMed]
- Voigt, J.-U.; Cvijic, M. 2-and 3-dimensional myocardial strain in cardiac health and disease. JACC 2019, 12, 1849–1863. [Google Scholar] [CrossRef] [PubMed]
- Kim, R.J.; Albert, T.S.; Wible, J.H.; Elliott, M.D.; Allen, J.C.; Lee, J.C.; Parker, M.; Napoli, A.; Judd, R.M. Performance of delayed-enhancement magnetic resonance imaging with gadoversetamide contrast for the detection and assessment of myocardial infarction: An international, multicenter, double-blinded, randomized trial. Circulation 2008, 117, 629. [Google Scholar] [CrossRef]
- Haaf, P.; Garg, P.; Messroghli, D.R.; Broadbent, D.A.; Greenwood, J.P.; Plein, S. Cardiac T1 mapping and extracellular volume (ECV) in clinical practice: A comprehensive review. J. Cardiovasc. Magn. Reson. 2017, 18, 89. [Google Scholar] [CrossRef]
- Dekkers, I.A.; Roos, R.; van der Molen, A.J. Gadolinium retention after administration of contrast agents based on linear chelators and the recommendations of the European Medicines Agency. Eur. Radiol. 2018, 28, 1579–1584. [Google Scholar] [CrossRef]
- Perazella, M.A. Gadolinium-contrast toxicity in patients with kidney disease: Nephrotoxicity and nephrogenic systemic fibrosis. Curr. Drug Saf. 2008, 3, 67–75. [Google Scholar] [CrossRef]
- Mewton, N.; Liu, C.Y.; Croisille, P.; Bluemke, D.; Lima, J.A. Assessment of myocardial fibrosis with cardiovascular magnetic resonance. J. Am. Coll. Cardiol. 2011, 57, 891–903. [Google Scholar] [CrossRef] [PubMed]
- Hayer, M.K.; Radhakrishnan, A.; Price, A.M.; Liu, B.; Baig, S.; Weston, C.J.; Biasiolli, L.; Ferro, C.J.; Townend, J.N.; Steeds, R.P.; et al. Defining Myocardial Abnormalities Across the Stages of Chronic Kidney Disease: A Cardiac Magnetic Resonance Imaging Study. JACC 2020. [Google Scholar] [CrossRef]
- Nguyen, C.; Lu, M.; Fan, Z.; Bi, X.; Kellman, P.; Zhao, S.; Li, D. Contrast-free detection of myocardial fibrosis in hypertrophic cardiomyopathy patients with diffusion-weighted cardiovascular magnetic resonance. J. Cardiovasc. Magn. Reson. 2015, 17, 107. [Google Scholar] [CrossRef] [PubMed]
- Ferreira, P.F.; Kilner, P.J.; McGill, L.-A.; Nielles-Vallespin, S.; Scott, A.D.; Ho, S.Y.; McCarthy, K.P.; Haba, M.M.; Ismail, T.F.; Gatehouse, P.D. In vivo cardiovascular magnetic resonance diffusion tensor imaging shows evidence of abnormal myocardial laminar orientations and mobility in hypertrophic cardiomyopathy. J. Cardiovasc. Magn. Reson. 2014, 16, 87. [Google Scholar] [CrossRef]
- Tseng, W.Y.I.; Dou, J.; Reese, T.G.; Wedeen, V.J. Imaging myocardial fiber disarray and intramural strain hypokinesis in hypertrophic cardiomyopathy with MRI. J. Magn. Reson. Imaging 2006, 23, 1–8. [Google Scholar] [CrossRef]
- Coenen, A.; Rossi, A.; Lubbers, M.M.; Kurata, A.; Kono, A.K.; Chelu, R.G.; Segreto, S.; Dijkshoorn, M.L.; Wragg, A.; van Geuns, R.-J.M. Integrating CT myocardial perfusion and CT-FFR in the work-up of coronary artery disease. JACC 2017, 10, 760–770. [Google Scholar] [CrossRef]
- Al-Mallah, M.H.; Ahmed, A.M. Controversies in the Use of Fractional Flow Reserve Form Computed Tomography (FFR CT) vs. Coronary Angiography. Curr. Cardiovasc. Imaging Rep. 2016, 9, 34. [Google Scholar] [CrossRef]
- Scully, P.R.; Bastarrika, G.; Moon, J.C.; Treibel, T.A. Myocardial Extracellular Volume Quantification by Cardiovascular Magnetic Resonance and Computed Tomography. Curr. Cardiol. Rep. 2018, 20, 15. [Google Scholar] [CrossRef]
- Stenner, P.; Schmidt, B.; Allmendinger, T.; Flohr, T.; Kachelrie, M. Dynamic iterative beam hardening correction (DIBHC) in myocardial perfusion imaging using contrast-enhanced computed tomography. Investig. Radiol. 2010, 45, 314–323. [Google Scholar] [CrossRef]
- Stenner, P.; Schmidt, B.; Bruder, H.; Allmendinger, T.; Haberland, U.; Flohr, T.; Kachelrieß, M. Partial scan artifact reduction (PSAR) for the assessment of cardiac perfusion in dynamic phase-correlated CT. Med. Phys. 2009, 36, 5683–5694. [Google Scholar] [CrossRef]
- Kitagawa, K.; George, R.T.; Arbab-Zadeh, A.; Lima, J.A.; Lardo, A.C. Characterization and correction of beam-hardening artifacts during dynamic volume CT assessment of myocardial perfusion. Radiology 2010, 256, 111–118. [Google Scholar] [CrossRef] [PubMed]
- Van der Molen, A.J.; Reimer, P.; Dekkers, I.A.; Bongartz, G.; Bellin, M.-F.; Bertolotto, M.; Clement, O.; Heinz-Peer, G.; Stacul, F.; Webb, J.A. Post-contrast acute kidney injury–part 1: Definition, clinical features, incidence, role of contrast medium and risk factors. Eur. Radiol. 2018, 28, 2845–2855. [Google Scholar] [CrossRef]
- Cremer, P.; Hachamovitch, R.; Tamarappoo, B. Clinical decision making with myocardial perfusion imaging in patients with known or suspected coronary artery disease. Semin. Nucl. Med. 2014, 44, 320–329. [Google Scholar]
- Dilsizian, V.; Gewirtz, H.; Marwick, T.H.; Kwong, R.Y.; Raggi, P.; Al-Mallah, M.H.; Herzog, C.A. Cardiac Imaging for Coronary Heart Disease Risk Stratification in Chronic Kidney Disease. JACC 2020. [Google Scholar] [CrossRef]
- Dilsizian, V.; Bacharach, S.L.; Beanlands, R.S.; Bergmann, S.R.; Delbeke, D.; Dorbala, S.; Gropler, R.J.; Knuuti, J.; Schelbert, H.R.; Travin, M.I. ASNC imaging guidelines/SNMMI procedure standard for positron emission tomography (PET) nuclear cardiology procedures. J. Nucl. Cardiol. 2016, 23, 1187–1226. [Google Scholar] [CrossRef]
- Dewey, M.; Siebes, M.; Kachelrieß, M.; Kofoed, K.F.; Maurovich-Horvat, P.; Nikolaou, K.; Bai, W.; Kofler, A.; Manka, R.; Kozerke, S. Clinical quantitative cardiac imaging for the assessment of myocardial ischaemia. Nat. Rev. Cardiol. 2020, 17, 427–450. [Google Scholar] [CrossRef]
- Grenier, N.; Merville, P.; Combe, C. Radiologic imaging of the renal parenchyma structure and function. Nat. Rev. Nephrol. 2016, 12, 348–359. [Google Scholar] [CrossRef]
- Faubel, S.; Patel, N.U.; Lockhart, M.E.; Cadnapaphornchai, M.A. Renal relevant radiology: Use of ultrasonography in patients with AKI. Clin. J. Am. Soc. Nephrol. 2014, 9, 382–394. [Google Scholar] [CrossRef]
- Hull, T.D.; Agarwal, A.; Hoyt, K. New Ultrasound Techniques Promise Further Advances in AKI and CKD. J. Am. Soc. Nephrol. 2017, 28, 3452–3460. [Google Scholar] [CrossRef]
- Mahoney, M.; Sorace, A.; Warram, J.; Samuel, S.; Hoyt, K. Volumetric Contrast-Enhanced Ultrasound Imaging of Renal Perfusion. J. Ultrasound Med. 2014, 33, 1427–1437. [Google Scholar] [CrossRef]
- US Food and Drug Administration. Qualification of Biomarker—Total Kidney Volume in Studies for Treatment of Autosomal Dominant Polycystic Kidney Disease. 2015. Available online: https://www.fda.gov/media/93105/download (accessed on 1 July 2021).
- Bane, O.; Mendichovszky, I.A.; Milani, B.; Dekkers, I.A.; Deux, J.-F.; Eckerbom, P.; Grenier, N.; Hall, M.E.; Inoue, T.; Laustsen, C. Consensus-based technical recommendations for clinical translation of renal BOLD MRI. Magn. Reson. Mater. Phys. Biol. Med. 2020, 33, 199–215. [Google Scholar] [CrossRef]
- Semple, S.I.; Dekkers, I.A.; de Boer, A.; Sharma, K.; Cox, E.F.; Lamb, H.J.; Buckley, D.L.; Bane, O.; Morris, D.M.; Prasad, P.V. Consensus-based technical recommendations for clinical translation of renal T1 and T2 mapping MRI. Magn. Reson. Mater. Phys. Biol. Med. 2020, 33, 163–176. [Google Scholar]
- Ljimani, A.; Caroli, A.; Laustsen, C.; Francis, S.; Mendichovszky, I.A.; Bane, O.; Nery, F.; Sharma, K.; Pohlmann, A.; Dekkers, I.A. Consensus-based technical recommendations for clinical translation of renal diffusion-weighted MRI. Magn. Reson. Mater. Phys. Biol. Med. 2020, 33, 177–195. [Google Scholar] [CrossRef] [PubMed]
- Mendichovszky, I.; Pullens, P.; Dekkers, I.; Nery, F.; Bane, O.; Pohlmann, A.; de Boer, A.; Ljimani, A.; Odudu, A.; Buchanan, C. Technical recommendations for clinical translation of renal MRI: A consensus project of the Cooperation in Science and Technology Action PARENCHIMA. Magn. Reson. Mater. Phys. Biol. Med. 2020, 33, 131–140. [Google Scholar] [CrossRef]
- De Boer, A.; Villa, G.; Bane, O.; Bock, M.; Cox, E.F.; Dekkers, I.A.; Eckerbom, P.; Fernández-Seara, M.A.; Francis, S.T.; Haddock, B. Consensus-based technical recommendations for clinical translation of renal phase contrast MRI. J. Magn. Reson. Imaging 2020. [Google Scholar] [CrossRef]
- Adams, L.C.; Bressem, K.K.; Scheibl, S.; Nunninger, M.; Gentsch, A.; Fahlenkamp, U.L.; Eckardt, K.U.; Hamm, B.; Makowski, M.R. Multiparametric Assessment of Changes in Renal Tissue after Kidney Transplantation with Quantitative MR Relaxometry and Diffusion-Tensor Imaging at 3 T. J. Clin. Med. 2020, 9, 1551. [Google Scholar] [CrossRef]
- De Boer, A.; Harteveld, A.A.; Stemkens, B.; Blankestijn, P.J.; Bos, C.; Franklin, S.L.; Froeling, M.; Joles, J.A.; Verhaar, M.C.; van den Berg, N.; et al. Multiparametric Renal MRI: An Intrasubject Test–Retest Repeatability Study. J. Magn. Reson. Imaging 2021, 53, 859–873. [Google Scholar] [CrossRef] [PubMed]
- Haase, V.H. Mechanisms of hypoxia responses in renal tissue. J. Am. Soc. Nephrol. 2013, 24, 537–541. [Google Scholar] [CrossRef] [PubMed]
- Pohlmann, A.; Arakelyan, K.; Hentschel, J.; Cantow, K.; Flemming, B.; Ladwig, M.; Waiczies, S.; Seeliger, E.; Niendorf, T. Detailing the relation between renal T2* and renal tissue pO2 using an integrated approach of parametric magnetic resonance imaging and invasive physiological measurements. Investig. Radiol. 2014, 49, 547–560. [Google Scholar] [CrossRef] [PubMed]
- Detre, J.A.; Rao, H.; Wang, D.J.; Chen, Y.F.; Wang, Z. Applications of arterial spin labeled MRI in the brain. J. Magn. Reson. Imaging 2012, 35, 1026–1037. [Google Scholar] [CrossRef] [PubMed]
- Ritt, M.; Janka, R.; Schneider, M.P.; Martirosian, P.; Hornegger, J.; Bautz, W.; Uder, M.; Schmieder, R.E. Measurement of kidney perfusion by magnetic resonance imaging: Comparison of MRI with arterial spin labeling to para-aminohippuric acid plasma clearance in male subjects with metabolic syndrome. Nephrol. Dial. Transplant. 2010, 25, 1126–1133. [Google Scholar] [CrossRef]
- Michaely, H.J.; Schoenberg, S.O.; Ittrich, C.; Dikow, R.; Bock, M.; Guenther, M. Renal disease: Value of functional magnetic resonance imaging with flow and perfusion measurements. Investig. Radiol. 2004, 39, 698–705. [Google Scholar] [CrossRef]
- Getzin, T.; May, M.; Schmidbauer, M.; Gutberlet, M.; Martirosian, P.; Oertel, R.; Wacker, F.; Schindler, C.; Hueper, K. Usability of Functional MRI in Clinical Studies for Fast and Reliable Assessment of Renal Perfusion and Quantification of Hemodynamic Effects on the Kidney. J. Clin. Pharm. 2018, 58, 466–473. [Google Scholar] [CrossRef]
- Jiang, K.; Ferguson, C.M.; Lerman, L.O. Noninvasive assessment of renal fibrosis by magnetic resonance imaging and ultrasound techniques. Transl Res. 2019, 209, 105–120. [Google Scholar] [CrossRef]
- Hueper, K.; Peperhove, M.; Rong, S.; Gerstenberg, J.; Mengel, M.; Meier, M.; Gutberlet, M.; Tewes, S.; Barrmeyer, A.; Chen, R. T1-mapping for assessment of ischemia-induced acute kidney injury and prediction of chronic kidney disease in mice. Eur. Radiol. 2014, 24, 2252–2260. [Google Scholar] [CrossRef]
- Hueper, K.; Hensen, B.; Gutberlet, M.; Chen, R.; Hartung, D.; Barrmeyer, A.; Meier, M.; Li, W.; Jang, M.-S.; Mengel, M. Kidney transplantation: Multiparametric functional magnetic resonance imaging for assessment of renal allograft pathophysiology in mice. Investig. Radiol. 2016, 51, 58–65. [Google Scholar] [CrossRef] [PubMed]
- Tewes, S.; Gueler, F.; Chen, R.; Gutberlet, M.; Jang, M.-S.; Meier, M.; Mengel, M.; Hartung, D.; Wacker, F.; Rong, S. Functional MRI for characterization of renal perfusion impairment and edema formation due to acute kidney injury in different mouse strains. PLoS ONE 2017, 12, e0173248. [Google Scholar] [CrossRef] [PubMed]
- Dekkers, I.A.; Paiman, E.H.M.; de Vries, A.P.J.; Lamb, H.J. Reproducibility of native T1 mapping for renal tissue characterization at 3T. J. Magn. Reson. Imaging 2019, 49, 588–596. [Google Scholar] [CrossRef] [PubMed]
- Chen, C.; Lee, J.; Johnson, A.E.; Mark, R.G.; Celi, L.A.; Danziger, J.J.K.i.r. Right ventricular function, peripheral edema, and acute kidney injury in critical illness. Kidney Int. Rep. 2017, 2, 1059–1065. [Google Scholar] [CrossRef]
- Saremi, F. Cardiac MR Imaging in Acute Coronary Syndrome: Application and Image Interpretation. Radiology 2017, 282, 17–32. [Google Scholar] [CrossRef]
- Blissett, S.; Chocron, Y.; Kovacina, B.; Afilalo, J. Diagnostic and prognostic value of cardiac magnetic resonance in acute myocarditis: A systematic review and meta-analysis. Int. J. Cardiovasc. Imaging 2019, 35, 2221–2229. [Google Scholar] [CrossRef]
- Reinstadler, S.J.; Kronbichler, A.; Reindl, M.; Feistritzer, H.-J.; Innerhofer, V.; Mayr, A.; Klug, G.; Tiefenthaler, M.; Mayer, G.; Metzler, B. Acute kidney injury is associated with microvascular myocardial damage following myocardial infarction. Kidney Int. 2017, 92, 743–750. [Google Scholar] [CrossRef]
- Bossard, G.; Bourgoin, P.; Corbeau, J.; Huntzinger, J.; Beydon, L. Early detection of postoperative acute kidney injury by Doppler renal resistive index in cardiac surgery with cardiopulmonary bypass. Br. J. Anaesth. 2011, 107, 891–898. [Google Scholar] [CrossRef] [PubMed]
- Lerolle, N.; Guérot, E.; Faisy, C.; Bornstain, C.; Diehl, J.L.; Fagon, J.Y. Renal failure in septic shock: Predictive value of Doppler-based renal arterial resistive index. Intensive Care Med. 2006, 32, 1553–1559. [Google Scholar] [CrossRef]
- Schnell, D.; Deruddre, S.; Harrois, A.; Pottecher, J.; Cosson, C.; Adoui, N.; Benhamou, D.; Vicaut, E.; Azoulay, E.; Duranteau, J. Renal resistive index better predicts the occurrence of acute kidney injury than cystatin C. Shock 2012, 38, 592–597. [Google Scholar] [CrossRef]
- Tang, W.W.; Kitai, T. Intrarenal venous flow: A window into the congestive kidney failure phenotype of heart failure? JACC 2016, 4, 683–686. [Google Scholar]
- Jeong, S.H.; Jung, D.C.; Kim, S.H.; Kim, S.H. Renal venous doppler ultrasonography in normal subjects and patients with diabetic nephropathy: Value of venous impedance index measurements. J. Clin. Ultrasound 2011, 39, 512–518. [Google Scholar] [CrossRef]
- Beaubien-Souligny, W.; Benkreira, A.; Robillard, P.; Bouabdallaoui, N.; Chassé, M.; Desjardins, G.; Lamarche, Y.; White, M.; Bouchard, J.; Denault, A.J. Alterations in portal vein flow and intrarenal venous flow are associated with acute kidney injury after cardiac surgery: A prospective observational cohort study. J. Am. Heart Assoc. 2018, 7, e009961. [Google Scholar] [CrossRef] [PubMed]
- Nijst, P.; Martens, P.; Dupont, M.; Tang, W.W.; Mullens, W. Intrarenal flow alterations during transition from euvolemia to intravascular volume expansion in heart failure patients. JACC 2017, 5, 672–681. [Google Scholar] [CrossRef]
- Iida, N.; Seo, Y.; Sai, S.; Machino-Ohtsuka, T.; Yamamoto, M.; Ishizu, T.; Kawakami, Y.; Aonuma, K. Clinical implications of intrarenal hemodynamic evaluation by Doppler ultrasonography in heart failure. JACC 2016, 4, 674–682. [Google Scholar] [CrossRef] [PubMed]
- De la Espriella-Juan, R.; Nunez, E.; Minana, G.; Sanchis, J.; Bayes-Genis, A.; Gonzalez, J.; Chorro, J.; Nunez, J. Intrarenal venous flow in cardiorenal syndrome: A shining light into the darkness. ESC Heart Fail. 2018, 5, 1173–1175. [Google Scholar] [CrossRef] [PubMed]
- Cakal, B.; Ozcan, O.U.; Omaygenc, M.O.; Karaca, I.O.; Kizilirmak, F.; Gunes, H.M.; Boztosun, B. Value of Renal Vascular Doppler Sonography in Cardiorenal Syndrome Type 1. J. Ultrasound Med. 2020. [Google Scholar] [CrossRef]
- Singh, P.; Ricksten, S.E.; Bragadottir, G.; Redfors, B.; Nordquist, L. Renal oxygenation and haemodynamics in acute kidney injury and chronic kidney disease. Clin. Exp. Pharm. Physiol. 2013, 40, 138–147. [Google Scholar] [CrossRef] [PubMed]
- Neugarten, J. Renal BOLD-MRI and assessment for renal hypoxia. Kidney Int. 2012, 81, 613–614. [Google Scholar] [CrossRef] [PubMed]
- Zhou, H.Y.; Chen, T.W.; Zhang, X.M. Functional Magnetic Resonance Imaging in Acute Kidney Injury: Present Status. Biomed. Res. Int. 2016, 2016, 2027370. [Google Scholar] [CrossRef] [PubMed]
- Dong, J.; Yang, L.; Su, T.; Yang, X.; Chen, B.; Zhang, J.; Wang, X.; Jiang, X. Quantitative assessment of acute kidney injury by noninvasive arterial spin labeling perfusion MRI: A pilot study. Sci. China Life. Sci. 2013, 56, 745–750. [Google Scholar] [CrossRef]
- Zimmer, F.; Zöllner, F.G.; Hoeger, S.; Klotz, S.; Tsagogiorgas, C.; Krämer, B.K.; Schad, L.R. Quantitative renal perfusion measurements in a rat model of acute kidney injury at 3T: Testing inter-and intramethodical significance of ASL and DCE-MRI. PLoS ONE 2013, 8, e53849. [Google Scholar] [CrossRef]
- Chen, W.B.; Liang, L.; Zhang, B.; Liu, C.L.; Liu, H.J.; Luo, H.Y.; Zeng, Q.X.; Liang, C.H.; Liu, G.S.; Zhang, S.X. To evaluate the damage of renal function in CIAKI rats at 3T: Using ASL and BOLD MRI. BioMed. Res. Int. 2015, 2015. [Google Scholar] [CrossRef] [PubMed]
- Peperhove, M.; Jang, M.-S.; Gutberlet, M.; Hartung, D.; Tewes, S.; Warnecke, G.; Fegbeutel, C.; Haverich, A.; Gwinner, W.; Lehner, F.; et al. Assessment of acute kidney injury with T1 mapping MRI following solid organ transplantation. Eur. Radiol. 2018, 28, 44–50. [Google Scholar] [CrossRef]
- Turakhia, M.P.; Blankestijn, P.J.; Carrero, J.-J.; Clase, C.M.; Deo, R.; Herzog, C.A.; Kasner, S.E.; Passman, R.S.; Pecoits-Filho, R.; Reinecke, H.J.E.h.j. Chronic kidney disease and arrhythmias: Conclusions from a kidney disease: Improving global outcomes (KDIGO) controversies conference. Eur. Heart J. 2018, 39, 2314–2325. [Google Scholar] [CrossRef]
- Gansevoort, R.T.; Correa-Rotter, R.; Hemmelgarn, B.R.; Jafar, T.H.; Heerspink, H.J.; Mann, J.F.; Matsushita, K.; Wen, C.P. Chronic kidney disease and cardiovascular risk: Epidemiology, mechanisms, and prevention. Lancet 2013, 382, 339–352. [Google Scholar] [CrossRef]
- Stewart, G.A.; Foster, J.; Cowan, M.; Rooney, E.; Mcdonagh, T.; Dargie, H.J.; Rodger, R.S.C.; Jardine, A.G. Echocardiography overestimates left ventricular mass in hemodialysis patients relative to magnetic resonance imaging. Kidney Int. 1999, 56, 2248–2253. [Google Scholar] [CrossRef]
- Patel, R.K.; Mark, P.B.; Johnston, N.; McGregor, E.; Dargie, H.J.; Jardine, A.G. Renal transplantation is not associated with regression of left ventricular hypertrophy: A magnetic resonance study. Clin. J. Am. Soc. Nephrol. 2008, 3, 1807–1811. [Google Scholar] [CrossRef]
- Panoulas, V.F.; Sulemane, S.; Konstantinou, K.; Bratsas, A.; Elliott, S.J.; Dawson, D.; Frankel, A.H.; Nihoyannopoulos, P. Early detection of subclinical left ventricular myocardial dysfunction in patients with chronic kidney disease. Eur. Heart J. Cardiovasc. Imaging 2015, 16, 539–548. [Google Scholar] [CrossRef] [PubMed]
- Smiseth, O.A.; Torp, H.; Opdahl, A.; Haugaa, K.H.; Urheim, S. Myocardial strain imaging: How useful is it in clinical decision making? Eur. Heart J. 2015, 37, 1196–1207. [Google Scholar] [CrossRef] [PubMed]
- Tops, L.F.; Delgado, V.; Marsan, N.A.; Bax, J.J. Myocardial strain to detect subtle left ventricular systolic dysfunction. Eur. J. Heart Fail. 2017, 19, 307–313. [Google Scholar] [CrossRef] [PubMed]
- Hensen, L.C.R.; Goossens, K.; Delgado, V.; Rotmans, J.I.; Jukema, J.W.; Bax, J.J. Prognostic Implications of Left Ventricular Global Longitudinal Strain in Predialysis and Dialysis Patients. Am. J. Cardiol. 2017, 120, 500–504. [Google Scholar] [CrossRef] [PubMed]
- Liu, Y.W.; Su, C.T.; Huang, Y.Y.; Yang, C.S.; Huang, J.W.; Yang, M.T.; Chen, J.H.; Tsai, W.C. Left ventricular systolic strain in chronic kidney disease and hemodialysis patients. Am. J. Nephrol. 2011, 33, 84–90. [Google Scholar] [CrossRef] [PubMed]
- Wang, H.; Liu, J.; Yao, X.D.; Li, J.; Yang, Y.; Cao, T.S.; Yang, B. Multidirectional myocardial systolic function in hemodialysis patients with preserved left ventricular ejection fraction and different left ventricular geometry. Nephrol. Dial. Transplant. 2012, 27, 4422–4429. [Google Scholar] [CrossRef]
- Pirat, B.; Bozbas, H.; Simsek, V.; Sade, L.E.; Sayin, B.; Muderrisoglu, H.; Haberal, M. Assessment of Myocardial Mechanics in Patients with End-Stage Renal Disease and Renal Transplant Recipients Using Speckle Tracking Echocardiography. Exp. Clin. Transplant. 2015, 13, 235–241. [Google Scholar] [CrossRef]
- Yan, P.; Li, H.; Hao, C.; Shi, H.; Gu, Y.; Huang, G.; Chen, J. 2D-speckle tracking echocardiography contributes to early identification of impaired left ventricular myocardial function in patients with chronic kidney disease. Nephron Clin. Pract. 2011, 118, c232–c240. [Google Scholar] [CrossRef] [PubMed]
- Nagueh, S.F.; Smiseth, O.A.; Appleton, C.P.; Byrd, B.F.; Dokainish, H.; Edvardsen, T.; Flachskampf, F.A.; Gillebert, T.C.; Klein, A.L.; Lancellotti, P. Recommendations for the evaluation of left ventricular diastolic function by echocardiography: An update from the American Society of Echocardiography and the European Association of Cardiovascular Imaging. Eur. J. Echocardiogr. 2016, 17, 1321–1360. [Google Scholar]
- Lin, L.; Xie, Q.; Zheng, M.; Zhou, X.; Dekkers, I.A.; Tao, Q.; Lamb, H.J. Identification of cardiovascular abnormalities by multiparametric magnetic resonance imaging in end-stage renal disease patients with preserved left ventricular ejection fraction. Eur. Radiol. 2021. [Google Scholar] [CrossRef]
- Mall, G.; Huther, W.; Schneider, J.; Lundin, P.; Ritz, E. Diffuse intermyocardiocytic fibrosis in uraemic patients. Nephrol. Dial. Transplant. 1990, 5, 39–44. [Google Scholar] [CrossRef] [PubMed]
- Edwards, N.C.; Moody, W.E.; Yuan, M.; Hayer, M.K.; Ferro, C.J.; Townend, J.N.; Steeds, R.P. Diffuse interstitial fibrosis and myocardial dysfunction in early chronic kidney disease. Am. J. Cardiol. 2015, 115, 1311–1317. [Google Scholar] [CrossRef] [PubMed]
- Graham-Brown, M.P.; March, D.S.; Churchward, D.R.; Stensel, D.J.; Singh, A.; Arnold, R.; Burton, J.O.; McCann, G.P. Novel cardiac nuclear magnetic resonance method for noninvasive assessment of myocardial fibrosis in hemodialysis patients. Kidney Int. 2016, 90, 835–844. [Google Scholar] [CrossRef] [PubMed]
- Rutherford, E.; Talle, M.A.; Mangion, K.; Bell, E.; Rauhalammi, S.M.; Roditi, G.; McComb, C.; Radjenovic, A.; Welsh, P.; Woodward, R.; et al. Defining myocardial tissue abnormalities in end-stage renal failure with cardiac magnetic resonance imaging using native T1 mapping. Kidney Int. 2016, 90, 845–852. [Google Scholar] [CrossRef]
- Mangion, K.; McDowell, K.; Mark, P.B.; Rutherford, E. Characterizing Cardiac Involvement in Chronic Kidney Disease Using CMR-a Systematic Review. Curr Cardiovasc. Imaging Rep. 2018, 11, 2. [Google Scholar] [CrossRef]
- Wang, L.; Yuan, J.; Zhang, S.J.; Gao, M.; Wang, Y.C.; Wang, Y.X.; Ju, S. Myocardial T1 rho mapping of patients with end-stage renal disease and its comparison with T1 mapping and T2 mapping: A feasibility and reproducibility study. J. Magn. Reson. Imaging 2016, 44, 723–731. [Google Scholar] [CrossRef] [PubMed]
- Odudu, A.; Eldehni, M.T.; McCann, G.P.; Horsfield, M.A.; Breidthardt, T.; McIntyre, C.W. Characterisation of cardiomyopathy by cardiac and aortic magnetic resonance in patients new to hemodialysis. Eur. Radiol. 2016, 26, 2749–2761. [Google Scholar] [CrossRef] [PubMed]
- Schietinger, B.J.; Brammer, G.M.; Wang, H.; Christopher, J.M.; Kwon, K.W.; Mangrum, A.J.; Mangrum, J.M.; Kramer, C.M. Patterns of late gadolinium enhancement in chronic hemodialysis patients. JACC 2008, 1, 450–456. [Google Scholar] [CrossRef]
- Widjaja, E.; Oxtoby, J.; Hale, T.; Jones, P.; Harden, P.; McCall, I. Ultrasound measured renal length versus low dose CT volume in predicting single kidney glomerular filtration rate. Br. J. Radiol. 2004, 77, 759–764. [Google Scholar] [CrossRef]
- Piras, D.; Masala, M.; Delitala, A.; Urru, S.A.M.; Curreli, N.; Balaci, L.; Ferreli, L.P.; Loi, F.; Atzeni, A.; Cabiddu, G.; et al. Kidney size in relation to ageing, gender, renal function, birthweight and chronic kidney disease risk factors in a general population. Nephrol. Dial. Transplant. 2020, 35, 640–647. [Google Scholar] [CrossRef]
- Cox, E.F.; Buchanan, C.E.; Bradley, C.R.; Prestwich, B.; Mahmoud, H.; Taal, M.; Selby, N.M.; Francis, S.T. Multiparametric renal magnetic resonance imaging: Validation, interventions, and alterations in chronic kidney disease. Front. Physiol. 2017, 8, 696. [Google Scholar] [CrossRef] [PubMed]
- Zhao, J.; Wang, Z.; Liu, M.; Zhu, J.; Zhang, X.; Zhang, T.; Li, S.; Li, Y. Assessment of renal fibrosis in chronic kidney disease using diffusion-weighted MRI. Clin. Radiol. 2014, 69, 1117–1122. [Google Scholar] [CrossRef] [PubMed]
- Inoue, T.; Kozawa, E.; Okada, H.; Inukai, K.; Watanabe, S.; Kikuta, T.; Watanabe, Y.; Takenaka, T.; Katayama, S.; Tanaka, J. Noninvasive evaluation of kidney hypoxia and fibrosis using magnetic resonance imaging. J. Am. Soc. Nephrol. 2011, 22, 1429–1434. [Google Scholar] [CrossRef]
- Li, Q.; Li, J.; Zhang, L.; Chen, Y.; Zhang, M.; Yan, F. Diffusion-weighted imaging in assessing renal pathology of chronic kidney disease: A preliminary clinical study. Eur. J. Radiol. 2014, 83, 756–762. [Google Scholar] [CrossRef]
- Friedli, I.; Crowe, L.A.; de Perrot, T.; Berchtold, L.; Martin, P.Y.; de Seigneux, S.; Vallée, J.P. Comparison of readout-segmented and conventional single-shot for echo-planar diffusion-weighted imaging in the assessment of kidney interstitial fibrosis. J. Magn. Reson. Imaging 2017, 46, 1631–1640. [Google Scholar] [CrossRef]
- Gillis, K.A.; McComb, C.; Patel, R.K.; Stevens, K.K.; Schneider, M.P.; Radjenovic, A.; Morris, S.T.; Roditi, G.H.; Delles, C.; Mark, P.B. Non-contrast renal magnetic resonance imaging to assess perfusion and corticomedullary differentiation in health and chronic kidney disease. Nephron 2016, 133, 183–192. [Google Scholar] [CrossRef]
- Michaely, H.J.; Metzger, L.; Haneder, S.; Hansmann, J.; Schoenberg, S.O.; Attenberger, U. Renal BOLD-MRI does not reflect renal function in chronic kidney disease. Kidney Int. 2012, 81, 684–689. [Google Scholar] [CrossRef]
- Pruijm, M.; Milani, B.; Pivin, E.; Podhajska, A.; Vogt, B.; Stuber, M.; Burnier, M. Reduced cortical oxygenation predicts a progressive decline of renal function in patients with chronic kidney disease. Kidney Int. 2018, 93, 932–940. [Google Scholar] [CrossRef]
- Miyata, T.; De Strihou, C.V.Y. Diabetic nephropathy: A disorder of oxygen metabolism? Nat. Rev. Nephrol. 2010, 6, 83. [Google Scholar] [CrossRef] [PubMed]
- Takiyama, Y.; Haneda, M. Hypoxia in diabetic kidneys. BioMed. Res. Int. 2014, 2014, 837421. [Google Scholar] [CrossRef] [PubMed]
- Chen, X.; Xiao, W.; Li, X.; He, J.; Huang, X.; Tan, Y. In vivo evaluation of renal function using diffusion weighted imaging and diffusion tensor imaging in type 2 diabetics with normoalbuminuria versus microalbuminuria. Front. Med. 2014, 8, 471–476. [Google Scholar] [CrossRef] [PubMed]
- Razek, A.A.K.A.; Al-Adlany, M.A.A.A.; Alhadidy, A.M.; Atwa, M.A.; Abdou, N.E.A. Diffusion tensor imaging of the renal cortex in diabetic patients: Correlation with urinary and serum biomarkers. Abdom. Radiol. 2017, 42, 1493–1500. [Google Scholar] [CrossRef]
- Mora-Gutiérrez, J.M.; Garcia-Fernandez, N.; Slon Roblero, M.F.; Páramo, J.A.; Escalada, F.J.; Wang, D.J.; Benito, A.; Fernández-Seara, M.A. Arterial spin labeling MRI is able to detect early hemodynamic changes in diabetic nephropathy. J. Magn. Reson. Imaging 2017, 46, 1810–1817. [Google Scholar] [CrossRef] [PubMed]
- Prasad, P.V.; Li, L.P.; Thacker, J.M.; Li, W.; Hack, B.; Kohn, O.; Sprague, S.M. Cortical Perfusion and Tubular Function as Evaluated by Magnetic Resonance Imaging Correlates with Annual Loss in Renal Function in Moderate Chronic Kidney Disease. Am. J. Nephrol. 2019, 49, 114–124. [Google Scholar] [CrossRef] [PubMed]
- Dekkers, I.A.; Lamb, H.J. Clinical application and technical considerations of T 1 & T 2 (*) mapping in cardiac, liver, and renal imaging. Br. J. Radiol. 2018, 91, 20170825. [Google Scholar]


| Classification | Timing | Descriptions | Examples |
|---|---|---|---|
| Type 1 (acute cardiorenal) | Acute | Heart failure causing AKI | Acute decompensated heart failure resulting in AKI, acute ischemic heart disease, valvulopathy or arrhythmia causing cardiogenic shock and AKI |
| Type 2 (chronic cardiorenal) | Chronic | Chronic heart disease causing CKD | Chronic heart failure causing CKD |
| Type 3 (acute renocardiac) | Acute | AKI leading to acute cardiac dysfunction | AKI due to glomerulonephritis or urinary tract obstruction causing acute heart failure, acute coronary syndrome or arrhythmia |
| Type 4 (chronic renocardiac) | Chronic | CKD leading to chronic cardiac abnormalities | CKD-associated cardiomyopathy |
| Type 5 (secondary) | Acute or Chronic | Systemic diseases causing acute or chronic dysfunction of heat and kidneys | AKI and acute heart failure induced by sepsis or critical conditions, CKD and cardiac abnormalities in diabetes mellitus, cirrhosis, amyloidosis, vasculitis, etc. |
| Main Challenges in All Types of CRS | |
|---|---|
| |
| Specific Difficulties in Acute and Chronic CRS | |
| Acute CRS | Chronic CRS |
|
|
| Ultrasonography | Magnetic Resonance Imaging | Computed Tomography | Nuclear Imaging | |
|---|---|---|---|---|
| Assessment of Heart | ||||
| Conventional | 1. 2-dimentioanl measurement of cardiac chamber size, estimation of ventricular function 2. Valvular morphology and function, ventricular wall motion 3. Estimation of hemodynamic biomarkers by Doppler imaging | 1. Gold-standard measurement of chamber size and volume, ventricular systolic function, myocardial mass by cine imaging 2. Moderate to severe valvular abnormalities 3. Quantification of myocardial perfusion with contrast agent and/or vasodilator 4. Quantification of myocardial fibrosis and infiltration by late gadolinium enhancement | 1. Calculation of calcium score 2. Evaluation of coronary artery morphology by CT coronary angiography using contrast agent | 1. SPECT myocardial perfusion imaging is the most commonly used tool to diagnose coronary artery disease in CKD 2. Absolute quantification of myocardial blood flow by PET 3. Coronary flow reserve and stress myocardial perfusion by PET |
| Advanced | 1. 3-dimentional measurement of ventricular volumes and myocardial mass 2. Ventricular strain quantified by speckle-tracking 3. Improved structural and functional evaluation using ultrasonic enhancing agent | 1. Non-contrast quantification of myocardial infiltration/deposition by T1 mapping and T2(*) mapping 2. Myocardial infiltration/deposition by extracellular volume fraction with contrast agent 3. Ventricular strain quantified by feature/tissue tracking 4. Non-contrast assessment of myocardial perfusion by dobutamine inotropic stress CMR, MR-compatible exercise stress CMR, myocardial ASL 4. Myocardial hypoxia by BOLD, diffusion by DWI, diffusion anisotropy by DTI | 1. Functional imaging and myocardial perfusion using contrast agent 2. CT angiography-based fractional flow reserve of coronary arteries 3. Myocardial infiltration/deposition by extracellular volume fraction with contrast agent | 1. PET quantitative analysis of myocardial glucose utilization 2. SPECT evaluation of myocardial fatty acid oxidation 3.Hybrid imaging such as SPECT-CT, PET-CT, PET-MRI can generate multiple biomarkers in one scan |
| Assessment of kidneys | ||||
| Conventional | 1. Kidney length, estimated volume and echogenicity of cortex and medulla 2. Identify obstruction 3. Renal resistive index | 1. Volumetric measurement 2. Depiction of renal cortex and medulla by conventional T1-weighted and T2-weighted imaging | 1. Preferred for evaluation of kidney stones 2. Quantification of renal perfusion and GFR using contrast enhanced CT | 1. Differential diagnosis of AKI (prerenal AKI or acute tubular necrosis or postrenal AKI) by renal scintigraphy 2. Measurement of GFR 3. Measurement of renal blood flow |
| Advanced | 1. Intrarenal blood flow pattern 2.Renal venous blood flow, renal venous impedance index, renal venous discontinuity 3. Ultrasonic enhancing agent to assess renal perfusion | 1. Parenchymal oxygenation by BOLD 2. Noncontrast renal perfusion by ASL 3. Microstructural changes evaluated by DWI, DTI and T1/T2 mapping 4. Quantification of renal perfusion and GFR using dynamic contrast enhancement | 1. Dual energy CT for tissue characterization | 1. Renal SPECT-CT for assessment of GFR 2. Renal PET with novel radiotracers for faster and more accurate quantification of GFR |
| Radiation | None | None | Yes | Yes |
| Contrast agent and safety | Mirobubbles to enhance ultrasound signals; safe | Gadolinium-based contrast agents, associated with nephrogenic systemic fibrosis, not applicable in patients with AKI and ESRD | Iodinated contrast agents, increase the risk of contrast-induced nephropathy in patients with renal dysfunction | Radionuclide labeled agents, safe. |
| Strengths in assessment of cardiorenal syndrome | 1. Most versatile, accessible and cost effective modality to evaluate the heart and kidneys simultaneously. 2. Doppler imaging may generate hemodynamic biomarkers for diagnosis, prognosis and therapeutic evaluation, especially for acute CRS. 3. Suitable for serial imaging across the natural history of CRS | 1. The most promising one-stop modality to evaluate structure, function and microstructural alterations in both heart and kidneys 2. Unique ability of quantitative assessment of fibrosis in both organs. Multiparametric scan to evaluate diffused infiltration/deposition, changes in perfusion, diffusion and oxygenation of heart and kidneys. 2. With consistent scan parameters and no radiation, non-contrast MRI is ideal for longitudinal tracking of cardiac and renal pathophysiological changes | Most widely used noninvasive technique for anatomical assessment of coronary artery disease | Important modality for evaluation of myocardial perfusion in coronary artery disease in patients with CKD, without the use of toxic contrast agent. |
| Limitations | Can be compromised by inadequate acoustic window, poor Doppler signals and operator-dependent variations | Expensive, prolonged acquisition time, requiring high compliance of patient, complicated post-processing procedures | Not suitable for longitudinal serial evaluation due to radiation, limited utility without contrast agent | Not suitable for longitudinal serial evaluation due to radiation, low spatial resolution, prolonged acquisition time, limited utility and accessibility |
Publisher’s Note: MDPI stays neutral with regard to jurisdictional claims in published maps and institutional affiliations. |
© 2021 by the authors. Licensee MDPI, Basel, Switzerland. This article is an open access article distributed under the terms and conditions of the Creative Commons Attribution (CC BY) license (https://creativecommons.org/licenses/by/4.0/).
Share and Cite
Lin, L.; Zhou, X.; Dekkers, I.A.; Lamb, H.J. Cardiorenal Syndrome: Emerging Role of Medical Imaging for Clinical Diagnosis and Management. J. Pers. Med. 2021, 11, 734. https://doi.org/10.3390/jpm11080734
Lin L, Zhou X, Dekkers IA, Lamb HJ. Cardiorenal Syndrome: Emerging Role of Medical Imaging for Clinical Diagnosis and Management. Journal of Personalized Medicine. 2021; 11(8):734. https://doi.org/10.3390/jpm11080734
Chicago/Turabian StyleLin, Ling, Xuhui Zhou, Ilona A. Dekkers, and Hildo J. Lamb. 2021. "Cardiorenal Syndrome: Emerging Role of Medical Imaging for Clinical Diagnosis and Management" Journal of Personalized Medicine 11, no. 8: 734. https://doi.org/10.3390/jpm11080734
APA StyleLin, L., Zhou, X., Dekkers, I. A., & Lamb, H. J. (2021). Cardiorenal Syndrome: Emerging Role of Medical Imaging for Clinical Diagnosis and Management. Journal of Personalized Medicine, 11(8), 734. https://doi.org/10.3390/jpm11080734