
Associations of Polygenetic Variants at the 11q23 Locus and Their Interactions with Macronutrient Intake for the Risk of 3GO, a Combination of Hypertension, Hyperglycemia, and Dyslipidemia


Abstract
1. Introduction
2. Materials and Methods
2.1. Study Population
2.2. Sociodemographic Characteristics and Biochemical Measurements
2.3. 3GO Definition
2.4. Dietary Assessment and Dietary Patterns
2.5. Genotyping and Quality Control
2.6. Screening of Genetic Variants and Generation of the Haplotype for 3GO Risk
2.7. Interactions between PRS and Lifestyles on 3GO Risk
2.8. Statistical Analysis
3. Results
3.1. General Characteristics of the Participants
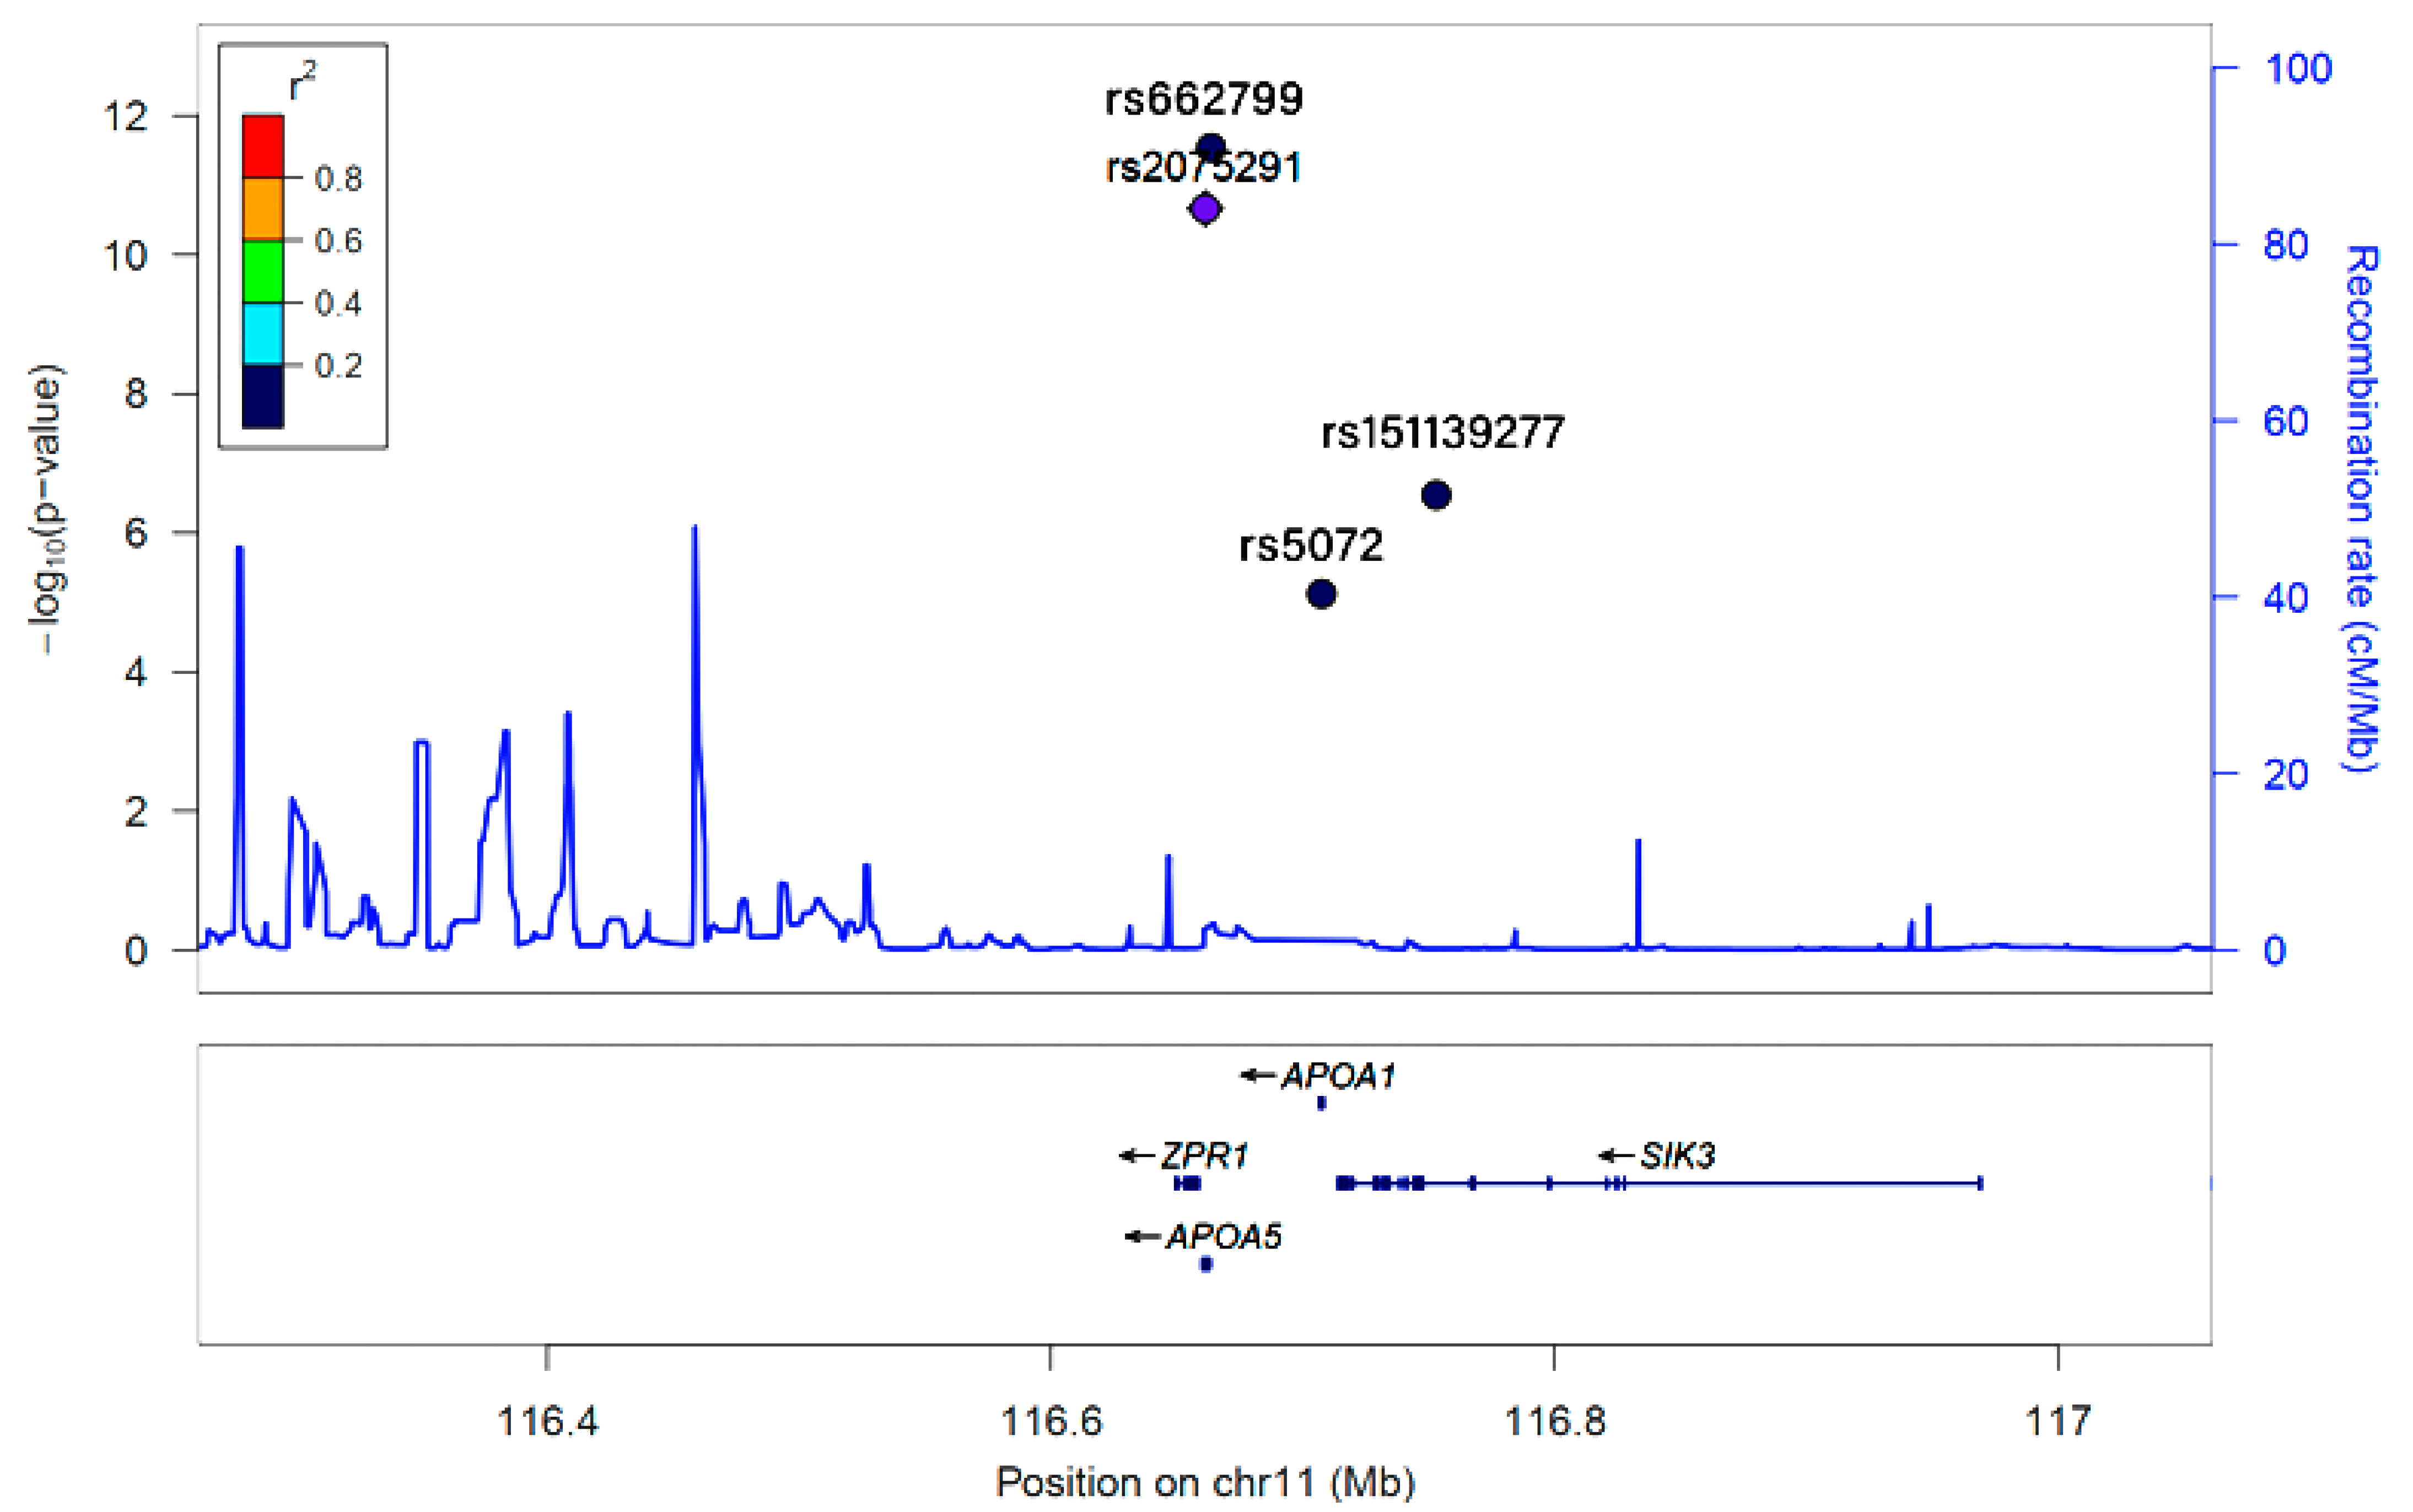
3.2. Selection of Genetic Variants
3.3. Adjusted Means of MetS and Its Components According to 3GO and Haplotype Groups
3.4. 3GO-Related Parameters and Their Influences on 3GO Risk According to Haplotype
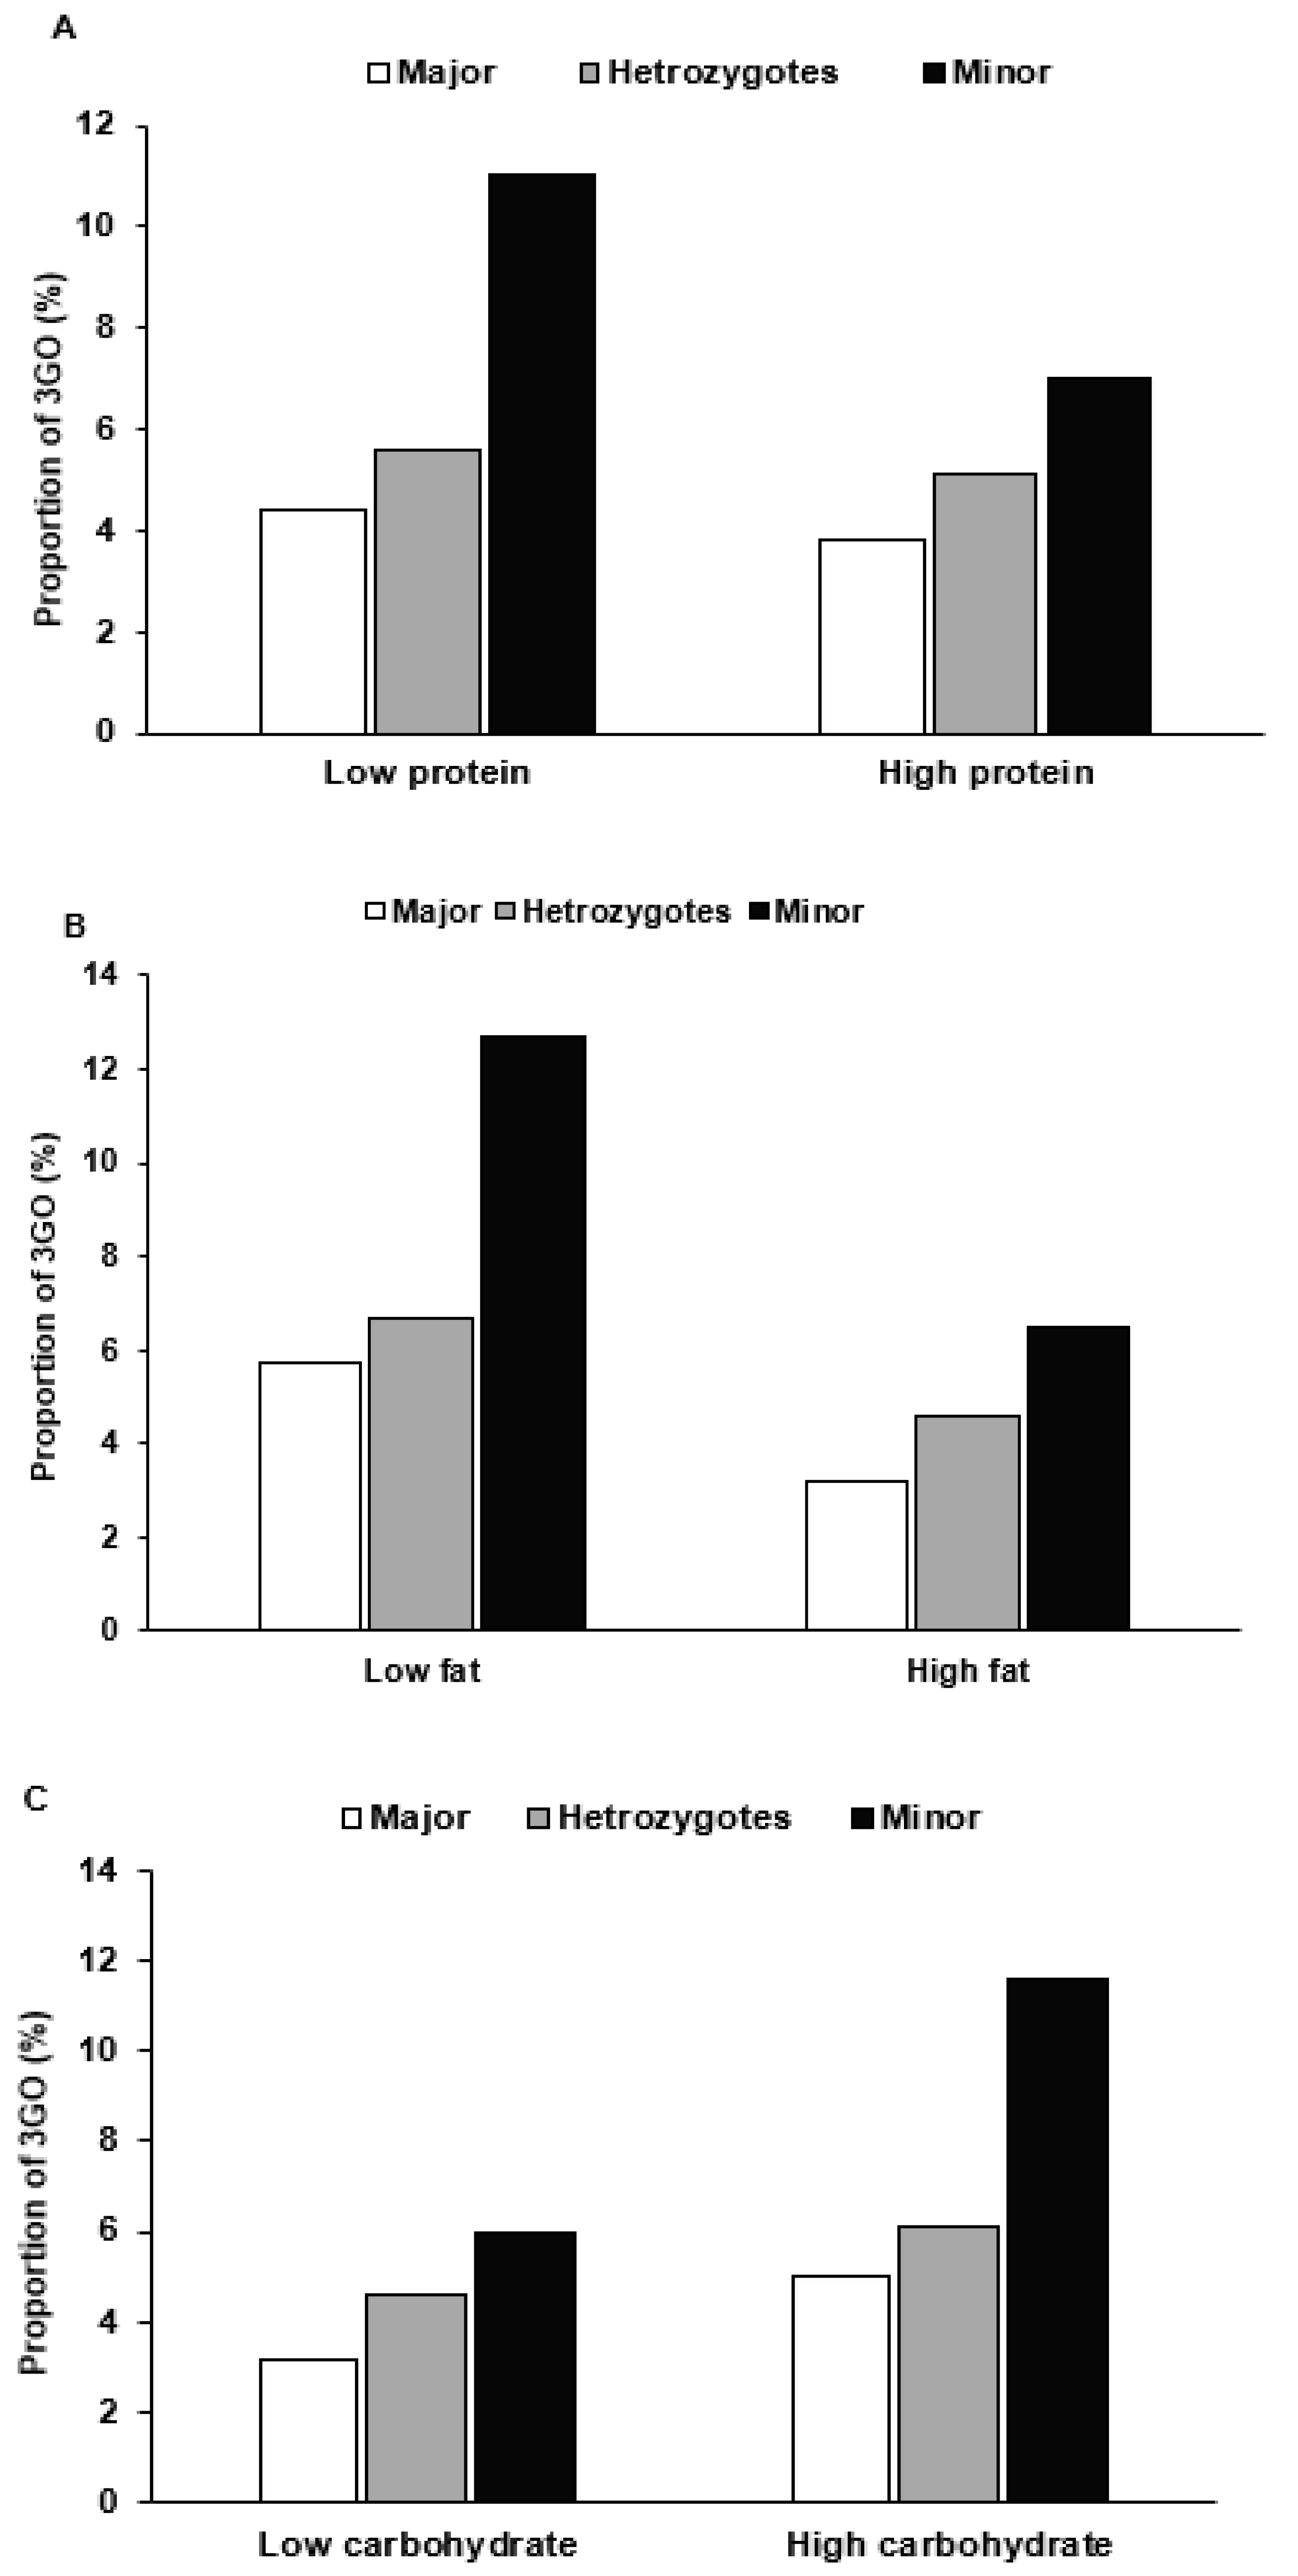
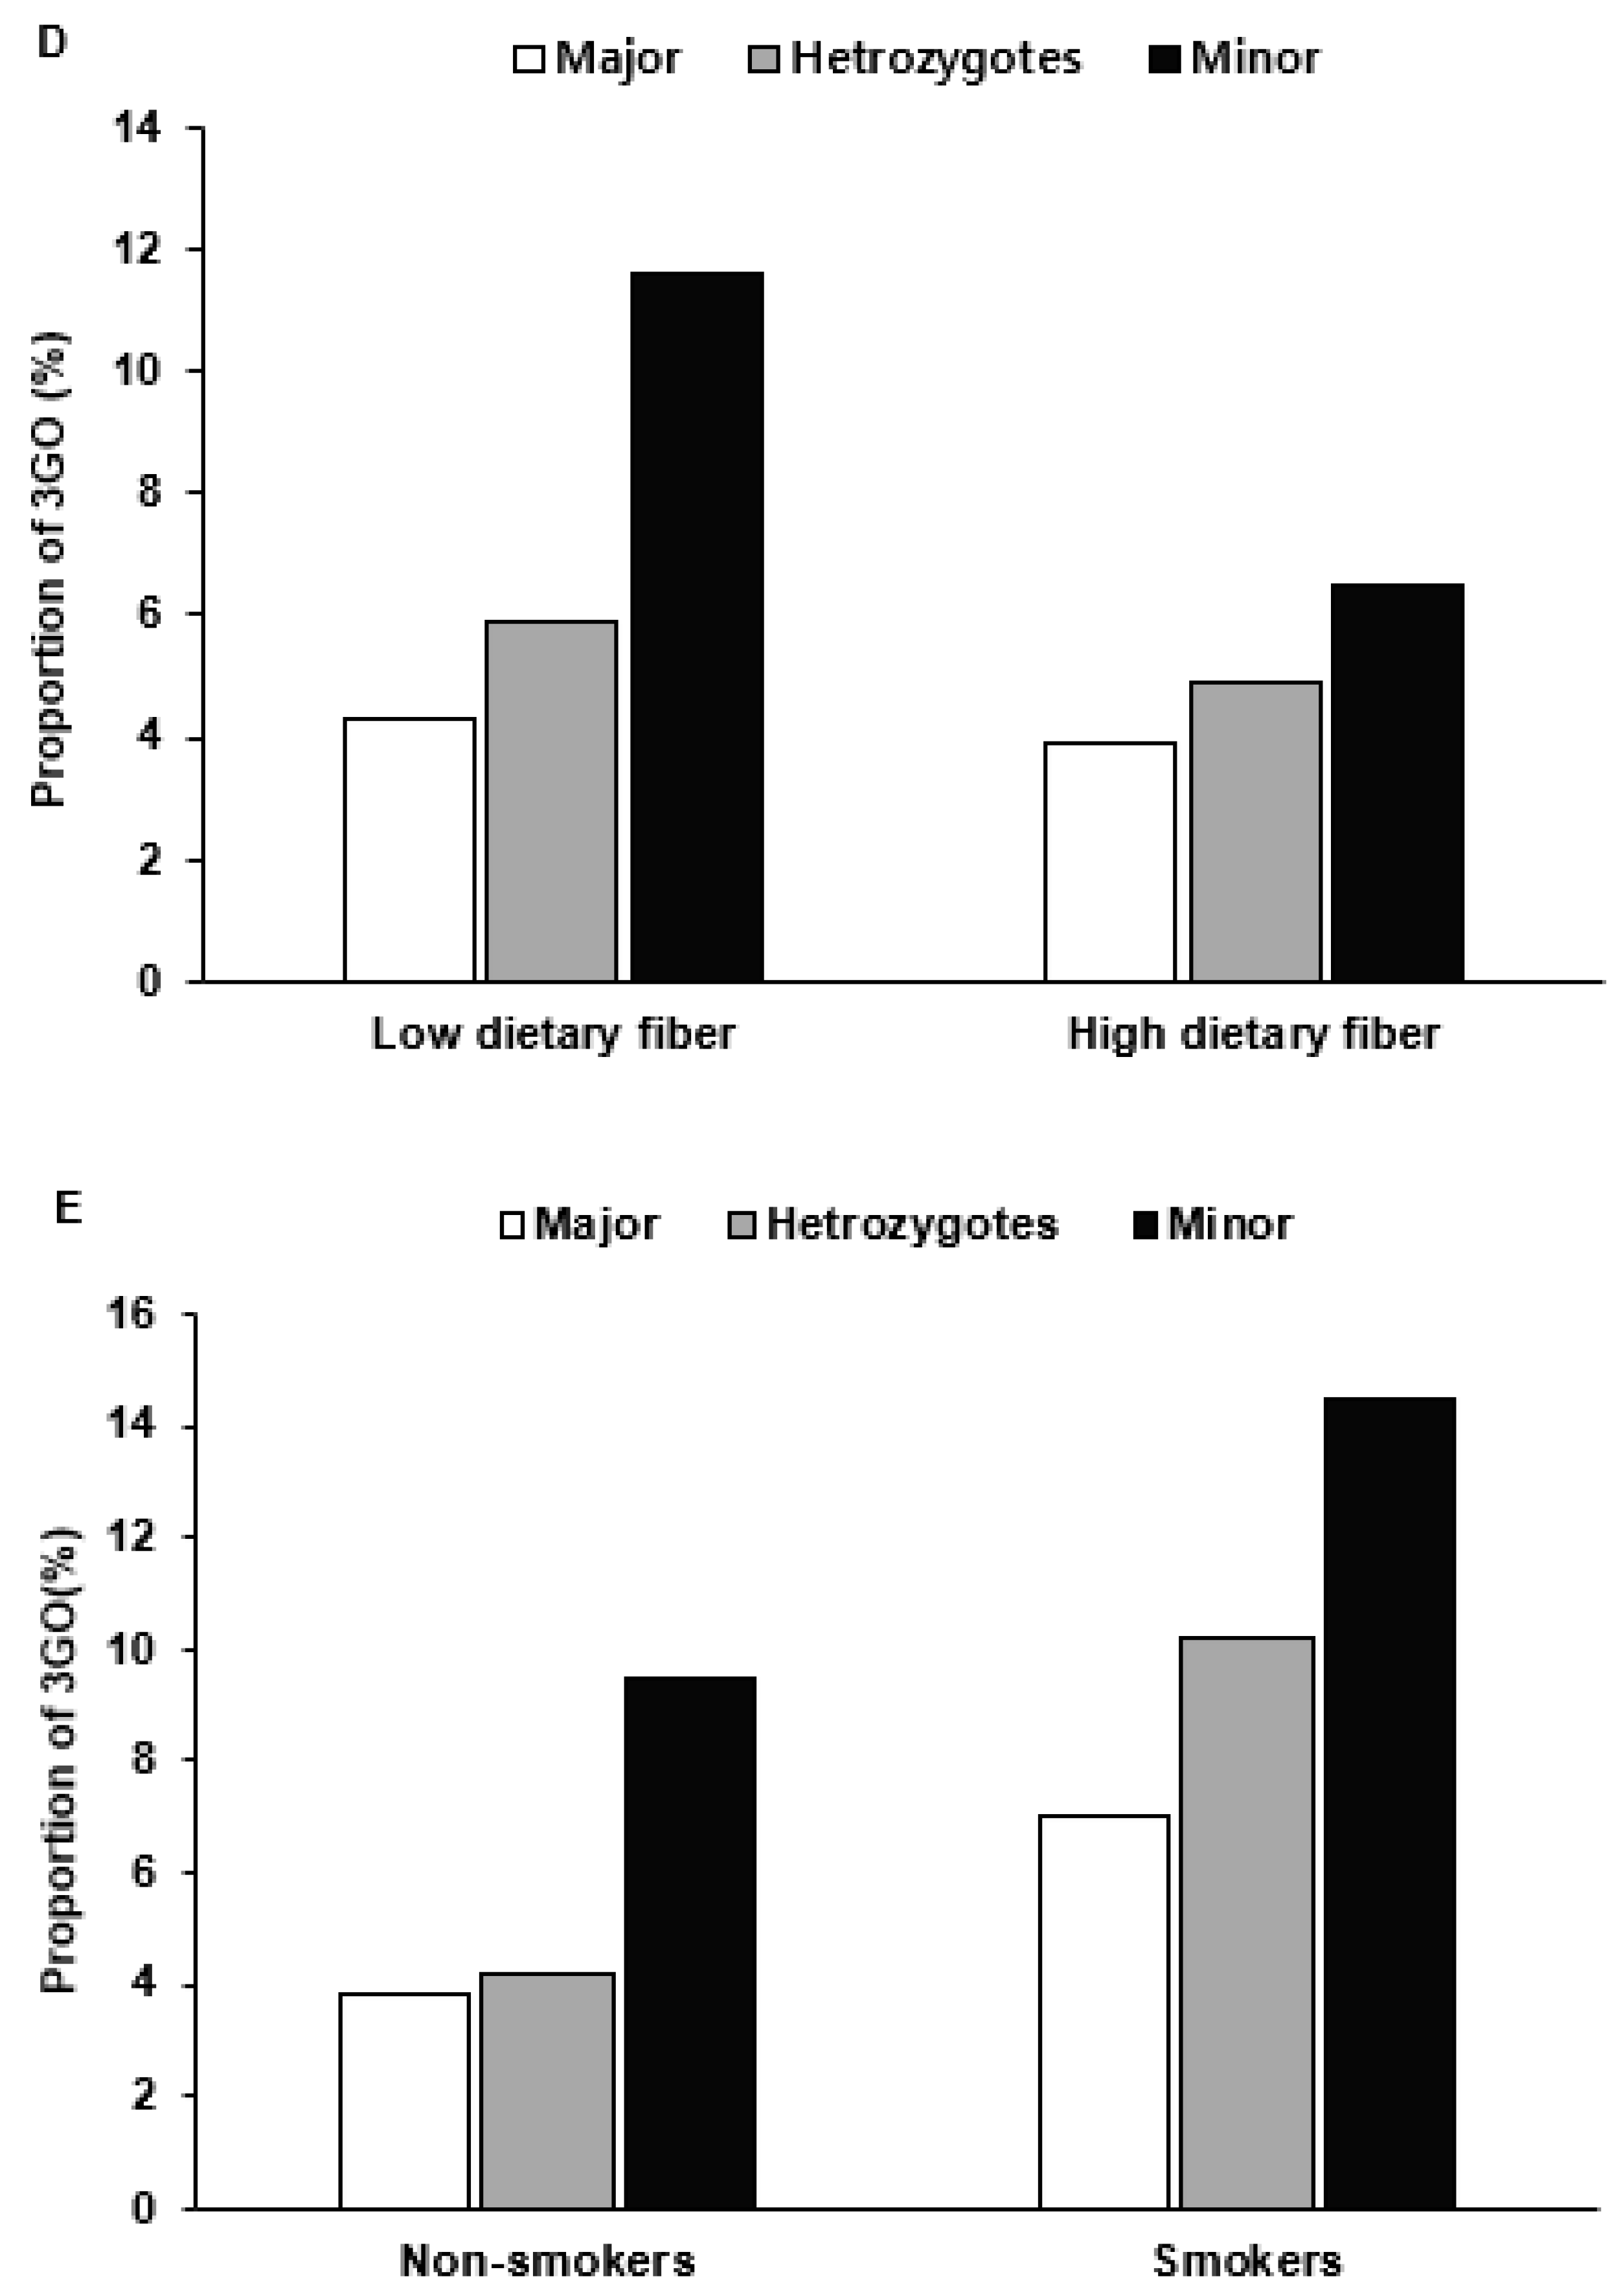
3.5. Haplotype–Environmental Interactions
4. Discussion
5. Conclusions
Author Contributions
Funding
Institutional Review Board Statement
Informed Consent Statement
Data Availability Statement
Conflicts of Interest
References
- Rochlani, Y.; Pothineni, N.V.; Kovelamudi, S.; Mehta, J.L. Metabolic syndrome: Pathophysiology, management, and modulation by natural compounds. Ther. Adv. Cardiovasc. Dis. 2017, 11, 215–225. [Google Scholar] [CrossRef]
- Tadewos, A.; Egeno, T.; Amsalu, A. Risk factors of metabolic syndrome among hypertensive patients at Hawassa University Comprehensive Specialized Hospital, Southern Ethiopia. BMC Cardiovasc. Disord. 2017, 17, 218. [Google Scholar] [CrossRef]
- Rakugi, H.; Ogihara, T. The metabolic syndrome in the Asian population. Curr. Hypertens. Rep. 2005, 7, 103–109. [Google Scholar] [CrossRef] [PubMed]
- Grundy, S.M. Metabolic syndrome update. Trends Cardiovasc. Med. 2016, 26, 364–373. [Google Scholar] [CrossRef]
- Hirano, T. Pathophysiology of Diabetic Dyslipidemia. J. Atheroscler. Thromb. 2018, 25, 771–782. [Google Scholar] [CrossRef]
- Matsuzaka, T.; Shimano, H. New perspective on type 2 diabetes, dyslipidemia and non-alcoholic fatty liver disease. J. Diab. Investig. 2020, 11, 532–534. [Google Scholar] [CrossRef]
- Lu, S.; Bao, M.-Y.; Miao, S.-M.; Zhang, X.; Jia, Q.-Q.; Jing, S.-Q.; Shan, T.; Wu, X.-H.; Liu, Y. Prevalence of hypertension, diabetes, and dyslipidemia, and their additive effects on myocardial infarction and stroke: A cross-sectional study in Nanjing, China. Ann. Transl. Med. 2019, 7, 436. [Google Scholar] [CrossRef] [PubMed]
- Park, S.; Kang, S. A minor allele of the haplotype located in the 19q13 loci is associated with a decreased risk of hyper-LDL-cholesterolemia, and a balanced diet and high protein intake can reduce the risk. Lipids Health Dis. 2020, 19, 178. [Google Scholar] [CrossRef]
- Liu, M.; Jin, H.S.; Park, S. Protein and fat intake interacts with the haplotype of PTPN11_rs11066325, RPH3A_rs886477, and OAS3_rs2072134 to modulate serum HDL concentrations in middle-aged people. Clin. Nutr. 2020, 39, 942–949. [Google Scholar] [CrossRef] [PubMed]
- Katakami, N. Mechanism of Development of Atherosclerosis and Cardiovascular Disease in Diabetes Mellitus. J. Atheroscler. Thromb. 2018, 25, 27–39. [Google Scholar] [CrossRef] [PubMed]
- Zhang, J.; Yang, J. Clinical Study of Intervention Sport Therapy on Blood Pressure, Blood Lipid and Blood Glucose of the Elderly Patients with “Three Highs”. Western J. Trad. Chin. Med. 2016, 29, 1004–6852. [Google Scholar]
- Wen, P.E.; Li, Q.Y. Effect of individualized lifestyle habits on the diagnosis and treatment of patients with “Three High Diseases”. Hainan Med. 2019, 30, 1003–6350. [Google Scholar]
- Elman, B.A. Rethinking East Asian Languages, Vernaculars, and Literacies, 1000–1919; Brill: Leiden, The Netherlands, 2014. [Google Scholar]
- Kim, Y.; Han, B.G.; KoGES Group. Cohort Profile: The Korean Genome and Epidemiology Study (KoGES) Consortium. Int. J. Epidemiol. 2017, 46, e20. [Google Scholar] [CrossRef]
- Cho, N.H.; Kim, K.M.; Choi, S.H.; Park, K.S.; Jang, H.C.; Kim, S.S.; Sattar, N.; Lim, S. High Blood pressure and its association with incident diabetes over 10 years in the Korean Genome and Epidemiology Study (KoGES). Diabetes Care 2015, 38, 1333–1338. [Google Scholar] [CrossRef]
- Unger, T.; Borghi, C.; Charchar, F.; Khan, N.A.; Poulter, N.R.; Prabhakaran, D.; Ramirez, A.; Schlaich, M.; Stergiou, G.S.; Tomaszewski, M.; et al. 2020 International Society of Hypertension Global Hypertension Practice Guidelines. Hypertension 2020, 75, 1334–1357. [Google Scholar] [CrossRef]
- Stumvoll, M.; Goldstein, B.J.; van Haeften, T.W. Type 2 diabetes: Principles of pathogenesis and therapy. Lancet. 2005, 365, 1333–1346. [Google Scholar] [CrossRef]
- American Diabetes Association. 2. Classification and Diagnosis of Diabetes: Standards of Medical Care in Diabetes—2020. Diabetes. 2020, 43, S14–S31. [Google Scholar]
- Sukhorukov, V.N.; Karagodin, V.P.; Orekhov, A.N. Modern methods of diagnosis dyslipidemia. Patol. Fiziol. Eksp. Ter. 2016, 60, 65–72. [Google Scholar] [PubMed]
- Park, S.; Daily, J.W.; Zhang, X.; Jin, H.S.; Lee, H.J.; Lee, Y.H. Interactions with the MC4R rs17782313 variant, mental stress and energy intake and the risk of obesity in Genome Epidemiology Study. Nutr. Metab. 2016, 13, 38. [Google Scholar] [CrossRef] [PubMed]
- Park, S.; Ham, J.O.; Lee, B.K. Effects of total vitamin A, vitamin C, and fruit intake on risk for metabolic syndrome in Korean women and men. Nutrition 2015, 31, 111–118. [Google Scholar] [CrossRef] [PubMed]
- Park, S.; Ahn, J.; Lee, B.K. Very-low-fat diets may be associated with increased risk of metabolic syndrome in the adult population. Clin. Nutr. 2016, 35, 1159–1167. [Google Scholar] [CrossRef]
- Hong, K.-W.; Kim, S.H.; Zhang, X.; Park, S. Interactions among the variants of insulin-related genes and nutrients increase the risk of type 2 diabetes. Nutr. Res. 2018, 51, 82–92. [Google Scholar] [CrossRef]
- Li, J.; Dong, Y.; Wu, T.; Tong, N. Differences between Western and Asian type 2 diabetes patients in the incidence of vascular complications and mortality: A systematic review of randomized controlled trials on lowering blood glucose. J. Diabetes 2016, 8, 824–833. [Google Scholar] [CrossRef] [PubMed]
- Gadgil, M.D.; Anderson, C.A.; Kandula, N.R.; Kanaya, A.M. Dietary patterns are associated with metabolic risk factors in South Asians living in the United States. J. Nutr. 2015, 145, 1211–1217. [Google Scholar] [CrossRef] [PubMed]
- Tsai, F.J.; Yang, C.F.; Chen, C.C.; Chuang, L.M.; Lu, C.H.; Chang, C.T.; Wang, T.Y.; Chen, R.H.; Shiu, C.F.; Liu, Y.M.; et al. A genome-wide association study identifies susceptibility variants for type 2 diabetes in Han Chinese. PLoS Genet. 2010, 6, e1000847. [Google Scholar] [CrossRef]
- Galcheva-Gargova, Z.; Gangwani, L.; Konstantinov, K.N.; Mikrut, M.; Theroux, S.J.; Enoch, T.; Davis, R.J. The cytoplasmic zinc finger protein ZPR1 accumulates in the nucleolus of proliferating cells. Mol. Biol. Cell. 1998, 9, 2963–2971. [Google Scholar] [CrossRef] [PubMed]
- Tokoro, F.; Matsuoka, R.; Abe, S.; Arai, M.; Noda, T.; Watanabe, S.; Horibe, H.; Fujimaki, T.; Oguri, M.; Kato, K.; et al. Association of a genetic variant of the ZPR1 zinc finger gene with type 2 diabetes mellitus. Biomed. Rep. 2015, 3, 88–92. [Google Scholar] [CrossRef]
- Fallah, M.S.; Sedaghatikhayat, B.; Guity, K.; Akbari, F.; Azizi, F.; Daneshpour, M.S. The Relation between Metabolic Syndrome Risk Factors and Genetic Variations of Apolipoprotein V in Relation with Serum Triglyceride and HDL-C Level. Arch. Iran. Med. 2016, 19, 46–50. [Google Scholar]
- Qi, Q.; Li, H.; Loos, R.J.F.; Liu, C.; Wu, Y.; Hu, F.B.; Wu, H.; Lu, L.; Yu, Z.; Lin, X. Common variants in KCNQ1 are associated with type 2 diabetes and impaired fasting glucose in a Chinese Han population. Human Mol. Genet. 2009, 18, 3508–3515. [Google Scholar] [CrossRef]
- Yasuda, K.; Miyake, K.; Horikawa, Y.; Hara, K.; Osawa, H.; Furuta, H.; Hirota, Y.; Mori, H.; Jonsson, A.; Sato, Y.; et al. Variants in KCNQ1 are associated with susceptibility to type 2 diabetes mellitus. Nat. Genet. 2008, 40, 1092–1097. [Google Scholar] [CrossRef]
- Maász, A.; Kisfali, P.; Horvatovich, K.; Mohás, M.; Markó, L.; Csöngei, V.; Faragó, B.; Járomi, L.; Magyari, L.; Sáfrány, E.; et al. Apolipoprotein A5 T-1131C variant confers risk for metabolic syndrome. Pathol. Oncol. Res. 2007, 13, 243–247. [Google Scholar] [CrossRef] [PubMed]
- Yamada, Y.; Kato, K.; Hibino, T.; Yokoi, K.; Matsuo, H.; Segawa, T.; Watanabe, S.; Ichihara, S.; Yoshida, H.; Satoh, K.; et al. Prediction of genetic risk for metabolic syndrome. Atherosclerosis 2007, 191, 298–304. [Google Scholar] [CrossRef]
- Kim, Y.R.; Hong, S.H. Association of Apolipoprotein A5 Gene Polymorphisms with Metabolic Syndrome in the Korean Population. Genet. Test. Mol. Biomark. 2016, 20, 130–136. [Google Scholar] [CrossRef]
- Hsu, L.A.; Ko, Y.L.; Chang, C.J.; Teng, M.S.; Wu, S.; Hu, C.F. Apolipoprotein A5 gene -1131T/C polymorphism is associated with the risk of metabolic syndrome in ethnic Chinese in Taiwan. Clin. Chem. Lab. Med. 2008, 46, 1714–1719. [Google Scholar] [CrossRef]
- Xu, C.; Bai, R.; Zhang, D.; Li, Z.; Zhu, H.; Lai, M.; Zhu, Y. Effects of APOA5 -1131T>C (rs662799) on fasting plasma lipids and risk of metabolic syndrome: Evidence from a case-control study in China and a meta-analysis. PLoS ONE 2013, 8, e56216. [Google Scholar] [CrossRef]
- Reynoso-Villalpando, G.L.; Sevillano-Collantes, C.; Valle, Y.; Moreno-Ruiz, I.; Padilla-Gutiérrez, J.R.; Del Cañizo-Gómez, F.J. ApoB/ApoA1 ratio and non-HDL-cholesterol/HDL-cholesterol ratio are associated to metabolic syndrome in patients with type 2 diabetes mellitus subjects and to ischemic cardiomyopathy in diabetic women. Endocrinol. Diabetes Nutr. 2019, 66, 502–511. [Google Scholar] [CrossRef] [PubMed]
- Bai, W.; Kou, C.; Zhang, L.; You, Y.; Yu, W.; Hua, W.; Li, Y.; Yu, Y.; Zhao, T.; Wu, Y. Functional polymorphisms of the APOA1/C3/A4/A5-ZPR1-BUD13 gene cluster are associated with dyslipidemia in a sex-specific pattern. PeerJ 2019, 6, e6175. [Google Scholar] [CrossRef]
- Amara, S.; Majors, C.; Roy, B.; Hill, S.; Rose, K.L.; Myles, E.L.; Tiriveedhi, V. Critical role of SIK3 in mediating high salt and IL-17 synergy leading to breast cancer cell proliferation. PLoS ONE 2017, 12, e0180097. [Google Scholar] [CrossRef]
- Darling, N.J.; Toth, R.; Arthur, J.S.C.; Clark, K. Inhibition of SIK2 and SIK3 during differentiation enhances the anti-inflammatory phenotype of macrophages. Biochem. J. 2017, 474, 521–537. [Google Scholar] [CrossRef] [PubMed]
- Sun, Z.; Jiang, Q.; Li, J.; Guo, J. The potent roles of salt-inducible kinases (SIKs) in metabolic homeostasis and tumorigenesis. Signal. Transduct. Target. Ther. 2020, 5, 150. [Google Scholar] [CrossRef]
- Feng, R.; Du, S.; Chen, Y.; Zheng, S.; Zhang, W.; Na, G.; Li, Y.; Sun, C. High carbohydrate intake from starchy foods is positively associated with metabolic disorders: A Cohort Study from a Chinese population. Sci. Rep. 2015, 5, 16919. [Google Scholar] [CrossRef] [PubMed]
- Song, S.; Young Paik, H.; Song, W.O.; Song, Y. Metabolic syndrome risk factors are associated with white rice intake in Korean adolescent girls and boys. Br. J. Nutr. 2015, 113, 479–487. [Google Scholar] [CrossRef]
- Ramdath, D.D.; Padhi, E.M.; Sarfaraz, S.; Renwick, S.; Duncan, A.M. Beyond the Cholesterol-Lowering Effect of Soy Protein: A Review of the Effects of Dietary Soy and Its Constituents on Risk Factors for Cardiovascular Disease. Nutrients 2017, 9, 324. [Google Scholar] [CrossRef] [PubMed]
- Holscher, H.D. Dietary fiber and prebiotics and the gastrointestinal microbiota. Gut Microbes 2017, 8, 172–184. [Google Scholar] [CrossRef]
- Soliman, G.A. Dietary Fiber, Atherosclerosis, and Cardiovascular Disease. Nutrients 2019, 11, 1155. [Google Scholar] [CrossRef] [PubMed]
- Reynolds, A.; Mann, J.; Cummings, J.; Winter, N.; Mete, E.; Te Morenga, L. Carbohydrate quality and human health: A series of systematic reviews and meta-analyses. Lancet 2019, 393, 434–445. [Google Scholar] [CrossRef]
- Bilano, V.; Gilmour, S.; Moffiet, T.; d’Espaignet, E.T.; Stevens, G.A.; Commar, A.; Tuyl, F.; Hudson, I.; Shibuya, K. Global trends and projections for tobacco use, 1990–2025: An analysis of smoking indicators from the WHO Comprehensive Information Systems for Tobacco Control. Lancet 2015, 385, 966–976. [Google Scholar] [CrossRef]
- Kumar, G.; Mohan, S.; Yadav, L.; Arora, M. Global Tobacco Surveys: Information for Action by Cardiologists. Glob. Heart 2012, 7, 99–105. [Google Scholar] [CrossRef] [PubMed]
- Ahn, Y.; Kwon, E.; Shim, J.E.; Park, M.K.; Joo, Y.; Kimm, K.; Park, C.; Kim, D.H. Validation and reproducibility of food frequency questionnaire for Korean genome epidemiologic study. Eur. J. Clin. Nutr. 2007, 61, 1435–1441. [Google Scholar] [CrossRef]


| Control | 1–2Go | Case (3GO) | p-Value 1 | |
|---|---|---|---|---|
| (n = 28,440) | (n = 28,807) | (n = 1454) | ||
| Gender (Number, male %) | 7712 (27.1) | 11,413 (40.7) | 722 (49.7) | <0.0001 |
| BMI 2 (kg/m2) | 23.1 ± 2.7 c | 24.5 ± 2.9 b | 25.8 ± 3.1 a | <0.0001 |
| Waist circumference (cm) | 78.2 ± 8.1 c | 82.9 ± 8.3 b | 87.3 ± 8.4 a | <0.0001 |
| Hip circumference (cm) | 93.2 ± 5.6 c | 94.8 ± 5.8 b | 96.2 ± 6.5 a | <0.0001 |
| Body fat (%) | 16.7 ± 7.1 c | 17.6 ± 7.0 b | 22.9 ± 6.5 a | <0.0001 |
| Serum glucose (mg/dL) | 89.7 ± 9.3 c | 98.7 ± 22.5 b | 132.4 ± 40.3 a | <0.0001 |
| HbA1c (%) | 5.53 ± 0.4 c | 5.81 ± 0.8 b | 7.09 ± 1.3 a | <0.0001 |
| Total cholesterol (mg/dL) | 191 ± 26.2 b | 204 ± 41.4 a | 188 ± 43.9 c | <0.0001 |
| HDL 3 (mg/dL) | 57.4 ± 11.7 a | 50.8 ± 13.5 b | 45.7 ± 11.9 c | <0.0001 |
| TG 4 (mg/dL) | 92.3 ± 37.9 c | 144 ± 73.8 b | 172 ± 80.7 a | <0.0001 |
| SBP (mmHg) | 118 ± 12.6 c | 127 ± 15.3 b | 133 ± 15.1 a | <0.0001 |
| DBP (mmHg) | 73.0 ± 8.5 c | 78.3 ± 10.1 b | 80.2 ± 10.1 a | <0.0001 |
| Total activity (Number, %) | 0.231 | |||
| None or little (<90 min/w) | 12,749 (45.9) | 12,739 (46.5) | 685 (48.1) | |
| Moderate (90–150 min/w) | 9315 (33.5) | 9113 (48.3) | 443 (31.1) | |
| Heavy (>150 min/w) | 5724 (20.6) | 5550 (20.3) | 297 (20.8) | |
| Alcohol intake (g/day) | <0.0001 | |||
| Non-drinker (<1) | 15,008 (52.9) | 14,312 (51.2) | 717 (64.1) | |
| Light drinker (1–15) | 782 (2.9) | 1302 (4.7) | 99 (34.3) | |
| Moderate drinking (15–30) | 8252 (29.4) | 8112 (28.9) | 422 (29.1) | |
| Heavy drinker (>30) | 4175 (14.8) | 4206 (14.7) | 211 (14.5) | |
| Coffee intake (cups/day) | ||||
| Non-drinker (0) | 4588 (16.2) | 4630 (16.5) | 262 (18.1) | 0.225 |
| Light drinker (<2) | 4727 (16.7) | 4675 (16.8) | 240 (16.6) | |
| Moderate drinker (2–10) | 14,208 (51.1) | 13,797 (49.2) | 708 (48.9) | |
| Heavy drinker (>10) | 4735 (17.2) | 4766 (16.9) | 236 (16.4) | |
| Smoking (Number, %) | <0.0001 | |||
| Non-smoking | 6631 (23.3) | 6241 (22.3) | 290 (19.9) | |
| Past-smoking | 959 (3.4) | 1607 (5.7) | 95 (6.5) | |
| Heavy smoking | 676 (2.4) | 1121 (4.0) | 60 (4.1) | |
| Energy intake (EER 5 percent) | 92.2 ± 29.3 a | 91.4 ± 28.5 b | 89.3 ± 28.5 c | <0.0001 |
| Carbohydrate intake (energy percent) | 71.3 ± 7.0 b | 72.1 ± 7.0 b | 72.8 ± 6.7 a | <0.0001 |
| Protein (energy percent) | 13.5 ± 2.5 a | 13.4 ± 2.6 ab | 13.2 ± 2.5 b | <0.0001 |
| Fat intake (energy percent) | 14.3 ± 5.4 b | 13.5 ± 5.4 a | 12.8 ± 5.2 a | <0.0001 |
| Undigested carbohydrates (g/1000 kcal) | 5.74 ± 2.83 a | 5.70 ± 2.84 a | 5.45 ± 2.65 b | <0.0001 |
| Na (mg/1000 kcal) | 2432 ± 1359 b | 2446 ± 1404 a | 2382 ± 1463 c | 0.143 |
| Ca (mg/day) | 450 ± 258 a | 440 ± 256 b | 414 ± 232 c | <0.0001 |
| Chr a | SNP b | Position | Mi c | Ma d | OR e | p_Adjust f | MAF g | p_HWE h | Gene | Functional Consequence |
|---|---|---|---|---|---|---|---|---|---|---|
| 11 | rs2237892 | 2839751 | T | C | 0.8155 | 1.41 × 10⁻⁶ | 0.3755 | 0.3933 | KCNQ1 | intron variant |
| 11 | rs2075291 | 116661392 | A | C | 1.585 | 2.17 × 10⁻¹¹ | 0.0793 | 0.3655 | ZPR1 | upstream transcript variant |
| 11 | rs662799 | 116663707 | G | A | 1.355 | 2.90 × 10⁻¹² | 0.2988 | 0.2874 | APOA5 | upstream transcript variant |
| 11 | rs5072 | 116707583 | A | G | 1.202 | 7.49 × 10⁻⁶ | 0.3593 | 0.8018 | APOA1 | intron variant |
| 11 | rs151139277 | 116753093 | T | C | 1.875 | 2.85 × 10⁻⁷ | 0.0192 | 0.7412 | SIK3 | downstream transcript variant |
| Control (n = 28,440) | 3GO (n = 1454) | |||||
|---|---|---|---|---|---|---|
| Major (n = 14,317) | Heterozygote (n = 13,118) | Minor (n = 1005) | Major (n = 613) | Heterozygote (n = 744) | Minor (n = 97) | |
| BMI 1 (kg/m2) | 23.2 ± 2.71 b | 23.1 ± 2.66 b | 22.7 ± 2.58 b | 25.9 ± 3.12 a | 25.7 ± 3.04 a | 25.7 ± 3.21 a*+++ |
| Waist circumference (cm) | 78.4 ± 8.13 b | 78.1 ± 8.13 b | 76.8 ± 7.89 b | 87.4 ± 8.41 a | 87.4 ± 8.38 a | 85.9 ± 7.77 a**+++ |
| Hip circumference (cm) | 93.3 ± 5.53 b | 93.2 ± 5.61 b | 92.6 ± 5.31 b | 96.4 ± 6.37 a | 96.1 ± 6.52 a | 95.9 ± 6.09 a+++ |
| Fasting serum glucose (mg/dL) | 89.6 ± 9.29 c | 89.8 ± 9.29 c | 90.1 ± 9.23 c | 132.6 ± 44.7 b | 131.5 ± 35.7 b | 138.9 ± 46.0 a*+++ |
| HbA1c | 5.49 ± 0.36 b | 5.49 ± 0.35 b | 5.49 ± 0.36 b | 7.19 ± 1.38 a | 7.21 ± 1.28 a | 7.24 ± 1.53 a*+++ |
| Total cholesterol (mg/dL) | 190 ± 26.3 b | 191 ± 26.1 ab | 191 ± 27.1 ab | 189 ± 44.3 bc | 186 ± 43.7 c | 193 ± 43.8 a**+++ |
| HDL 2 (mg/dL) | 58.1 ± 11.9 a | 56.9 ± 11.6 a | 54.3 ± 10.8 ab | 46.6 ± 12.5 c | 45.2 ± 11.5 c | 44.3 ± 11.7 c***+++ |
| TG 3 (mg/dL) | 88.5 ± 36.9 c | 95.4 ± 38.4 c | 104 ± 39.9 c | 158 ± 75.8 c | 181 ± 81.3 b | 194 ± 91.8 a***+++ |
| SBP 4 (mmHg) | 118 ± 12.5 b | 118 ± 12.6 b | 117 ± 12.7 b | 132 ± 14.7 a | 133 ± 15.4 a | 134 ± 14.5 a+++ |
| DBP 5 (mmHg) | 73.1 ± 8.48 c | 72.9 ± 8.47 c | 72.6 ± 8.48 c | 80.1 ± 9.69 b | 80.4 ± 10.3 ab | 81.4 ± 9.68 a+++ |
| Model 1 | Model 2 | ||||
|---|---|---|---|---|---|
| Major (n = 14,930) | Heterozygote (n = 13,862) | Minor (n = 1102) | Heterozygote (n = 13,862) | Minor (n = 1102) | |
| 3GO | 1 | 1.435 (1.274–1.616) *** | 2.938 (2.291–3.768) *** | 1.251 (1.009–1.548) * | 3.230 (2.062–5.061) *** |
| BMI | 1 | 0.959 (0.907–1.014) | 0.762 (0.651–0.892) ** | 0.965 (0.910–1.024) | 0.757 (0.541–0.893) *** |
| Waist circumference | 1 | 1.071 (0.966–1.191) | 0.791 (0.578–1.082) | 1.019 (0.849–1.223) | 0.709 (0.401–1.256) |
| SBP | 1 | 1.134 (1.014–1.268) * | 1.689 (1.307–2.183) *** | 1.090 (0.877–1.354) | 2.135 (1.328–3.432) ** |
| DBP | 1 | 1.171 (1.022–1.342) * | 1.435 (1.029~2.002) * | 1.188 (0.949–1.487) | 1.039 (0.548–1.971) |
| BP | 1 | 1.171 (1.022~1.342) * | 1.435 (1.029~2.002) * | 1.121 (0.943~1.333) | 1.487 (0.966~2.289) |
| Serum glucose | 1 | 1.123 (1.052~1.199) | 1.478 (1.255~1.740) *** | 1.141 (0.888~1.466) | 2.138 (1.222~3.742) ** |
| HbA1c | 1 | 1.374 (1.214–1.556) * | 2.670 (2.056–3.467) *** | 1.365 (1.190–1.544) * | 2.688 (2.048–3.529) *** |
| Serum total cholesterol | 1 | 1.115 (1.025–1.212) | 1.448 (1.183–1.771) ** | 0.940 (0.593–1.490) | 3.095 (1.374–6.972) ** |
| Serum HDL | 1 | 1.320 (1.239–1.406) *** | 2.339 (2.020–2.708) *** | 1.318 (0.975–1.781) * | 3.196 (1.761–5.801) *** |
| Serum TG | 1 | 1.530 (1.421–1.648) | 2.744 (2.330–3.230) *** | 2.212 (1.535–3.187) *** | 3.658 (1.755–7.624) *** |
| Major (n = 14,930) | Heterozygote (n = 13,862) | Minor (n = 1102) | Haplotype–Nutrient Interaction p-Value | |
|---|---|---|---|---|
| Low energy High energy | 1 | 1.383 (1.219~1.569) *** 1.926 (1.338~2.773) *** | 2.853 (2.198~3.701) *** 3.877 (1.675~8.978) ** | 0.533 |
| Low protein High protein | 1 | 1.383 (1.171~1.633) *** 1.486 (1.254~1.762) *** | 3.261 (2.331~4.563) *** 2.559 (1.762~3.716) *** | 0.033 * |
| Low carbohydrate High carbohydrate | 1 | 1.622 (1.344~1.957) *** 1.316 (1.128~1.535) *** | 2.640 (1.741~4.004) *** 3.111 (2.277~4.248) *** | 0.012 * |
| Low fat High fat | 1 | 1.231 (1.039~1.459) ** 1.648 (1.395~1.947) *** | 3.153 (2.234~4.450) *** 2.721 (1.894~3.909) *** | 0.008 * |
| Low dietary fiber High dietary fiber | 1 | 1.462 (1.234~1.734) *** 1.409 (1.193~1.664) *** | 3.673 (2.629~5.122) *** 2.271 (1.554~3.319) *** | 0.015 * |
| Low alcohol High alcohol | 1 | 1.296 (1.106~1.520) ** 1.628 (1.359~1.951) *** | 2.763 (2.001~3.817) *** 3.126 (2.110~4.630) *** | 0.786 |
| Low exercise High exercise | 1 | 1.753 (1.391~2.211) *** 1.354 (1.044~1.756) * | 2.413 (1.663~3.501) *** 3.129 (1.812~5.403) *** | 0.959 |
| Low coffee High coffee | 1 | 1.479 (1.206~1.813) *** 1.413 (1.235~1.658) *** | 2.751 (1.776~4.258) *** 3.062 (2.262~4.145) *** | 0.924 |
| Non-smoker Smoker + ex-smoker | 1 | 1.119 (0.861~1.455) 1.632 (0.887~3.002) | 3.365 (2.012~5.630) *** 5.283 (1.408~19.82) ** | 0.007 * |
Publisher’s Note: MDPI stays neutral with regard to jurisdictional claims in published maps and institutional affiliations. |
© 2021 by the authors. Licensee MDPI, Basel, Switzerland. This article is an open access article distributed under the terms and conditions of the Creative Commons Attribution (CC BY) license (http://creativecommons.org/licenses/by/4.0/).
Share and Cite
Zhou, J.-Y.; Park, S. Associations of Polygenetic Variants at the 11q23 Locus and Their Interactions with Macronutrient Intake for the Risk of 3GO, a Combination of Hypertension, Hyperglycemia, and Dyslipidemia. J. Pers. Med. 2021, 11, 207. https://doi.org/10.3390/jpm11030207
Zhou J-Y, Park S. Associations of Polygenetic Variants at the 11q23 Locus and Their Interactions with Macronutrient Intake for the Risk of 3GO, a Combination of Hypertension, Hyperglycemia, and Dyslipidemia. Journal of Personalized Medicine. 2021; 11(3):207. https://doi.org/10.3390/jpm11030207
Chicago/Turabian StyleZhou, Jun-Yu, and Sunmin Park. 2021. "Associations of Polygenetic Variants at the 11q23 Locus and Their Interactions with Macronutrient Intake for the Risk of 3GO, a Combination of Hypertension, Hyperglycemia, and Dyslipidemia" Journal of Personalized Medicine 11, no. 3: 207. https://doi.org/10.3390/jpm11030207
APA StyleZhou, J.-Y., & Park, S. (2021). Associations of Polygenetic Variants at the 11q23 Locus and Their Interactions with Macronutrient Intake for the Risk of 3GO, a Combination of Hypertension, Hyperglycemia, and Dyslipidemia. Journal of Personalized Medicine, 11(3), 207. https://doi.org/10.3390/jpm11030207