
MicroRNA-Target Interaction Regulatory Network in Alzheimer’s Disease


Abstract
:
1. Introduction
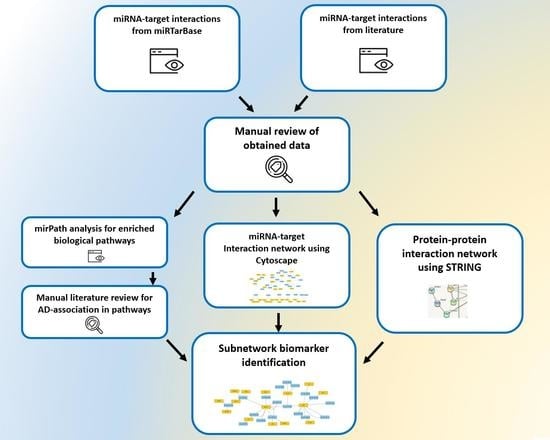
2. Methods
3. Results
4. Discussion
5. Conclusions
Supplementary Materials
Author Contributions
Funding
Institutional Review Board Statement
Informed Consent Statement
Data Availability Statement
Conflicts of Interest
References
- Zhao, Y.; Jaber, V.; Alexandrov, P.N.; Vergallo, A.; Lista, S.; Hampel, H.; Lukiw, W.J. microRNA-Based Biomarkers in Alzheimer’s Disease (AD). Front. Neurosci. 2020, 14, 585432. [Google Scholar] [CrossRef] [PubMed]
- Blennow, K.; Zetterberg, H. Biomarkers for Alzheimer’s disease: Current status and prospects for the future. J. Intern. Med. 2018, 284, 643–663. [Google Scholar] [CrossRef] [PubMed] [Green Version]
- Vos, T.; Allen, C.; Arora, M.; Barber, R.M.; Bhutta, Z.A.; Brown, A.; Carter, A.; Casey, D.C.; Charlson, F.J.; Chen, A.Z.; et al. GBD 2015 Disease and Injury Incidence and Prevalence Collaborators, Global, regional, and national incidence, prevalence, and years lived with disability for 310 diseases and injuries, 1990–2015: A systematic analysis for the Global Burden of Disease Study 2015. Lancet 2016, 388, 1545–1602. [Google Scholar] [CrossRef] [Green Version]
- Dubois, B.; Feldman, H.; Jacova, C.; Hampel, H.; Molinuevo, J.L.; Blennow, K.; DeKosky, S.; Gauthier, S.; Selkoe, D.; Bateman, R.; et al. Advancing research diagnostic criteria for Alzheimer’s disease: The IWG-2 criteria. Lancet Neurol. 2014, 13, 614–629. [Google Scholar] [CrossRef]
- Jack, C.R., Jr.; Bennett, D.A.; Blennow, K.; Carrillo, M.C.; Dunn, B.; Haeberlein, S.B.; Holtzman, D.M.; Jagust, W.; Jessen, F.; Karlawish, J.; et al. NIA-AA Research Framework: Toward a biological definition of Alzheimer’s disease. Alzheimer’s Dement. 2018, 14, 535–562. [Google Scholar] [CrossRef] [PubMed]
- Palmqvist, S.; Janelidze, S.; Stomrud, E.; Zetterberg, H.; Karl, J.; Zink, K.; Bittner, T.; Mattsson-Carlgren, N.; Eichenlaub, U.; Blennow, K.; et al. Performance of Fully Automated Plasma Assays as Screening Tests for Alzheimer Disease–Related β-Amyloid Status. JAMA Neurol. 2019, 76, 1060–1069. [Google Scholar] [CrossRef] [PubMed]
- Brickman, A.M.; Manly, J.J.; Honig, L.S.; Sanchez, D.; Reyes-Dumeyer, D.; Lantigua, R.A.; Lao, P.J.; Stern, Y.; Vonsattel, J.P.; Teich, A.F.; et al. Plasma p-tau181, p-tau217, and other blood-based Alzheimer’s disease biomarkers in a multi-ethnic, community study. Alzheimer’s Dement. 2021, 17, 1353–1364. [Google Scholar] [CrossRef] [PubMed]
- Ossenkoppele, R.; Reimand, J.; Smith, R.; Leuzy, A.; Strandberg, O.; Palmqvist, S.; Stomrud, E.; Zetterberg, H.; Scheltens, P.; Dage, J.L.; et al. Tau PET correlates with different Alzheimer’s disease-related features compared to CSF and plasma p-tau biomarkers. EMBO Mol. Med. 2021, 13, e14398. [Google Scholar] [CrossRef]
- Cullen, N.C.; Leuzy, A.; Janelidze, S.; Palmqvist, S.; Svenningsson, A.L.; Stomrud, E.; Dage, J.L.; Mattsson-Carlgren, N.; Hansson, O. Plasma biomarkers of Alzheimer’s disease improve prediction of cognitive decline in cognitively unimpaired elderly populations. Nat. Commun. 2021, 12, 3555. [Google Scholar] [CrossRef] [PubMed]
- Karikari, T.K.; Pascoal, T.A.; Ashton, N.J.; Janelidze, S.; Benedet, A.L.; Rodriguez, J.L.; Chamoun, M.; Savard, M.; Kang, M.S.; Therriault, J.; et al. Blood phosphorylated tau 181 as a biomarker for Alzheimer’s disease: A diagnostic performance and prediction modelling study using data from four prospective cohorts. Lancet Neurol. 2020, 19, 422–433. [Google Scholar] [CrossRef]
- Hrovatin, K.; Kunej, T. Classification of miRNA-related sequence variations. Epigenomics 2018, 10, 463–481. [Google Scholar] [CrossRef] [PubMed]
- Friedman, R.; Farh, K.K.-H.; Burge, C.B.; Bartel, D.P. Most mammalian mRNAs are conserved targets of microRNAs. Genome Res. 2008, 19, 92–105. [Google Scholar] [CrossRef] [PubMed] [Green Version]
- Hammond, S.M. An overview of microRNAs. Adv. Drug Deliv. Rev. 2015, 87, 3–14. [Google Scholar] [CrossRef] [PubMed] [Green Version]
- Wang, M.; Qin, L.; Tang, B. MicroRNAs in Alzheimer’s Disease. Front. Genet. 2019, 10, 153. [Google Scholar] [CrossRef] [PubMed] [Green Version]
- Vergallo, A.; Lista, S.; Zhao, Y.; Lemercier, P.; Teipel, S.J.; Potier, M.-C.; Habert, M.-O.; Dubois, B.; Lukiw, W.J.; Hampel, H.; et al. MiRNA-15b and miRNA-125b are associated with regional Aβ-PET and FDG-PET uptake in cognitively normal individuals with subjective memory complaints. Transl. Psychiatry 2021, 11, 78. [Google Scholar] [CrossRef] [PubMed]
- Ballard, C.; Gauthier, S.; Corbett, A.; Brayne, C.; Aarsland, D.; Jones, E. Alzheimer’s disease. Lancet 2011, 377, 1019–1031. [Google Scholar] [CrossRef]
- Ansari, A.; Maffioletti, E.; Milanesi, E.; Marizzoni, M.; Frisoni, G.B.; Blin, O.; Richardson, J.C.; Bordet, R.; Forloni, G.; Gennarelli, M.; et al. miR-146a and miR-181a are involved in the progression of mild cognitive impairment to Alzheimer’s disease. Neurobiol. Aging 2019, 82, 102–109. [Google Scholar] [CrossRef] [PubMed]
- Xie, B.; Liu, Z.; Jiang, L.; Liu, W.; Song, M.; Zhang, Q.; Zhang, R.; Cui, D.; Wang, X.; Xu, S. Increased Serum miR-206 Level Predicts Conversion from Amnestic Mild Cognitive Impairment to Alzheimer’s Disease: A 5-Year Follow-up Study. J. Alzheimer’s Dis. 2016, 55, 509–520. [Google Scholar] [CrossRef]
- Henry, R.; Doran, S.J.; Barrett, J.; Meadows, V.E.; Sabirzhanov, B.; Stoica, B.A.; Loane, D.J.; Faden, A.I. Inhibition of miR-155 Limits Neuroinflammation and Improves Functional Recovery After Experimental Traumatic Brain Injury in Mice. Neurotherapeutics 2018, 16, 216–230. [Google Scholar] [CrossRef] [Green Version]
- Lukiw, W.J. NF-ĸB-regulated micro RNAs (miRNAs) in primary human brain cells. Exp. Neurol. 2012, 235, 484–490. [Google Scholar] [CrossRef] [PubMed] [Green Version]
- Jaber, V.R.; Zhao, Y.; Sharfman, N.M.; Li, W.; Lukiw, W.J. Addressing Alzheimer’s Disease (AD) Neuropathology Using Anti-microRNA (AM) Strategies. Mol. Neurobiol. 2019, 56, 8101–8108. [Google Scholar] [CrossRef]
- Abuelezz, N.Z.; Nasr, F.E.; AbdulKader, M.A.; Bassiouny, A.R.; Zaky, A. MicroRNAs as Potential Orchestrators of Alzheimer’s Disease-Related Pathologies: Insights on Current Status and Future Possibilities. Front. Aging Neurosci. 2021, 13, 743573. [Google Scholar] [CrossRef]
- Chou, C.-H.; Shrestha, S.; Yang, C.-D.; Chang, N.-W.; Lin, Y.-L.; Liao, K.-W.; Huang, W.-C.; Sun, T.-H.; Tu, S.-J.; Lee, W.-H.; et al. miRTarBase update 2018: A resource for experimentally validated microRNA-target interactions. Nucleic Acids Res. 2017, 46, D296–D302. [Google Scholar] [CrossRef] [PubMed]
- Shannon, P.; Markiel, A.; Ozier, O.; Baliga, N.S.; Wang, J.T.; Ramage, D.; Amin, N.; Schwikowski, B.; Ideker, T. Cytoscape: A Software Environment for Integrated Models of Biomolecular Interaction Networks. Genome Res. 2003, 13, 2498–2504. [Google Scholar] [CrossRef] [PubMed]
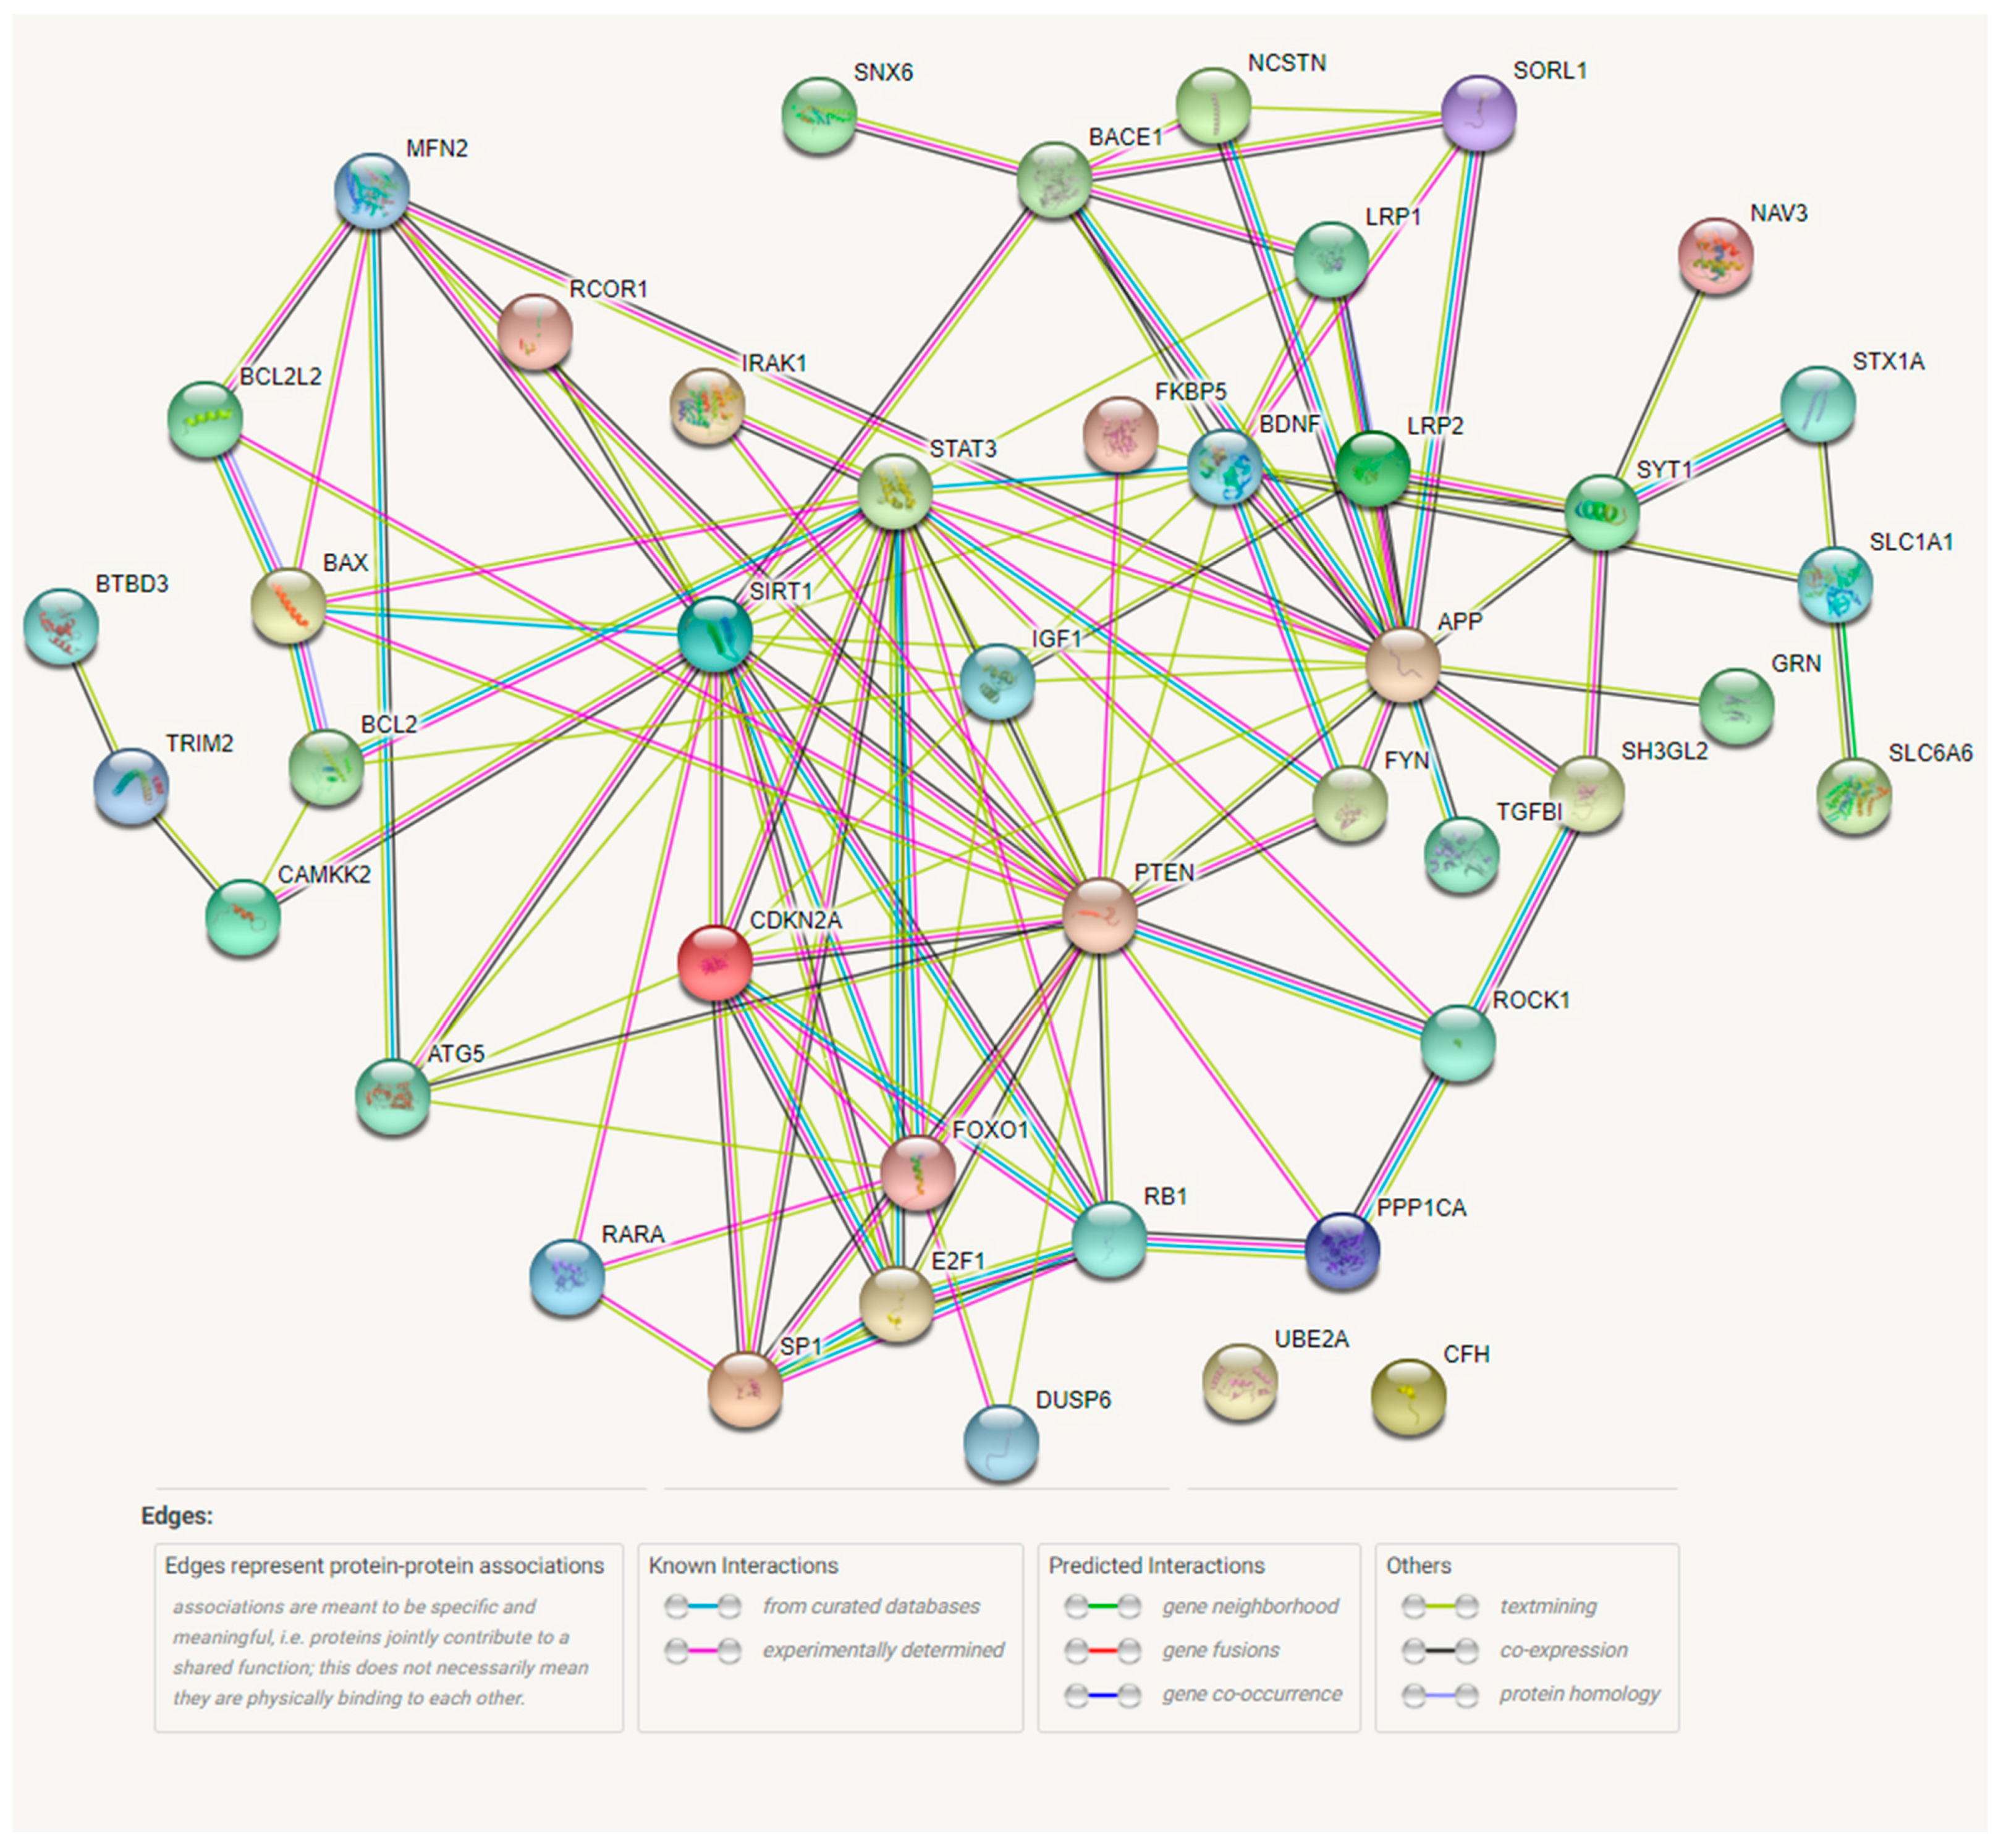
- Szklarczyk, D.; Gable, A.L.; Nastou, K.C.; Lyon, D.; Kirsch, R.; Pyysalo, S.; Doncheva, N.T.; Legeay, M.; Fang, T.; Bork, P.; et al. The STRING database in 2021: Customizable protein–protein networks, and functional characterization of user-uploaded gene/measurement sets. Nucleic Acids Res. 2020, 49, D605–D612. [Google Scholar] [CrossRef] [PubMed]
- Vlachos, I.S.; Zagganas, K.; Paraskevopoulou, M.D.; Georgakilas, G.; Karagkouni, D.; Vergoulis, T.; Dalamagas, T.; Hatzigeorgiou, A.G. DIANA-miRPath v3.0: Deciphering microRNA function with experimental support. Nucleic Acids Res. 2015, 43, W460–W466. [Google Scholar] [CrossRef]
- Shioya, M.; Obayashi, S.; Tabunoki, H.; Arima, K.; Saito, Y.; Ishida, T.; Satoh, J. Aberrant microRNA expression in the brains of neurodegenerative diseases: miR-29a decreased in Alzheimer disease brains targets neurone navigator 3. Neuropathol. Appl. Neurobiol. 2010, 36, 320–330. [Google Scholar] [CrossRef] [PubMed]
- Li, Q.; Li, X.; Wang, L.; Zhang, Y.; Chen, L. miR-98-5p Acts as a Target for Alzheimer’s Disease by Regulating Aβ Production Through Modulating SNX6 Expression. J. Mol. Neurosci. 2016, 60, 413–420. [Google Scholar] [CrossRef]
- Lei, X.; Lei, L.; Zhang, Z.; Zhang, Z.; Cheng, Y. Downregulated miR-29c correlates with increased BACE1 expression in sporadic Alzheimer’s disease. Int. J. Clin. Exp. Pathol. 2015, 8, 1565–1574. [Google Scholar] [PubMed]
- Edelay, C.; Dorval, V.; Efok, A.; Egrenier-Boley, B.; Lambert, J.-C.; Hsiung, G.-Y.; Hébert, S.S. MicroRNAs targeting Nicastrin regulate Aβ production and are affected by target site polymorphisms. Front. Mol. Neurosci. 2014, 7, 67. [Google Scholar] [CrossRef]
- Zhang, M.; Ye, Y.; Cong, J.; Pu, D.; Liu, J.; Hu, G.; Wu, J. Regulation of STAT3 by miR-106a is linked to cognitive impairment in ovariectomized mice. Brain Res. 2013, 1503, 43–52. [Google Scholar] [CrossRef] [PubMed]
- Villa, C.; Ridolfi, E.; Fenoglio, C.; Ghezzi, L.; Vimercati, R.; Clerici, F.; Marcone, A.; Gallone, S.; Serpente, M.; Cantoni, C.; et al. Expression of the Transcription Factor Sp1 and its Regulatory hsa-miR-29b in Peripheral Blood Mononuclear Cells from Patients with Alzheimer’s Disease. J. Alzheimer’s Dis. 2013, 35, 487–494. [Google Scholar] [CrossRef] [PubMed]
- Absalon, S.; Kochanek, D.M.; Raghavan, V.; Krichevsky, A.M. MiR-26b, Upregulated in Alzheimer’s Disease, Activates Cell Cycle Entry, Tau-Phosphorylation, and Apoptosis in Postmitotic Neurons. J. Neurosci. 2013, 33, 14645–14659. [Google Scholar] [CrossRef] [PubMed]
- Banzhaf-Strathmann, J.; Benito, E.; May, S.; Arzberger, T.; Tahirovic, S.; Kretzschmar, H.; Fischer, A.; Edbauer, D. Micro RNA-125b induces tau hyperphosphorylation and cognitive deficits in Alzheimer’s disease. EMBO J. 2014, 33, 1667–1680. [Google Scholar] [CrossRef] [PubMed] [Green Version]
- Yan, H.; Xu, T.; Zhao, H.; Lee, K.-C.; Wang, H.-Y.; Zhang, Y. Isoflurane Increases Neuronal Cell Death Vulnerability by Downregulating miR-214. PLoS ONE 2013, 8, e55276. [Google Scholar] [CrossRef] [PubMed] [Green Version]
- Ghanbari, M.; Ikram, M.A.; De Looper, H.W.J.; Hofman, A.; Erkeland, S.J.; Franco, O.H.; Dehghan, A. Genome-wide identification of microRNA-related variants associated with risk of Alzheimer’s disease. Sci. Rep. 2016, 6, 28387. [Google Scholar] [CrossRef] [PubMed] [Green Version]
- Schonrock, N.; Humphreys, D.; Preiss, T.; Götz, J. Target Gene Repression Mediated by miRNAs miR-181c and miR-9 Both of Which Are Down-regulated by Amyloid-β. J. Mol. Neurosci. 2011, 46, 324–335. [Google Scholar] [CrossRef]
- Zhang, B.; Wang, L.-L.; Ren, R.-J.; Dammer, E.; Zhang, Y.-F.; Huang, Y.; Chen, S.-D.; Wang, G. MicroRNA-146a represses LRP2 translation and leads to cell apoptosis in Alzheimer’s disease. FEBS Lett. 2016, 590, 2190–2200. [Google Scholar] [CrossRef] [Green Version]
- Hebert, S.; Horré, K.; Nicolaï, L.; Bergmans, B.; Papadopoulou, A.S.; Delacourte, A.; De Strooper, B. MicroRNA regulation of Alzheimer’s Amyloid precursor protein expression. Neurobiol. Dis. 2009, 33, 422–428. [Google Scholar] [CrossRef] [PubMed]
- Song, H.; Bu, G. MicroRNA-205 inhibits tumor cell migration through down-regulating the expression of the LDL receptor-related protein 1. Biochem. Biophys. Res. Commun. 2009, 388, 400–405. [Google Scholar] [CrossRef] [Green Version]
- Li, H.-H.; Lin, S.-L.; Huang, C.-N.; Lu, F.-J.; Chiu, P.-Y.; Huang, W.-N.; Lai, T.-J.; Lin, C.-L. miR-302 Attenuates Amyloid-β-Induced Neurotoxicity through Activation of Akt Signaling. J. Alzheimer’s Dis. 2016, 50, 1083–1098. [Google Scholar] [CrossRef] [PubMed]
- Wang, W.-X.; Wilfred, B.R.; Madathil, S.K.; Tang, G.; Hu, Y.; Dimayuga, J.; Stromberg, A.J.; Huang, Q.; Saatman, K.E.; Nelson, P.T. miR-107 Regulates Granulin/Progranulin with Implications for Traumatic Brain Injury and Neurodegenerative Disease. Am. J. Pathol. 2010, 177, 334–345. [Google Scholar] [CrossRef]
- Jayadev, S.; Case, A.; Alajajian, B.; Eastman, A.J.; Möller, T.; Garden, G.A. Presenilin 2 influences miR146 level and activity in microglia. J. Neurochem. 2013, 127, 592–599. [Google Scholar] [CrossRef] [Green Version]
- Li, W.; Li, X.; Xin, X.; Kan, P.-C.; Yan, Y. MicroRNA-613 regulates the expression of brain-derived neurotrophic factor in Alzheimer’s disease. Biosci. Trends 2016, 10, 372–377. [Google Scholar] [CrossRef] [Green Version]
- Li, S.; Yan, Y.; Jiao, Y.; Gao, Z.; Xia, Y.; Kong, L.; Yao, Y.; Tao, Z.; Song, J.; Yan, Y.; et al. Neuroprotective Effect of Osthole on Neuron Synapses in an Alzheimer’s Disease Cell Model via Upregulation of MicroRNA-9. J. Mol. Neurosci. 2016, 60, 71–81. [Google Scholar] [CrossRef] [PubMed]
- Parsi, S.; Smith, P.Y.; Goupil, C.; Dorval, V.; Hébert, S.S. Preclinical Evaluation of miR-15/107 Family Members as Multifactorial Drug Targets for Alzheimer’s Disease. Mol. Ther. Nucleic Acids 2015, 4, e256. [Google Scholar] [CrossRef] [PubMed]
- Jovicic, A.; Jolissaint, J.F.Z.; Moser, R.; Santos, M.D.F.S.S.; Luthi-Carter, R. MicroRNA-22 (miR-22) Overexpression Is Neuroprotective via General Anti-Apoptotic Effects and May also Target Specific Huntington’s Disease-Related Mechanisms. PLoS ONE 2013, 8, e54222. [Google Scholar] [CrossRef] [Green Version]
- Wang, G.; Huang, Y.; Wang, L.-L.; Zhang, Y.-F.; Xu, J.; Zhou, Y.; Lourenco, G.; Zhang, B.; Wang, Y.; Ren, R.-J.; et al. MicroRNA-146a suppresses ROCK1 allowing hyperphosphorylation of tau in Alzheimer’s disease. Sci. Rep. 2016, 6, 26697. [Google Scholar] [CrossRef]
- Wang, X.; Liu, P.; Zhu, H.; Xu, Y.; Ma, C.; Dai, X.; Huang, L.; Liu, Y.; Zhang, L.; Qin, C. miR-34a, a microRNA up-regulated in a double transgenic mouse model of Alzheimer’s disease, inhibits bcl2 translation. Brain Res. Bull. 2009, 80, 268–273. [Google Scholar] [CrossRef]
- Pogue, A.; Cui, J.; Li, Y.; Zhao, Y.; Culicchia, F.; Lukiw, W. Micro RNA-125b (miRNA-125b) function in astrogliosis and glial cell proliferation. Neurosci. Lett. 2010, 476, 18–22. [Google Scholar] [CrossRef]
- Lukiw, W.J.; Zhao, Y.; Cui, J.G. An NF-κB-sensitive Micro RNA-146a-mediated Inflammatory Circuit in Alzheimer Disease and in Stressed Human Brain Cells. J. Biol. Chem. 2008, 283, 31315–31322. [Google Scholar] [CrossRef] [PubMed] [Green Version]
- Zhang, Y.; Liu, C.; Wang, J.; Li, Q.; Ping, H.; Gao, S.; Wang, P. MiR-299-5p regulates apoptosis through autophagy in neurons and ameliorates cognitive capacity in APPswe/PS1dE9 mice. Sci. Rep. 2016, 6, 24566. [Google Scholar] [CrossRef] [PubMed] [Green Version]
- Lau, P.; Bossers, K.; Janky, R.; Salta, E.; Frigerio, C.S.; Barbash, S.; Rothman, R.; Sierksma, A.S.R.; Thathiah, A.; Greenberg, D.; et al. Alteration of the micro RNA network during the progression of Alzheimer’s disease. EMBO Mol. Med. 2013, 5, 1613–1634. [Google Scholar] [CrossRef] [PubMed] [Green Version]
- Agostini, M.; Tucci, P.; Killick, R.; Candi, E.; Sayan, B.S.; Cervo, P.R.D.V.; Nicotera, P.; McKeon, F.; Knight, R.A.; Mak, T.W.; et al. Neuronal differentiation by TAp73 is mediated by microRNA-34a regulation of synaptic protein targets. Proc. Natl. Acad. Sci. USA 2011, 108, 21093–21098. [Google Scholar] [CrossRef] [Green Version]
- Liu, H.; Chu, W.; Gong, L.; Gao, X.; Wang, W. MicroRNA-26b is upregulated in a double transgenic mouse model of Alzheimer’s disease and promotes the expression of amyloid-β by targeting insulin-like growth factor 1. Mol. Med. Rep. 2016, 13, 2809–2814. [Google Scholar] [CrossRef] [Green Version]
- Ubhi, K.; Rockenstein, E.; Kragh, C.; Inglis, C.; Spencer, B.; Michael, S.; Mante, M.; Adame, A.; Galasko, D.; Masliah, E. Widespread microRNA dysregulation in multiple system atrophy-disease-related alteration in miR-96. Eur. J. Neurosci. 2013, 39, 1026–1041. [Google Scholar] [CrossRef] [Green Version]
- Wang, W.-X.; Rajeev, B.W.; Stromberg, A.J.; Ren, N.; Tang, G.; Huang, Q.; Rigoutsos, I.; Nelson, P.T. The Expression of MicroRNA miR-107 Decreases Early in Alzheimer’s Disease and May Accelerate Disease Progression through Regulation of β-Site Amyloid Precursor Protein-Cleaving Enzyme 1. J. Neurosci. 2008, 28, 1213–1223. [Google Scholar] [CrossRef]
- Liu, W.; Zhao, J.; Lu, G. miR-106b inhibits tau phosphorylation at Tyr18 by targeting Fyn in a model of Alzheimer’s disease. Biochem. Biophys. Res. Commun. 2016, 478, 852–857. [Google Scholar] [CrossRef]
- Vilardo, E.; Barbato, C.; Ciotti, M.; Cogoni, C.; Ruberti, F. MicroRNA-101 Regulates Amyloid Precursor Protein Expression in Hippocampal Neurons. J. Biol. Chem. 2010, 285, 18344–18351. [Google Scholar] [CrossRef] [Green Version]
- Hébert, S.; Horré, K.; Nicolaï, L.; Papadopoulou, A.S.; Mandemakers, W.; Silahtaroglu, A.; Kauppinen, S.; Delacourte, A.; De Strooper, B. Loss of microRNA cluster miR-29a/b-1 in sporadic Alzheimer’s disease correlates with increased BACE1/β-secretase expression. Proc. Natl. Acad. Sci. USA 2008, 105, 6415–6420. [Google Scholar] [CrossRef] [Green Version]
- Zhao, Y.; Alexandrov, P.N.; Jaber, V.; Lukiw, W.J. Deficiency in the Ubiquitin Conjugating Enzyme UBE2A in Alzheimer’s Disease (AD) is Linked to Deficits in a Natural Circular miRNA-7 Sponge (circRNA; ciRS-7). Genes 2016, 7, 116. [Google Scholar] [CrossRef] [PubMed] [Green Version]
- Pereira, P.A.; Tomás, J.F.; Queiroz, J.A.; Figueiras, A.R.; Sousa, F. Recombinant pre-miR-29b for Alzheimer’s disease therapeutics. Sci. Rep. 2016, 6, 19946. [Google Scholar] [CrossRef]
- Patel, N.; Hoang, D.; Miller, N.; Ansaloni, S.; Huang, Q.; Rogers, J.T.; Lee, J.C.; Saunders, A.J. MicroRNAs can regulate human APP levels. Mol. Neurodegener. 2008, 3, 10. [Google Scholar] [CrossRef] [PubMed] [Green Version]
- Wang, X.; Tan, L.; Lu, Y.; Peng, J.; Zhu, Y.; Zhang, Y.; Sun, Z. MicroRNA-138 promotes tau phosphorylation by targeting retinoic acid receptor alpha. FEBS Lett. 2015, 589, 726–729. [Google Scholar] [CrossRef] [PubMed] [Green Version]
- Liu, W.; Cai, H.; Lin, M.; Zhu, L.; Gao, L.; Zhong, R.; Bi, S.; Xue, Y.; Shang, X. MicroRNA-107 prevents amyloid-beta induced blood-brain barrier disruption and endothelial cell dysfunction by targeting Endophilin-1. Exp. Cell Res. 2016, 343, 248–257. [Google Scholar] [CrossRef] [PubMed]
- Zheng, D.; Sabbagh, J.J.; Blair, L.; Darling, A.L.; Wen, X.; Dickey, C.A. MicroRNA-511 Binds to FKBP5 mRNA, Which Encodes a Chaperone Protein, and Regulates Neuronal Differentiation. J. Biol. Chem. 2016, 291, 17897–17906. [Google Scholar] [CrossRef] [Green Version]
- Long, J.M.; Lahiri, D.K. MicroRNA-101 downregulates Alzheimer’s amyloid-β precursor protein levels in human cell cultures and is differentially expressed. Biochem. Biophys. Res. Commun. 2011, 404, 889–895. [Google Scholar] [CrossRef] [PubMed] [Green Version]
- Wu, Q.; Ye, X.; Xiong, Y.; Zhu, H.; Miao, J.; Zhang, W.; Wan, J. The Protective Role of microRNA-200c in Alzheimer’s Disease Pathologies Is Induced by Beta Amyloid-Triggered Endoplasmic Reticulum Stress. Front. Mol. Neurosci. 2016, 9, 140. [Google Scholar] [CrossRef] [PubMed] [Green Version]
- Long, J.; Ray, B.; Lahiri, D.K. MicroRNA-339-5p Down-regulates Protein Expression of β-Site Amyloid Precursor Protein-Cleaving Enzyme 1 (BACE1) in Human Primary Brain Cultures and Is Reduced in Brain Tissue Specimens of Alzheimer Disease Subjects. J. Biol. Chem. 2014, 289, 5184–5198. [Google Scholar] [CrossRef] [Green Version]
- Zong, Y.; Wang, H.; Dong, W.; Quan, X.; Zhu, H.; Xu, Y.; Huang, L.; Ma, C.; Qin, C. miR-29c regulates BACE1 protein expression. Brain Res. 2011, 1395, 108–115. [Google Scholar] [CrossRef] [PubMed]
- Zhang, R.; Zhou, H.; Jiang, L.; Mao, Y.; Cui, X.; Xie, B.; Cui, D.; Wang, H.; Zhang, Q.; Xu, S. MiR-195 dependent roles of mitofusin2 in the mitochondrial dysfunction of hippocampal neurons in SAMP8 mice. Brain Res. 2016, 1652, 135–143. [Google Scholar] [CrossRef]
- Stutzmann, G.E. Calcium Dysregulation, IP3 Signaling, and Alzheimer’s Disease. Neuroscientist 2005, 11, 110–115. [Google Scholar] [CrossRef] [PubMed]
- Chang, J.R.; Ghafouri, M.; Mukerjee, R.; Bagashev, A.; Chabrashvili, T.; Sawaya, B.E. Role of p53 in Neurodegenerative Diseases. Neurodegener. Dis. 2012, 9, 68–80. [Google Scholar] [CrossRef] [PubMed] [Green Version]
- Zhang, G.-L.; Zhang, X.; Wang, X.-M.; Li, J.-P. Towards Understanding the Roles of Heparan Sulfate Proteoglycans in Alzheimer’s Disease. BioMed Res. Int. 2014, 2014, 516028. [Google Scholar] [CrossRef] [PubMed] [Green Version]
- Lehrer, S. Glioma and Alzheimer’s Disease. J. Alzheimer’s Dis. Rep. 2018, 2, 213–218. [Google Scholar] [CrossRef] [Green Version]
- Penzes, P.; VanLeeuwen, J.-E. Impaired regulation of synaptic actin cytoskeleton in Alzheimer’s disease. Brain Res. Rev. 2011, 67, 184–192. [Google Scholar] [CrossRef] [PubMed] [Green Version]
- Vasco, V.R.L. The Phosphoinositide Signal Transduction Pathway in the Pathogenesis of Alzheimer’s Disease. Curr. Alzheimer Res. 2018, 15, 355–362. [Google Scholar] [CrossRef]
- Greene, C.; Campbell, M. Tight junction modulation of the blood brain barrier: CNS delivery of small molecules. Tissue Barriers 2016, 4, e1138017. [Google Scholar] [CrossRef] [Green Version]
- Berezin, V.; Walmod, P.S.; Filippov, M.; Dityatev, A. Targeting of ECM molecules and their metabolizing enzymes and receptors for the treatment of CNS diseases. Prog. Brain Res. 2014, 214, 353–388. [Google Scholar] [CrossRef] [PubMed]
- Zhang, T.; Han, Y.; Wang, J.; Hou, D.; Deng, H.; Deng, Y.L.; Song, Z. Comparative Epidemiological Investigation of Alzheimer’s Disease and Colorectal Cancer: The Possible Role of Gastrointestinal Conditions in the Pathogenesis of AD. Front. Aging Neurosci. 2018, 10, 176. [Google Scholar] [CrossRef] [PubMed]
- Caltagarone, J.; Jing, Z.; Bowser, R. Focal adhesions regulate Aβ signaling and cell death in Alzheimer’s disease. Biochim. Biophys. Acta (BBA)—Mol. Basis Dis. 2007, 1772, 438–445. [Google Scholar] [CrossRef] [PubMed] [Green Version]
- Jayaraman, A.; Pike, C.J. Alzheimer’s Disease and Type 2 Diabetes: Multiple Mechanisms Contribute to Interactions. Curr. Diabetes Rep. 2014, 14, 476. [Google Scholar] [CrossRef] [PubMed] [Green Version]
- Maiese, K. Forkhead Transcription Factors: Formulating a FOXO Target for Cognitive Loss. Curr. Neurovasc. Res. 2018, 14, 415–420. [Google Scholar] [CrossRef] [Green Version]
- Martínez, M.; Fernández, E.; Frank, A.; Guaza, C.; de la Fuente, M.; Hernanz, A. Increased cerebrospinal fluid cAMP levels in Alzheimer’s disease. Brain Res. 1999, 846, 265–267. [Google Scholar] [CrossRef] [Green Version]
- Haase, N.; Herse, F.; Spallek, B.; Haase, H.; Morano, I.; Qadri, F.; Szijártó, I.A.; Rohm, I.; Yilmaz, A.; Warrington, J.P.; et al. Amyloid- Peptides Activate 1-Adrenergic Cardiovascular Receptors. Hypertension 2013, 62, 966–972. [Google Scholar] [CrossRef] [Green Version]
- Sevush, S.; Jy, W.; Horstman, L.L.; Mao, W.-W.; Kolodny, L.; Ahn, Y.S. Platelet Activation in Alzheimer Disease. Arch. Neurol. 1998, 55, 530–536. [Google Scholar] [CrossRef] [PubMed]
- Plácido, A.I.; Pereira, C.M.F.; Duarte, A.I.; Candeias, E.; Correia, S.C.; Santos, R.X.; Carvalho, C.; Cardoso, S.; Oliveira, C.R.; Moreira, P.I. The role of endoplasmic reticulum in amyloid precursor protein processing and trafficking: Implications for Alzheimer’s disease. Biochim. Biophys. Acta (BBA)—Mol. Basis Dis. 2014, 1842, 1444–1453. [Google Scholar] [CrossRef] [PubMed] [Green Version]
- Mielke, M.M.; Lyketsos, C.G. Alterations of the Sphingolipid Pathway in Alzheimer’s Disease: New Biomarkers and Treatment Targets? NeuroMol. Med. 2010, 12, 331–340. [Google Scholar] [CrossRef] [PubMed] [Green Version]
- Akasaka-Manya, K.; Manya, H. The Role of APP O-Glycosylation in Alzheimer’s Disease. Biomolecules 2020, 10, 1569. [Google Scholar] [CrossRef] [PubMed]
- Zhu, X.; Lee, H.-G.; Raina, A.K.; Perry, G.; Smith, M.A. The Role of Mitogen-Activated Protein Kinase Pathways in Alzheimer’s Disease. Neurosignals 2002, 11, 270–281. [Google Scholar] [CrossRef] [PubMed]
- Palomer, E.; Buechler, J.; Salinas, P.C. Wnt Signaling Deregulation in the Aging and Alzheimer’s Brain. Front. Cell. Neurosci. 2019, 13, 227. [Google Scholar] [CrossRef] [PubMed]
- McKay, E.C.; Beck, J.S.; Khoo, S.K.; Dykema, K.J.; Cottingham, S.L.; Winn, E.M.; Paulson, H.L.; Lieberman, A.P.; Counts, E.S. Peri-Infarct Upregulation of the Oxytocin Receptor in Vascular Dementia. J. Neuropathol. Exp. Neurol. 2019, 78, 436–452. [Google Scholar] [CrossRef] [PubMed]
- Malik, M.; Chiles, J.; Xi, H.S.; Medway, C.; Simpson, J.F.; Potluri, S.; Howard, D.S.; Liang, Y.; Paumi, C.M.; Mukherjee, S.; et al. Genetics of CD33 in Alzheimer’s disease and acute myeloid leukemia. Hum. Mol. Genet. 2015, 24, 3557–3570. [Google Scholar] [CrossRef] [Green Version]
- Oddo, S. The role of mTOR signaling in Alzheimer disease. Front. Biosci. 2012, 4, 941–952. [Google Scholar] [CrossRef] [Green Version]
- Angeli, S.; Kousiappa, I.; Stavrou, M.; Sargiannidou, I.; Georgiou, E.; Papacostas, S.S.; Kleopa, K.A. Altered Expression of Glial Gap Junction Proteins Cx43, Cx30, and Cx47 in the 5XFAD Model of Alzheimer’s Disease. Front. Neurosci. 2020, 14, 582934. [Google Scholar] [CrossRef]
- Woo, R.-S.; Lee, J.-H.; Yu, H.-N.; Song, D.-Y.; Baik, T.-K. Expression of ErbB4 in the neurons of Alzheimer’s disease brain and APP/PS1 mice, a model of Alzheimer’s disease. Anat. Cell Biol. 2011, 44, 116–127. [Google Scholar] [CrossRef] [PubMed] [Green Version]
- Curtis, D.; Bandyopadhyay, S. Mini-review: Role of the PI3K/Akt pathway and tyrosine phosphatases in Alzheimer’s disease susceptibility. Ann. Hum. Genet. 2020, 85, 1–6. [Google Scholar] [CrossRef] [PubMed]
- Monsonego, A.; Nemirovsky, A.; Harpaz, I. CD4 T cells in immunity and immunotherapy of Alzheimer’s disease. Immunology 2013, 139, 438–446. [Google Scholar] [CrossRef] [PubMed] [Green Version]
- Watson, J.J.; Dawbarn, D. The Neurotrophins and Their Role in Alzheimers Disease. Curr. Neuropharmacol. 2011, 9, 559–573. [Google Scholar] [CrossRef] [Green Version]
- Bernhardi, R.E.; Ecornejo, F.; Parada, G.E.; Eeugenin, J. Role of TGFβ signaling in the pathogenesis of Alzheimer’s disease. Front. Cell. Neurosci. 2015, 9, 426. [Google Scholar] [CrossRef] [PubMed] [Green Version]
- Uddin, S.; Rahman, M.; Jakaria, M.S.; Rahman, S.; Hossain, S.; Islam, A.; Ahmed, M.; Mathew, B.; Omar, U.M.; Barreto, G.E.; et al. Estrogen Signaling in Alzheimer’s Disease: Molecular Insights and Therapeutic Targets for Alzheimer’s Dementia. Mol. Neurobiol. 2020, 57, 2654–2670. [Google Scholar] [CrossRef]
- Choi, H.G.; Soh, J.S.; Lim, J.S.; Sim, S.Y.; Lee, S.W. Association between dementia and hepatitis B and C virus infection. Medicine 2021, 100, e26476. [Google Scholar] [CrossRef] [PubMed]
- Zhang, L.; Qi, Z.; Li, J.; Li, M.; Du, X.; Wang, S.; Zhou, G.; Xu, B.; Liu, W.; Xi, S.; et al. Roles and Mechanisms of Axon-Guidance Molecules in Alzheimer’s Disease. Mol. Neurobiol. 2021, 58, 3290–3307. [Google Scholar] [CrossRef] [PubMed]
- Yamazaki, Y.; Shinohara, M.; Shinohara, M.; Yamazaki, A.; Murray, M.; Liesinger, A.M.; Heckman, M.G.; Lesser, E.R.; Parisi, E.J.; Petersen, R.C.; et al. Selective loss of cortical endothelial tight junction proteins during Alzheimer’s disease progression. Brain 2019, 142, 1077–1092. [Google Scholar] [CrossRef] [PubMed]
- Hong, C.; Jeong, B.; Park, H.J.; Chung, J.Y.; Lee, J.E.; Kim, J.; Shin, Y.-C.; So, I. TRP Channels as Emerging Therapeutic Targets for Neurodegenerative Diseases. Front. Physiol. 2020, 11, 238. [Google Scholar] [CrossRef] [Green Version]
- Kirouac, L.; Rajic, A.J.; Cribbs, D.H.; Padmanabhan, J. Activation of Ras-ERK Signaling and GSK-3 by Amyloid Precursor Protein and Amyloid Beta Facilitates Neurodegeneration in Alzheimer’s Disease. ENeuro 2017, 4. [Google Scholar] [CrossRef] [PubMed] [Green Version]
- Huh, S.; Baek, S.-J.; Lee, K.-H.; Whitcomb, D.J.; Jo, J.; Choi, S.-M.; Kim, N.H.; Park, M.-S.; Lee, K.H.; Kim, B.C. The reemergence of long-term potentiation in aged Alzheimer’s disease mouse model. Sci. Rep. 2016, 6, 29152. [Google Scholar] [CrossRef] [PubMed] [Green Version]
- Nixon, R.A. Endosome function and dysfunction in Alzheimer’s disease and other neurodegenerative diseases. Neurobiol. Aging 2005, 26, 373–382. [Google Scholar] [CrossRef]
- Nguyen, H.D.; Yu, B.P.; Hoang, N.H.M.; Jo, W.H.; Chung, H.Y.; Kim, M.-S. Prolactin and its altered action in Alzheimer’s disease and Parkinson’s disease. Neuroendocrinology 2021. [Google Scholar] [CrossRef]
- Wang, X.; Zimmermann, H.R.; Ma, T. Therapeutic Potential of AMP-Activated Protein Kinase in Alzheimer’s Disease. J. Alzheimer’s Dis. 2019, 68, 33–38. [Google Scholar] [CrossRef]
- Sanders, O.; Rajagopal, L. Phosphodiesterase Inhibitors for Alzheimer’s Disease: A Systematic Review of Clinical Trials and Epidemiology with a Mechanistic Rationale. J. Alzheimer’s Dis. Rep. 2020, 4, 185–215. [Google Scholar] [CrossRef] [PubMed]
- Gabbouj, S.; Ryhänen, S.; Marttinen, M.; Wittrahm, R.; Takalo, M.; Kemppainen, S.; Martiskainen, H.; Tanila, H.; Haapasalo, A.; Hiltunen, M.; et al. Altered Insulin Signaling in Alzheimer’s Disease Brain—Special Emphasis on PI3K-Akt Pathway. Front. Neurosci. 2019, 13, 629. [Google Scholar] [CrossRef]
- Irwin, M.; Tare, M.; Singh, A.; Puli, O.R.; Gogia, N.; Riccetti, M.; Deshpande, P.; Kango-Singh, M.; Singh, A. A Positive Feedback Loop of Hippo- and c-Jun-Amino-Terminal Kinase Signaling Pathways Regulates Amyloid-Beta-Mediated Neurodegeneration. Front. Cell Dev. Biol. 2020, 8, 117. [Google Scholar] [CrossRef] [PubMed] [Green Version]
- Park, Y.H.; Hodges, A.; Risacher, S.L.; Lin, K.; Jang, J.-W.; Ahn, S.; Kim, S.; Lovestone, S.; Simmons, A.; Weiner, M.W.; et al. Dysregulated Fc gamma receptor–mediated phagocytosis pathway in Alzheimer’s disease: Network-based gene expression analysis. Neurobiol. Aging 2019, 88, 24–32. [Google Scholar] [CrossRef] [PubMed] [Green Version]
- Maillet, M.; Robert, S.J.; Cacquevel, M.; Gastineau, M.; Vivien, D.; Bertoglio, J.; Zugaza, J.L.; Fischmeister, R.; Lezoualc’h, F. Crosstalk between Rap1 and Rac regulates secretion of sAPPα. Nature 2003, 5, 633–639. [Google Scholar] [CrossRef]
- Vogrinc, D.; Goričar, K.; Kunej, T.; Dolžan, V. Systematic Search for Novel Circulating Biomarkers Associated with Extracellular Vesicles in Alzheimer’s Disease: Combining Literature Screening and Database Mining Approaches. J. Pers. Med. 2021, 11, 946. [Google Scholar] [CrossRef] [PubMed]
- Das, B.; Yan, R. Role of BACE1 in Alzheimer’s synaptic function. Transl. Neurodegener. 2017, 6, 23. [Google Scholar] [CrossRef]
- O’Brien, R.J.; Wong, P.C. Amyloid Precursor Protein Processing and Alzheimer’s Disease. Annu. Rev. Neurosci. 2011, 34, 185–204. [Google Scholar] [CrossRef] [Green Version]
- Kaether, C.; Haass, C.; Steiner, H. Assembly, Trafficking and Function of γ-Secretase. Neurodegener. Dis. 2006, 3, 275–283. [Google Scholar] [CrossRef] [Green Version]
- Yoon, H.; Shin, S.-H.; Shin, D.H.; Chun, Y.-S.; Park, J.-W. Differential roles of Sirt1 in HIF-1α and HIF-2α mediated hypoxic responses. Biochem. Biophys. Res. Commun. 2014, 444, 36–43. [Google Scholar] [CrossRef]
- Kleszka, K.; Leu, T.; Quinting, T.; Jastrow, H.; Pechlivanis, S.; Fandrey, J.; Schreiber, T. Hypoxia-inducible factor-2α is crucial for proper brain development. Sci. Rep. 2020, 10, 19146. [Google Scholar] [CrossRef]
- Elalla, R.; Edonmez, G. The role of sirtuins in Alzheimer’s disease. Front. Aging Neurosci. 2013, 5, 16. [Google Scholar] [CrossRef] [Green Version]
- Citron, B.A.; Dennis, J.S.; Zeitlin, R.S.; Echeverria, V. Transcription factor Sp1 dysregulation in Alzheimer’s disease. J. Neurosci. Res. 2008, 86, 2499–2504. [Google Scholar] [CrossRef]
- Knafo, S.; Sánchez-Puelles, C.; Palomer, E.; Delgado, I.; Draffin, E.J.; Mingo, J.; Wahle, T.; Kaleka, K.; Mou, L.; Pereda-Perez, I.; et al. PTEN recruitment controls synaptic and cognitive function in Alzheimer’s models. Nat. Neurosci. 2016, 19, 443–453. [Google Scholar] [CrossRef]
- Frere, S.; Slutsky, I. Targeting PTEN interactions for Alzheimer’s disease. Nat. Neurosci. 2016, 19, 416–418. [Google Scholar] [CrossRef]
- Chen, D.; Hao, S.; Xu, J. Revisiting the Relationship between Alzheimer’s Disease and Cancer with a circRNA Perspective. Front. Cell Dev. Biol. 2021, 9, 647197. [Google Scholar] [CrossRef]
- Ou, S.-M.; Lee, Y.-J.; Hu, Y.-W.; Liu, C.-J.; Chen, T.-J.; Fuh, J.-L.; Wang, S.-J. Does Alzheimer’s Disease Protect against Cancers? A Nationwide Population-Based Study. Neuroepidemiology 2013, 40, 42–49. [Google Scholar] [CrossRef] [PubMed]
- Driver, A.J.; Beiser, A.; Au, R.; Kreger, E.B.; Splansky, G.L.; Kurth, T.; Kiel, D.; Lu, K.P.; Seshadri, S.; Wolf, A.P. Inverse association between cancer and Alzheimer’s disease: Results from the Framingham Heart Study. BMJ 2012, 344, e1442. [Google Scholar] [CrossRef] [PubMed] [Green Version]
- Liu, T.; Ren, D.; Zhu, X.; Yin, Z.; Jin, G.; Zhao, Z.; Robinson, D.; Li, X.; Wong, K.; Cui, K.; et al. Transcriptional signaling pathways inversely regulated in Alzheimer’s disease and glioblastoma multiform. Sci. Rep. 2013, 3, 3467. [Google Scholar] [CrossRef] [Green Version]
- Musicco, M.; Adorni, F.; Di Santo, S.; Prinelli, F.; Pettenati, C.; Caltagirone, C.; Palmer, K.; Russo, A. Inverse occurrence of cancer and Alzheimer disease: A population-based incidence study. Neurology 2013, 81, 322–328. [Google Scholar] [CrossRef] [PubMed]
- Calabrò, M.; Rinaldi, C.; Santoro, G.; Crisafulli, C. The biological pathways of Alzheimer disease: A review. AIMS Neurosci. 2021, 8, 86–132. [Google Scholar] [CrossRef] [PubMed]
- Caruana, E.J.; Roman, M.; Hernández-Sánchez, J.; Solli, P. Longitudinal studies. J. Thorac. Dis. 2015, 7, E537. [Google Scholar] [CrossRef] [PubMed]
- Wang, Z.; Qin, W.; Wei, C.; Tang, Y.; Zhao, L.; Jin, H.; Li, Y.; Wang, Q.; Luan, X.; He, J.; et al. The microRNA-1908 up-regulation in the peripheral blood cells impairs amyloid clearance by targeting ApoE. Int. J. Geriatr. Psychiatry 2018, 33, 980–986. [Google Scholar] [CrossRef] [Green Version]
- Giri, M.; Lü, Y.; Zhang, M. Genes associated with Alzheimer’s disease: An overview and current status. Clin. Interv. Aging 2016, 11, 665–681. [Google Scholar] [CrossRef] [Green Version]
- Deng, H.; Lv, L.; Li, Y.; Zhang, C.; Meng, F.; Pu, Y.; Xiao, J.; Qian, L.; Zhao, W.; Liu, Q.; et al. The miR-193a-3p regulated PSEN1 gene suppresses the multi-chemoresistance of bladder cancer. Biochim. Biophys. Acta (BBA)—Mol. Basis Dis. 2014, 1852, 520–528. [Google Scholar] [CrossRef] [PubMed] [Green Version]
- Robinson, R.A.S.; Amin, B.; Guest, P.C. Multiplexing Biomarker Methods, Proteomics and Considerations for Alzheimer’s Disease. Proteom. Methods Neuropsychiatry Res. 2017, 974, 21–48. [Google Scholar] [CrossRef]
- Maoz, R.; Garfinkel, B.P.; Soreq, H. Alzheimer’s Disease and ncRNAs. Neuroepigenom. Aging Dis. 2017, 978, 337–361. [Google Scholar] [CrossRef]
- Lugli, G.; Cohen, A.M.; Bennett, D.A.; Shah, R.; Fields, C.; Hernandez, A.G.; Smalheiser, N.R. Plasma Exosomal miRNAs in Persons with and without Alzheimer Disease: Altered Expression and Prospects for Biomarkers. PLoS ONE 2015, 10, e0139233. [Google Scholar] [CrossRef] [Green Version]
- Leidinger, P.; Backes, C.; Deutscher, S.; Schmitt, K.; Mueller, S.C.; Frese, K.; Haas, J.; Ruprecht, K.; Paul, F.; Stähler, C.; et al. A blood based 12-miRNA signature of Alzheimer disease patients. Genome Biol. 2013, 14, R78. [Google Scholar] [CrossRef] [Green Version]
- Zetterberg, H.; Burnham, S.C. Blood-based molecular biomarkers for Alzheimer’s disease. Mol. Brain 2019, 12, 26. [Google Scholar] [CrossRef]
- Zhao, Y.; Bhattacharjee, S.; Jones, B.M.; Dua, P.; Alexandrov, P.N.; Hill, J.M.; Lukiw, W.J. Regulation of TREM2 expression by an NF-ĸB-sensitive miRNA-34a. NeuroReport 2013, 24, 318–323. [Google Scholar] [CrossRef] [PubMed] [Green Version]


| miRNA | Target Gene Symbol | Target Gene (Entrez Gene ID) | Reference (PMID) |
|---|---|---|---|
| hsa-miR-20a-5p | E2F1 | 1869 | 19110058 [39] |
| hsa-miR-146a-5p | CFH | 3075 | 18801740 [51] |
| hsa-miR-106b-5p | APP | 351 | 19110058 [39] |
| hsa-miR-101-3p | APP | 351 | 20395292 [59] |
| hsa-miR-101-3p | APP | 351 | 21172309 [67] |
| hsa-miR-29b-3p | SP1 | 6667 | 23435408 [32] |
| hsa-miR-146a-5p | IRAK1 | 3654 | 23952003 [43] |
| hsa-miR-107 | BACE1 | 23621 | 18234899 [57] |
| hsa-miR-107 | BACE1 | 23621 | 20489155 [42] |
| hsa-miR-29b-3p | BACE1 | 23621 | 18434550 [60] |
| hsa-miR-29b-3p | BACE1 | 23621 | 26818210 [62] |
| hsa-miR-146a-5p | ROCK1 | 6093 | 27221467 [48] |
| hsa-miR-205-5p | LRP1 | 4035 | 19665999 [40] |
| hsa-miR-9-5p | BACE1 | 23621 | 18434550 [60] |
| hsa-miR-29a-3p | BACE1 | 23621 | 18434550 [60] |
| hsa-miR-520c-3p | APP | 351 | 18684319 [63] |
| hsa-miR-106a-5p | APP | 351 | 19110058 [39] |
| hsa-miR-106a-5p | APP | 351 | 18684319 [63] |
| hsa-miR-34a-5p | BCL2 | 596 | 19683563 [49] |
| hsa-miR-20a-5p | APP | 351 | 19110058 [39] |
| hsa-miR-17-5p | APP | 351 | 19110058 [39] |
| hsa-miR-125b-5p | CDKN2A | 1029 | 20347935 [50] |
| hsa-miR-107 | GRN | 2896 | 20489155 [42] |
| hsa-miR-125b-5p | PPP1CA | 5499 | 25001178 [34] |
| hsa-miR-34a-5p | SYT1 | 6857 | 22160687 [54] |
| hsa-miR-34a-5p | STX1A | 6804 | 22160687 [54] |
| hsa-miR-29a-3p | NAV3 | 89795 | 20202123 [27] |
| hsa-miR-375 | SP1 | 6667 | 23435408 [32] |
| hsa-miR-181c-5p | TRIM2 | 23321 | 21720722 [37] |
| hsa-miR-181c-5p | SIRT1 | 23411 | 21720722 [37] |
| hsa-miR-9-5p | SIRT1 | 23411 | 21720722 [37] |
| hsa-miR-9-5p | TGFBI | 7045 | 21720722 [37] |
| hsa-miR-181c-5p | BTBD3 | 22903 | 21720722 [37] |
| hsa-miR-22-3p | RCOR1 | 23186 | 23349832 [47] |
| hsa-miR-29c-3p | BACE1 | 23621 | 21565331 [70] |
| hsa-miR-29c-3p | BACE1 | 23621 | 25973041 [29] |
| hsa-miR-16-5p | APP | 351 | 26440600 [46] |
| hsa-miR-138-5p | RARA | 5914 | 25680531 [64] |
| hsa-miR-125b-5p | BCL2L2 | 599 | 25001178 [34] |
| hsa-miR-106a-5p | STAT3 | 6774 | 23399684 [31] |
| hsa-miR-132-5p | FOXO1 | 2308 | 24014289 [53] |
| hsa-miR-96-5p | SLC1A1 | 6505 | 24304186 [56] |
| hsa-miR-96-5p | SLC6A6 | 6533 | 24304186 [56] |
| hsa-miR-195-3p | MFN2 | 9927 | 27693395 [71] |
| hsa-miR-26b-5p | RB1 | 5925 | 24027266 [33] |
| hsa-miR-339-5p | BACE1 | 23621 | 24352696 [69] |
| hsa-miR-214-3p | BAX | 581 | 23408966 [35] |
| hsa-miR-455-5p | NCSTN | 23385 | 25100943 [30] |
| hsa-miR-186-5p | NCSTN | 23385 | 25100943 [30] |
| hsa-miR-24-3p | NCSTN | 23385 | 25100943 [30] |
| hsa-miR-125b-5p | DUSP6 | 1848 | 25001178 [34] |
| hsa-miR-107 | SH3GL2 | 6456 | 27038654 [65] |
| hsa-miR-511-5p | FKBP5 | 2289 | 27334923 [66] |
| hsa-miR-299-5p | ATG5 | 9474 | 27080144 [52] |
| hsa-miR-98-5p | SNX6 | 58533 | 27541017 [28] |
| hsa-miR-16-5p | BACE1 | 23621 | 26440600 [46] |
| hsa-miR-16-5p | NCSTN | 23385 | 26440600 [46] |
| hsa-miR-106b-5p | FYN | 2534 | 27520374 [58] |
| hsa-miR-26b-5p | IGF1 | 3479 | 26847596 [55] |
| hsa-miR-302a-3p | PTEN | 5728 | 26890744 [41] |
| hsa-miR-9-5p | CAMKK2 | 10645 | 27394443 [45] |
| hsa-miR-200c-3p | PTEN | 5728 | 28008308 [68] |
| hsa-miR-146a-5p | LRP2 | 4036 | 27241555 [38] |
| hsa-miR-7-5p | UBE2A | 7319 | 27929395 [61] |
| hsa-miR-613 | BDNF | 627 | 27545218 [44] |
| hsa-miR-1229-3p | SORL1 | 6653 | 27328823 [36] |
| KEGG Pathway | p-Value | Number of Genes | Number of miRNAs | PMID (Reference) |
|---|---|---|---|---|
| Axon guidance | 2.03 × 10⁻⁸ | 94 | 35 | 33675023 [103] |
| Glioma | 2.38 × 10⁻⁸ | 51 | 36 | 30560246 [75] |
| ErbB signaling pathway | 3.03 × 10⁻⁸ | 71 | 37 | 21829755 [96] |
| Adherens junction | 3.23 × 10⁻⁸ | 61 | 35 | 27141420 [78] |
| Hippo signaling pathway | 5.39 × 10⁻⁸ | 110 | 34 | 32232042 [113] |
| Endocytosis | 4.19 × 10⁻⁷ | 142 | 37 | 15639316 [108] |
| TGF-beta signaling pathway | 1.05 × 10⁻⁶ | 57 | 33 | 26578886 [100] |
| Rap1 signaling pathway | 3.20 × 10⁻⁶ | 143 | 36 | 12819788 [115] |
| Focal adhesion | 9.32 × 10⁻⁶ | 141 | 37 | 17215111 [81] |
| Neurotrophin signaling pathway | 1.16 × 10⁻⁵ | 88 | 36 | 22654716 [99] |
| PI3K-Akt signaling pathway | 1.45 × 10⁻⁵ | 216 | 37 | 33258115 [97] |
| ECM-receptor interaction | 1.93 × 10⁻⁵ | 54 | 33 | 25410365 [79] |
| Ras signaling pathway | 1.93 × 10⁻⁵ | 142 | 36 | 28374012 [106] |
| Phosphatidylinositol signaling system | 2.28 × 10⁻⁵ | 59 | 35 | 28847278 [77] |
| Adrenergic signaling in cardiomyocytes | 2.28 × 10⁻⁵ | 97 | 36 | 24001898 [85] |
| Acute myeloid leukemia | 2.53 × 10⁻⁵ | 45 | 37 | 25762156 [93] |
| Mucin type O-Glycan biosynthesis | 2.54 × 10⁻⁵ | 20 | 26 | 33218200 [89] |
| MAPK signaling pathway | 2.54 × 10⁻⁵ | 168 | 37 | 12566928 [90] |
| Estrogen signaling pathway | 6.29 × 10⁻⁵ | 67 | 36 | 32297302 [101] |
| Regulation of actin cytoskeleton | 8.73 × 10⁻⁵ | 141 | 37 | 21276817 [76] |
| Wnt signaling pathway | 0.000213 | 96 | 33 | 31191253 [91] |
| AMPK signaling pathway | 0.000262 | 86 | 35 | 30776001 [110] |
| Colorectal cancer | 0.000271 | 47 | 34 | 30323761 [80] |
| mTOR signaling pathway | 0.000283 | 47 | 37 | 22202101 [94] |
| Oxytocin signaling pathway | 0.000283 | 103 | 37 | 30990880 [92] |
| Prolactin signaling pathway | 0.000645 | 49 | 37 | 34126620 [109] |
| FoxO signaling pathway | 0.001453 | 90 | 36 | 29149835 [83] |
| Hepatitis B | 0.001453 | 90 | 36 | 34398003 [102] |
| cGMP-PKG signaling pathway | 0.001614 | 108 | 36 | 32715279 [111] |
| Tight junction | 0.00311 | 87 | 36 | 30770921 [104] |
| Long-term potentiation | 0.004575 | 48 | 34 | 27377368 [107] |
| Sphingolipid signaling pathway | 0.006623 | 75 | 36 | 20571935 [88] |
| T cell receptor signaling pathway | 0.006678 | 69 | 36 | 23534386 [98] |
| Insulin signaling pathway | 0.008818 | 90 | 37 | 31275108 [112] |
| Protein processing in endoplasmic reticulum | 0.009068 | 102 | 35 | 24832819 [87] |
| Gap junction | 0.012445 | 58 | 35 | 33117125 [95] |
| Inositol phosphate metabolism | 0.016986 | 42 | 32 | 15746379 [72] |
| Inflammatory mediator regulation of TRP channels | 0.018347 | 64 | 33 | 32351395 [105] |
| Platelet activation | 0.018347 | 80 | 36 | 9561982 [86] |
| Glycosaminoglycan biosynthesis—heparan sulfate/heparin | 0.02388 | 16 | 24 | 25157361 [74] |
| cAMP signaling pathway | 0.024452 | 121 | 36 | 10556645 [84] |
| Type II diabetes mellitus | 0.031105 | 33 | 34 | 24526623 [82] |
| p53 signaling pathway | 0.03515 | 46 | 35 | 22042001 [73] |
| Fc gamma R-mediated phagocytosis | 0.040459 | 59 | 36 | 31901293 [114] |
Publisher’s Note: MDPI stays neutral with regard to jurisdictional claims in published maps and institutional affiliations. |
© 2021 by the authors. Licensee MDPI, Basel, Switzerland. This article is an open access article distributed under the terms and conditions of the Creative Commons Attribution (CC BY) license (https://creativecommons.org/licenses/by/4.0/).
Share and Cite
Turk, A.; Kunej, T.; Peterlin, B. MicroRNA-Target Interaction Regulatory Network in Alzheimer’s Disease. J. Pers. Med. 2021, 11, 1275. https://doi.org/10.3390/jpm11121275
Turk A, Kunej T, Peterlin B. MicroRNA-Target Interaction Regulatory Network in Alzheimer’s Disease. Journal of Personalized Medicine. 2021; 11(12):1275. https://doi.org/10.3390/jpm11121275
Chicago/Turabian StyleTurk, Aleksander, Tanja Kunej, and Borut Peterlin. 2021. "MicroRNA-Target Interaction Regulatory Network in Alzheimer’s Disease" Journal of Personalized Medicine 11, no. 12: 1275. https://doi.org/10.3390/jpm11121275
APA StyleTurk, A., Kunej, T., & Peterlin, B. (2021). MicroRNA-Target Interaction Regulatory Network in Alzheimer’s Disease. Journal of Personalized Medicine, 11(12), 1275. https://doi.org/10.3390/jpm11121275