
Effective Connectivity between Major Nodes of the Limbic System, Salience and Frontoparietal Networks Differentiates Schizophrenia and Mood Disorders from Healthy Controls

 ,
,  , , ,
, , ,  and
and
Abstract
:1. Introduction
2. Subjects and Methods
2.1. Subjects
2.2. Resting State MRI Acquisition and Analysis
2.3. Statistical Analysis
3. Results
3.1. Sociodemographic Data
3.2. Connectome Features in Patients versus Controls
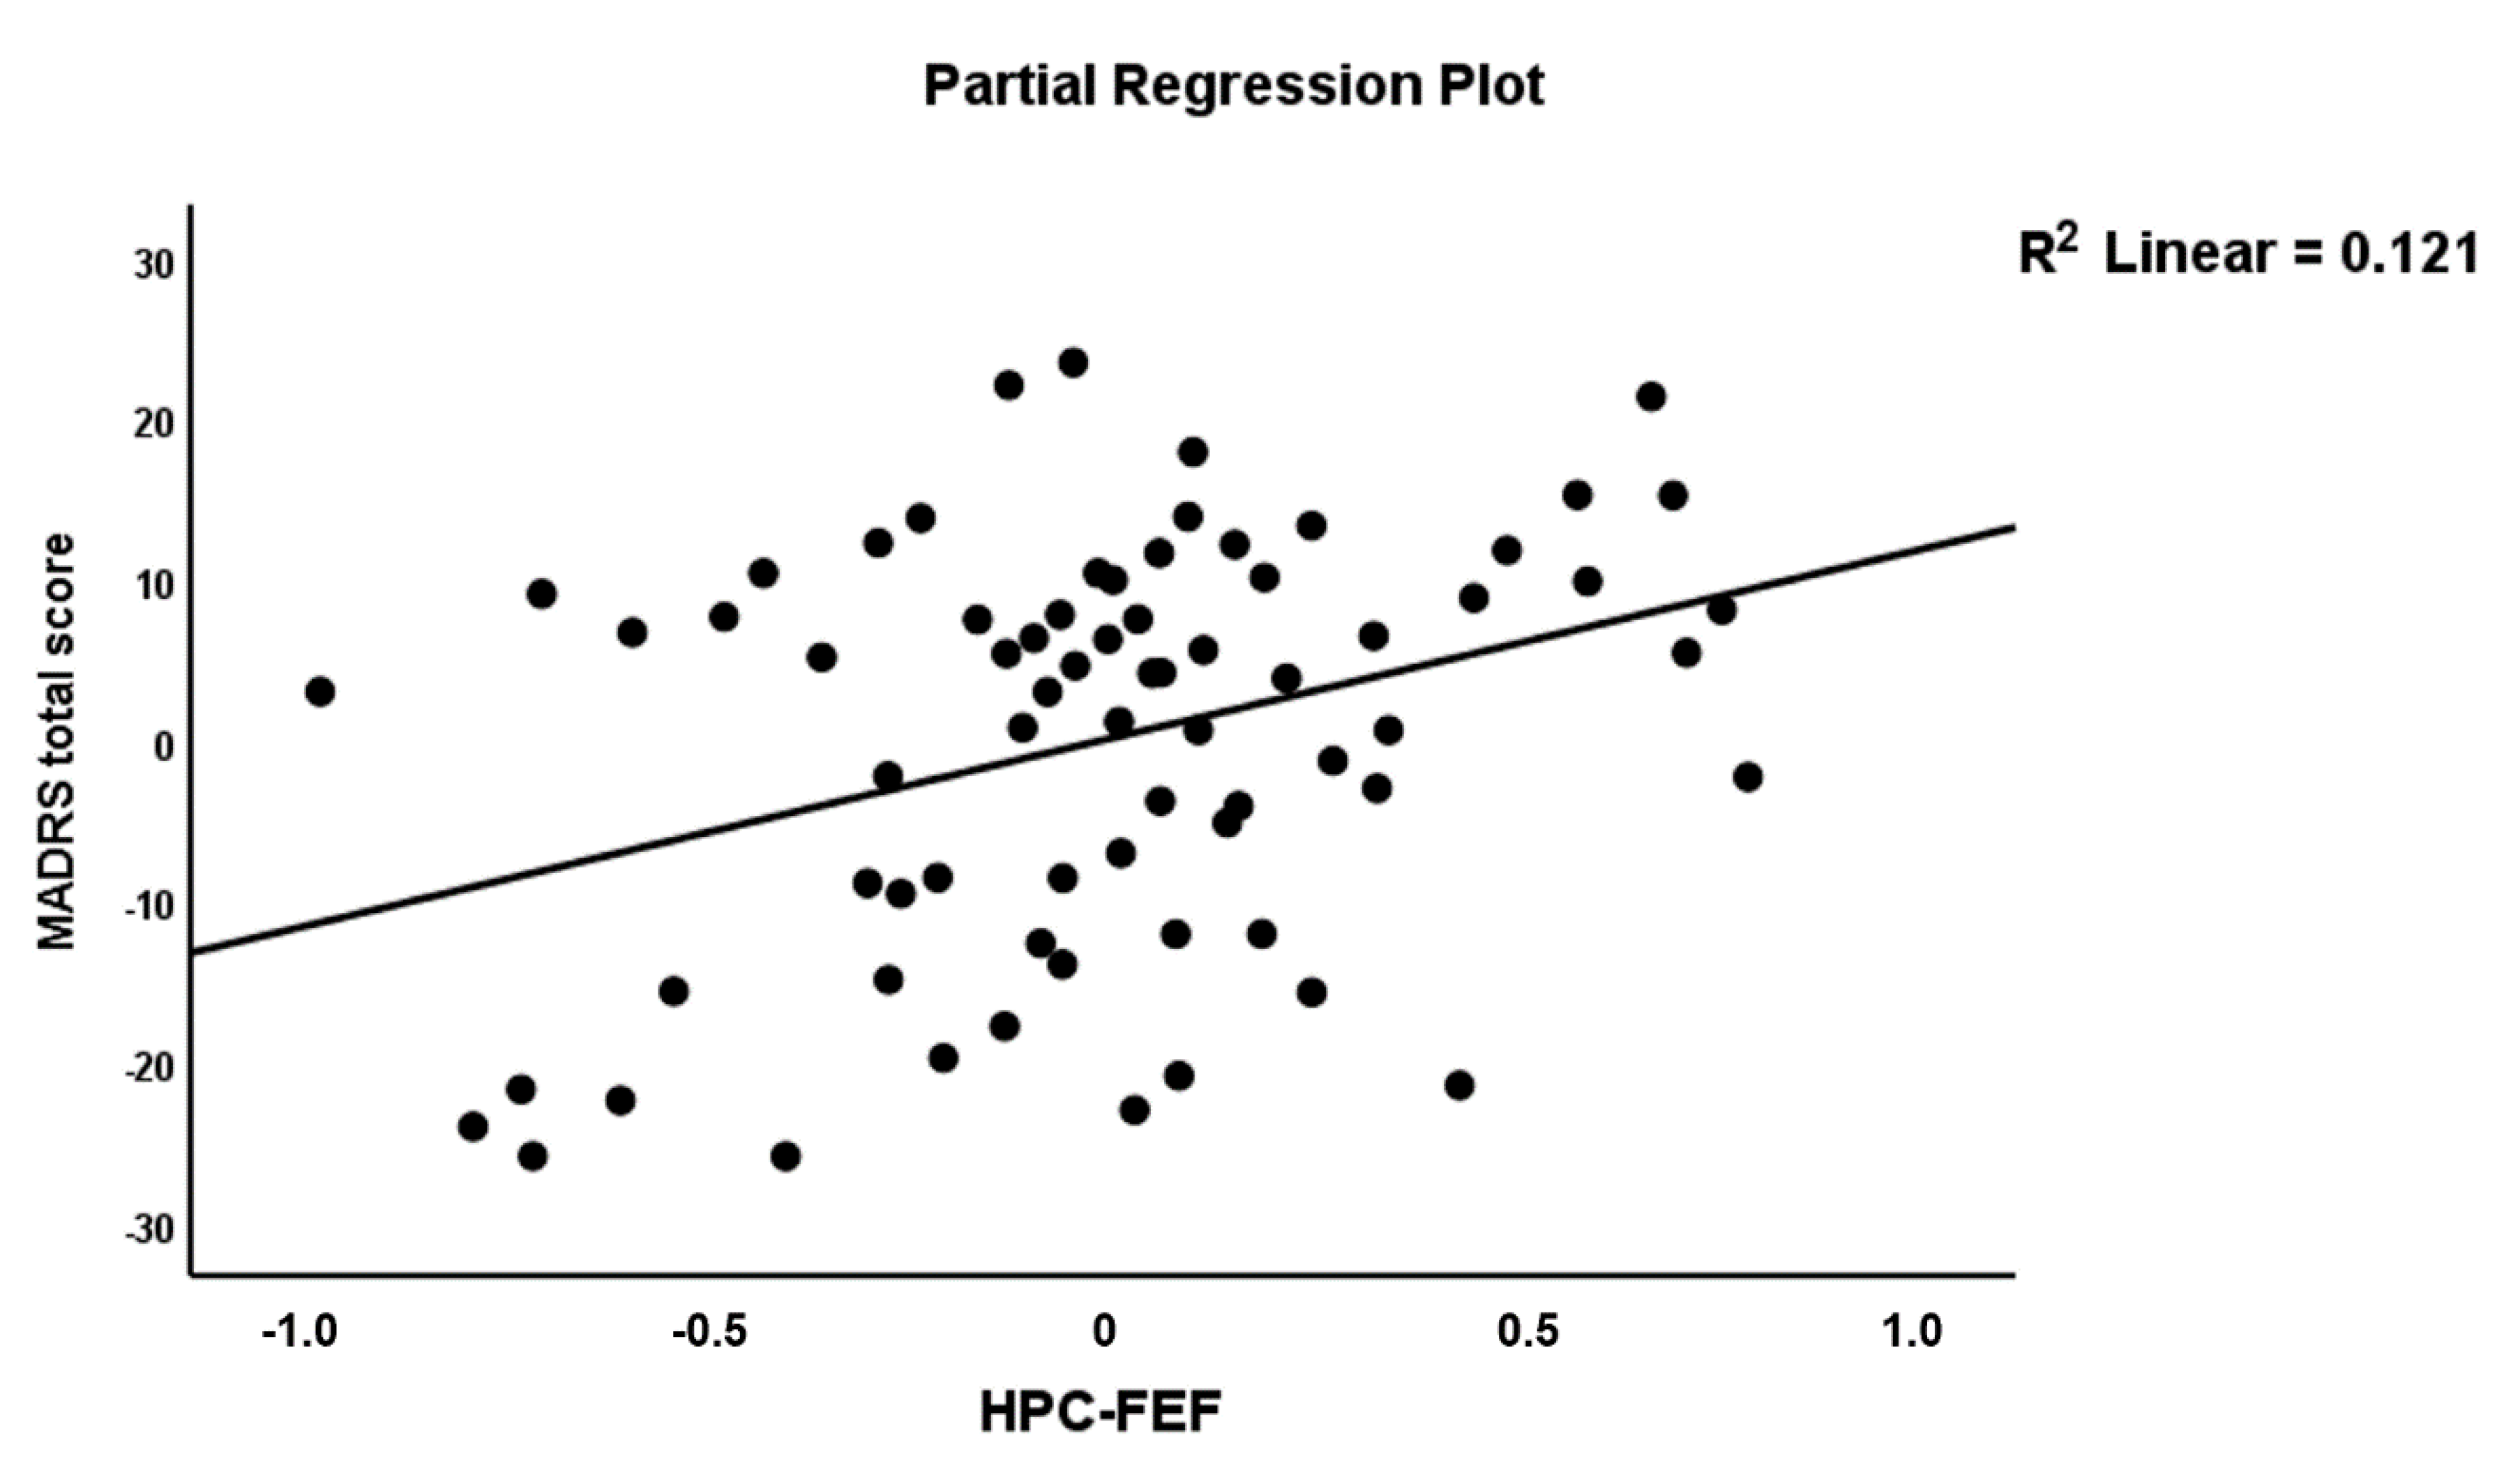
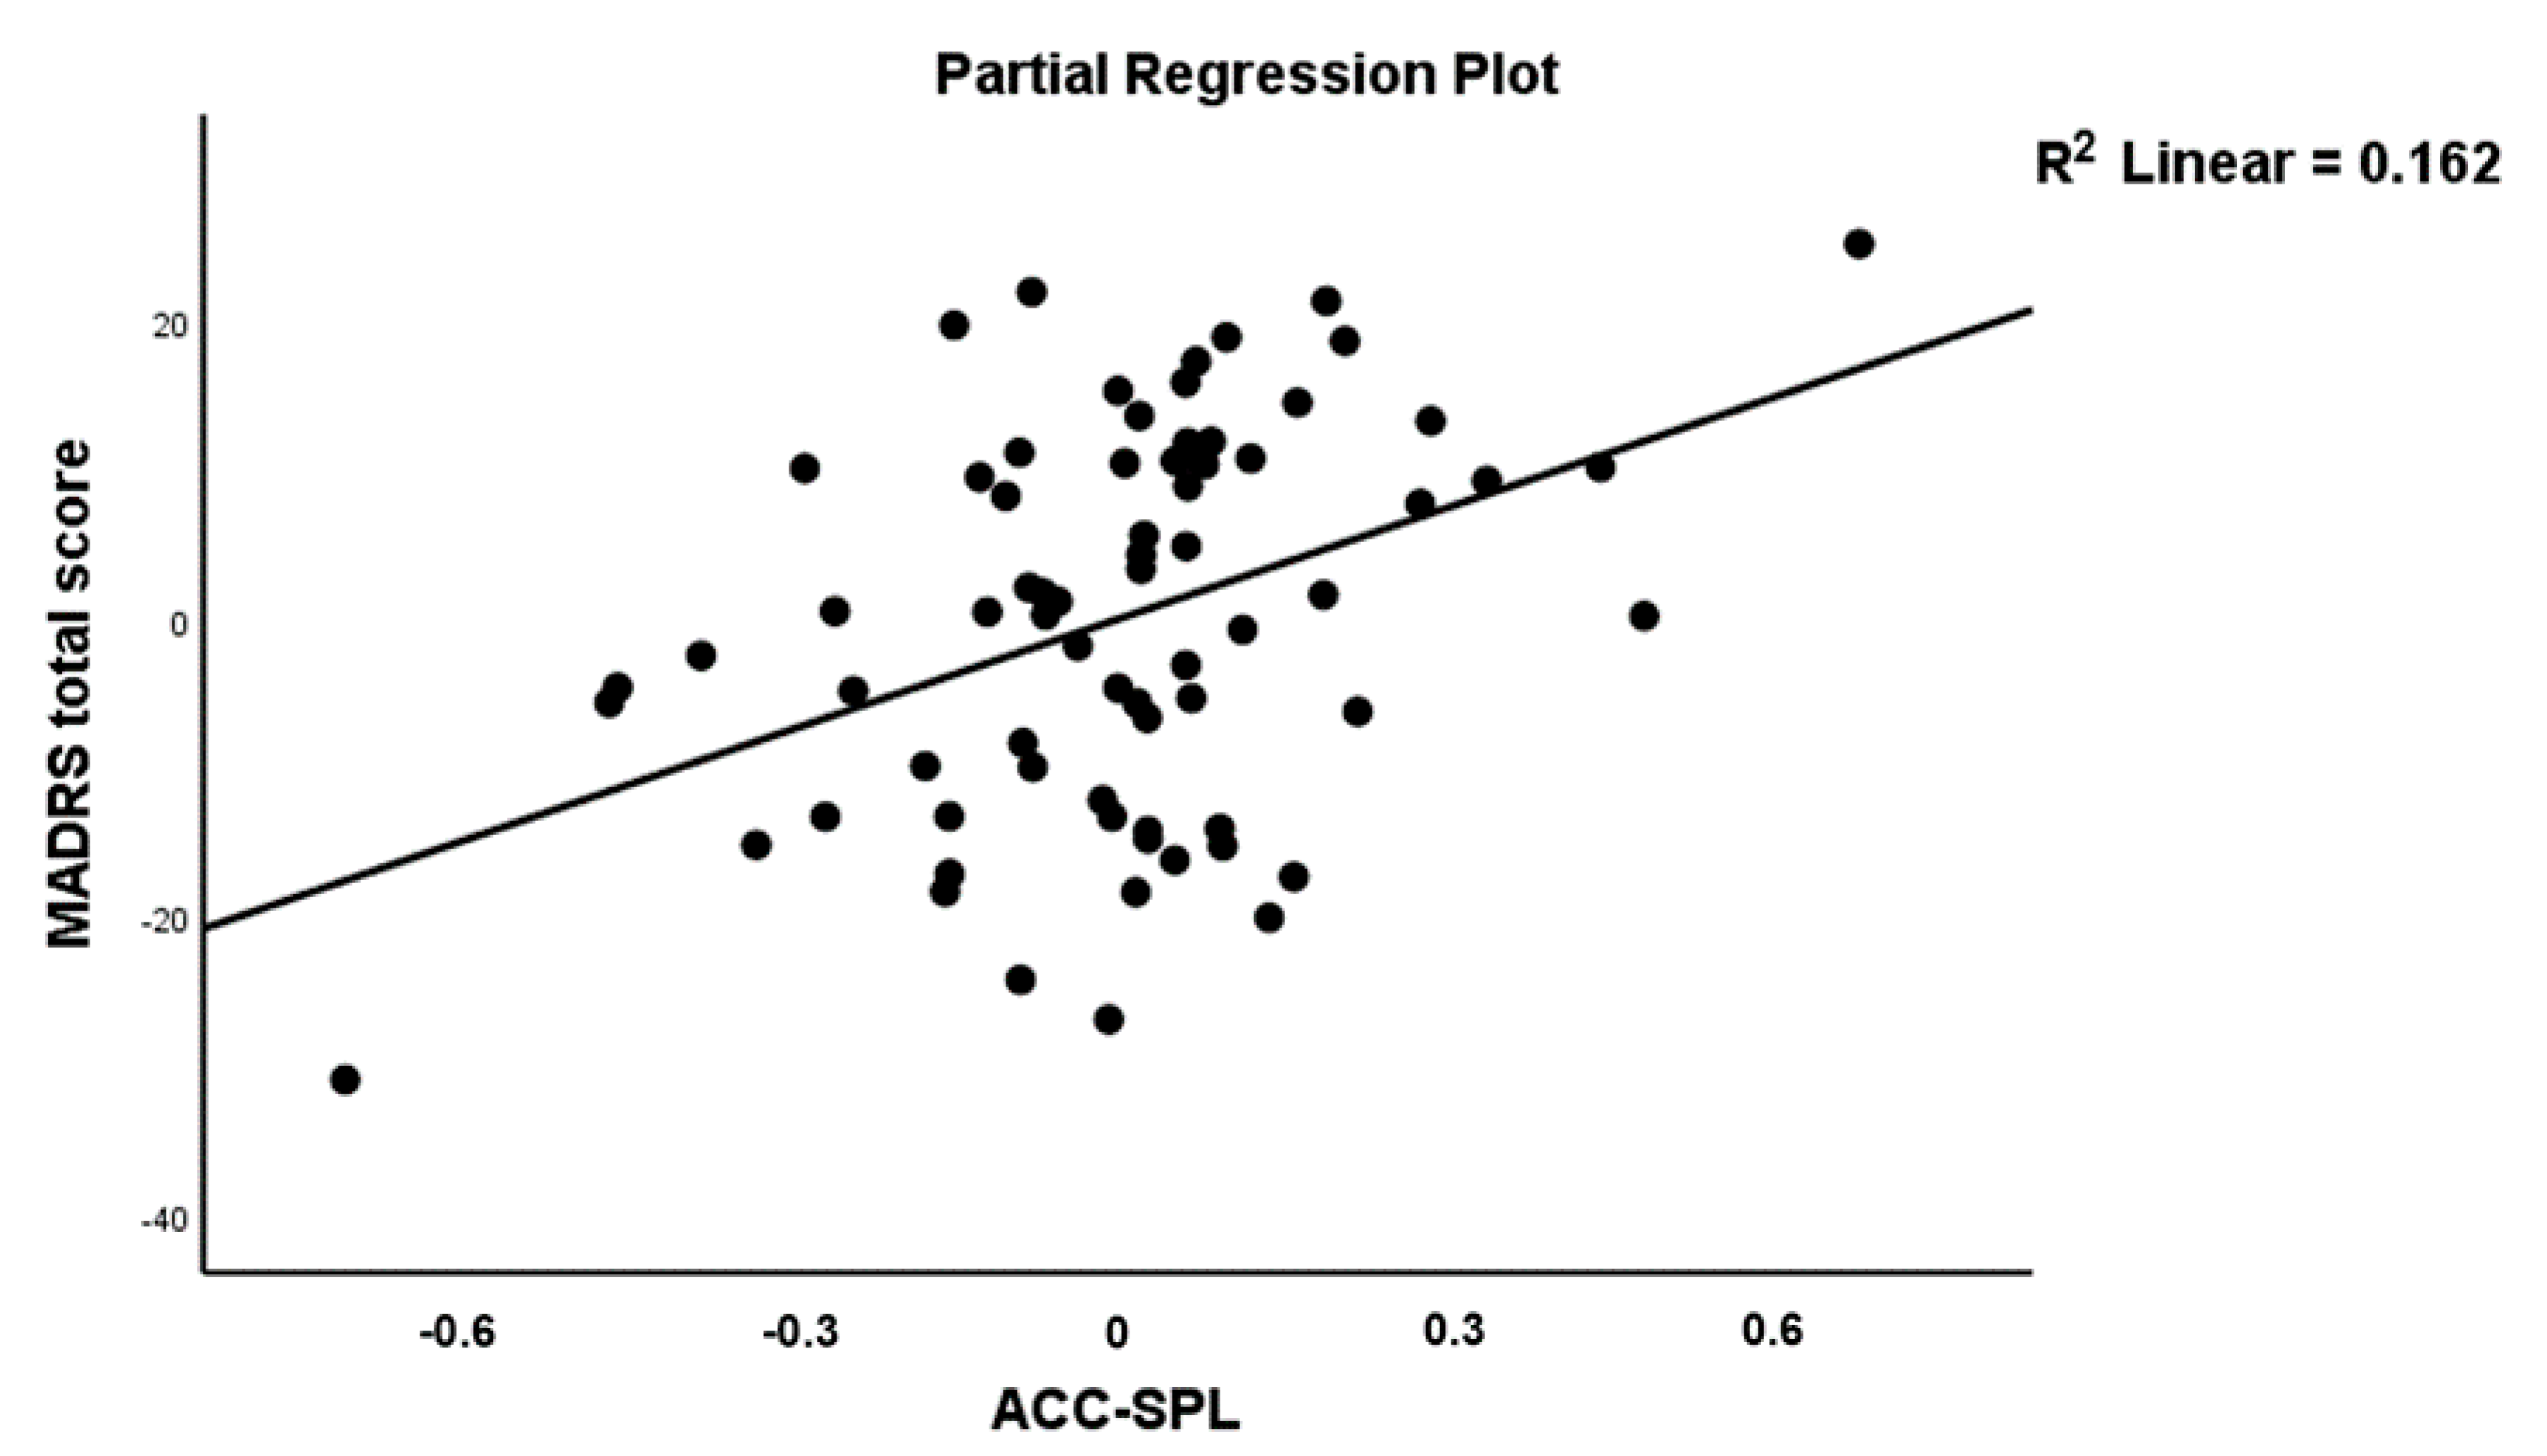
3.3. Connectome Features as Predictors of Severity of Illness
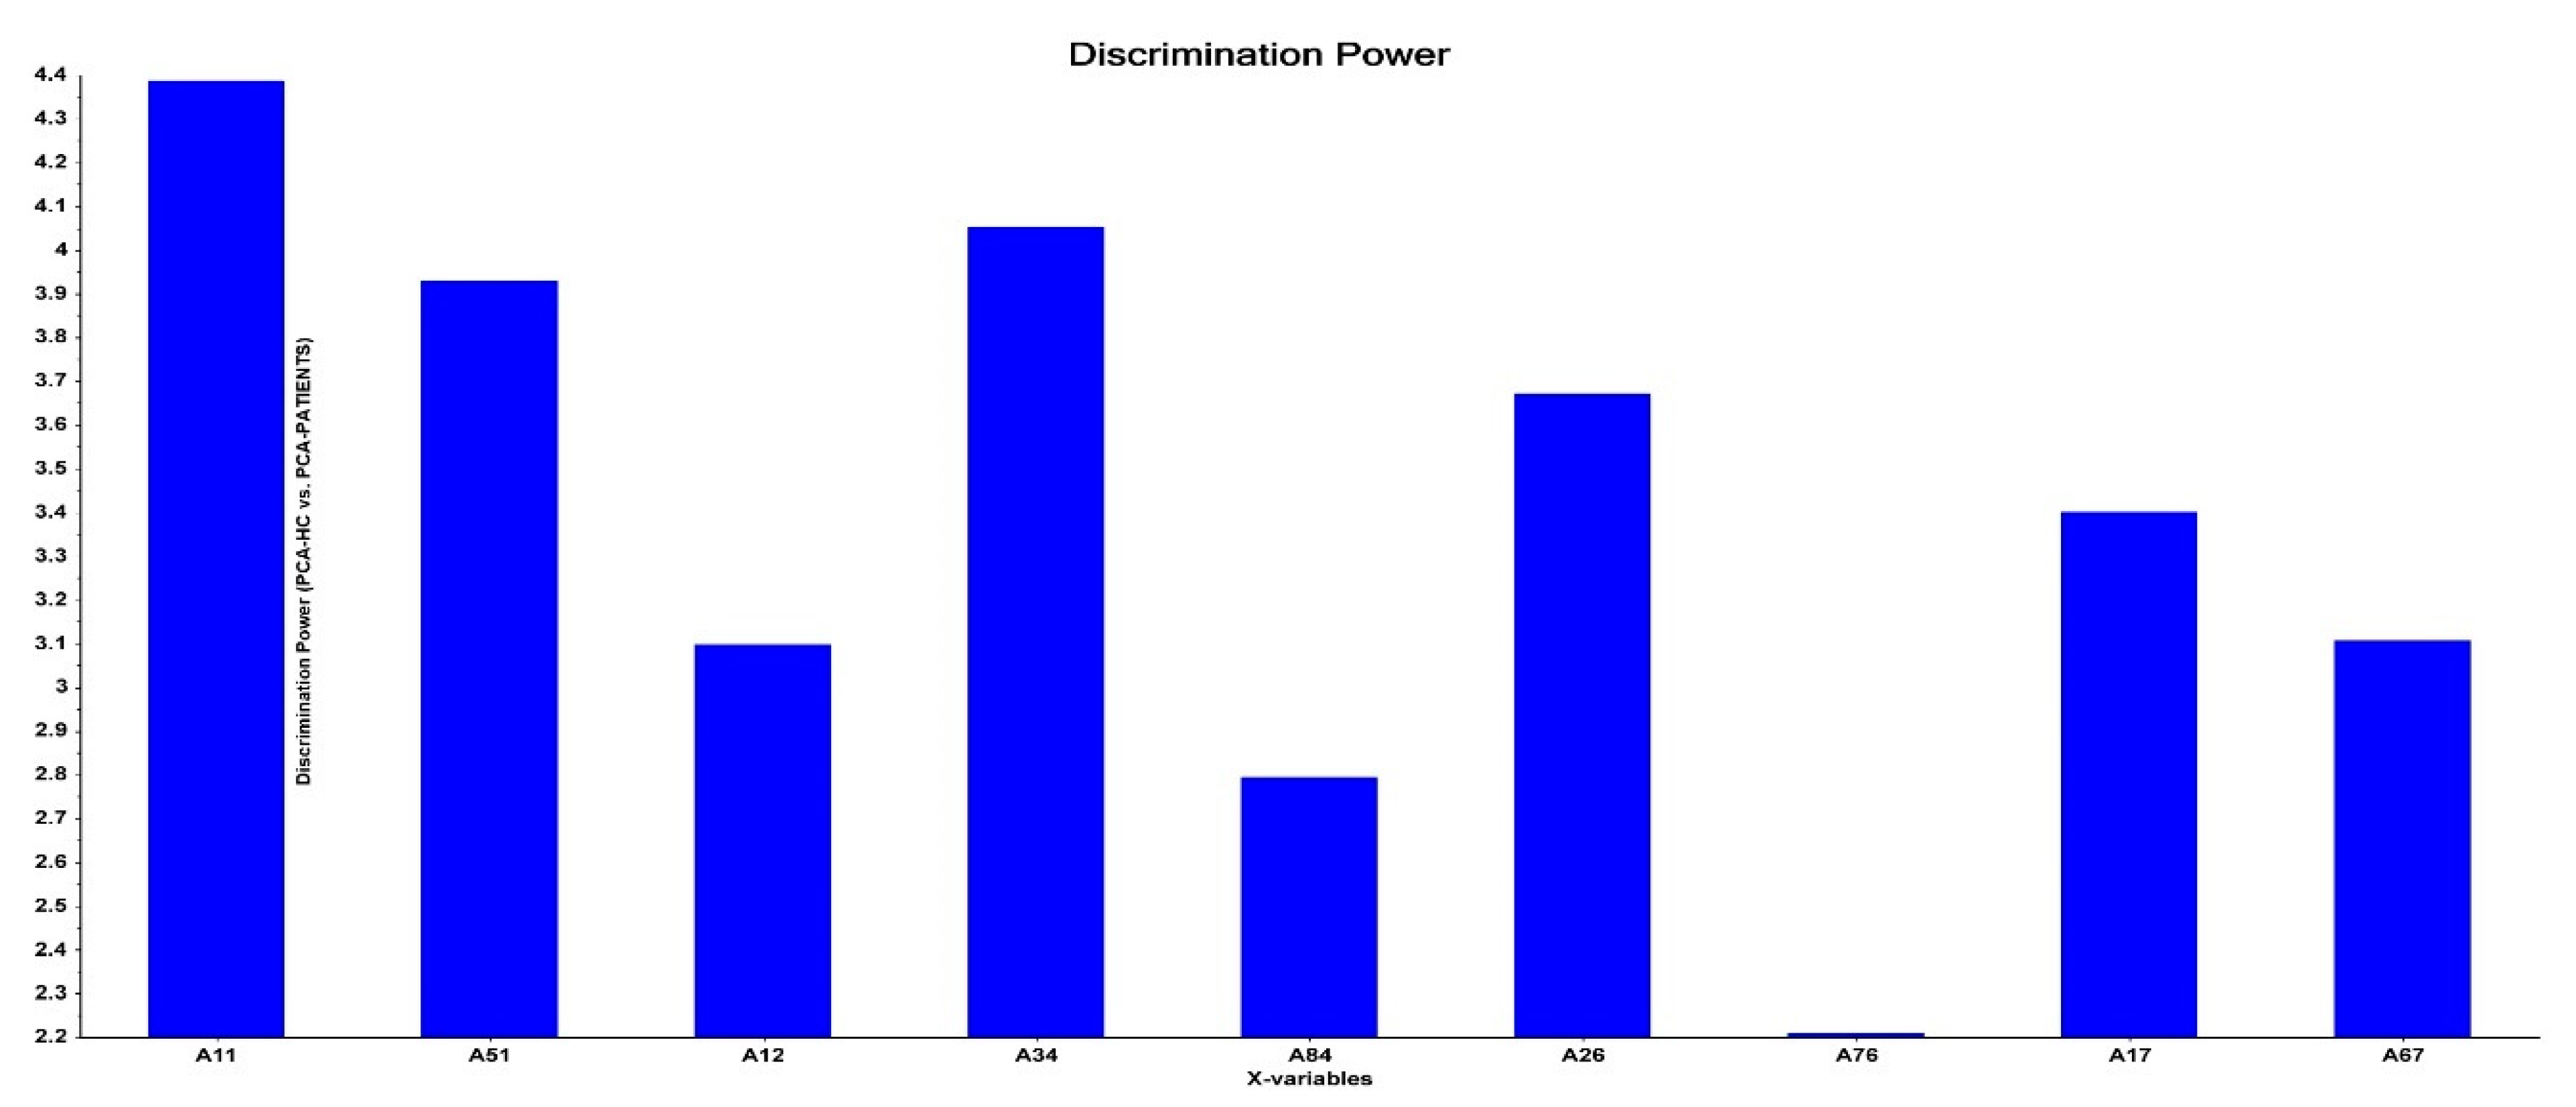
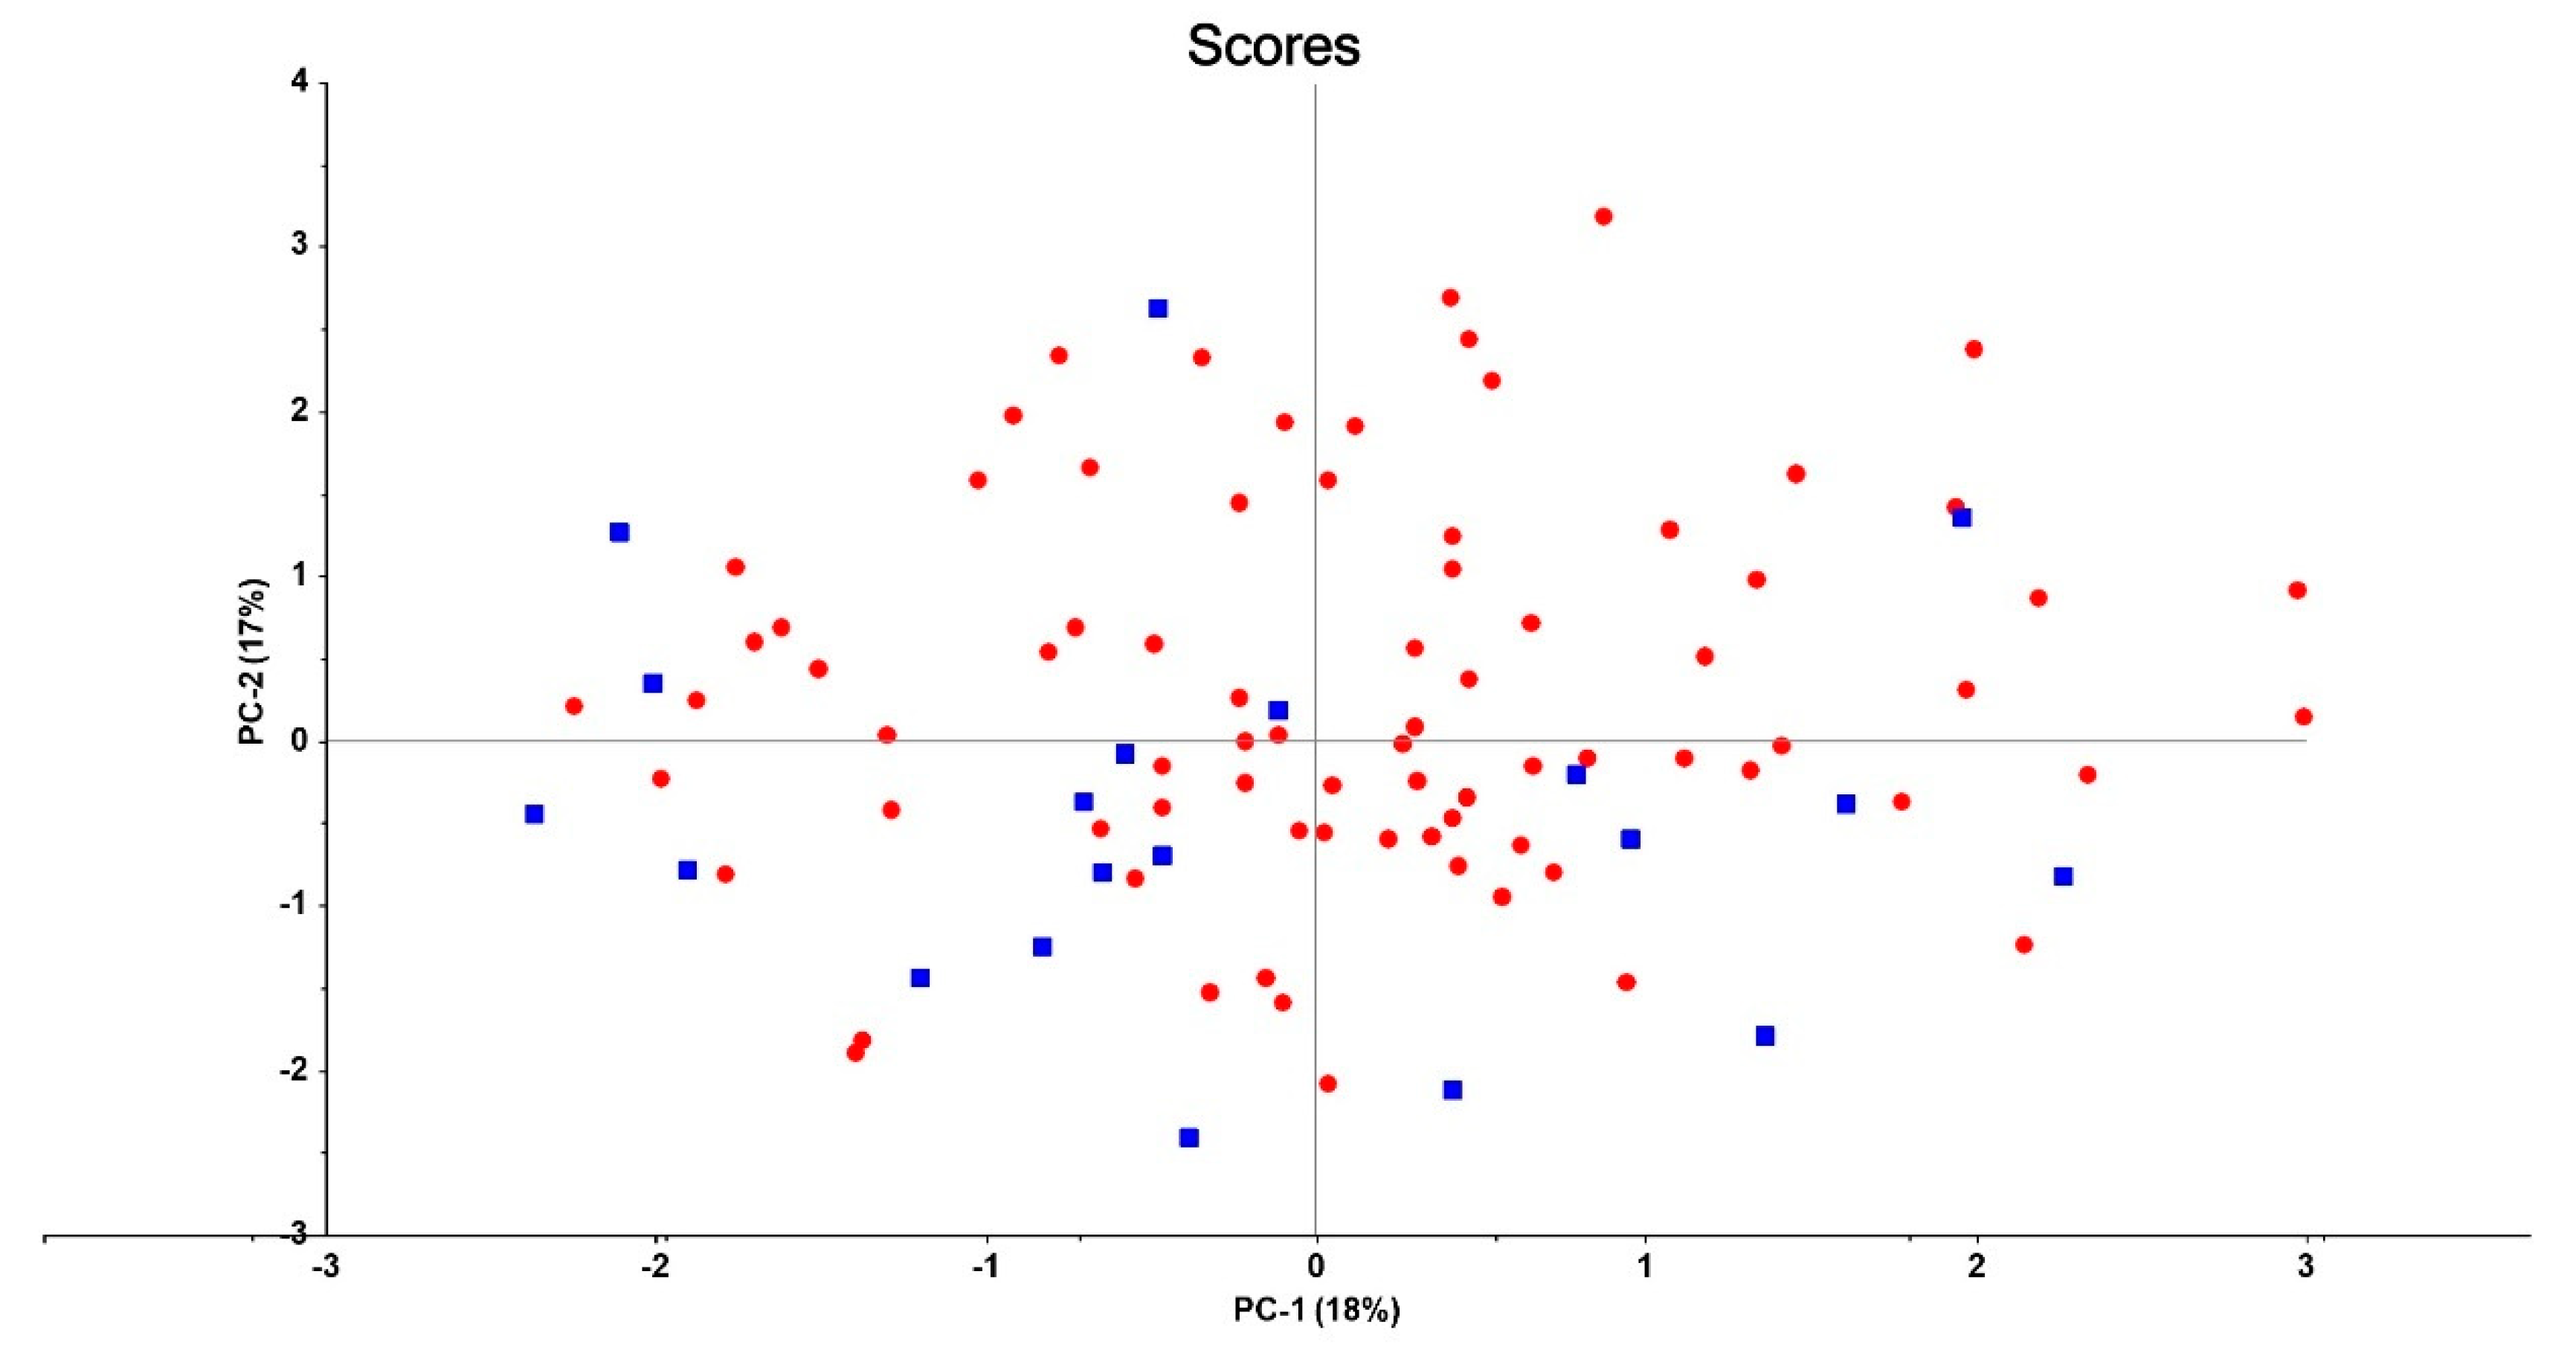
3.4. Connectome Features Discriminating Patient Subgroups
4. Discussion
Author Contributions
Funding
Institutional Review Board Statement
Informed Consent Statement
Data Availability Statement
Conflicts of Interest
Abbreviations
| ACC | Anterior cingulate cortex |
| AI | Anterior insula |
| AMY | Amygdala |
| BD | Bipolar disorder |
| CGI-S | Clinical global Impression—Severity scale |
| DCM | Dynamic Causal Modeling |
| DLPFC | Dorsolateral prefrontal cortex |
| DMN | Default mode network |
| FC | Functional connectivity |
| FEF | Frontal eye field |
| HC | Healthy controls |
| HPC | Hippocampus |
| IFG | Inferior frontal gyrus |
| MARDS | Montgomery–Åsberg Depression Rating Scale |
| MDD | Major depressive disorder |
| MFG | Middle frontal gyrus |
| OFC | Orbitofrontal cortex |
| OSOS | Overall severity of schizophrenia |
| PANSS | Positive and negative syndrome scale |
| PC/PCA | Principal component/principal component analysis |
| PFC | Prefrontal cortex |
| SCZ | Schizophrenia |
| SIMCA | Soft Independent Modeling by Class Analogy |
| SN | Salience network |
| SPL | Superior parietal lobule |
| SVM | Support vector machine |
| VLPFC | Ventrolateral prefrontal cortex |
References
- Stoyanov, D.; Maes, M.H. How to construct neuroscience-informed psychiatric classification? Towards nomothetic networks psychiatry. World J. Psychiatry 2021, 11, 1–12. [Google Scholar] [CrossRef]
- Möller, H.-J. Bipolar Disorder and Schizophrenia: Distinct Illnesses or a Continuum? J. Clin. Psychiatry 2003, 64, 5. [Google Scholar]
- Sorella, S.; Lapomarda, G.; Messina, I.; Frederickson, J.J.; Siugzdaite, R.; Job, R.; Grecucci, A. Testing the expanded continuum hypothesis of schizophrenia and bipolar disorder. Neural and psychological evidence for shared and distinct mechanisms. NeuroImage Clin. 2019, 23, 101854. [Google Scholar] [CrossRef]
- Malhi, G.; Porter, R. Mood disorders are categorically dimensional! Aust. N. Z. J. Psychiatry 2016, 50. [Google Scholar] [CrossRef] [Green Version]
- Akiskal, H.S.; Benazzi, F. The DSM-IV and ICD-10 categories of recurrent [major] depressive and bipolar II disorders: Evidence that they lie on a dimensional spectrum. J. Affect. Disord. 2006, 92, 45–54. [Google Scholar] [CrossRef]
- Maes, M.; Stoyanov, D. False dogmas in mood disorders research: Towards a nomothetic network approach. Res. Gate Prepr. 2021. [Google Scholar] [CrossRef]
- Guo, F.; Cai, J.; Jia, Y.; Wang, J.; Jakšić, N.; Kövi, Z.; Šagud, M.; Wang, W. Symptom continuum reported by affective disorder patients through a structure-validated questionnaire. BMC Psychiatry 2020, 20, 207. [Google Scholar] [CrossRef] [PubMed]
- Benazzi, F. A continuity between bipolar II depression and major depressive disorder? Prog. Neuro-Psychopharmacol. Biol. Psychiatry 2006, 30, 1043–1050. [Google Scholar] [CrossRef] [PubMed]
- Bauer, M.S.; Simon, G.E.; Ludman, E.; Unützer, J. ‘Bipolarity’ in bipolar disorder: Distribution of manic and depressive symptoms in a treated population. Br. J. Psychiatry 2005, 187, 87–88. [Google Scholar] [CrossRef] [Green Version]
- Cassano, G.B.; Frank, E.; Miniati, M.; Rucci, P.; Fagiolini, A.; Pini, S.; Shear, M.; Maser, J.D. Conceptual underpinnings and empirical support for the mood spectrum. Psychiatr. Clin. N. Am. 2002, 25, 699–712. [Google Scholar] [CrossRef]
- Hugdahl, K.; Sommer, I. Auditory Verbal Hallucinations in Schizophrenia from a Levels of Explanation Perspective. Schizophr. Bull. 2017, 44, 234–241. [Google Scholar] [CrossRef] [PubMed] [Green Version]
- Ambrosi, E.; Arciniegas, D.B.; Madan, A.; Curtis, K.N.; Patriquin, M.A.; Jorge, R.E.; Spalletta, G.; Fowler, J.C.; Frueh, B.C.; Salas, R. Insula and amygdala resting-state functional connectivity differentiate bipolar from unipolar depression. Acta Psychiatr. Scand. 2017, 136, 129–139. [Google Scholar] [CrossRef] [PubMed]
- Anand, A.; Li, Y.; Wang, Y.; Lowe, M.J.; Dzemidzic, M. Resting state corticolimbic connectivity abnormalities in unmedicated bipolar disorder and unipolar depression. Psychiatry Res. Neuroimaging 2009, 171, 189–198. [Google Scholar] [CrossRef] [PubMed] [Green Version]
- Goya-Maldonado, R.; Brodmann, K.; Keil, M.; Trost, S.; Dechent, P.; Gruber, O. Differentiating unipolar and bipolar depression by alterations in large-scale brain networks. Hum. Brain Mapp. 2015, 37, 808–818. [Google Scholar] [CrossRef] [Green Version]
- Han, K.-M.; De Berardis, D.; Fornaro, M.; Kim, Y.-K. Differentiating between bipolar and unipolar depression in functional and structural MRI studies. Prog. Neuro-Psychopharmacol. Biol. Psychiatry 2019, 91, 20–27. [Google Scholar] [CrossRef] [PubMed]
- Pang, Y.; Zhang, H.; Cui, Q.; Yang, Q.; Lu, F.; Chen, H.; He, Z.; Wang, Y.; Wang, J.; Chen, H. Combined static and dynamic functional connectivity signatures differentiating bipolar depression from major depressive disorder. Aust. N. Z. J. Psychiatry 2020, 54, 832–842. [Google Scholar] [CrossRef]
- Liu, H.; Tang, Y.; Womer, F.; Fan, G.; Lu, T.; Driesen, N.; Ren, L.; Wang, Y.; He, Y.; Blumberg, H.P.; et al. Differentiating Patterns of Amygdala-Frontal Functional Connectivity in Schizophrenia and Bipolar Disorder. Schizophr. Bull. 2013, 40, 469–477. [Google Scholar] [CrossRef] [Green Version]
- Li, J.; Tang, Y.; Womer, F.; Fan, G.; Zhou, Q.; Sun, W.; Wang, F. Two patterns of anterior insular cortex functional connectivity in bipolar disorder and schizophrenia. World J. Biol. Psychiatry Off. J. World Fed. Soc. Biol. Psychiatry 2018, 19 (Suppl. 3), S115–S123. [Google Scholar] [CrossRef]
- Maes, M.; Schotte, C.; Maes, L.; Cosyns, P. Clinical subtypes of unipolar depression: Part II. Quantitative and qualitative clinical differences between the vital and nonvital depression groups. Psychiatry Res. 1990, 34, 43–57. [Google Scholar] [CrossRef]
- Al-Hakeim, H.K.; Almulla, A.F.; Al-Dujaili, A.H.; Maes, M. Construction of a Neuro-Immune-Cognitive Pathway-Phenotype Underpinning the Phenome of Deficit Schizophrenia. Curr. Top. Med. Chem. 2020, 20, 747–758. [Google Scholar] [CrossRef]
- Almulla, A.F.; Al-Hakeim, H.K.; Maes, M. Schizophrenia phenomenology revisited: Positive and negative symptoms are strongly related reflective manifestations of an underlying single trait indicating overall severity of schizophrenia. CNS Spectrums 2020, 26, 368–377. [Google Scholar] [CrossRef]
- Friston, K.J. Functional and Effective Connectivity: A Review. Brain Connect. 2011, 1, 13–36. [Google Scholar] [CrossRef]
- Friston, K.J.; Kahan, J.; Biswal, B.; Razi, A. A DCM for resting state fMRI. NeuroImage 2013, 94, 396–407. [Google Scholar] [CrossRef] [Green Version]
- Razi, A.; Kahan, J.; Rees, G.; Friston, K. Construct validation of a DCM for resting state fMRI. NeuroImage 2014, 106, 1–14. [Google Scholar] [CrossRef] [PubMed] [Green Version]
- Sheehan, D.V.; Lecrubier, Y.; Sheehan, K.H.; Amorim, P.; Janavs, J.; Weiller, E.; Hergueta, T.; Baker, R.; Dunbar, G.C. The Mini-International Neuropsychiatric Interview (M.I.N.I.): The development and validation of a structured diagnostic psychiatric interview for DSM-IV and ICD-10. J. Clin. Psychiatry 1998, 59, 22–33. [Google Scholar] [PubMed]
- Montgomery, S.A.; Åsberg, M. A New Depression Scale Designed to be Sensitive to Change. Br. J. Psychiatry 1979, 134, 382–389. [Google Scholar] [CrossRef] [PubMed]
- Kay, S.R.; Fiszbein, A.; Opler, L.A. The Positive and Negative Syndrome Scale (PANSS) for Schizophrenia. Schizophr. Bull. 1987, 13, 261–276. [Google Scholar] [CrossRef]
- Menon, V.; Uddin, L.Q. Saliency, switching, attention and control: A network model of insula function. Brain Struct. Funct. 2010, 214, 655–667. [Google Scholar] [CrossRef] [Green Version]
- Manoliu, A.; Riedl, V.; Zherdin, A.; Mühlau, M.; Schwerthöffer, D.; Scherr, M.; Peters, H.; Zimmer, C.; Förstl, H.; Bäuml, J.; et al. Aberrant Dependence of Default Mode/Central Executive Network Interactions on Anterior Insular Salience Network Activity in Schizophrenia. Schizophr. Bull. 2013, 40, 428–437. [Google Scholar] [CrossRef] [PubMed] [Green Version]
- Wotruba, D.; Michels, L.; Buechler, R.; Metzler, S.; Theodoridou, A.; Gerstenberg, M.; Walitza, S.; Kollias, S.; Rössler, W.; Heekeren, K. Aberrant Coupling Within and Across the Default Mode, Task-Positive, and Salience Network in Subjects at Risk for Psychosis. Schizophr. Bull. 2013, 40, 1095–1104. [Google Scholar] [CrossRef] [Green Version]
- Manoliu, A.; Meng, C.; Brandl, F.; Doll, A.; Tahmasian, M.; Scherr, M.; Sorg, C. Insular dysfunction within the salience network is associated with severity of symptoms and aberrant inter-network connectivity in major depressive disorder. Front. Hum. Neurosci. 2013, 7, 930. [Google Scholar] [CrossRef]
- Hwang, J.W.; Egorova, N.; Yang, X.Q.; Zhang, W.Y.; Chen, J.; Hu, L.J.; Sun, S.; Tu, Y.; Kong, J. Subthreshold depression is associated with impaired resting-state functional connectivity of the cognitive control network. Transl. Psychiatry 2015, 5, e683. [Google Scholar] [CrossRef] [PubMed] [Green Version]
- Kandilarova, S.; Stoyanov, D.; Kostianev, S.; Specht, K. Altered Resting State Effective Connectivity of Anterior Insula in Depression. Front. Psychiatry 2018, 9. [Google Scholar] [CrossRef] [Green Version]
- Yoon, J.H.; Minzenberg, M.J.; Ursu, S.; Walters, R.; Wendelken, C.; Ragland, J.D.; Carter, C.S.; Walter, B.S.R. Association of Dorsolateral Prefrontal Cortex Dysfunction with Disrupted Coordinated Brain Activity in Schizophrenia: Relationship With Impaired Cognition, Behavioral Disorganization, and Global Function. Am. J. Psychiatry 2008, 165, 1006–1014. [Google Scholar] [CrossRef] [PubMed]
- Huang, M.-L.; Khoh, T.-T.; Lu, S.; Pan, F.; Chen, J.-K.; Hu, J.-B.; Hu, S.; Xu, W.-J.; Zhou, W.-H.; Wei, N.; et al. Relationships between dorsolateral prefrontal cortex metabolic change and cognitive impairment in first-episode neuroleptic-naive schizophrenia patients. Medicine 2017, 96, e7228. [Google Scholar] [CrossRef]
- Miller, E.K.; Cohen, J.D. An Integrative Theory of Prefrontal Cortex Function. Annu. Rev. Neurosci. 2001, 24, 167–202. [Google Scholar] [CrossRef] [Green Version]
- Golkar, A.; Lonsdorf, T.; Olsson, A.; Lindstrom, K.M.; Berrebi, J.; Fransson, P.; Schalling, M.; Ingvar, M.; Öhman, A. Distinct Contributions of the Dorsolateral Prefrontal and Orbitofrontal Cortex during Emotion Regulation. PLoS ONE 2012, 7, e48107. [Google Scholar] [CrossRef] [PubMed] [Green Version]
- Nejati, V.; Majdi, R.; Salehinejad, M.A.; Nitsche, M.A. The role of dorsolateral and ventromedial prefrontal cortex in the processing of emotional dimensions. Sci. Rep. 2021, 11, 1–12. [Google Scholar] [CrossRef]
- Anticevic, A.; Cole, M.; Murray, J.; Corlett, P.; Wang, X.-J.; Krystal, J.H. The role of default network deactivation in cognition and disease. Trends Cogn. Sci. 2012, 16, 584–592. [Google Scholar] [CrossRef] [Green Version]
- Takamura, M.; Okamoto, Y.; Okada, G.; Toki, S.; Yamamoto, T.; Yamamoto, O.; Jitsuiki, H.; Yokota, N.; Tamura, T.; Kurata, A.; et al. Disrupted Brain Activation and Deactivation Pattern during Semantic Verbal Fluency Task in Patients with Major Depression. Neuropsychobiology 2016, 74, 69–77. [Google Scholar] [CrossRef]
- Williams, L.M. Precision psychiatry: A neural circuit taxonomy for depression and anxiety. Lancet Psychiatry 2016, 3, 472–480. [Google Scholar] [CrossRef] [Green Version]
- Kandilarova, S.; Stoyanov, D.; Sirakov, N.; Maes, M.; Specht, K. Reduced grey matter volume in frontal and temporal areas in depression: Contributions from voxel-based morphometry study. Acta Neuropsychiatr. 2019, 31, 252–257. [Google Scholar] [CrossRef] [Green Version]
- Takamura, M.; Okamoto, Y.; Shibasaki, C.; Yoshino, A.; Okada, G.; Ichikawa, N.; Yamawaki, S. Antidepressive effect of left dorsolateral prefrontal cortex neurofeedback in patients with major depressive disorder: A preliminary report. J. Affect. Disord. 2020, 271, 224–227. [Google Scholar] [CrossRef] [PubMed]
- Kumar, N.; Verma, R.; Kumar, S. Effectiveness of adjunctive repetitive transcranial magnetic stimulation in management of treatment-resistant depression: A retrospective analysis. Indian J. Psychiatry 2018, 60, 329–333. [Google Scholar] [CrossRef]
- Rajmohan, V.; Mohandas, E. The limbic system. Indian J. Psychiatry 2007, 49, 132–139. [Google Scholar] [CrossRef]
- Chen, L.; Wang, Y.; Niu, C.; Zhong, S.; Hu, H.; Chen, P.; Zhang, S.; Chen, G.; Deng, F.; Lai, S.; et al. Common and distinct abnormal frontal-limbic system structural and functional patterns in patients with major depression and bipolar disorder. NeuroImage Clin. 2018, 20, 42–50. [Google Scholar] [CrossRef]
- Delvecchio, G.; Sugranyes, G.; Frangou, S. Evidence of diagnostic specificity in the neural correlates of facial affect processing in bipolar disorder and schizophrenia: A meta-analysis of functional imaging studies. Psychol. Med. 2012, 43, 553–569. [Google Scholar] [CrossRef] [PubMed]
- Sacher, J.; Neumann, J.; Fünfstück, T.; Soliman, A.; Villringer, A.; Schroeter, M.L. Mapping the depressed brain: A meta-analysis of structural and functional alterations in major depressive disorder. J. Affect. Disord. 2012, 140, 142–148. [Google Scholar] [CrossRef]
- Wang, G.; Lyu, H.; Wu, R.; Ou, J.; Zhu, F.; Liu, Y.; Zhao, J.; Guo, W. Resting-state functional hypoconnectivity of amygdala in clinical high risk state and first-episode schizophrenia. Brain Imaging Behav. 2019, 14, 1840–1849. [Google Scholar] [CrossRef] [PubMed]
- Ho, N.F.; Chong, P.L.H.; Lee, D.R.; Chew, Q.H.; Chen, G.; Sim, K. The Amygdala in Schizophrenia and Bipolar Disorder: A Synthesis of Structural MRI, Diffusion Tensor Imaging, and Resting-State Functional Connectivity Findings. Harv. Rev. Psychiatry 2019, 27, 150–164. [Google Scholar] [CrossRef]
- Jaworska, N.; Yang, X.-R.; Knott, V.; MacQueen, G. A review of fMRI studies during visual emotive processing in major depressive disorder. World J. Biol. Psychiatry 2015, 16, 448–471. [Google Scholar] [CrossRef]
- Yu, H.; Li, M.-L.; Li, Y.-F.; Li, X.-J.; Meng, Y.; Liang, S.; Li, Z.; Guo, W.; Wang, Q.; Deng, W.; et al. Anterior cingulate cortex, insula and amygdala seed-based whole brain resting-state functional connectivity differentiates bipolar from unipolar depression. J. Affect. Disord. 2020, 274, 38–47. [Google Scholar] [CrossRef] [PubMed]
- Vanes, L.D.; Dolan, R.J. Transdiagnostic neuroimaging markers of psychiatric risk: A narrative review. NeuroImage: Clin. 2021, 30, 102634. [Google Scholar] [CrossRef] [PubMed]
- Davey, C.G.; Harrison, B.J.; Yücel, M.; Allen, N.B. Regionally specific alterations in functional connectivity of the anterior cingulate cortex in major depressive disorder. Psychol. Med. 2012, 42, 2071–2081. [Google Scholar] [CrossRef]
- Jaworska, N.; Blier, P.; Fusee, W.; Knott, V. Alpha power, alpha asymmetry and anterior cingulate cortex activity in depressed males and females. J. Psychiatr. Res. 2012, 46, 1483–1491. [Google Scholar] [CrossRef] [PubMed] [Green Version]
- Pu, W.; Li, L.; Zhang, H.; Ouyang, X.; Liu, H.; Zhao, J.; Li, L.; Xue, Z.; Xu, K.; Tang, H.; et al. Morphological and functional abnormalities of salience network in the early-stage of paranoid schizophrenia. Schizophr. Res. 2012, 141, 15–21. [Google Scholar] [CrossRef]
- Bora, E.; Fornito, A.; Yücel, M.; Pantelis, C. Voxelwise Meta-Analysis of Gray Matter Abnormalities in Bipolar Disorder. Biol. Psychiatry 2010, 67, 1097–1105. [Google Scholar] [CrossRef]
- Goodkind, M.; Eickhoff, S.B.; Oathes, D.; Jiang, Y.; Chang, A.; Jones-Hagata, L.B.; Ortega, B.N.; Zaiko, Y.V.; Roach, E.L.; Korgaonkar, M.; et al. Identification of a Common Neurobiological Substrate for Mental Illness. JAMA Psychiatry 2015, 72, 305–315. [Google Scholar] [CrossRef]
- Koenigs, M.; Barbey, A.K.; Postle, B.R.; Grafman, J. Superior parietal cortex is critical for the manipulation of information in working memory. J. Neurosci. 2009, 29, 14980–14986. [Google Scholar] [CrossRef] [Green Version]
- Coull, J.; Frith, C. Differential Activation of Right Superior Parietal Cortex and Intraparietal Sulcus by Spatial and Nonspatial Attention. NeuroImage 1998, 8, 176–187. [Google Scholar] [CrossRef] [Green Version]
- Zago, L.; Tzourio-Mazoyer, N. Distinguishing visuospatial working memory and complex mental calculation areas within the parietal lobes. Neurosci. Lett. 2002, 331, 45–49. [Google Scholar] [CrossRef]
- Levy, B.J.; Wagner, A.D. Cognitive control and right ventrolateral prefrontal cortex: Reflexive reorienting, motor inhibition, and action updating. Ann. N. Y. Acad. Sci. 2011, 1224, 40–62. [Google Scholar] [CrossRef] [PubMed]
- Grimm, S.; Schmidt, C.F.; Bermpohl, F.; Heinzel, A.; Dahlem, Y.; Wyss, M.; Hell, D.; Boesiger, P.; Boeker, H.; Northoff, G. Segregated neural representation of distinct emotion dimensions in the prefrontal cortex—An fMRI study. NeuroImage 2006, 30, 325–340. [Google Scholar] [CrossRef]
- Lieberman, M.D.; Eisenberger, N.I.; Crockett, M.J.; Tom, S.M.; Pfeifer, J.H.; Way, B.M. Putting feelings into words: Affect labeling disrupts amygdala activity in response to affective stimuli. Psychol. Sci. 2007, 18, 421–428. [Google Scholar] [CrossRef]
- Wager, T.D.; Davidson, M.L.; Hughes, B.L.; Lindquist, M.A.; Ochsner, K.N. Prefrontal-Subcortical Pathways Mediating Successful Emotion Regulation. Neuron 2008, 59, 1037–1050. [Google Scholar] [CrossRef] [PubMed] [Green Version]
- van der Meer, L.; Swart, M.; van der Velde, J.; Pijnenborg, G.; Wiersma, D.; Bruggeman, R.; Aleman, A. Neural correlates of emotion regulation in patients with schizophrenia and non-affected siblings. PLoS ONE 2014, 9, e99667. [Google Scholar] [CrossRef] [Green Version]
- Morris, R.W.; Sparks, A.; Mitchell, P.B.; Weickert, C.S.; Green, M.J. Lack of cortico-limbic coupling in bipolar disorder and schizophrenia during emotion regulation. Transl. Psychiatry 2012, 2, e90. [Google Scholar] [CrossRef] [Green Version]
- Siegle, G.J.; Thompson, W.; Carter, C.S.; Steinhauer, S.; Thase, M.E. Increased Amygdala and Decreased Dorsolateral Prefrontal BOLD Responses in Unipolar Depression: Related and Independent Features. Biol. Psychiatry 2007, 61, 198–209. [Google Scholar] [CrossRef]
- Leppänen, J.M. Emotional information processing in mood disorders: A review of behavioral and neuroimaging findings. Curr. Opin. Psychiatry 2006, 19, 34–39. [Google Scholar] [CrossRef]
- Joormann, J.; Quinn, M.E. Cognitive processes and emotion regulation in depression. Depress. Anxiety 2014, 31, 308–315. [Google Scholar] [CrossRef]
- Wang, Y.-L.; Yang, S.-Z.; Sun, W.-L.; Shi, Y.-Z.; Duan, H.-F. Altered functional interaction hub between affective network and cognitive control network in patients with major depressive disorder. Behav. Brain Res. 2016, 298, 301–309. [Google Scholar] [CrossRef]
- Lu, Q.; Li, H.; Luo, G.; Wang, Y.; Tang, H.; Han, L.; Yao, Z. Impaired prefrontal–amygdala effective connectivity is responsible for the dysfunction of emotion process in major depressive disorder: A dynamic causal modeling study on MEG. Neurosci. Lett. 2012, 523, 125–130. [Google Scholar] [CrossRef] [PubMed]
- Radaelli, D.; Papa, G.S.; Vai, B.; Poletti, S.; Smeraldi, E.; Colombo, C.; Benedetti, F. Fronto-limbic disconnection in bipolar disorder. Eur. Psychiatry 2014, 30, 82–88. [Google Scholar] [CrossRef]
- Coutinho, J.; Fernandes, C.J.; Soares, J.M.; Maia, L.; Gonçalves, Ó.F.; Sampaio, A. Default mode network dissociation in depressive and anxiety states. Brain Imaging Behav. 2015, 10, 147–157. [Google Scholar] [CrossRef]
- Guo, W.; Liu, F.; Zhang, J.; Zhang, Z.; Yu, L.; Liu, J.; Chen, H.; Xiao, C. Dissociation of regional activity in the default mode network in first-episode, drug-naive major depressive disorder at rest. J. Affect. Disord. 2013, 151, 1097–1101. [Google Scholar] [CrossRef]
- Zhu, Z.; Lu, Q.; Meng, X.; Jiang, Q.; Peng, L.; Wang, Q. Spatial patterns of intrinsic neural activity in depressed patients with vascular risk factors as revealed by the amplitude of low-frequency fluctuation. Brain Res. 2012, 1483, 82–88. [Google Scholar] [CrossRef]
- Sheline, Y.I.; Price, J.L.; Yan, Z.; Mintun, M.A. Resting-state functional MRI in depression unmasks increased connectivity between networks via the dorsal nexus. Proc. Natl. Acad. Sci. USA 2010, 107, 11020–11025. [Google Scholar] [CrossRef] [PubMed] [Green Version]
- Orosz, A.; Jann, K.; Federspiel, A.; Horn, H.; Höfle, O.; Dierks, T.; Wiest, R.; Strik, W.; Müller, T.; Walther, S. Reduced Cerebral Blood Flow Within the Default-Mode Network and Within Total Gray Matter in Major Depression. Brain Connect. 2012, 2, 303–310. [Google Scholar] [CrossRef] [PubMed]
- He, H.; Yu, Q.; Du, Y.; Vergara, V.; Victor, T.A.; Drevets, W.C.; Savitz, J.; Jiang, T.; Sui, J.; Calhoun, V.D. Resting-state functional network connectivity in prefrontal regions differs between unmedicated patients with bipolar and major depressive disorders. J. Affect. Disord. 2015, 190, 483–493. [Google Scholar] [CrossRef] [Green Version]
- Liu, C.-H.; Ma, X.; Wu, X.; Li, F.; Zhang, Y.; Zhou, F.-C.; Wang, Y.-J.; Tie, C.-L.; Zhou, Z.; Zhang, D.; et al. Resting-state abnormal baseline brain activity in unipolar and bipolar depression. Neurosci. Lett. 2012, 516, 202–206. [Google Scholar] [CrossRef]
- Yu, H.-L.; Liu, W.-B.; Wang, T.; Huang, P.-Y.; Jie, L.-Y.; Sun, J.-Z.; Wang, C.; Qian, W.; Xuan, M.; Gu, Q.-Q.; et al. Difference in resting-state fractional amplitude of low-frequency fluctuation between bipolar depression and unipolar depression patients. Eur. Rev. Med. Pharmacol. Sci. 2017, 21, 1541–1550. [Google Scholar] [PubMed]


| HC A (n = 21) | SCZ B (n = 24) | BD C (n = 23) | MDD D (n = 33) | KWT/F/χ2 | df | p | |
|---|---|---|---|---|---|---|---|
| Age–years (SD) | 39.0 (13.1) | 38.8 (14.0) | 42.8 (11.9) | 46.6 (13.9) | 2.21 | 3/97 | 0.092 a |
| Sex (M/F) | 5/16 | 12/12 | 8/15 | 12/21 | 3.37 | 3 | 0.338 b |
| Education-years (SD) | 14.3 (2.0) | 12.8 (2.4) | 13.6 (2.3) | 14.0 (2.3) | 1.86 | 3/96 | 0.141 a |
| CGI-S mean (SD) | 1.0 (0.0) B,C,D | 4.29 (0.69) A | 4.56 (0.73) A | 4.39 (0.70) A | KWT | <0.001 a | |
| MADRS mean (SD) | 0.5 (1.3) C,D | - | 30.3 (6.1) | 29.3 (7.0) | 201.41 | 2/69 | <0.001 a |
| OSOS (z score) | −1.79 (0.) B | 1.82 (0.91) A | - | - | KWT | <0.001 c | |
| Illness duration (months) | - | 156.6 (116.1) | 133.7 (91.8) | 118.0 (93.7) | 0.96 | 2/73 | 0.387 a |
| Episode duration (weeks) | - | 16.1 (16.7) | 17.0 (18.5) | 14.7 (16.6) | 0.11 | 2/67 | 0.900 a |
| Number of episodes | - | 5.0 (4.5) | 4.9 (4.6) | 3.9 (4.0) | 0.48 | 2/66 | 0.619 a |
| Explanatory Variables | Nagelkerke Pseudo R2 | χ2 (df) p-Values | B | Standard Error | Wald df = 1 | p | Odds Ratio | 95% CI |
|---|---|---|---|---|---|---|---|---|
| All patients vs. HC | 0.448 | 56.83 (6) | ||||||
| AI⸧ (A11) | −1.113 | 0.308 | 14.24 | <0.001 | 0.31 | 0.17–0.57 | ||
| MFG→FEF (A34) | 0.722 | 0.252 | 8.23 | 0.004 | 2.05 | 1.26–3.37 | ||
| HPC→FEF (A84) | 0.684 | 0.231 | 8.77 | 0.003 | 1.98 | 1.26–3.12 | ||
| AMY→SPL (A76) | −0.780 | 0.263 | 8.81 | 0.003 | 0.46 | 0.27–0.77 | ||
| AI→AMY (A17) | 1.261 | 0.282 | 20.02 | <0.001 | 3.53 | 2.03–6.13 | ||
| MFG→AMY (A37) | 0.827 | 0.279 | 8.78 | 0.003 | 2.29 | 1.32–3.95 | ||
| MOOD vs. HC | 0.487 | 45.69 (5) <0.001 | ||||||
| AI (A11) | −1.348 | 0.401 | 11.27 | 0.001 | 0.26 | 0.12–0.57 | ||
| MFG→FEF (A34) | 1.105 | 0.350 | 9.97 | 0.002 | 3.02 | 1.52–6.00 | ||
| HPC→FEF (A84) | 0.950 | 0.295 | 10.40 | 0.001 | 2.59 | 1.45–4.61 | ||
| AI→AMY (A17) | 1.380 | 0.381 | 13.14 | <0.001 | 3.97 | 1.89–8.38 | ||
| MFG→AMY (A37) | 1.180 | 0.371 | 10.11 | 0.001 | 3.26 | 1.57–6.74 | ||
| SCZ vs. HC | 0.316 | 12.16 (2) 0.002 | ||||||
| AI→AMY (A17) | 0.802 | 0.382 | 4.41 | 0.036 | 2.23 | 1.06–4.71 | ||
| AMY→SPL (A76) | −1.112 | 0.479 | 5.40 | 0.020 | 0.03 | 0.13–0.84 |
| Dependent Variables | Explanatory Variables | B | A | p | F | df | p | R2 |
|---|---|---|---|---|---|---|---|---|
| CGI | Model #1 | 6.03 | 2/69 | 0.004 | 0.149 | |||
| HPC→FEF (A84) | 0.265 | 2.38 | 0.020 | |||||
| AI→AMY (A17) | 0.279 | 2.51 | 0.014 | |||||
| CGI | Model #2 | 7.10 | 4/67 | <0.001 | 0.298 | |||
| AI→AMY (A17) | 0.278 | 2.79 | 0.007 | |||||
| HPC→FEF (A84) | 0.317 | 3.06 | 0.003 | |||||
| ACC→SPL (A56) | 0.468 | 3.75 | <0.001 | |||||
| SPL→ACC (A65) | 0.299 | 2.42 | 0.018 | |||||
| MADRS | Model #3 | 6.11 | 5/66 | <0.001 | 0.316 | |||
| HPC→FEF (A84) | 0.308 | 3.02 | 0.004 | |||||
| ACC→SPL (A56) | 0.422 | 3.57 | 0.001 | |||||
| AI⸧ (A11) | −0.223 | −2.17 | 0.034 | |||||
| SPL→ ACC (A65) | 0.317 | 2.61 | 0.011 | |||||
| SPL→ AMY (A67) | 0.223 | 2.11 | 0.038 | |||||
| OSOS | Model #4 | 6.62 | 2/36 | 0.004 | 0.269 | |||
| AI→AMY (A17) | 0.410 | 2.88 | 0.007 | |||||
| AMY→SPL (A76) | −0.332 | −2.33 | 0.026 | |||||
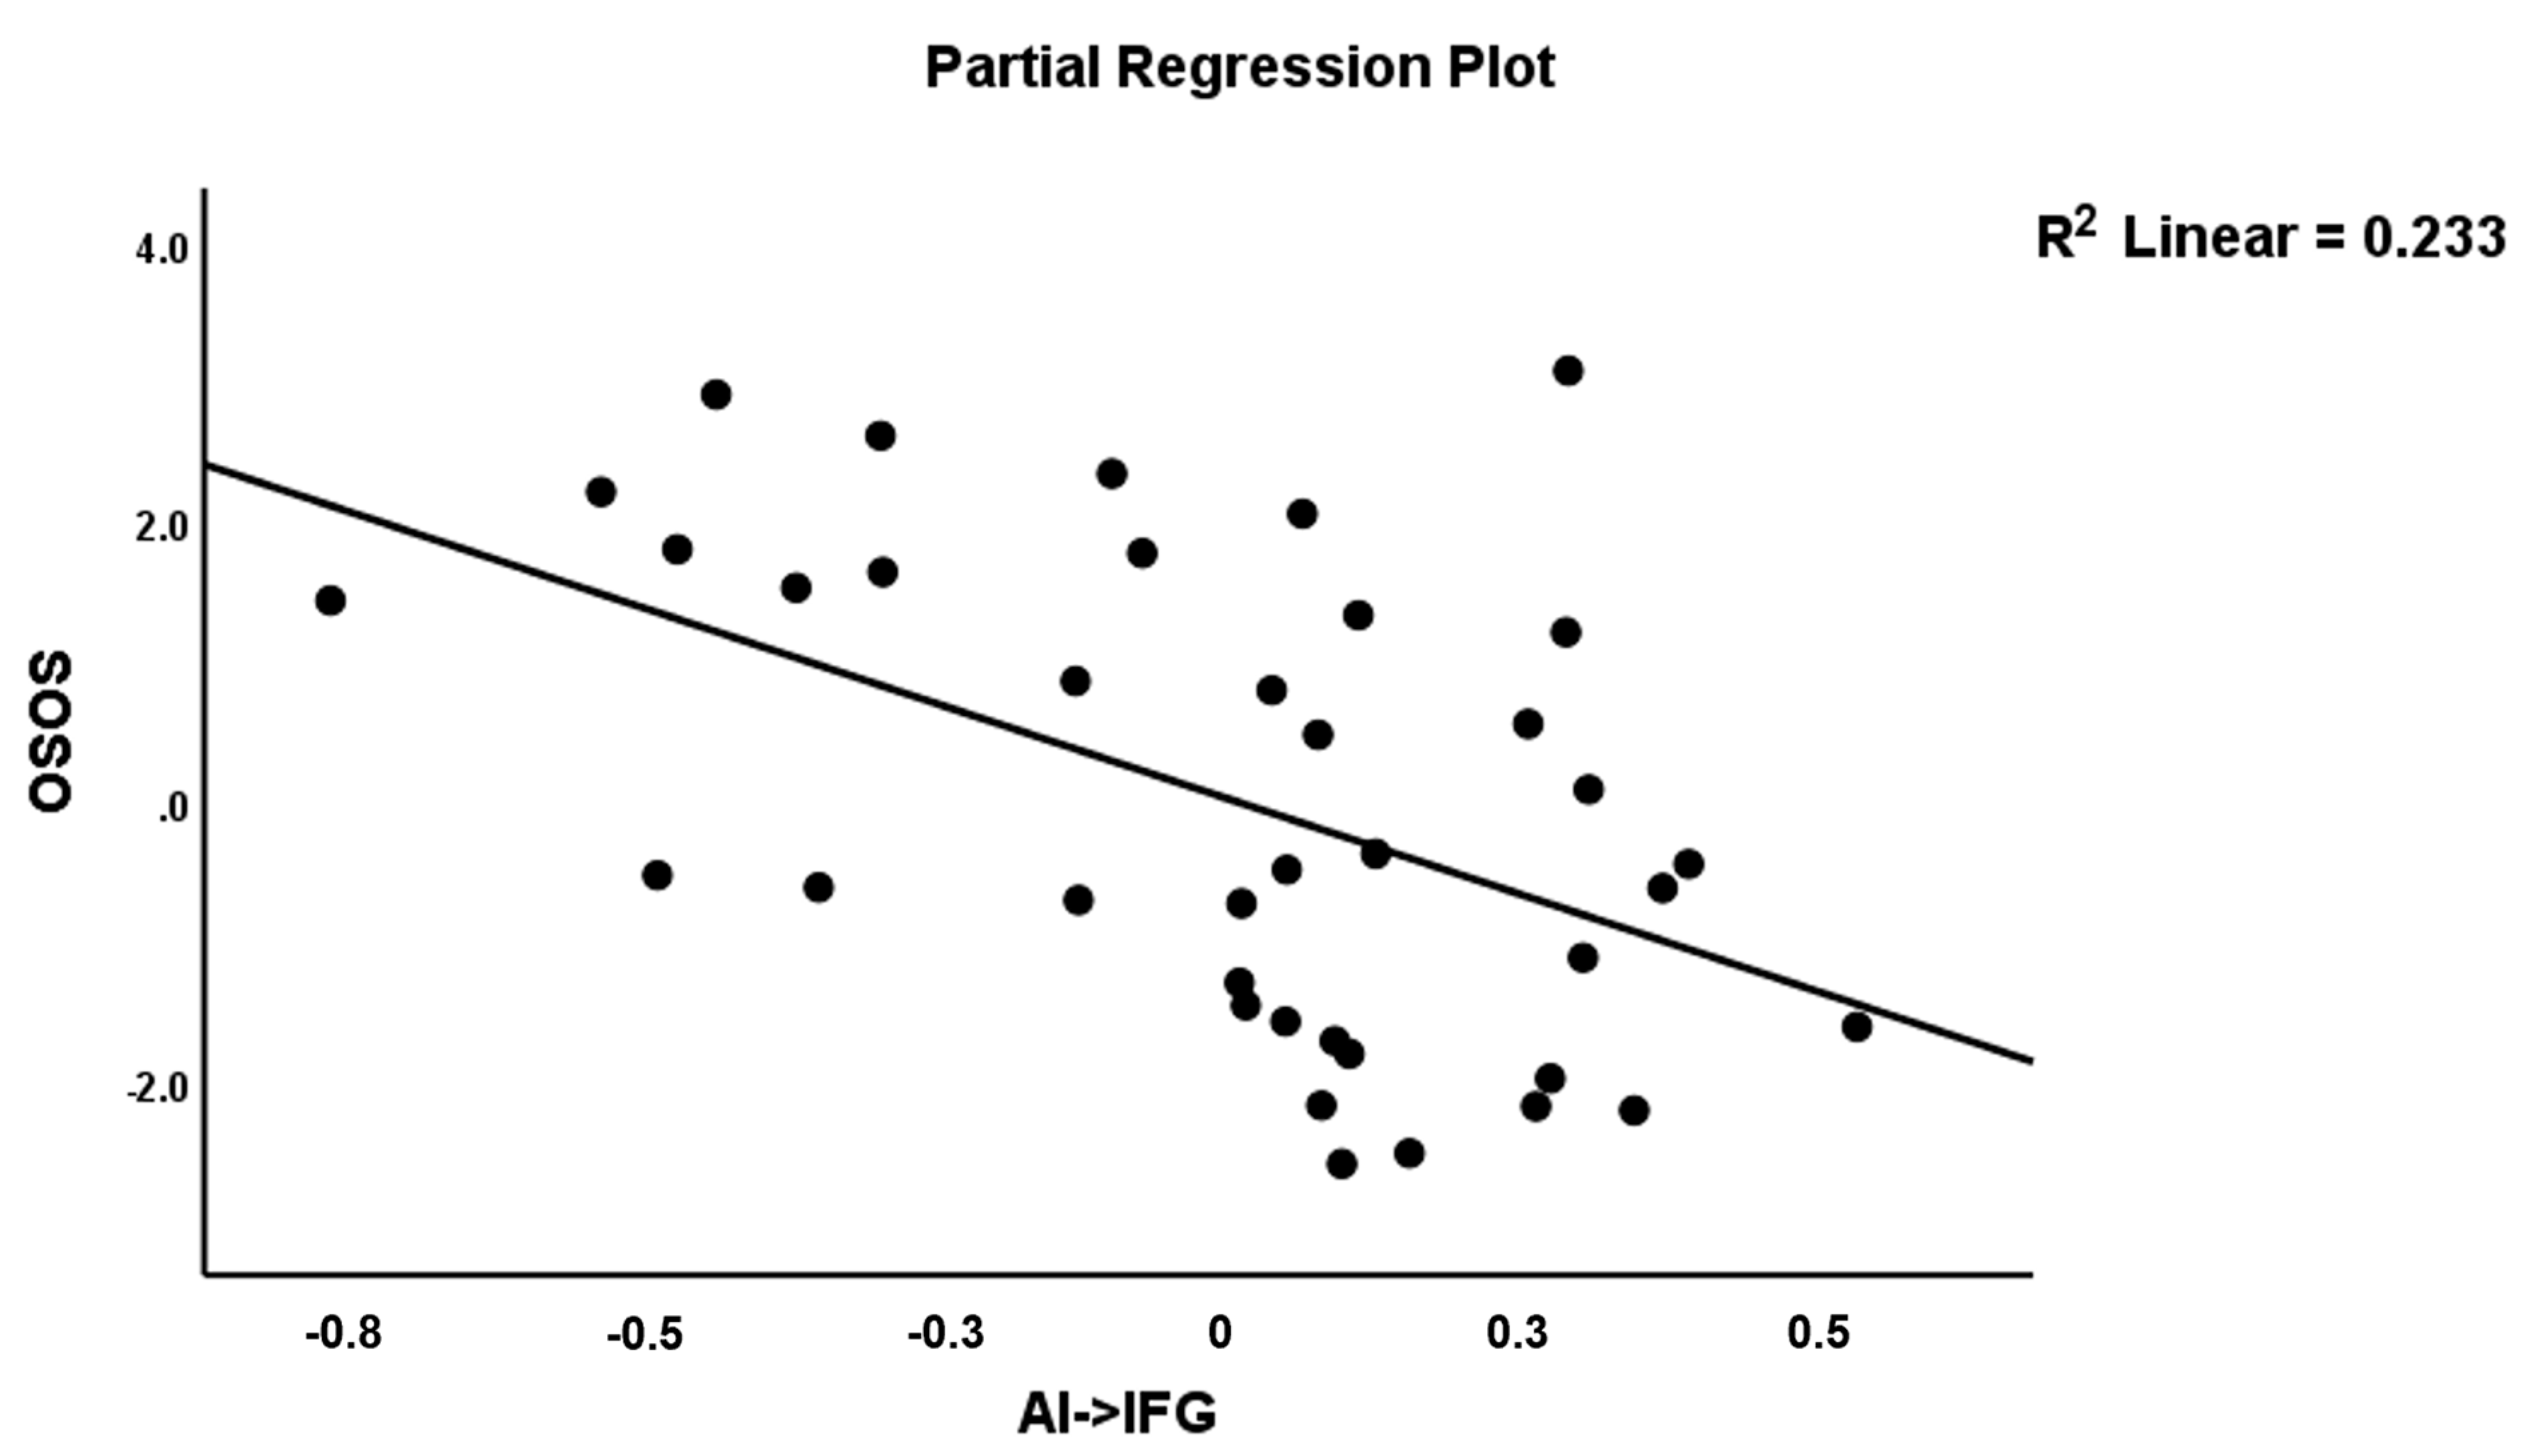
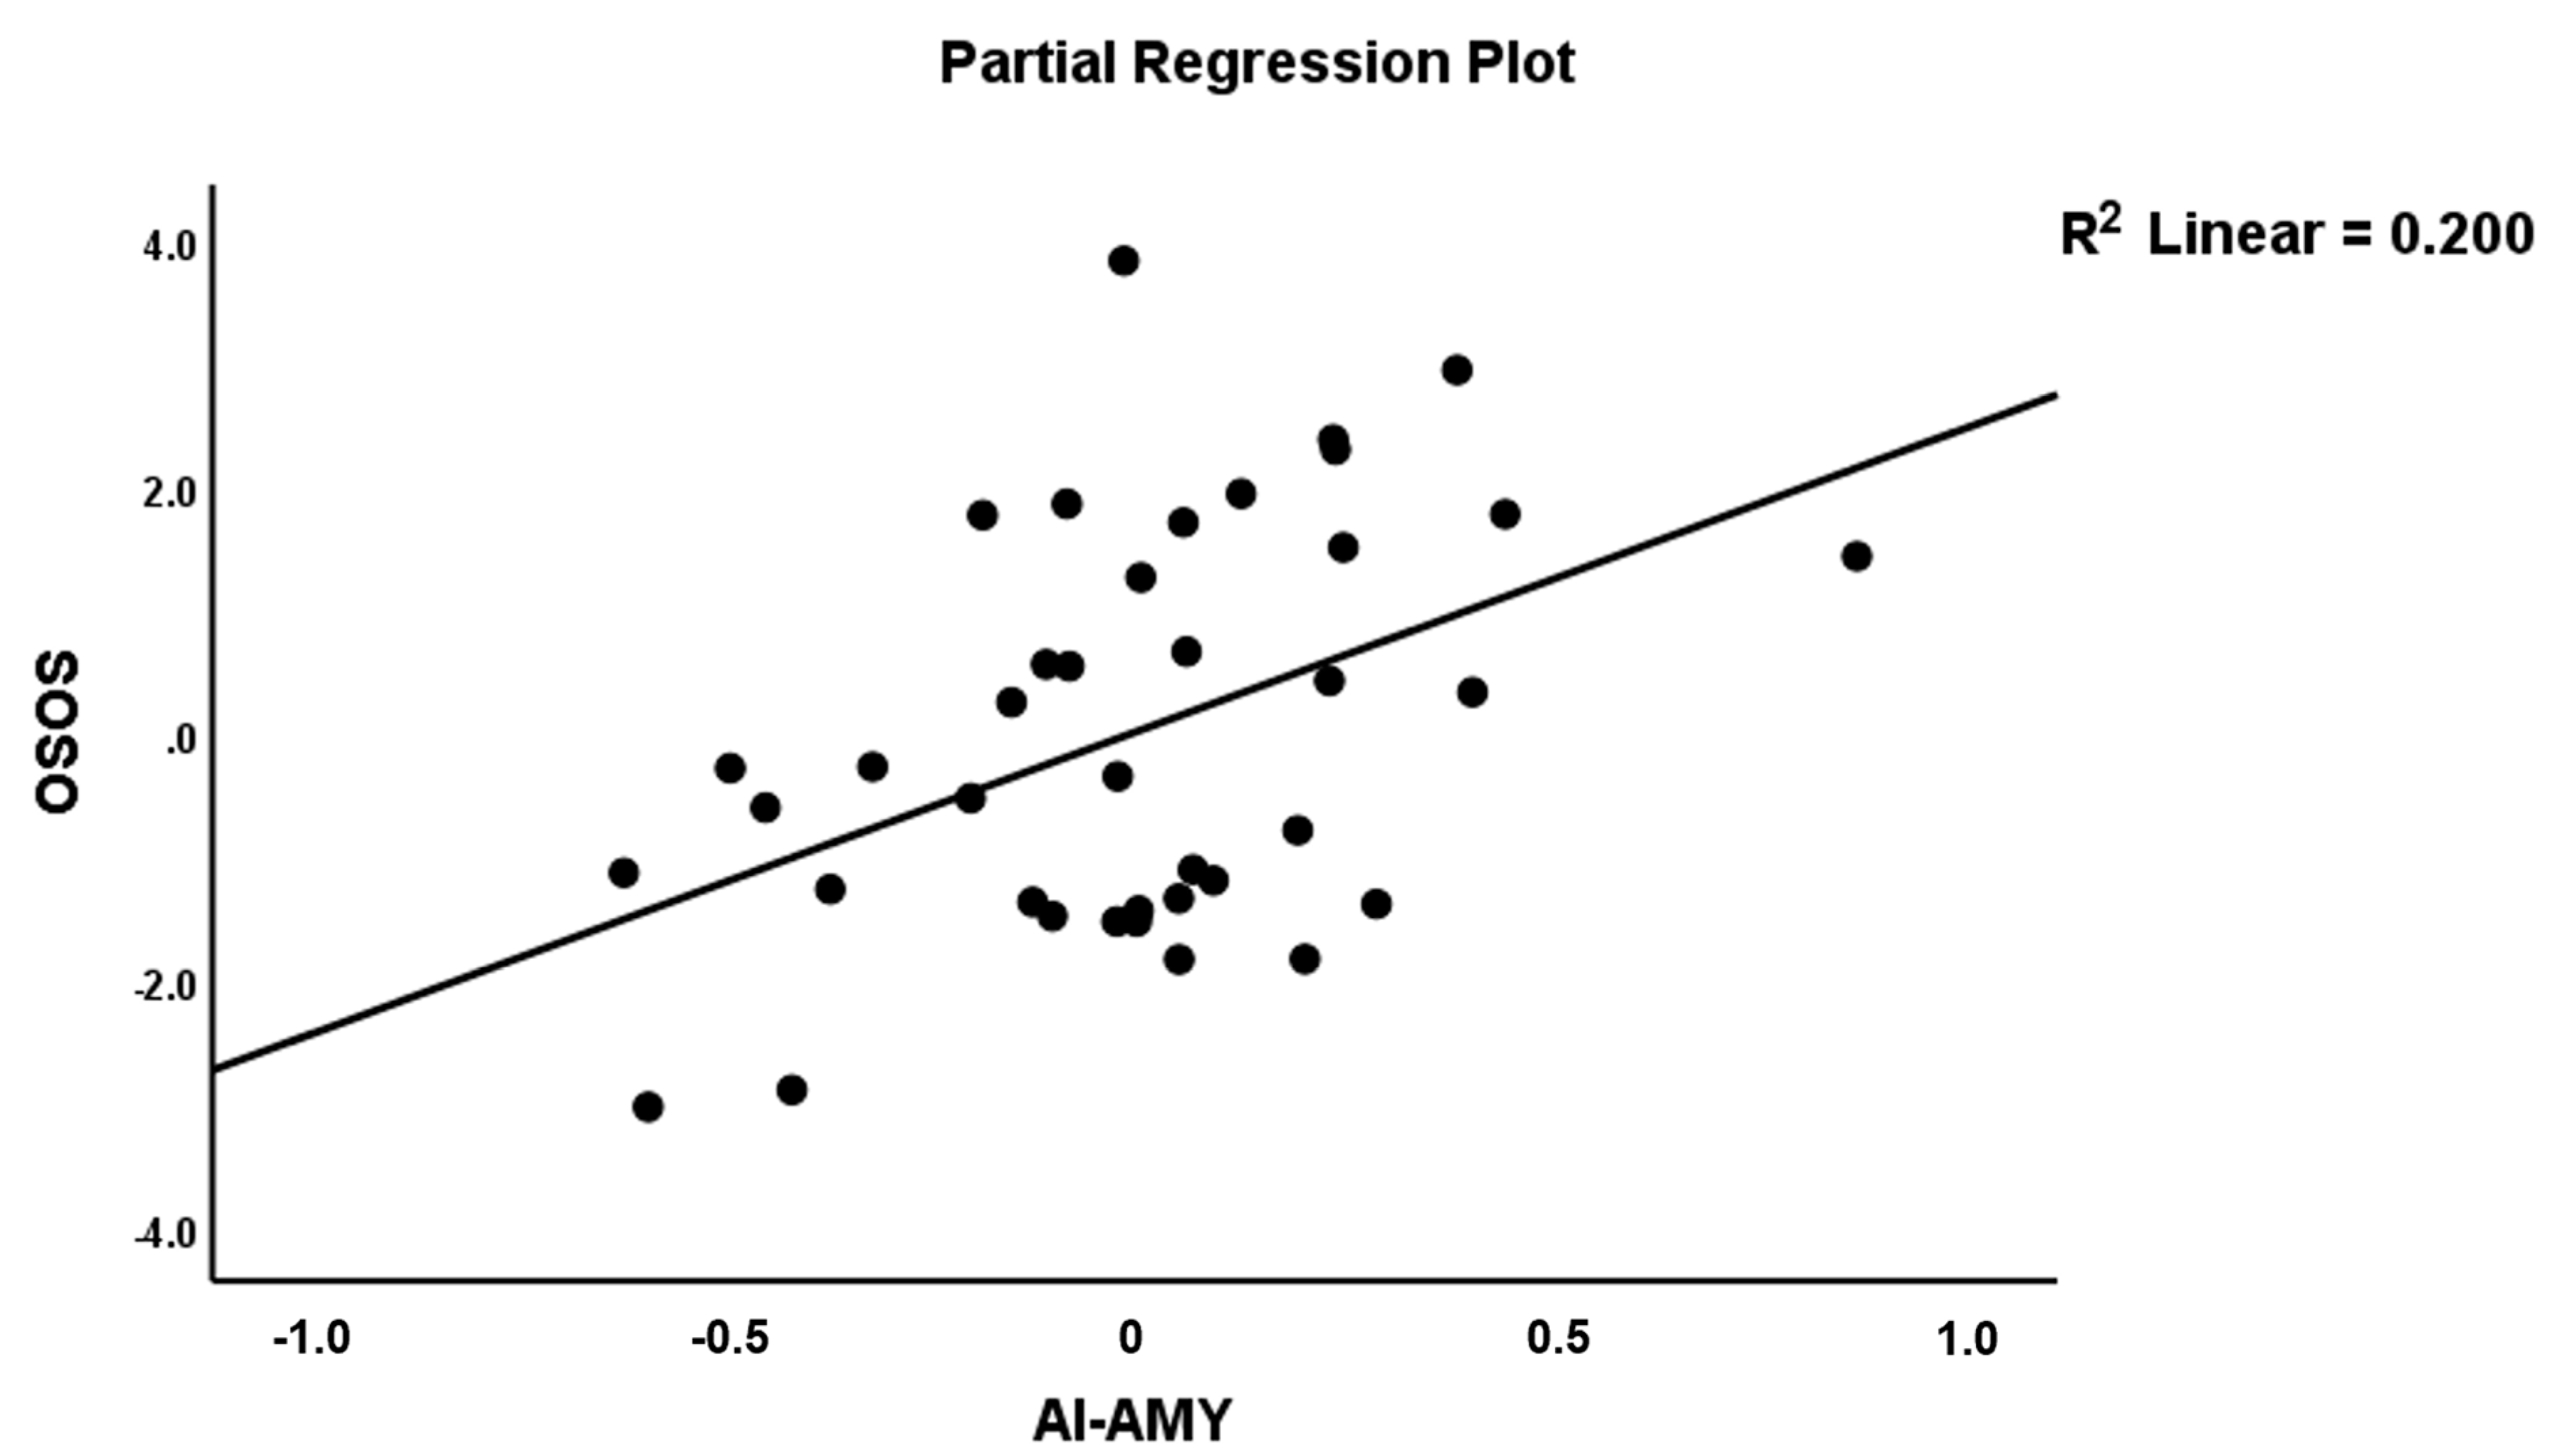
| OSOS | Model #5 | 7.96 | 3/35 | <0.001 | 0.406 | |||
| AI→AMY (A17) | 0.386 | 2.96 | 0.006 | |||||
| AI→IFG (A12) | −0.432 | −3.26 | 0.002 | |||||
| IFG→SPL (A26) | −0.334 | −2.52 | 0.016 |
| Explanatory Variables | Nagelkerke Pseudo R2 | χ2 (df) p-Values | B | Standard Error | Wald df = 1 | p | OR | 95% CI |
|---|---|---|---|---|---|---|---|---|
| MOOD vs. SCZ | 0.604 | 74.55 (6) <0.001 | ||||||
| IFG→AI (A21) | −6.272 | 1.625 | 14.89 | <0.001 | 0.00 | 0.00–0.05 | ||
| ACC→IFG (A52) | −3.935 | 1.239 | 10.08 | 0.001 | 0.02 | 0.00–0.22 | ||
| IFG→ACC (A25) | −3.314 | 1.057 | 9.84 | 0.002 | 0.04 | 0.00–0.29 | ||
| IFG→AMY (A27) | −4.430 | 1.422 | 9.71 | 0.002 | 0.01 | 0.00–0.19 | ||
| AI→AMY (A23) | 1.495 | 0.368 | 16.51 | <0.001 | 4.46 | 2.17–9.17 | ||
| AMY→SPL (A76) | 1.687 | 0.470 | 12.90 | <0.001 | 5.40 | 2.15–13.57 | ||
| MDD vs. BD | 0.547 | 29.16 (3) <0.001 | ||||||
| IFG→SPL (A26) | −5.39 | 2.632 | 9.76 | 0.002 | 0.01 | 0.00–0.13 | ||
| ACC→AMY (A57) | −5.85 | 2.908 | 5.18 | 0.023 | 0.00 | 0.00–0.44 | ||
| MFG→AI (A31) | 1.36 | 0.675 | 8.10 | 0.004 | 3.90 | 1.53–9.96 |
Publisher’s Note: MDPI stays neutral with regard to jurisdictional claims in published maps and institutional affiliations. |
© 2021 by the authors. Licensee MDPI, Basel, Switzerland. This article is an open access article distributed under the terms and conditions of the Creative Commons Attribution (CC BY) license (https://creativecommons.org/licenses/by/4.0/).
Share and Cite
Kandilarova, S.; Stoyanov, D.S.; Paunova, R.; Todeva-Radneva, A.; Aryutova, K.; Maes, M. Effective Connectivity between Major Nodes of the Limbic System, Salience and Frontoparietal Networks Differentiates Schizophrenia and Mood Disorders from Healthy Controls. J. Pers. Med. 2021, 11, 1110. https://doi.org/10.3390/jpm11111110
Kandilarova S, Stoyanov DS, Paunova R, Todeva-Radneva A, Aryutova K, Maes M. Effective Connectivity between Major Nodes of the Limbic System, Salience and Frontoparietal Networks Differentiates Schizophrenia and Mood Disorders from Healthy Controls. Journal of Personalized Medicine. 2021; 11(11):1110. https://doi.org/10.3390/jpm11111110
Chicago/Turabian StyleKandilarova, Sevdalina, Drozdstoy St. Stoyanov, Rositsa Paunova, Anna Todeva-Radneva, Katrin Aryutova, and Michael Maes. 2021. "Effective Connectivity between Major Nodes of the Limbic System, Salience and Frontoparietal Networks Differentiates Schizophrenia and Mood Disorders from Healthy Controls" Journal of Personalized Medicine 11, no. 11: 1110. https://doi.org/10.3390/jpm11111110
APA StyleKandilarova, S., Stoyanov, D. S., Paunova, R., Todeva-Radneva, A., Aryutova, K., & Maes, M. (2021). Effective Connectivity between Major Nodes of the Limbic System, Salience and Frontoparietal Networks Differentiates Schizophrenia and Mood Disorders from Healthy Controls. Journal of Personalized Medicine, 11(11), 1110. https://doi.org/10.3390/jpm11111110