
New Approach to the Old Challenge of Free Flap Monitoring—Hyperspectral Imaging Outperforms Clinical Assessment by Earlier Detection of Perfusion Failure


Abstract
:1. Introduction
2. Materials and Methods
2.1. Patients
2.2. Monitoring
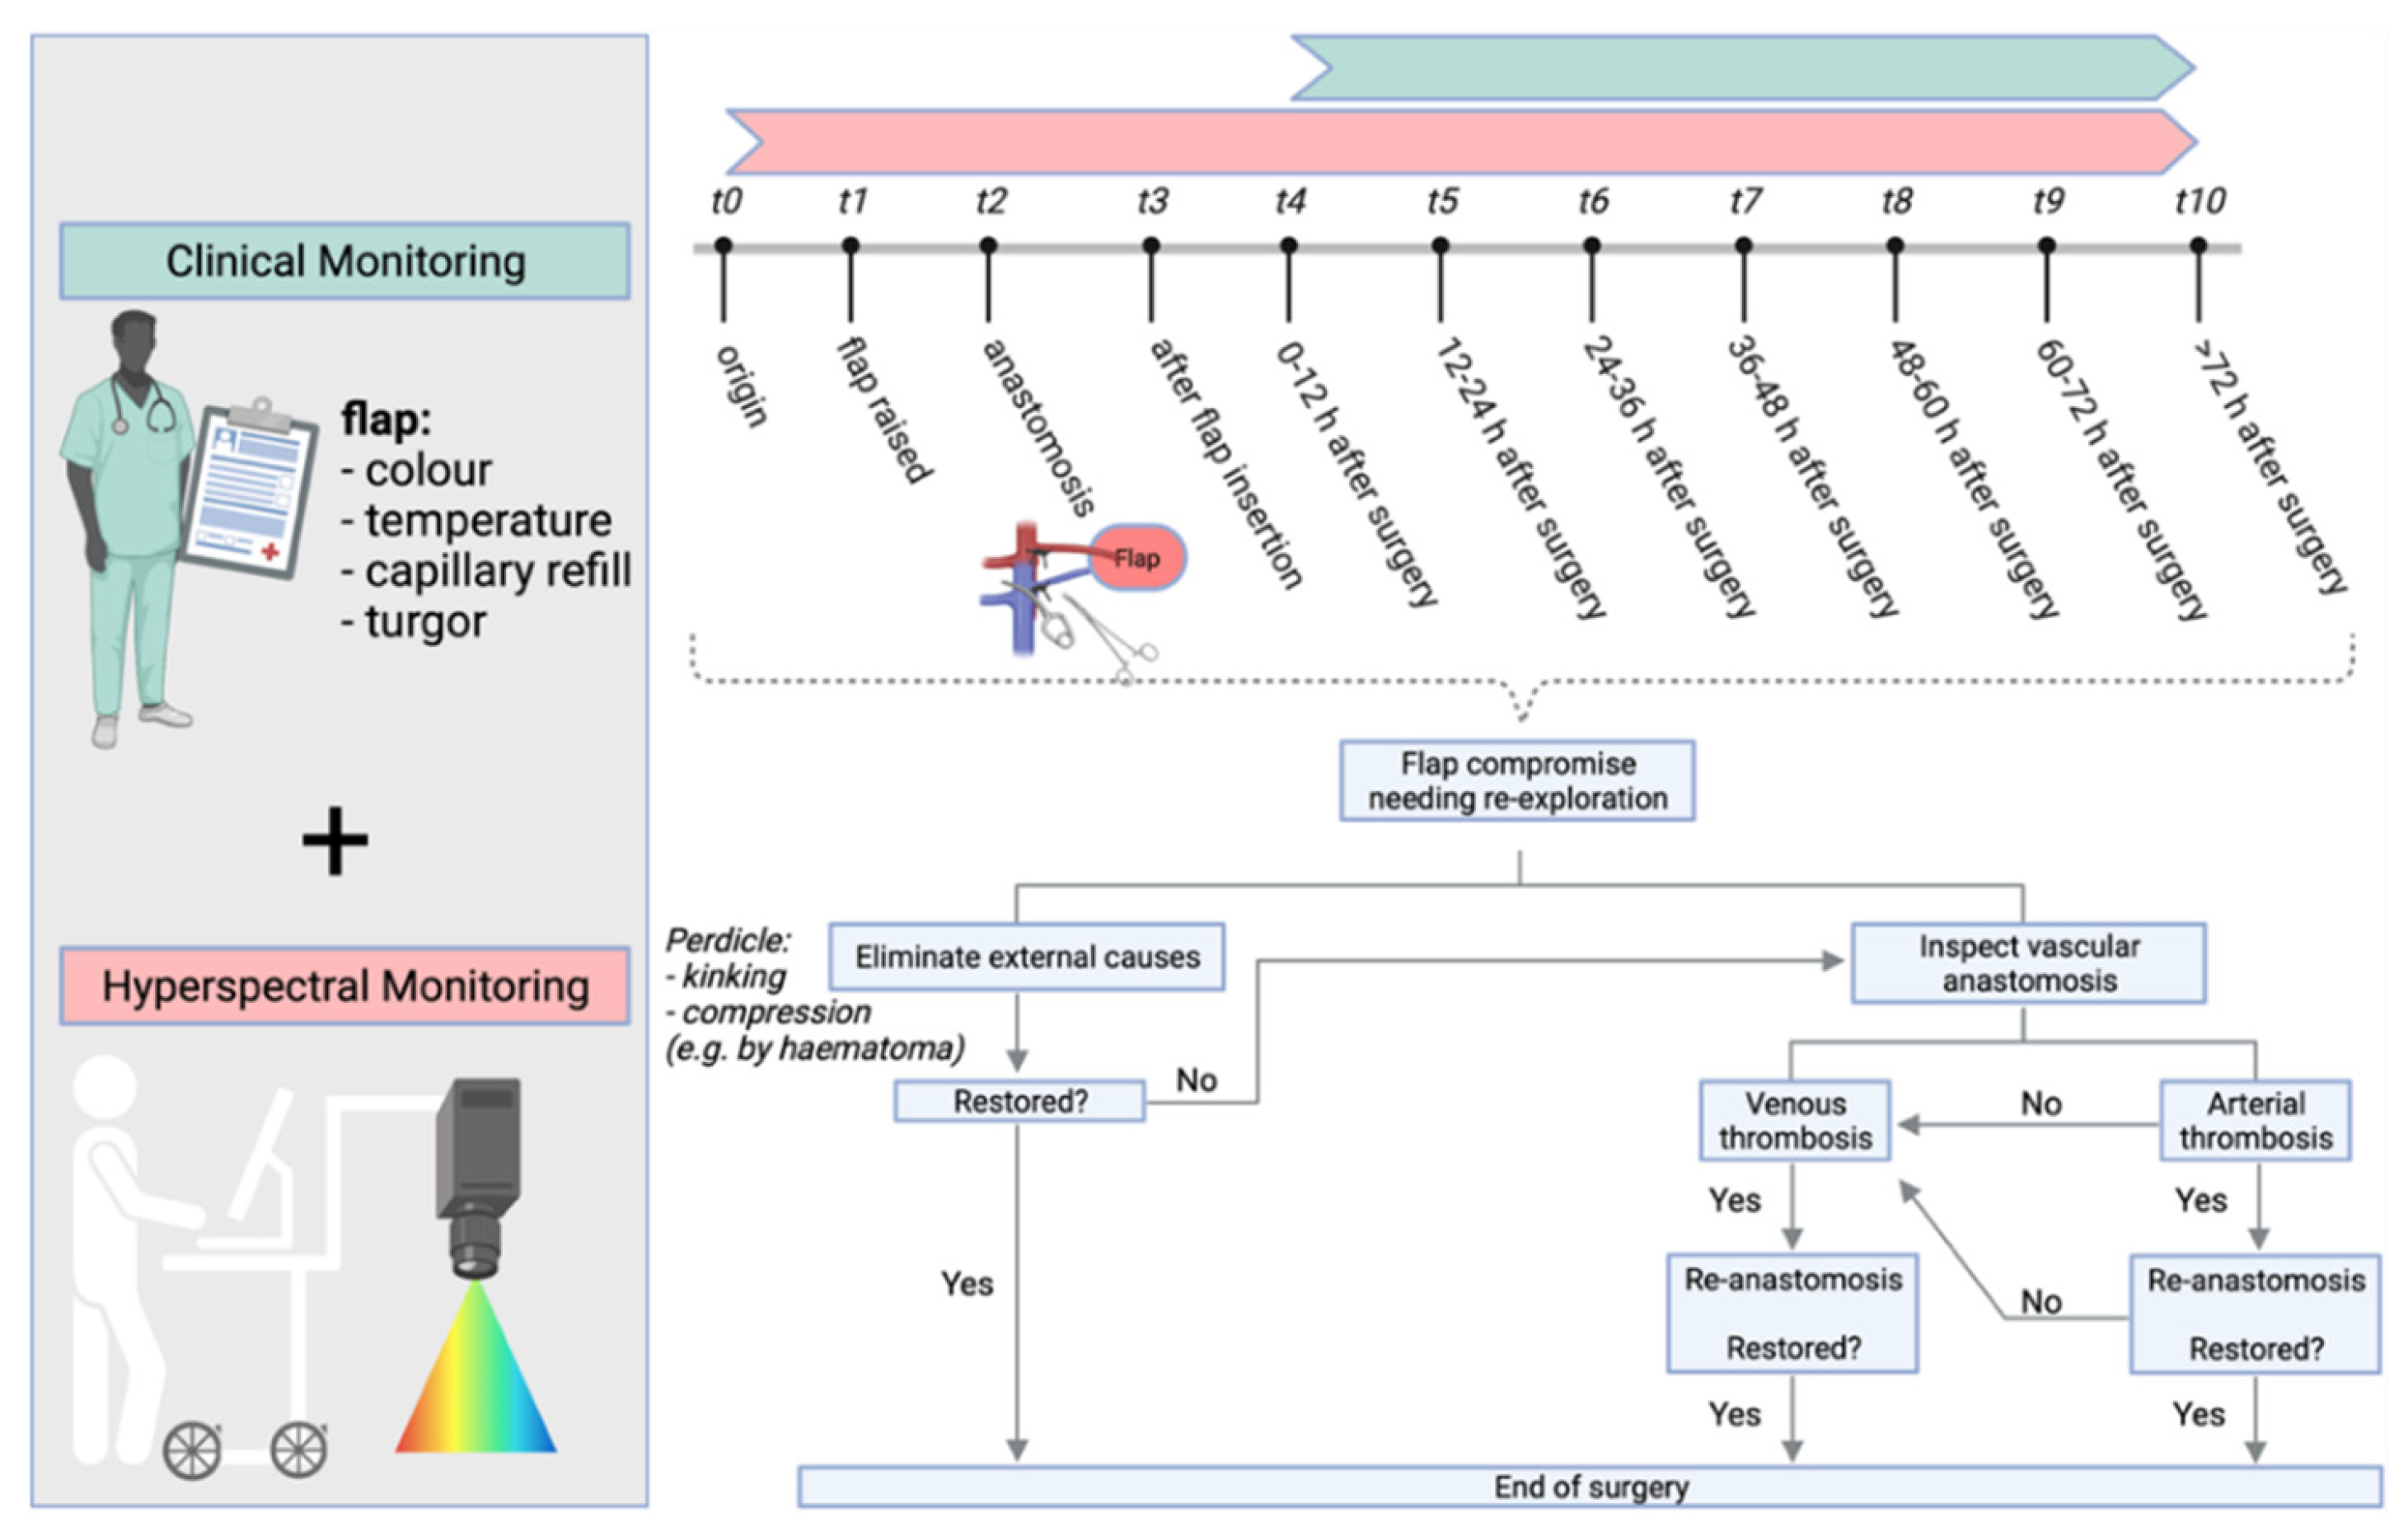
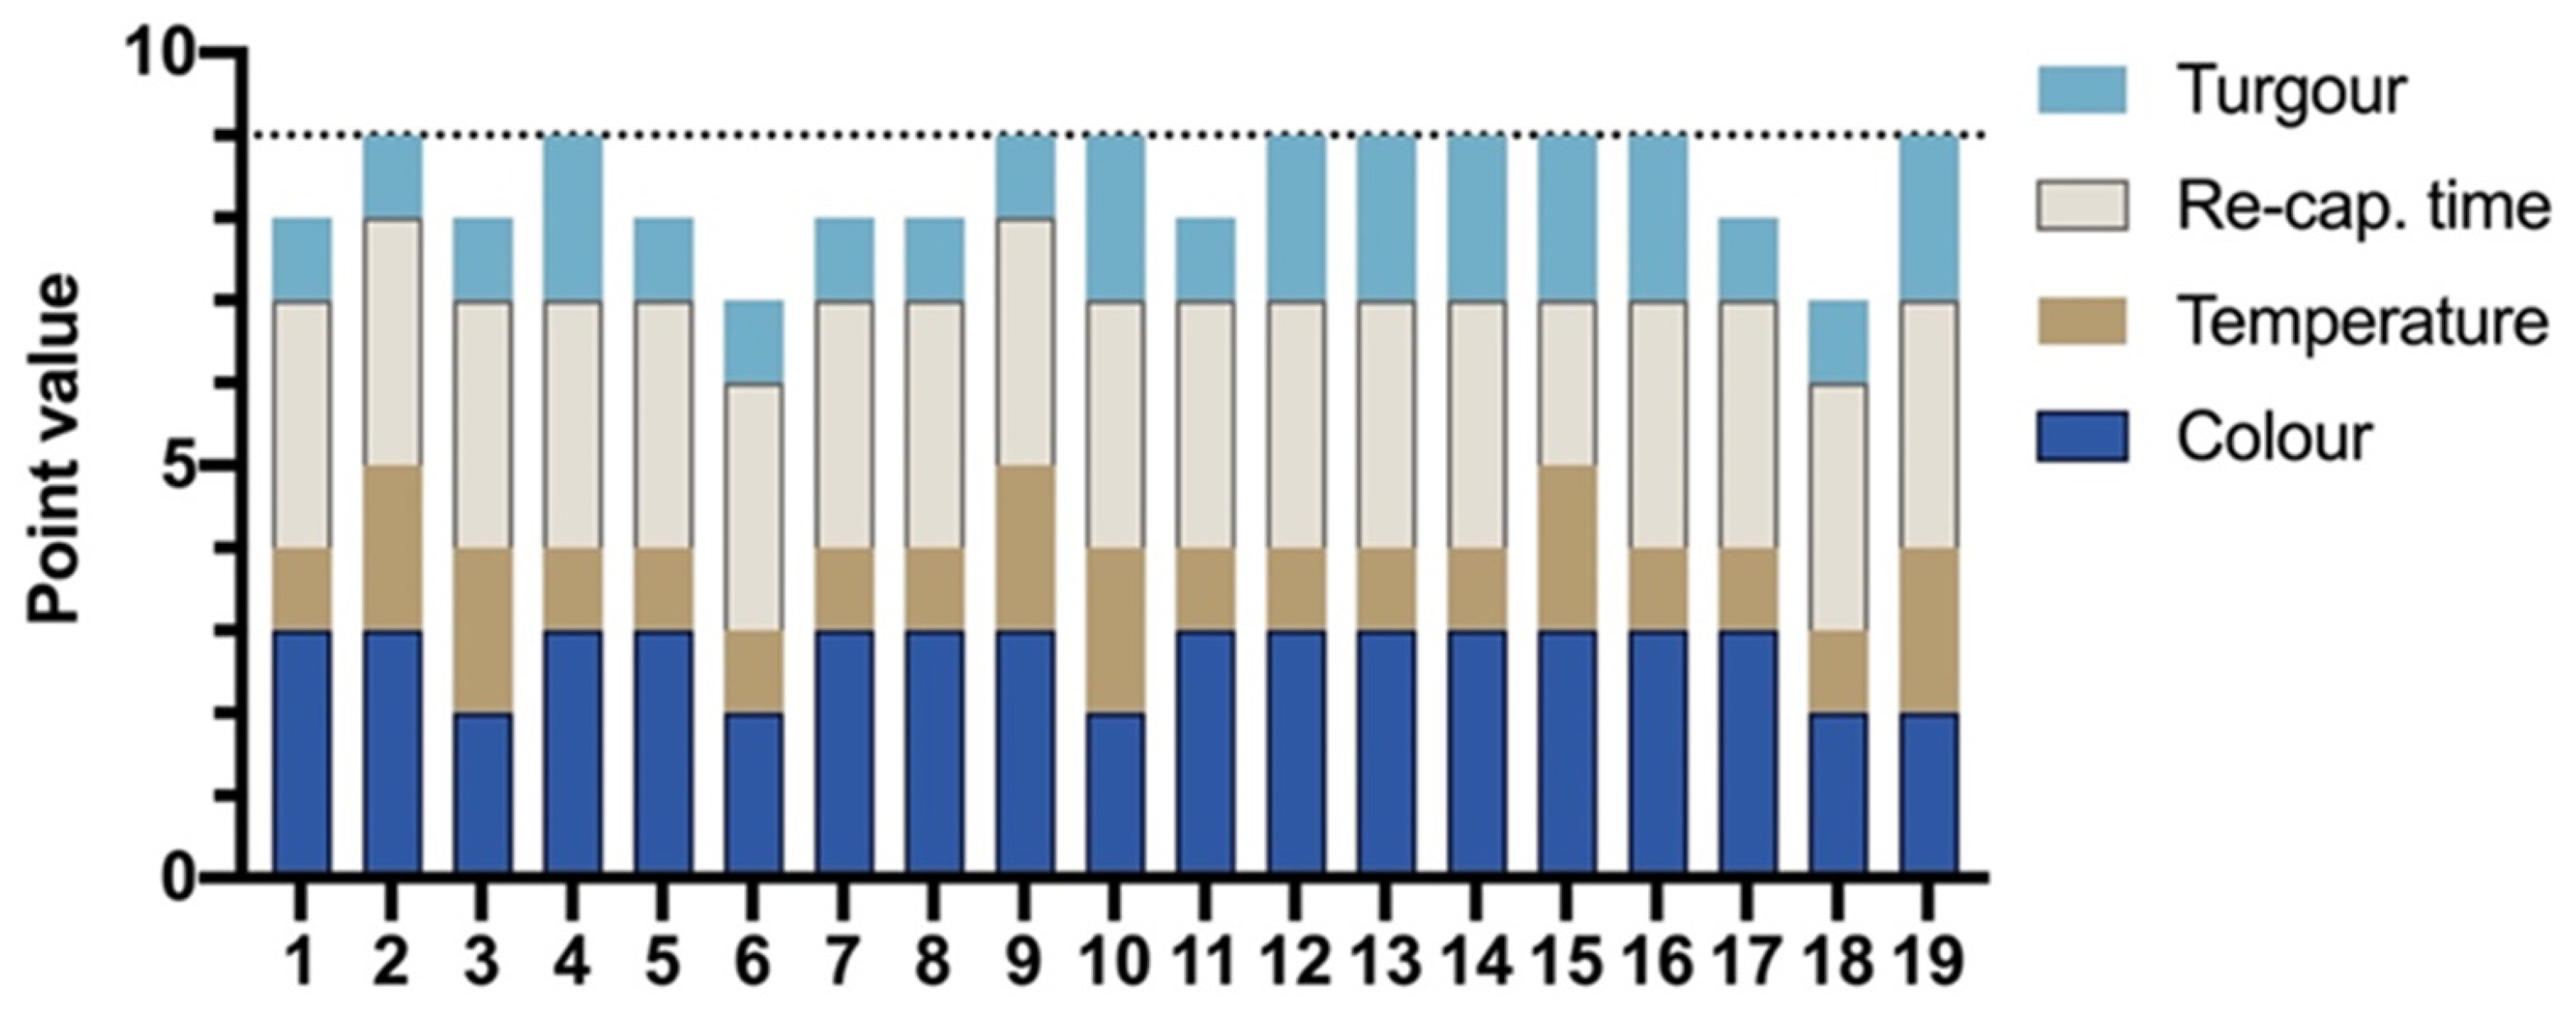
2.2.1. Clinical Monitoring
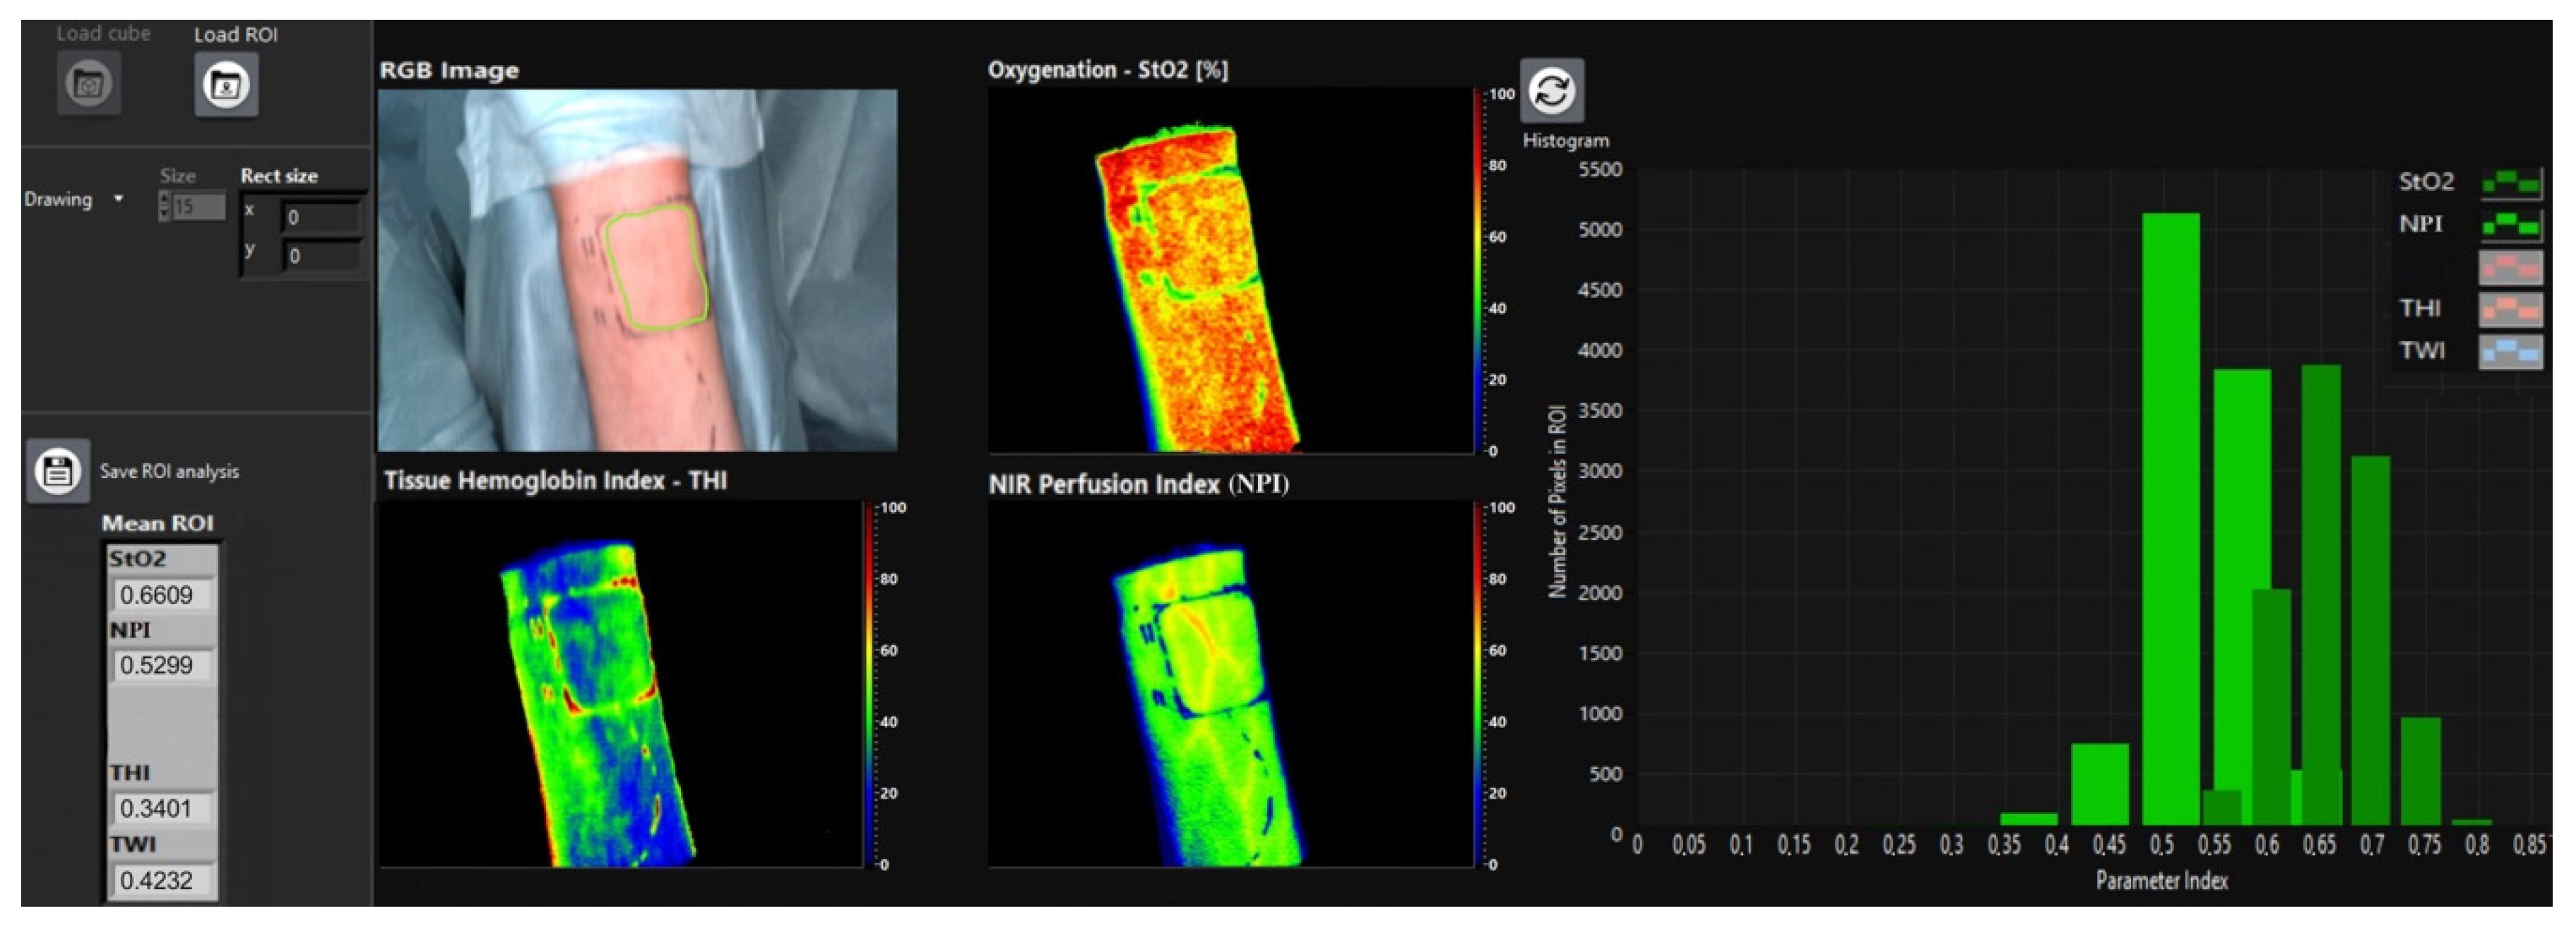
2.2.2. Hyperspectral Monitoring
2.3. Statistics
3. Results
3.1. Monitoring
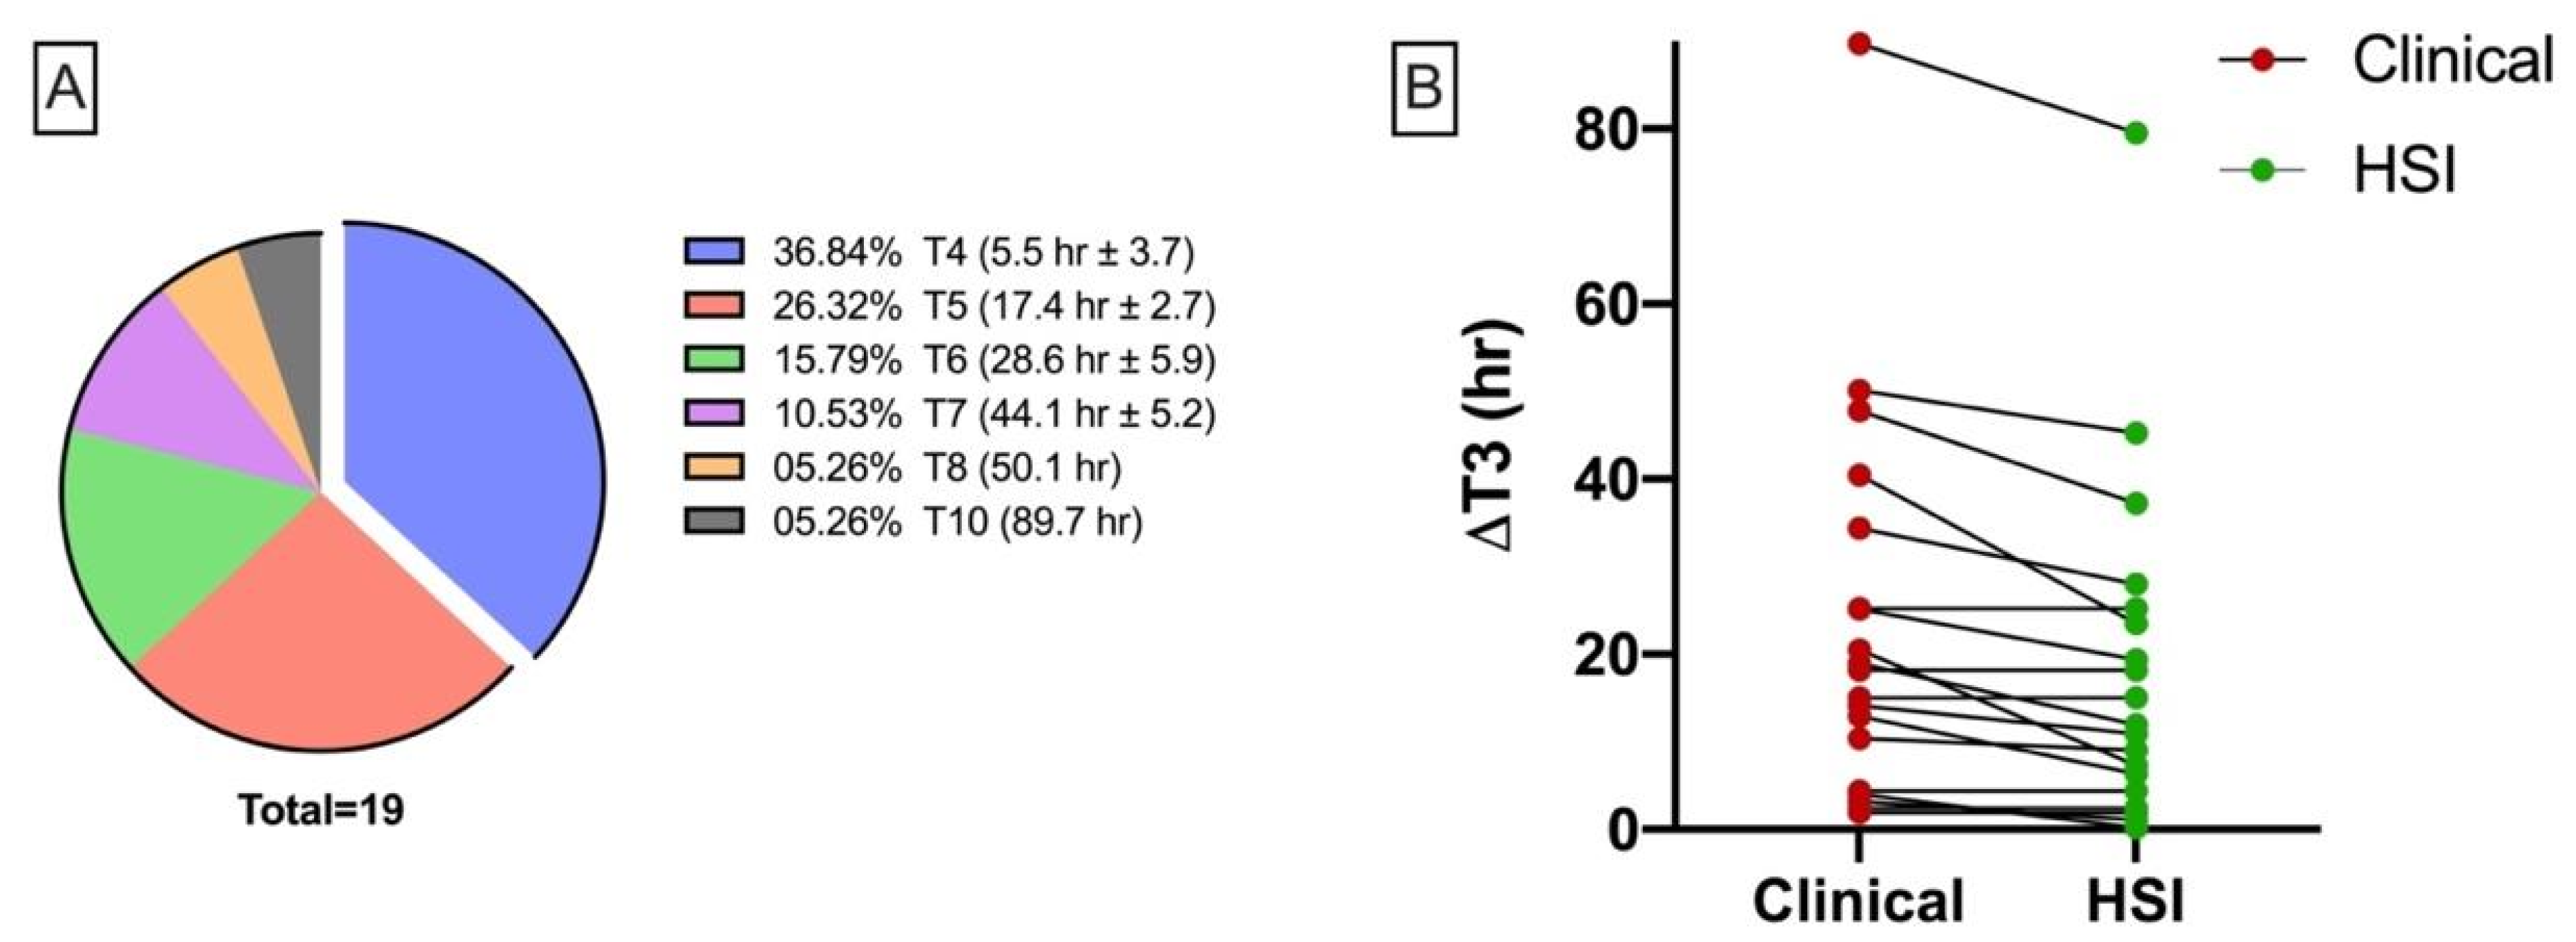
3.1.1. Clinical Monitoring Characteristics
3.1.2. General HSI Characteristics for Non-Revised and Revised Flaps
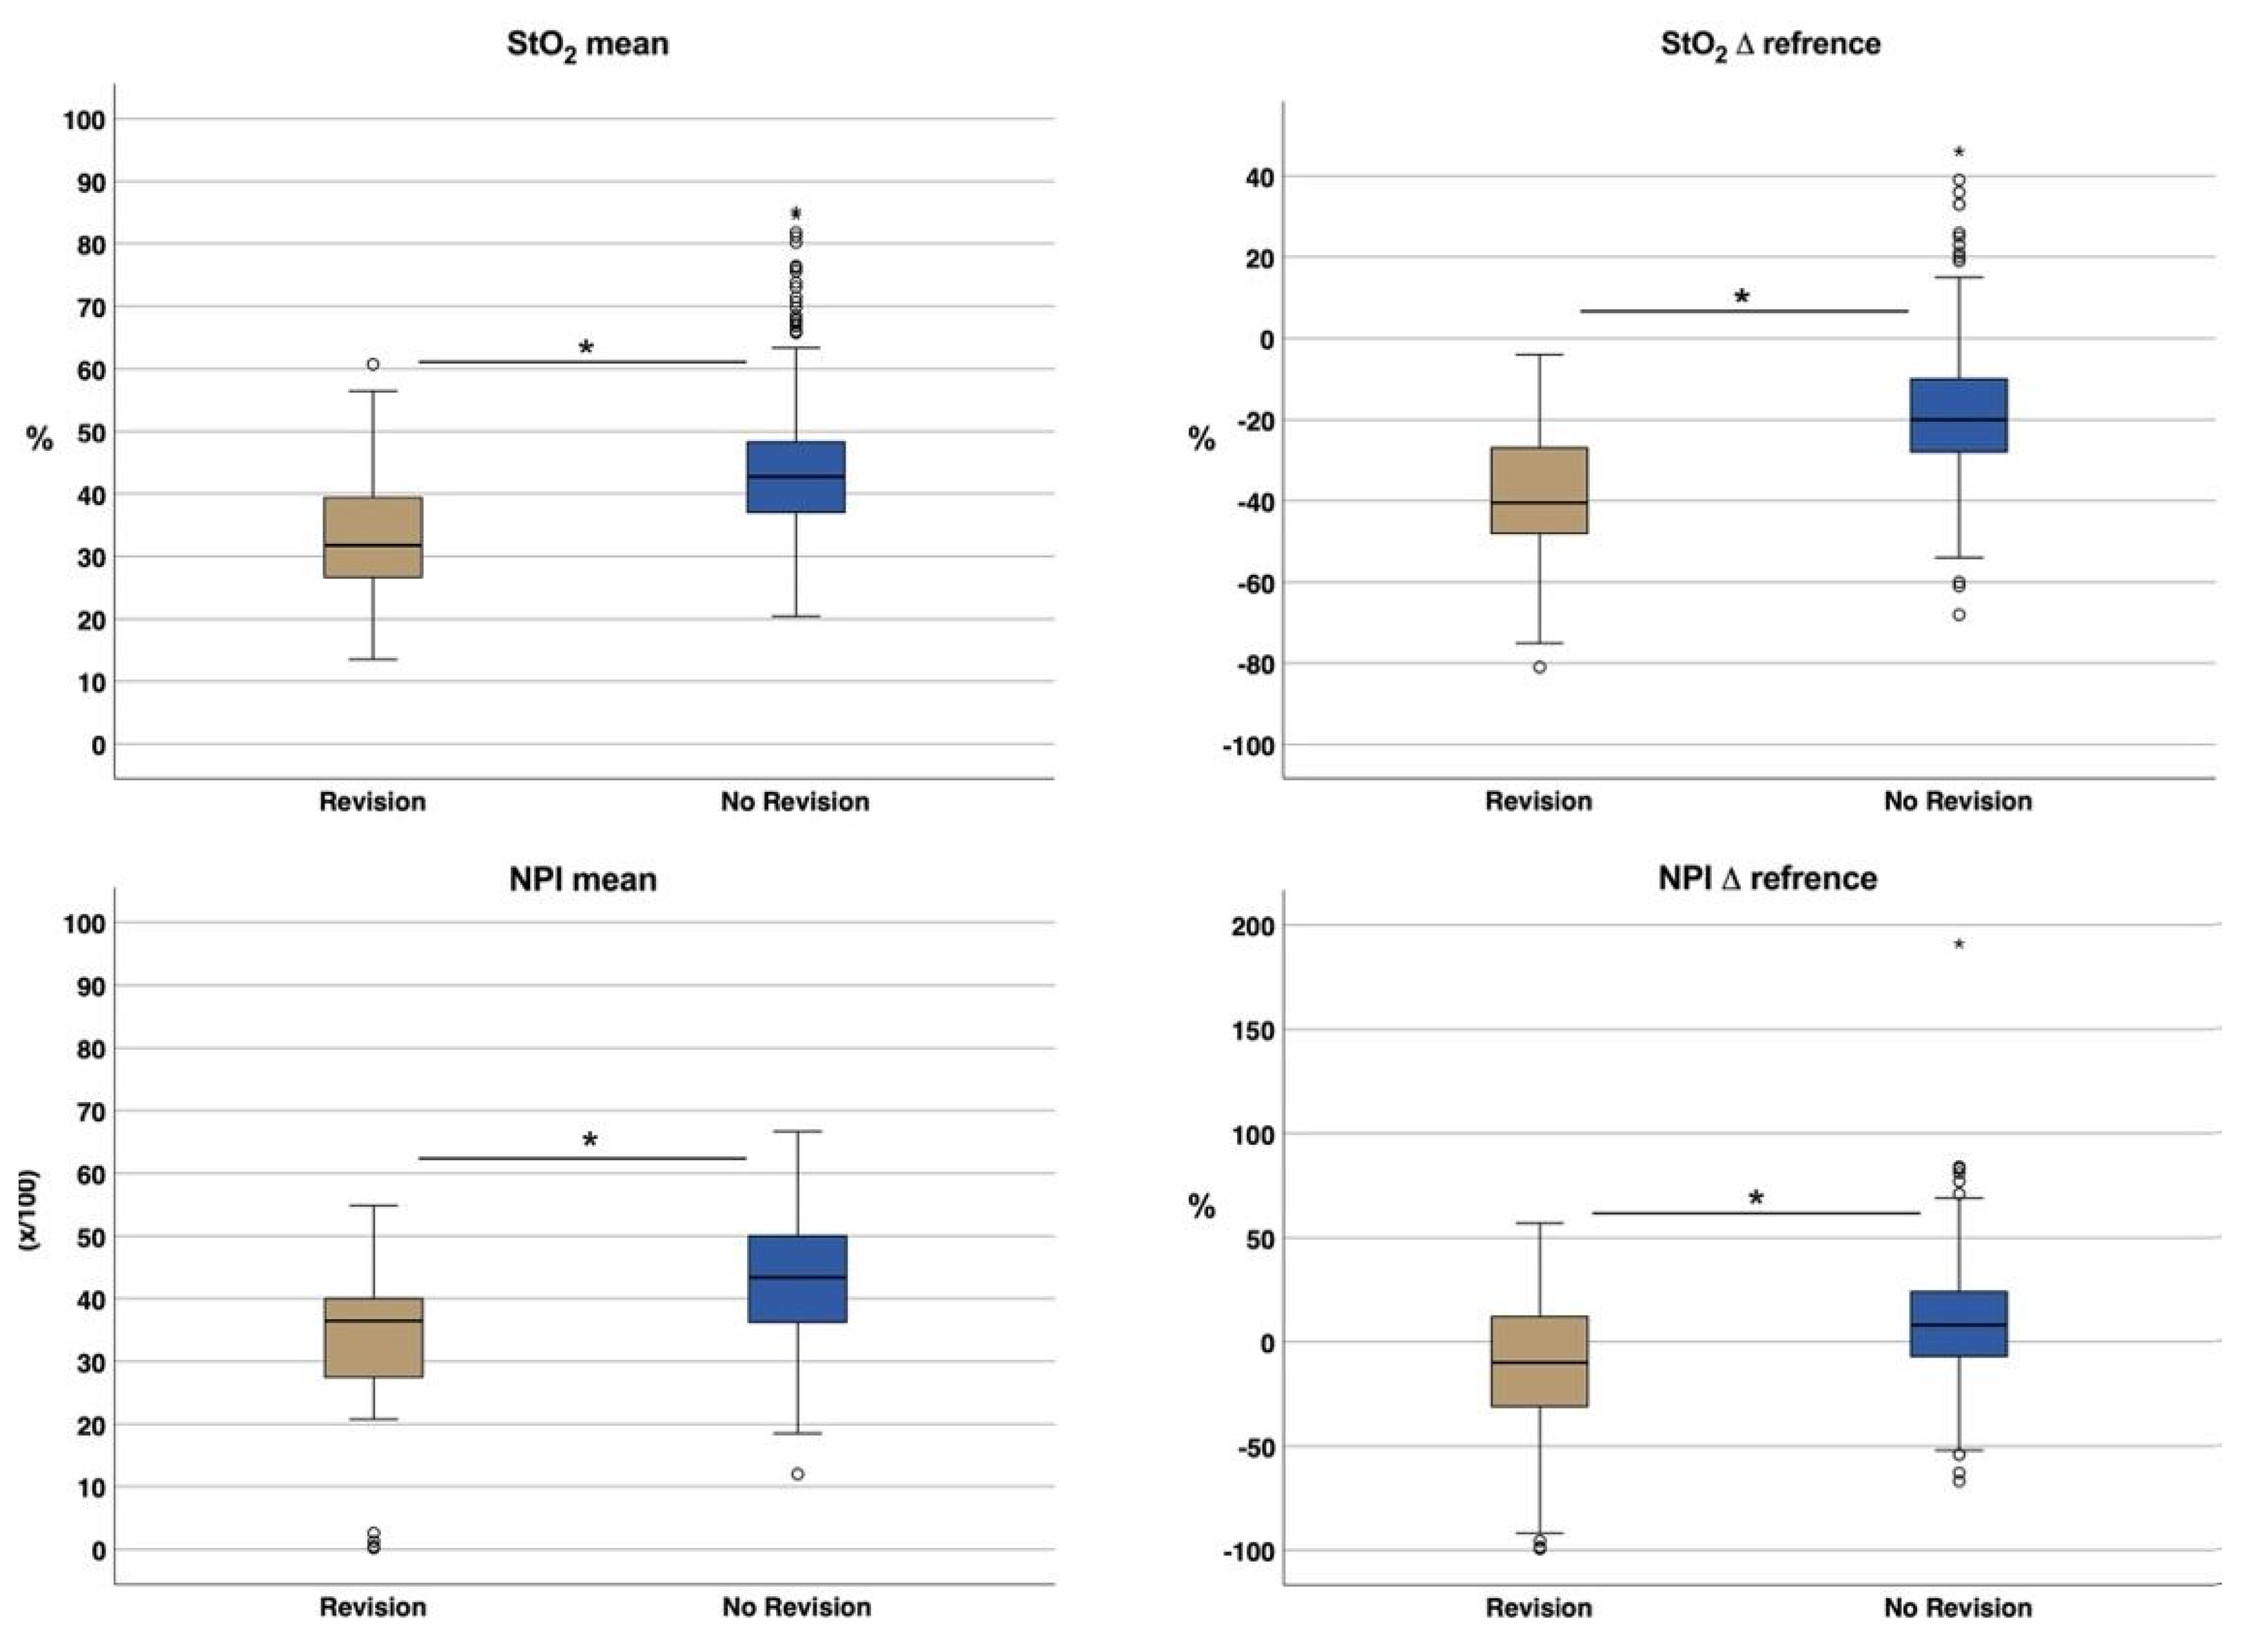
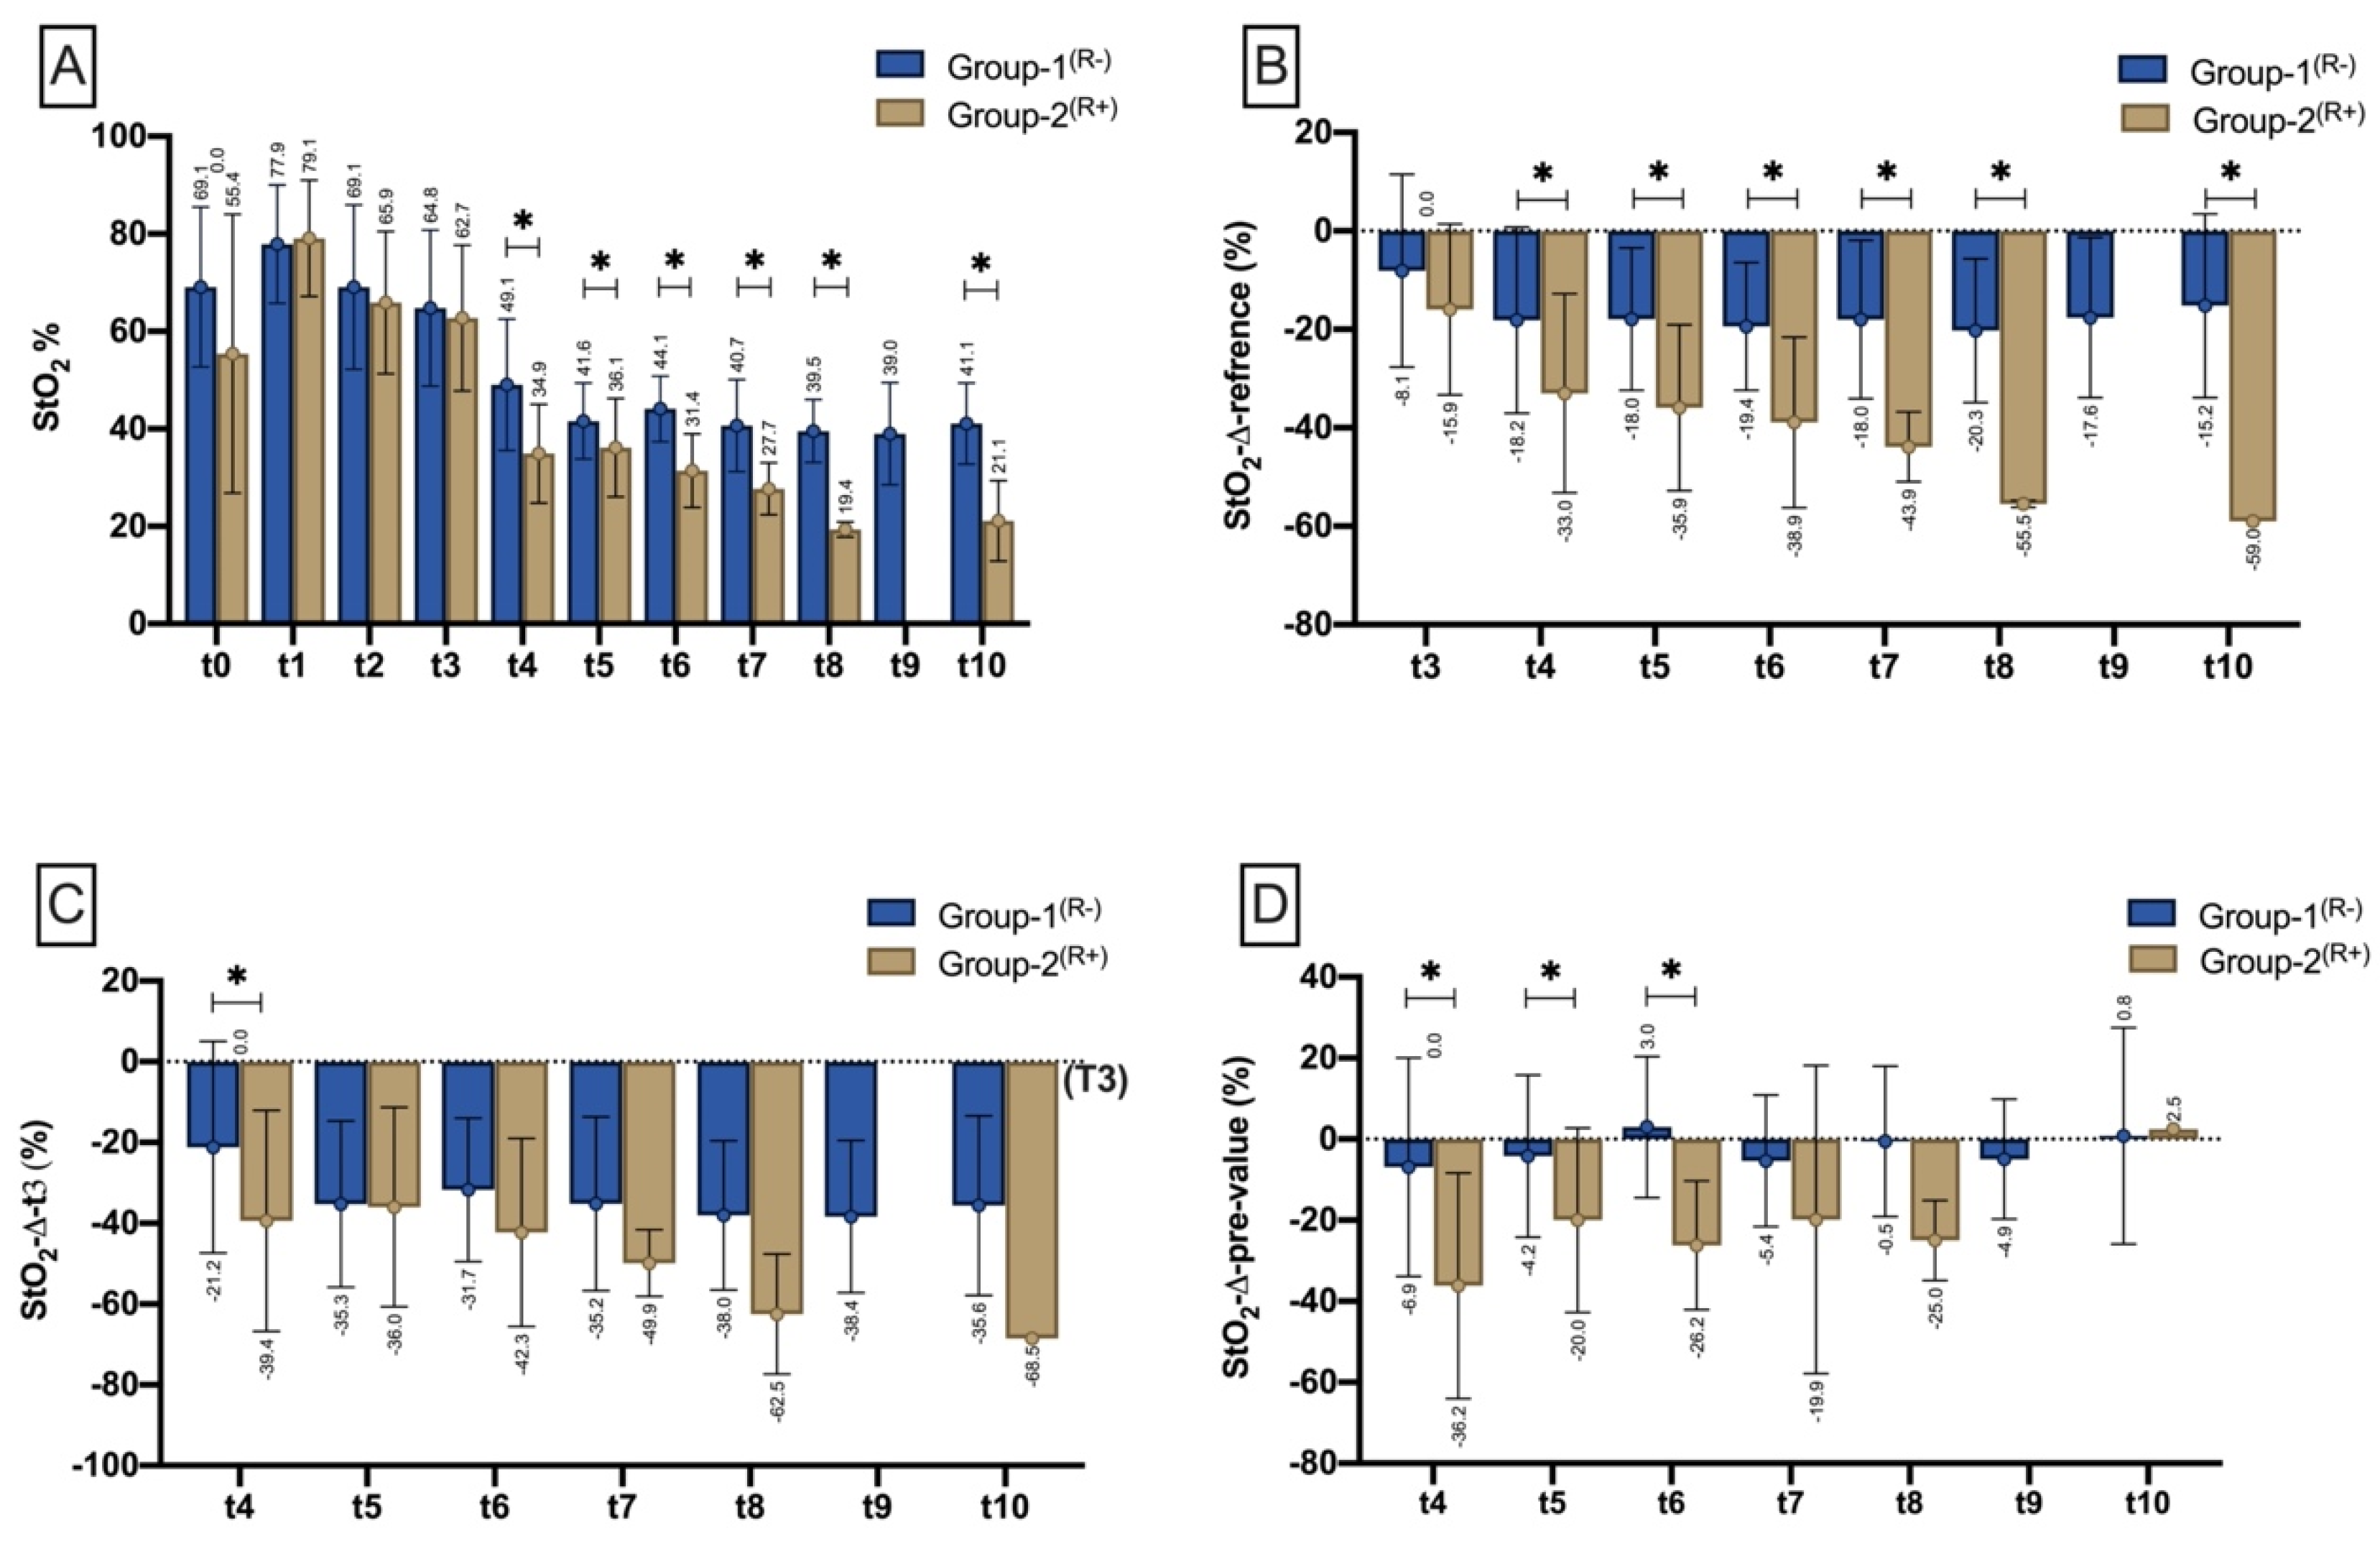
Oxygen Saturation of Haemoglobin (StO2)
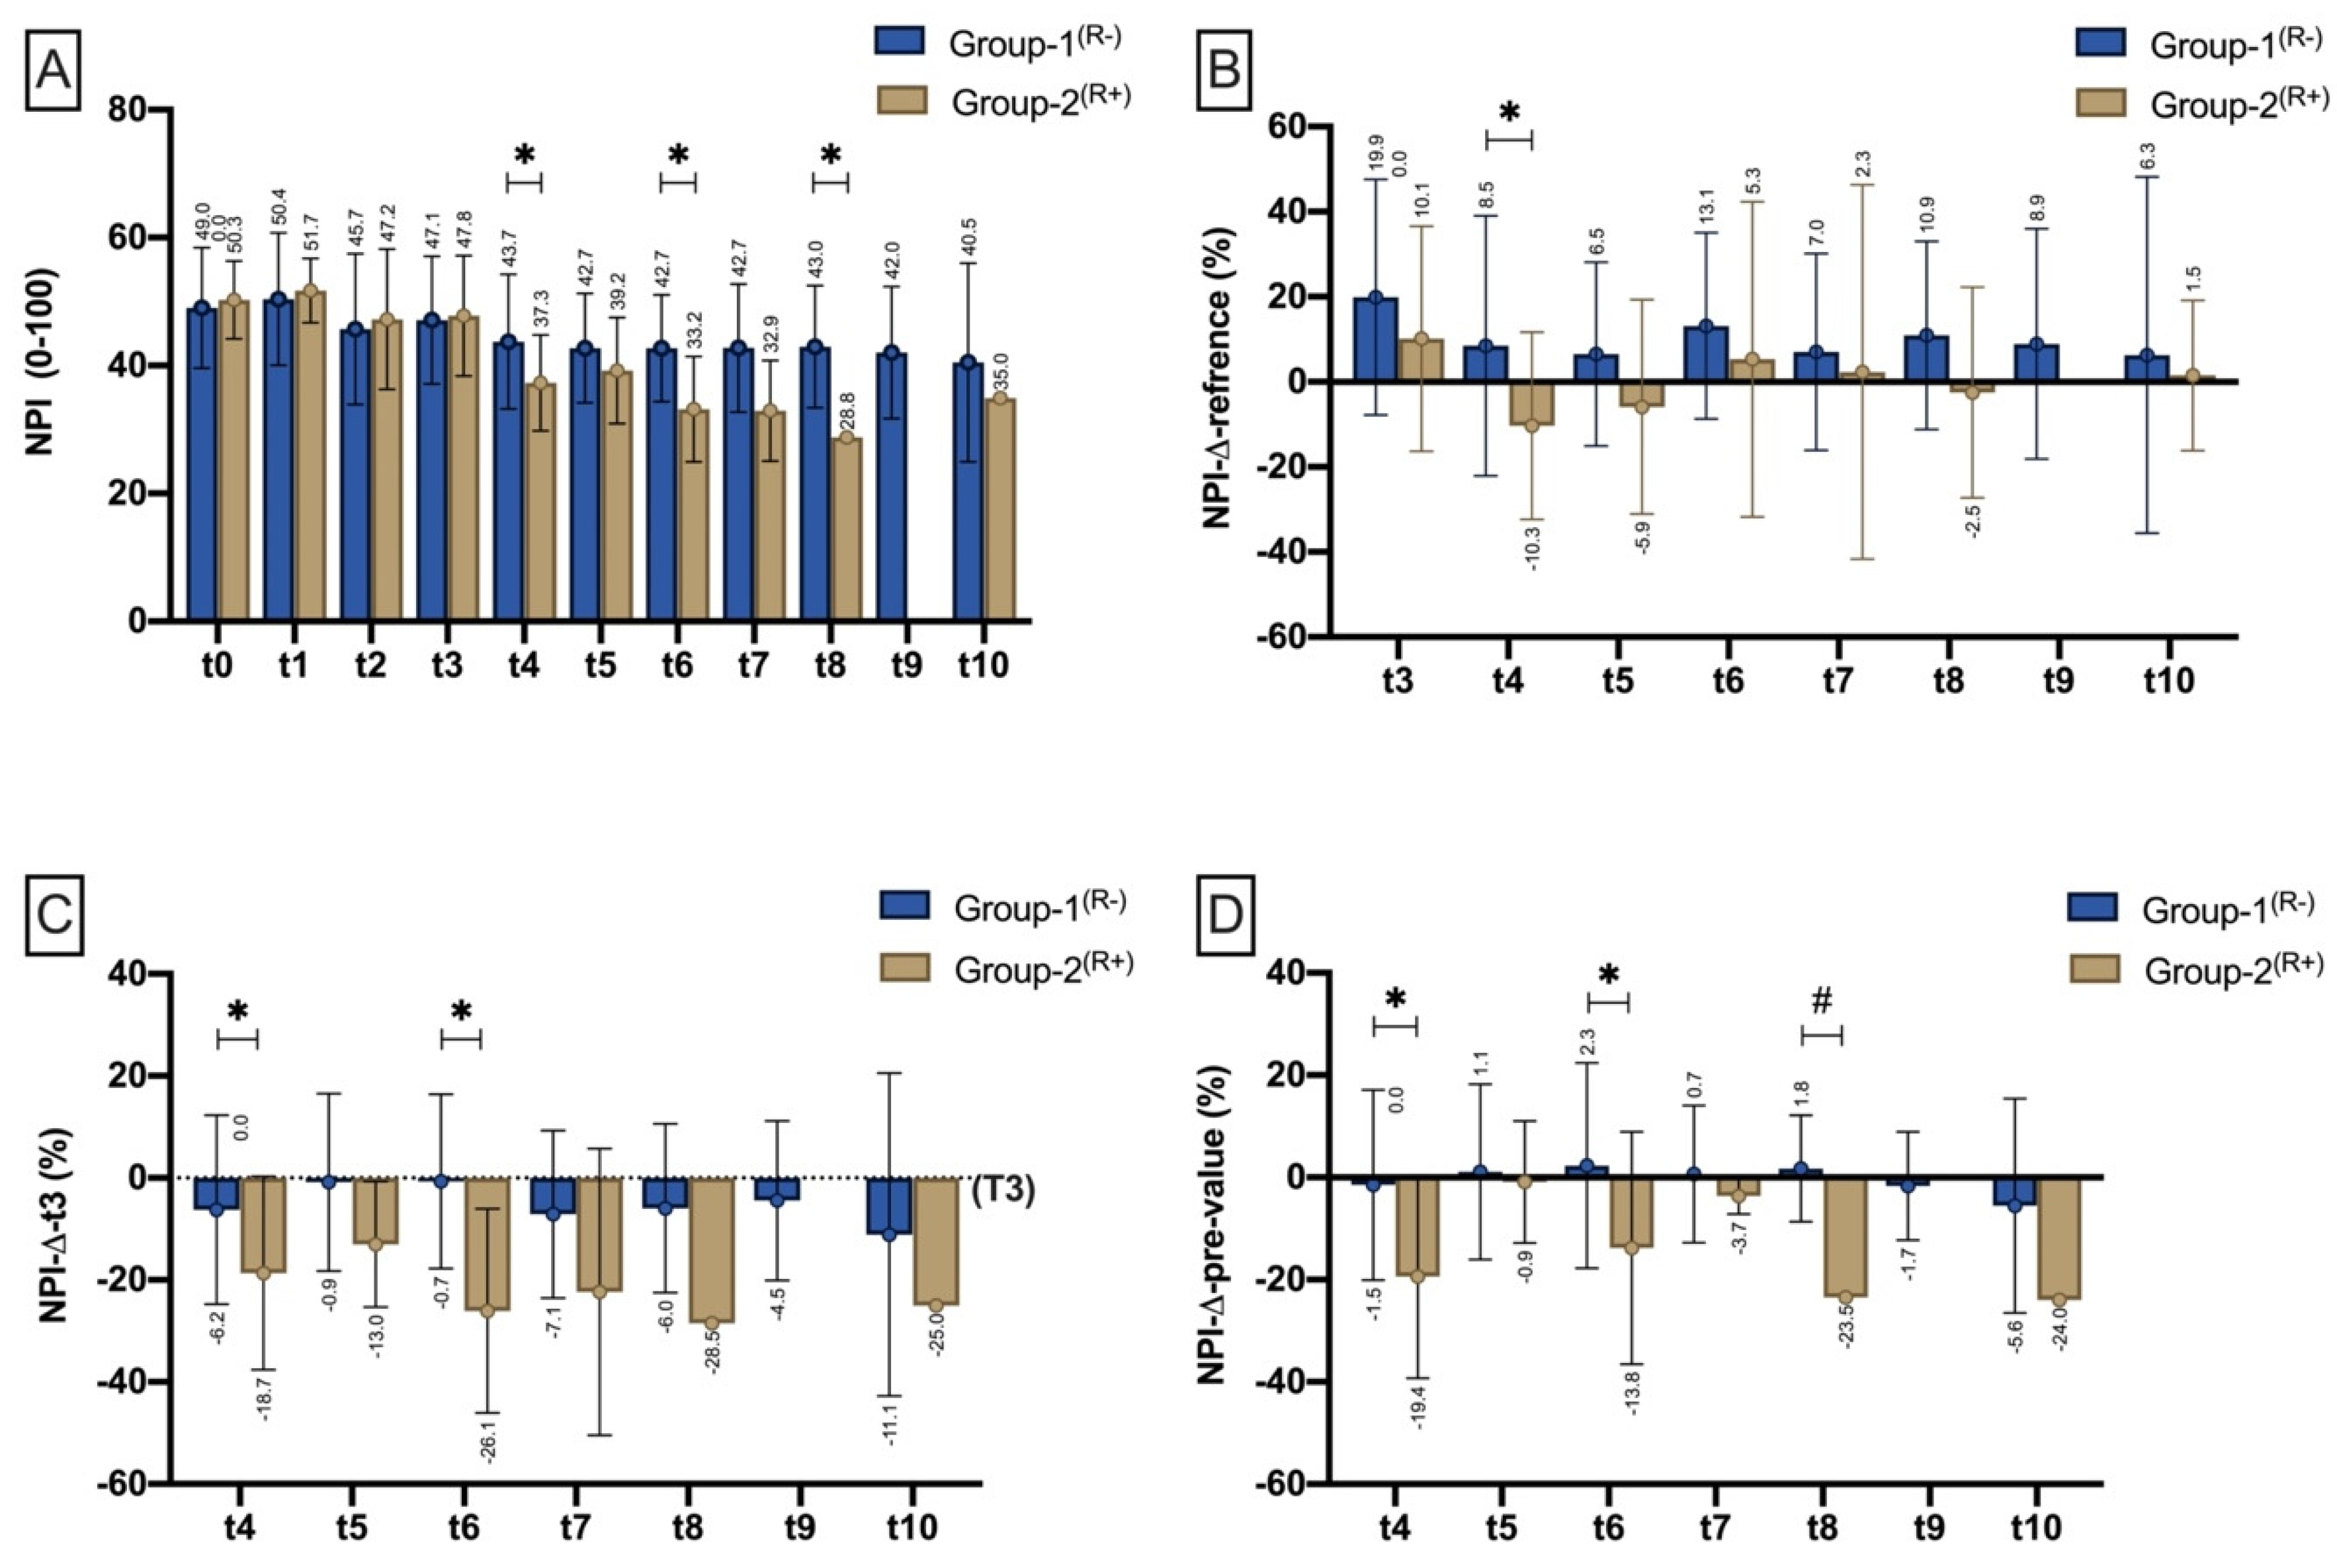
NIR-Perfusion Index (NPI)
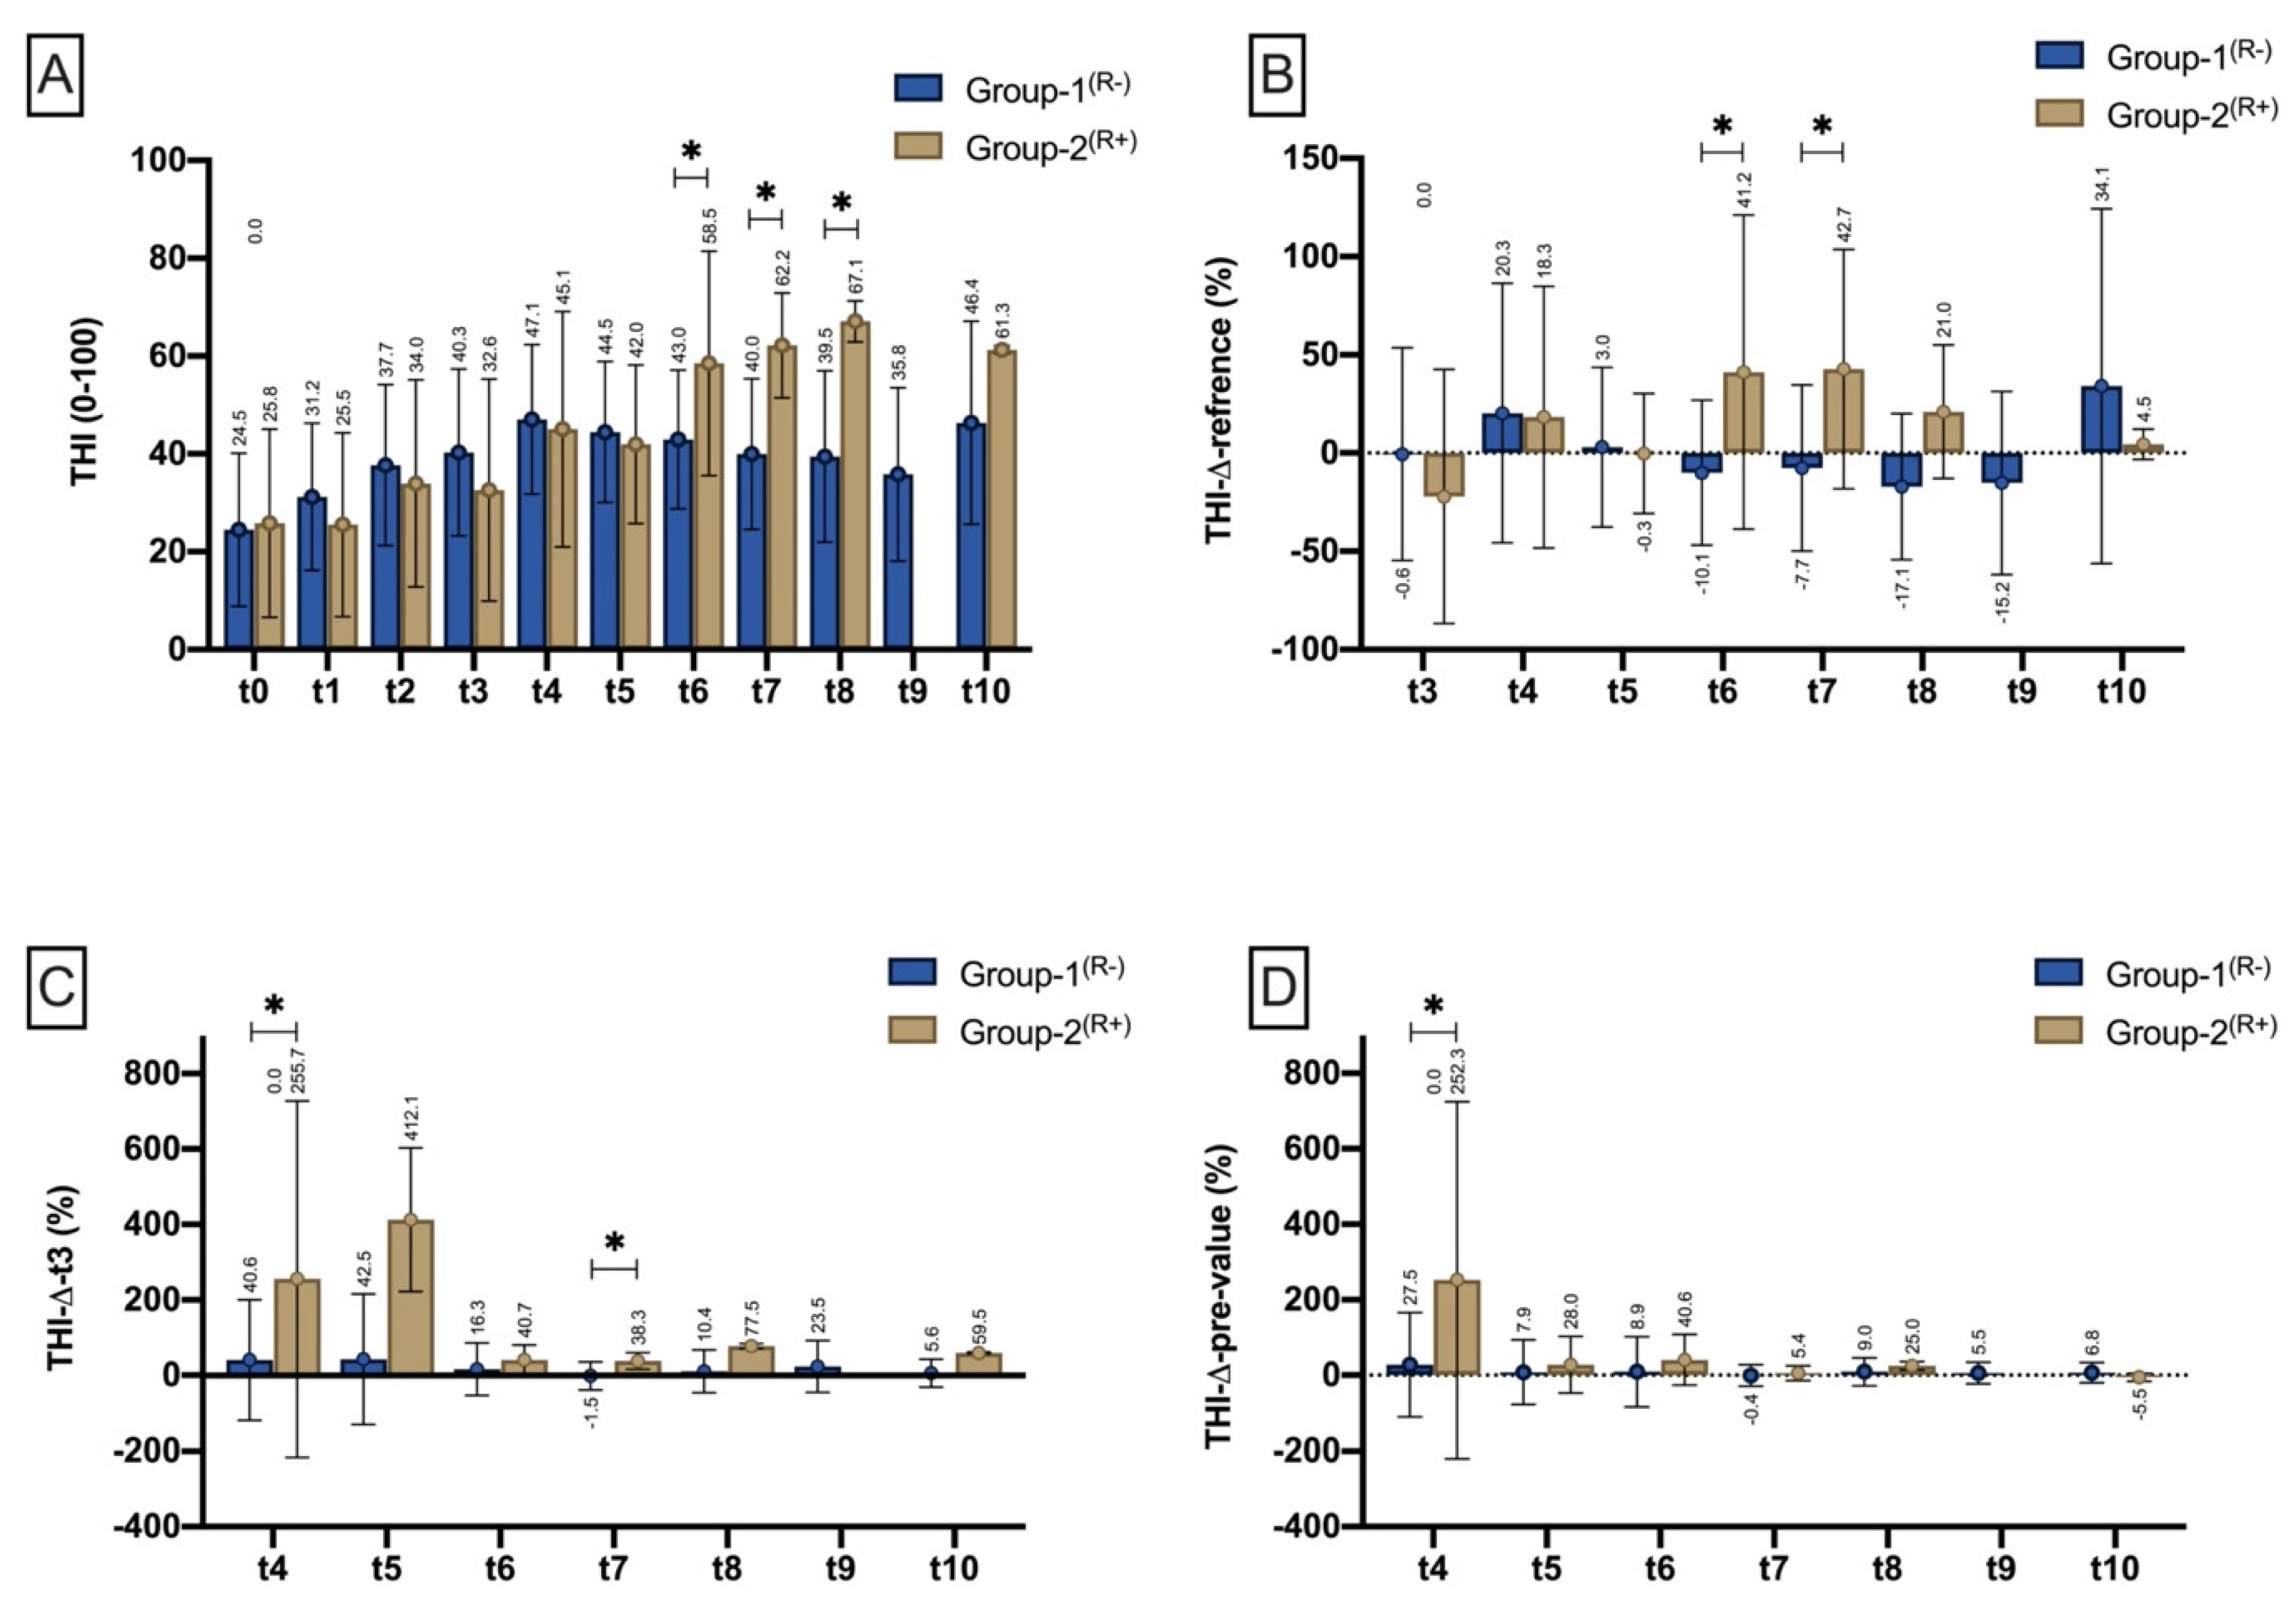
Tissue-Haemoglobin-Index (THI)
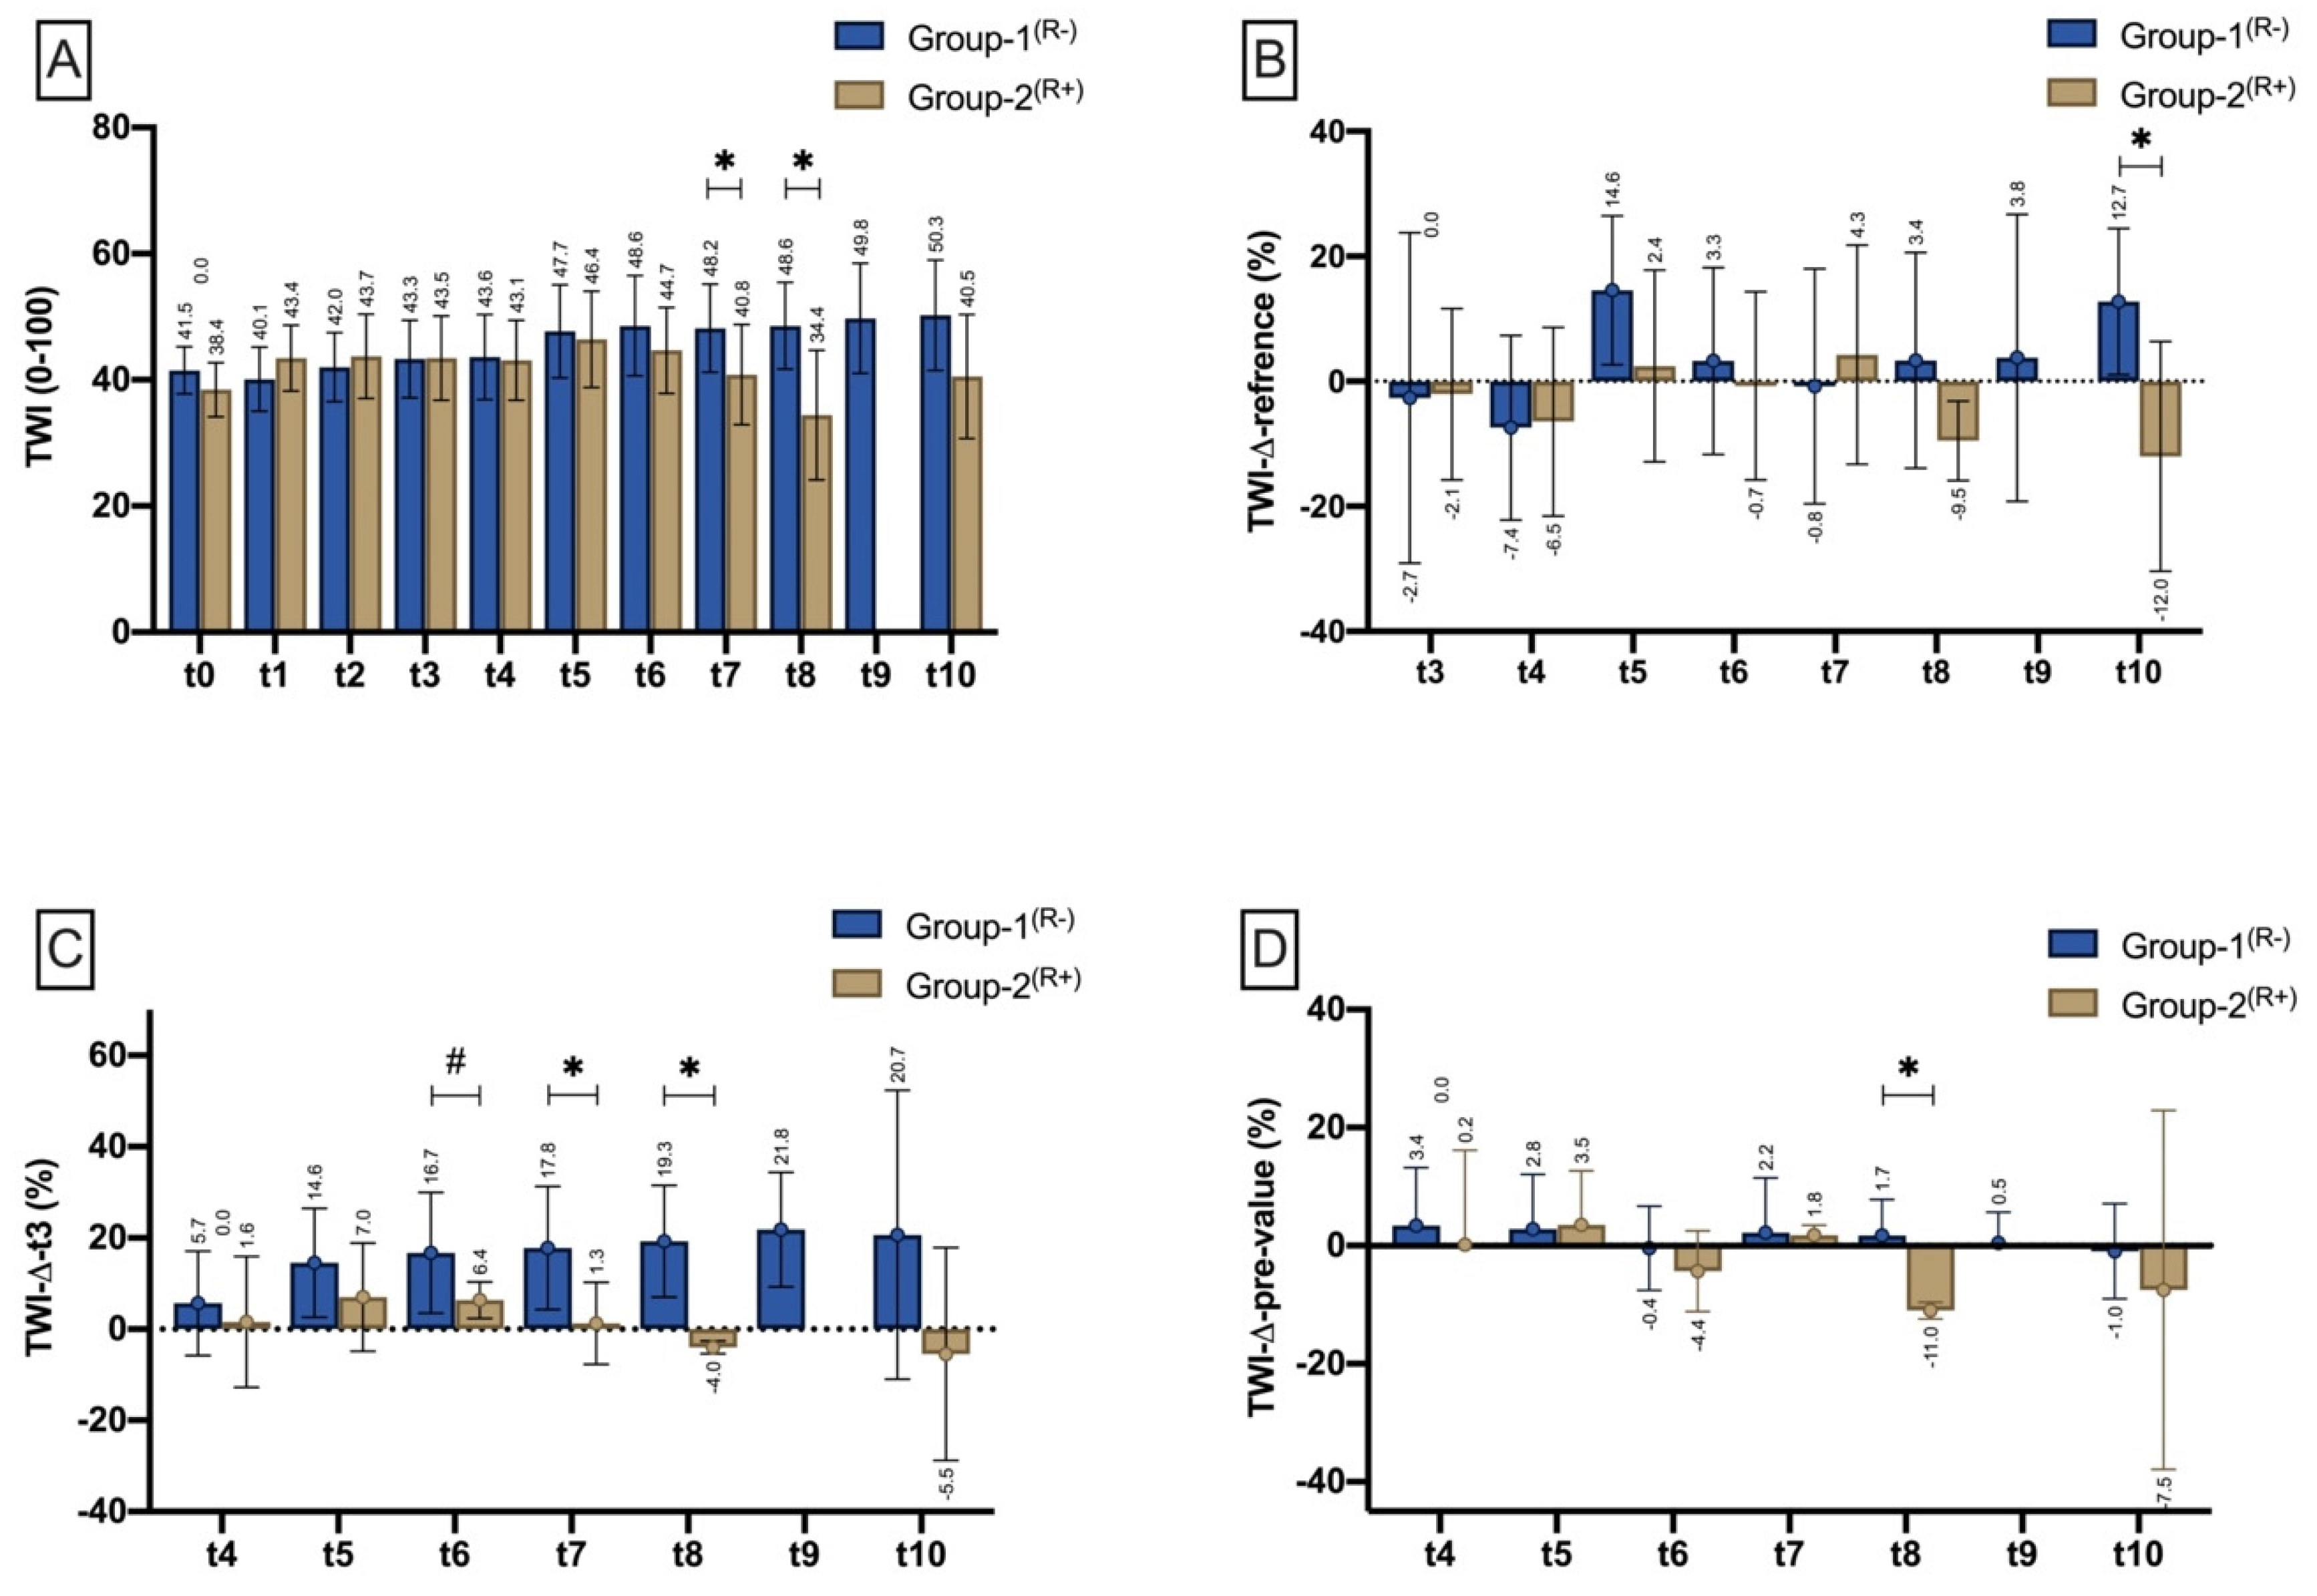
Tissue-Water-Index (TWI)
Duration until Signs of Malperfusion
4. Discussion
5. Conclusions
Author Contributions
Funding
Institutional Review Board Statement
Informed Consent Statement
Data Availability Statement
Conflicts of Interest
References
- Thiem, D.G.E.; Frick, R.W.; Goetze, E.; Gielisch, M.; Al-Nawas, B.; Kammerer, P.W. Hyperspectral analysis for perioperative perfusion monitoring-a clinical feasibility study on free and pedicled flaps. Clin. Oral Investig. 2021, 25, 933–945. [Google Scholar] [CrossRef] [PubMed]
- Rendenbach, C.; Holterhoff, N.; Hischke, S.; Kreutzer, K.; Smeets, R.; Assaf, A.T.; Heiland, M.; Wikner, J. Free flap surgery in Europe: An interdisciplinary survey. Int. J. Oral Maxillofac. Surg. 2018, 47, 676–682. [Google Scholar] [CrossRef] [PubMed]
- Frederick, J.W.; Sweeny, L.; Carroll, W.R.; Peters, G.E.; Rosenthal, E.L. Outcomes in head and neck reconstruction by surgical site and donor site. Laryngoscope 2013, 123, 1612–1617. [Google Scholar] [CrossRef]
- Kansy, K.; Mueller, A.A.; Mucke, T.; Koersgen, F.; Wolff, K.D.; Zeilhofer, H.F.; Holzle, F.; Pradel, W.; Schneider, M.; Kolk, A.; et al. Microsurgical reconstruction of the head and neck region: Current concepts of maxillofacial surgery units worldwide. J. Craniomaxillofac. Surg. 2015, 43, 1364–1368. [Google Scholar] [CrossRef]
- Aksoyler, D.; Losco, L.; Bolletta, A.; Ercan, A.; Chen, S.H.; Velazquez-Mujica, J.; Tang, Y.B.; Chen, H.C. Three salvage strategies in microvascular fibula osteocutaneous flap for mandible reconstruction with vascular compromise and establishment of an algorithm. Microsurgery 2021, 41, 223–232. [Google Scholar] [CrossRef] [PubMed]
- Sweeny, L.; Curry, J.; Crawley, M.; Cave, T.; Stewart, M.; Luginbuhl, A.; Heffelfinger, R.; Krein, H.; Petrisor, D.; Bender-Heine, A.; et al. Factors impacting successful salvage of the failing free flap. Head Neck 2020, 42, 3568–3579. [Google Scholar] [CrossRef]
- Zeng, Y.C.; Bongrani, S.; Bronzetti, E.; Cadel, S.; Ricci, A.; Valsecchi, B.; Amenta, F. Influence of long-term treatment with L-deprenyl on the age-dependent changes in rat brain microanatomy. Mech. Ageing Dev. 1994, 73, 113–126. [Google Scholar] [CrossRef]
- Chang, C.S.; Chu, M.W.; Nelson, J.A.; Basta, M.; Gerety, P.; Kanchwala, S.K.; Wu, L.C. Complications and Cost Analysis of Intraoperative Arterial Complications in Head and Neck Free Flap Reconstruction. J. Reconstr. Microsurg. 2017, 33, 318–327. [Google Scholar] [CrossRef]
- Sweeny, L.; Rosenthal, E.L.; Light, T.; Grayson, J.; Petrisor, D.; Troob, S.H.; Greene, B.J.; Carroll, W.R.; Wax, M.K. Outcomes and cost implications of microvascular reconstructions of the head and neck. Head Neck 2019, 41, 930–939. [Google Scholar] [CrossRef]
- Kohlert, S.; Quimby, A.E.; Saman, M.; Ducic, Y. Postoperative Free-Flap Monitoring Techniques. Semin. Plast. Surg. 2019, 33, 13–16. [Google Scholar] [CrossRef]
- Holmer, A.; Marotz, J.; Wahl, P.; Dau, M.; Kammerer, P.W. Hyperspectral imaging in perfusion and wound diagnostics—Methods and algorithms for the determination of tissue parameters. Biomed. Tech. Eng. 2018, 63, 547–556. [Google Scholar] [CrossRef]
- Grambow, E.; Dau, M.; Holmer, A.; Lipp, V.; Frerich, B.; Klar, E.; Vollmar, B.; Kammerer, P.W. Hyperspectral imaging for monitoring of perfusion failure upon microvascular anastomosis in the rat hind limb. Microvasc. Res. 2018, 116, 64–70. [Google Scholar] [CrossRef] [PubMed]
- Thiem, D.G.E.; Hans, L.; Blatt, S.; Römer, P.; Heimes, D.; Al-Nawas, B.; Kämmerer, P.W. Hyperspectral Imaging to Study Dynamic Skin Perfusion after Injection of Articaine-4% with and without Epinephrine—Clinical Implications on Local Vasoconstriction. J. Clin. Med. 2021, 10, 3411. [Google Scholar] [CrossRef] [PubMed]
- Halicek, M.; Fabelo, H.; Ortega, S.; Callico, G.M.; Fei, B. In-Vivo and Ex-Vivo Tissue Analysis through Hyperspectral Imaging Techniques: Revealing the Invisible Features of Cancer. Cancers 2019, 11, 756. [Google Scholar] [CrossRef] [Green Version]
- Chen, P.C.; Lin, W.C. Spectral-profile-based algorithm for hemoglobin oxygen saturation determination from diffuse reflectance spectra. Biomed. Opt. Express 2011, 2, 1082–1096. [Google Scholar] [CrossRef] [PubMed]
- Steinke, J.M.; Shepherd, A.P. Effects of temperature on optical absorbance spectra of oxy-, carboxy-, and deoxyhemoglobin. Clin. Chem. 1992, 38, 1360–1364. [Google Scholar] [CrossRef]
- Bashkatov, A.N.; Genina, E.A.; Kochubey, V.I.; Tuchin, V.V. Optical properties of human skin, subcutaneous and mucous tissues in the wavelength range from 400 to 2000 nm. J. Phys. D Appl. Phys. 2005, 38, 2543–2555. [Google Scholar] [CrossRef]
- Bickler, P.E.; Feiner, J.R.; Rollins, M.D. Factors affecting the performance of 5 cerebral oximeters during hypoxia in healthy volunteers. Anesth. Analg. 2013, 117, 813–823. [Google Scholar] [CrossRef]
- McAdams, D.R.; Stapels, C.J.; Kolodziejski, N.J.; Chung, Y.G.; Vishwanath, K.; Helton, M.C.; Pakela, J.M.; Lee, S.Y. Compact dual-mode diffuse optical system for blood perfusion monitoring in a porcine model of microvascular tissue flaps. J. Biomed. Opt. 2017, 22, 1–14. [Google Scholar] [CrossRef]
- Khan, M.; Pretty, C.G.; Amies, A.C.; Balmer, J.; Banna, H.E.; Shaw, G.M.; Geoffrey Chase, J. Proof of concept non-invasive estimation of peripheral venous oxygen saturation. Biomed. Eng. Online 2017, 16, 60. [Google Scholar] [CrossRef] [Green Version]
- Mucke, T.; Rau, A.; Merezas, A.; Loeffelbein, D.J.; Wagenpfeil, S.; Mitchell, D.A.; Wolff, K.D.; Steiner, T. Identification of perioperative risk factor by laser-doppler spectroscopy after free flap perfusion in the head and neck: A prospective clinical study. Microsurgery 2014, 34, 345–351. [Google Scholar] [CrossRef]
- Chae, M.P.; Rozen, W.M.; Whitaker, I.S.; Chubb, D.; Grinsell, D.; Ashton, M.W.; Hunter-Smith, D.J.; Lineaweaver, W.C. Current evidence for postoperative monitoring of microvascular free flaps: A systematic review. Ann. Plast. Surg. 2015, 74, 621–632. [Google Scholar] [CrossRef] [PubMed] [Green Version]
- Kudpaje, A.; Thankappan, K.; Rajan, R.P.; Vidhyadharan, S.; Balasubramanian, D.; Wakure, A.; Mathew, J.; Sharma, M.; Iyer, S. Outcomes of Re-exploration Procedures After Head and Neck Free Flap Reconstruction. Indian J. Surg. Oncol. 2021, 12, 530–537. [Google Scholar] [CrossRef]
- Bui, D.T.; Cordeiro, P.G.; Hu, Q.-Y.; Disa, J.J.; Pusic, A.; Mehrara, B.J. Free Flap Reexploration: Indications, Treatment, and Outcomes in 1193 Free Flaps. Plast. Reconstr. Surg. 2007, 119, 2092–2100. [Google Scholar] [CrossRef]
- Holzle, F.; Rau, A.; Loeffelbein, D.J.; Mucke, T.; Kesting, M.R.; Wolff, K.D. Results of monitoring fasciocutaneous, myocutaneous, osteocutaneous and perforator flaps: 4-year experience with 166 cases. Int. J. Oral Maxillofac. Surg. 2010, 39, 21–28. [Google Scholar] [CrossRef]
- Abdel-Galil, K.; Mitchell, D. Postoperative monitoring of microsurgical free-tissue transfers for head and neck reconstruction: A systematic review of current techniques--part II. Invasive techniques. Br. J. Oral Maxillofac. Surg. 2009, 47, 438–442. [Google Scholar] [CrossRef] [PubMed]
- Dakpe, S.; Colin, E.; Bettoni, J.; Davrou, J.; Diouf, M.; Devauchelle, B.; Testelin, S. Intraosseous microdialysis for bone free flap monitoring in head and neck reconstructive surgery: A prospective pilot study. Microsurgery 2020, 40, 315–323. [Google Scholar] [CrossRef] [Green Version]
- Hitier, M.; Cracowski, J.L.; Hamou, C.; Righini, C.; Bettega, G. Indocyanine green fluorescence angiography for free flap monitoring: A pilot study. J. Craniomaxillofac. Surg. 2016, 44, 1833–1841. [Google Scholar] [CrossRef] [PubMed]
- Chao, A.H.; Lamp, S. Current approaches to free flap monitoring. Plast. Surg. Nurs. 2014, 34, 52–56. [Google Scholar] [CrossRef] [PubMed]
- Kwasnicki, R.M.; Noakes, A.J.; Banhidy, N.; Hettiaratchy, S. Quantifying the Limitations of Clinical and Technology-based Flap Monitoring Strategies using a Systematic Thematic Analysis. Plast. Reconstr. Surg. Glob. Open 2021, 9, e3663. [Google Scholar] [CrossRef]
- Patel, U.A.; Hernandez, D.; Shnayder, Y.; Wax, M.K.; Hanasono, M.M.; Hornig, J.; Ghanem, T.A.; Old, M.; Jackson, R.S.; Ledgerwood, L.G.; et al. Free Flap Reconstruction Monitoring Techniques and Frequency in the Era of Restricted Resident Work Hours. JAMA Otolaryngol. Head Neck Surg. 2017, 143, 803–809. [Google Scholar] [CrossRef] [Green Version]
- Leibig, N.; Ha-Phuoc, A.; Stark, G.B.; Schmelzeisen, R.; Metzger, M.C.; Eisenhardt, S.U.; Voss, P.J. Retrospective evaluation of diagnostic accuracy of free flap monitoring with the Cook-Swartz-Doppler probe in head and neck reconstruction. J. Craniomaxillofac. Surg. 2019, 47, 1973–1979. [Google Scholar] [CrossRef] [PubMed]
- Yoshino, K.; Nara, S.; Endo, M.; Kamata, N. Intraoral free flap monitoring with a laser Doppler flowmeter. Microsurgery 1996, 17, 337–340. [Google Scholar] [CrossRef]
- Mucke, T.; Hapfelmeier, A.; Schmidt, L.H.; Fichter, A.M.; Kanatas, A.; Wolff, K.D.; Ritschl, L.M. A comparative analysis using flowmeter, laser-Doppler|spectrophotometry, and indocyanine green-videoangiography for detection of vascular stenosis in free flaps. Sci. Rep. 2020, 10, 939. [Google Scholar] [CrossRef]
- Holzle, F.; Loeffelbein, D.J.; Nolte, D.; Wolff, K.D. Free flap monitoring using simultaneous non-invasive laser Doppler flowmetry and tissue spectrophotometry. J. Craniomaxillofac. Surg. 2006, 34, 25–33. [Google Scholar] [CrossRef]
- Kulcke, A.; Holmer, A.; Wahl, P.; Siemers, F.; Wild, T.; Daeschlein, G. A compact hyperspectral camera for measurement of perfusion parameters in medicine. Biomed. Tech. Eng. 2018, 63, 519–527. [Google Scholar] [CrossRef]
- Kohler, L.H.; Kohler, H.; Kohler, S.; Langer, S.; Nuwayhid, R.; Gockel, I.; Spindler, N.; Osterhoff, G. Hyperspectral Imaging (HSI) as a new diagnostic tool in free flap monitoring for soft tissue reconstruction: A proof of concept study. BMC Surg 2021, 21, 222. [Google Scholar] [CrossRef] [PubMed]
- Keller, A. A new diagnostic algorithm for early prediction of vascular compromise in 208 microsurgical flaps using tissue oxygen saturation measurements. Ann. Plast. Surg. 2009, 62, 538–543. [Google Scholar] [CrossRef]
- Barberio, M.; Longo, F.; Fiorillo, C.; Seeliger, B.; Mascagni, P.; Agnus, V.; Lindner, V.; Geny, B.; Charles, A.L.; Gockel, I.; et al. HYPerspectral Enhanced Reality (HYPER): A physiology-based surgical guidance tool. Surg. Endosc. 2020, 34, 1736–1744. [Google Scholar] [CrossRef] [PubMed]
- Barberio, M.; Felli, E.; Pizzicannella, M.; Agnus, V.; Al-Taher, M.; Seyller, E.; Moulla, Y.; Jansen-Winkeln, B.; Gockel, I.; Marescaux, J.; et al. Quantitative serosal and mucosal optical imaging perfusion assessment in gastric conduits for esophageal surgery: An experimental study in enhanced reality. Surg. Endosc. 2021, 35, 5827–5835. [Google Scholar] [CrossRef]
- Chin, M.S.; Chappell, A.G.; Giatsidis, G.; Perry, D.J.; Lujan-Hernandez, J.; Haddad, A.; Matsumine, H.; Orgill, D.P.; Lalikos, J.F. Hyperspectral Imaging Provides Early Prediction of Random Axial Flap Necrosis in a Preclinical Model. Plast. Reconstr. Surg. 2017, 139, 1285e–1290e. [Google Scholar] [CrossRef] [PubMed]
- Halicek, M.; Dormer, J.D.; Little, J.V.; Chen, A.Y.; Myers, L.; Sumer, B.D.; Fei, B. Hyperspectral Imaging of Head and Neck Squamous Cell Carcinoma for Cancer Margin Detection in Surgical Specimens from 102 Patients Using Deep Learning. Cancers 2019, 11, 1367. [Google Scholar] [CrossRef] [PubMed] [Green Version]
- Thiem, D.G.E.; Romer, P.; Gielisch, M.; Al-Nawas, B.; Schluter, M.; Plass, B.; Kammerer, P.W. Hyperspectral imaging and artificial intelligence to detect oral malignancy-part 1-automated tissue classification of oral muscle, fat and mucosa using a light-weight 6-layer deep neural network. Head Face Med. 2021, 17, 38. [Google Scholar] [CrossRef] [PubMed]


| Flap Color | Flap Temperature | Re-Capillarization Time | Flap Turgor | Total |
|---|---|---|---|---|
| Pale white (3) | Cold (2) | Approx. 1 s (2) | Soft (2) | |
| Pink (1) | Body temperature (1) | >2 s (1) | Elastic (1) | |
| Red (2) | Superheated (2) | <1 s (3) | Plump (2) | |
| Blue (3) | No capillary refill (3) |
| Group-1(R+) No Revision | Group-2(R+) Revision | Total (N) | p-Value | |
|---|---|---|---|---|
| N | 46 | 19 | 65 | |
| Age | 64.2 ± 11.7 | 53.6 ± 18 | 0.48(+) | |
| Gender | 0.10(++) | |||
| male | 26 (63%) | 15 (37%) | 41 | |
| female | 20 (83%) | 4 (17%) | 24 | |
| Indication | ||||
| Malignant | 43 (73%) | 16 (27%) | 59 | |
| Benign | 1 (50%) | 1 (50%) | 2 | |
| Chronic wound | 2 (50%) | 2 (50%) | 4 | |
| Flap types | 0.27(+) | |||
| RFF | 16 (66.6%) | 8 (33.3%) | 24 | |
| UFF | 13 (81%) | 3 (19%) | 16 | |
| OMFF | 13 (81.3%) | 3 (18.7%) | 16 | |
| LDF | 1 (25%) | 3 (75%) | 4 | |
| OMSF | 2 (66.6%) | 1 (33.3%) | 3 | |
| UAF | 1 (50%) | 1 (50%) | 2 | |
| Reconstruction regime | 0.72(++) | |||
| Primary reconstruction | 39 (72%) | 15 (28%) | 54 | |
| Secondary reconstruction | 7 (63.6%) | 4 (36.4%) | 11 | |
| After radiotherapy | 6 (66.7%) | 3 (33.3%) | 9 | 0.71(++) |
| Recipient vessel (artery) | 0.99(+) | |||
| Superior thyroid | 30 (70%) | 13 (30%) | 43 | |
| Lingual | 8 (72.7%) | 3 (27.3%) | 11 | |
| External carotid | 5 (71%) | 2 (29%) | 7 | |
| Facial | 3 (75%) | 1 (25%) | 4 | |
| Duration of surgery (minutes) | 543.7 ± 126.5 | 527.3 ± 128.1 | 0.06(Eta) | |
| Cause for malperfusion | ||||
| Venous thrombosis | 8 (42.1%) | 8 | ||
| Arterial thrombosis | 8 (36.8%) | 8 | ||
| Haematoma | 3 (4.6%) | 3 | ||
| Kinking | 1 (5.3%) | 1 |
Publisher’s Note: MDPI stays neutral with regard to jurisdictional claims in published maps and institutional affiliations. |
© 2021 by the authors. Licensee MDPI, Basel, Switzerland. This article is an open access article distributed under the terms and conditions of the Creative Commons Attribution (CC BY) license (https://creativecommons.org/licenses/by/4.0/).
Share and Cite
Thiem, D.G.E.; Römer, P.; Blatt, S.; Al-Nawas, B.; Kämmerer, P.W. New Approach to the Old Challenge of Free Flap Monitoring—Hyperspectral Imaging Outperforms Clinical Assessment by Earlier Detection of Perfusion Failure. J. Pers. Med. 2021, 11, 1101. https://doi.org/10.3390/jpm11111101
Thiem DGE, Römer P, Blatt S, Al-Nawas B, Kämmerer PW. New Approach to the Old Challenge of Free Flap Monitoring—Hyperspectral Imaging Outperforms Clinical Assessment by Earlier Detection of Perfusion Failure. Journal of Personalized Medicine. 2021; 11(11):1101. https://doi.org/10.3390/jpm11111101
Chicago/Turabian StyleThiem, Daniel G. E., Paul Römer, Sebastian Blatt, Bilal Al-Nawas, and Peer W. Kämmerer. 2021. "New Approach to the Old Challenge of Free Flap Monitoring—Hyperspectral Imaging Outperforms Clinical Assessment by Earlier Detection of Perfusion Failure" Journal of Personalized Medicine 11, no. 11: 1101. https://doi.org/10.3390/jpm11111101
APA StyleThiem, D. G. E., Römer, P., Blatt, S., Al-Nawas, B., & Kämmerer, P. W. (2021). New Approach to the Old Challenge of Free Flap Monitoring—Hyperspectral Imaging Outperforms Clinical Assessment by Earlier Detection of Perfusion Failure. Journal of Personalized Medicine, 11(11), 1101. https://doi.org/10.3390/jpm11111101