
Multi-Resolution Image Segmentation Based on a Cascaded U-ADenseNet for the Liver and Tumors


Abstract
:1. Introduction
2. Related Theories
2.1. U-Net
2.2. DenseNet
2.3. Atrous Spatial Pyramid Pooling
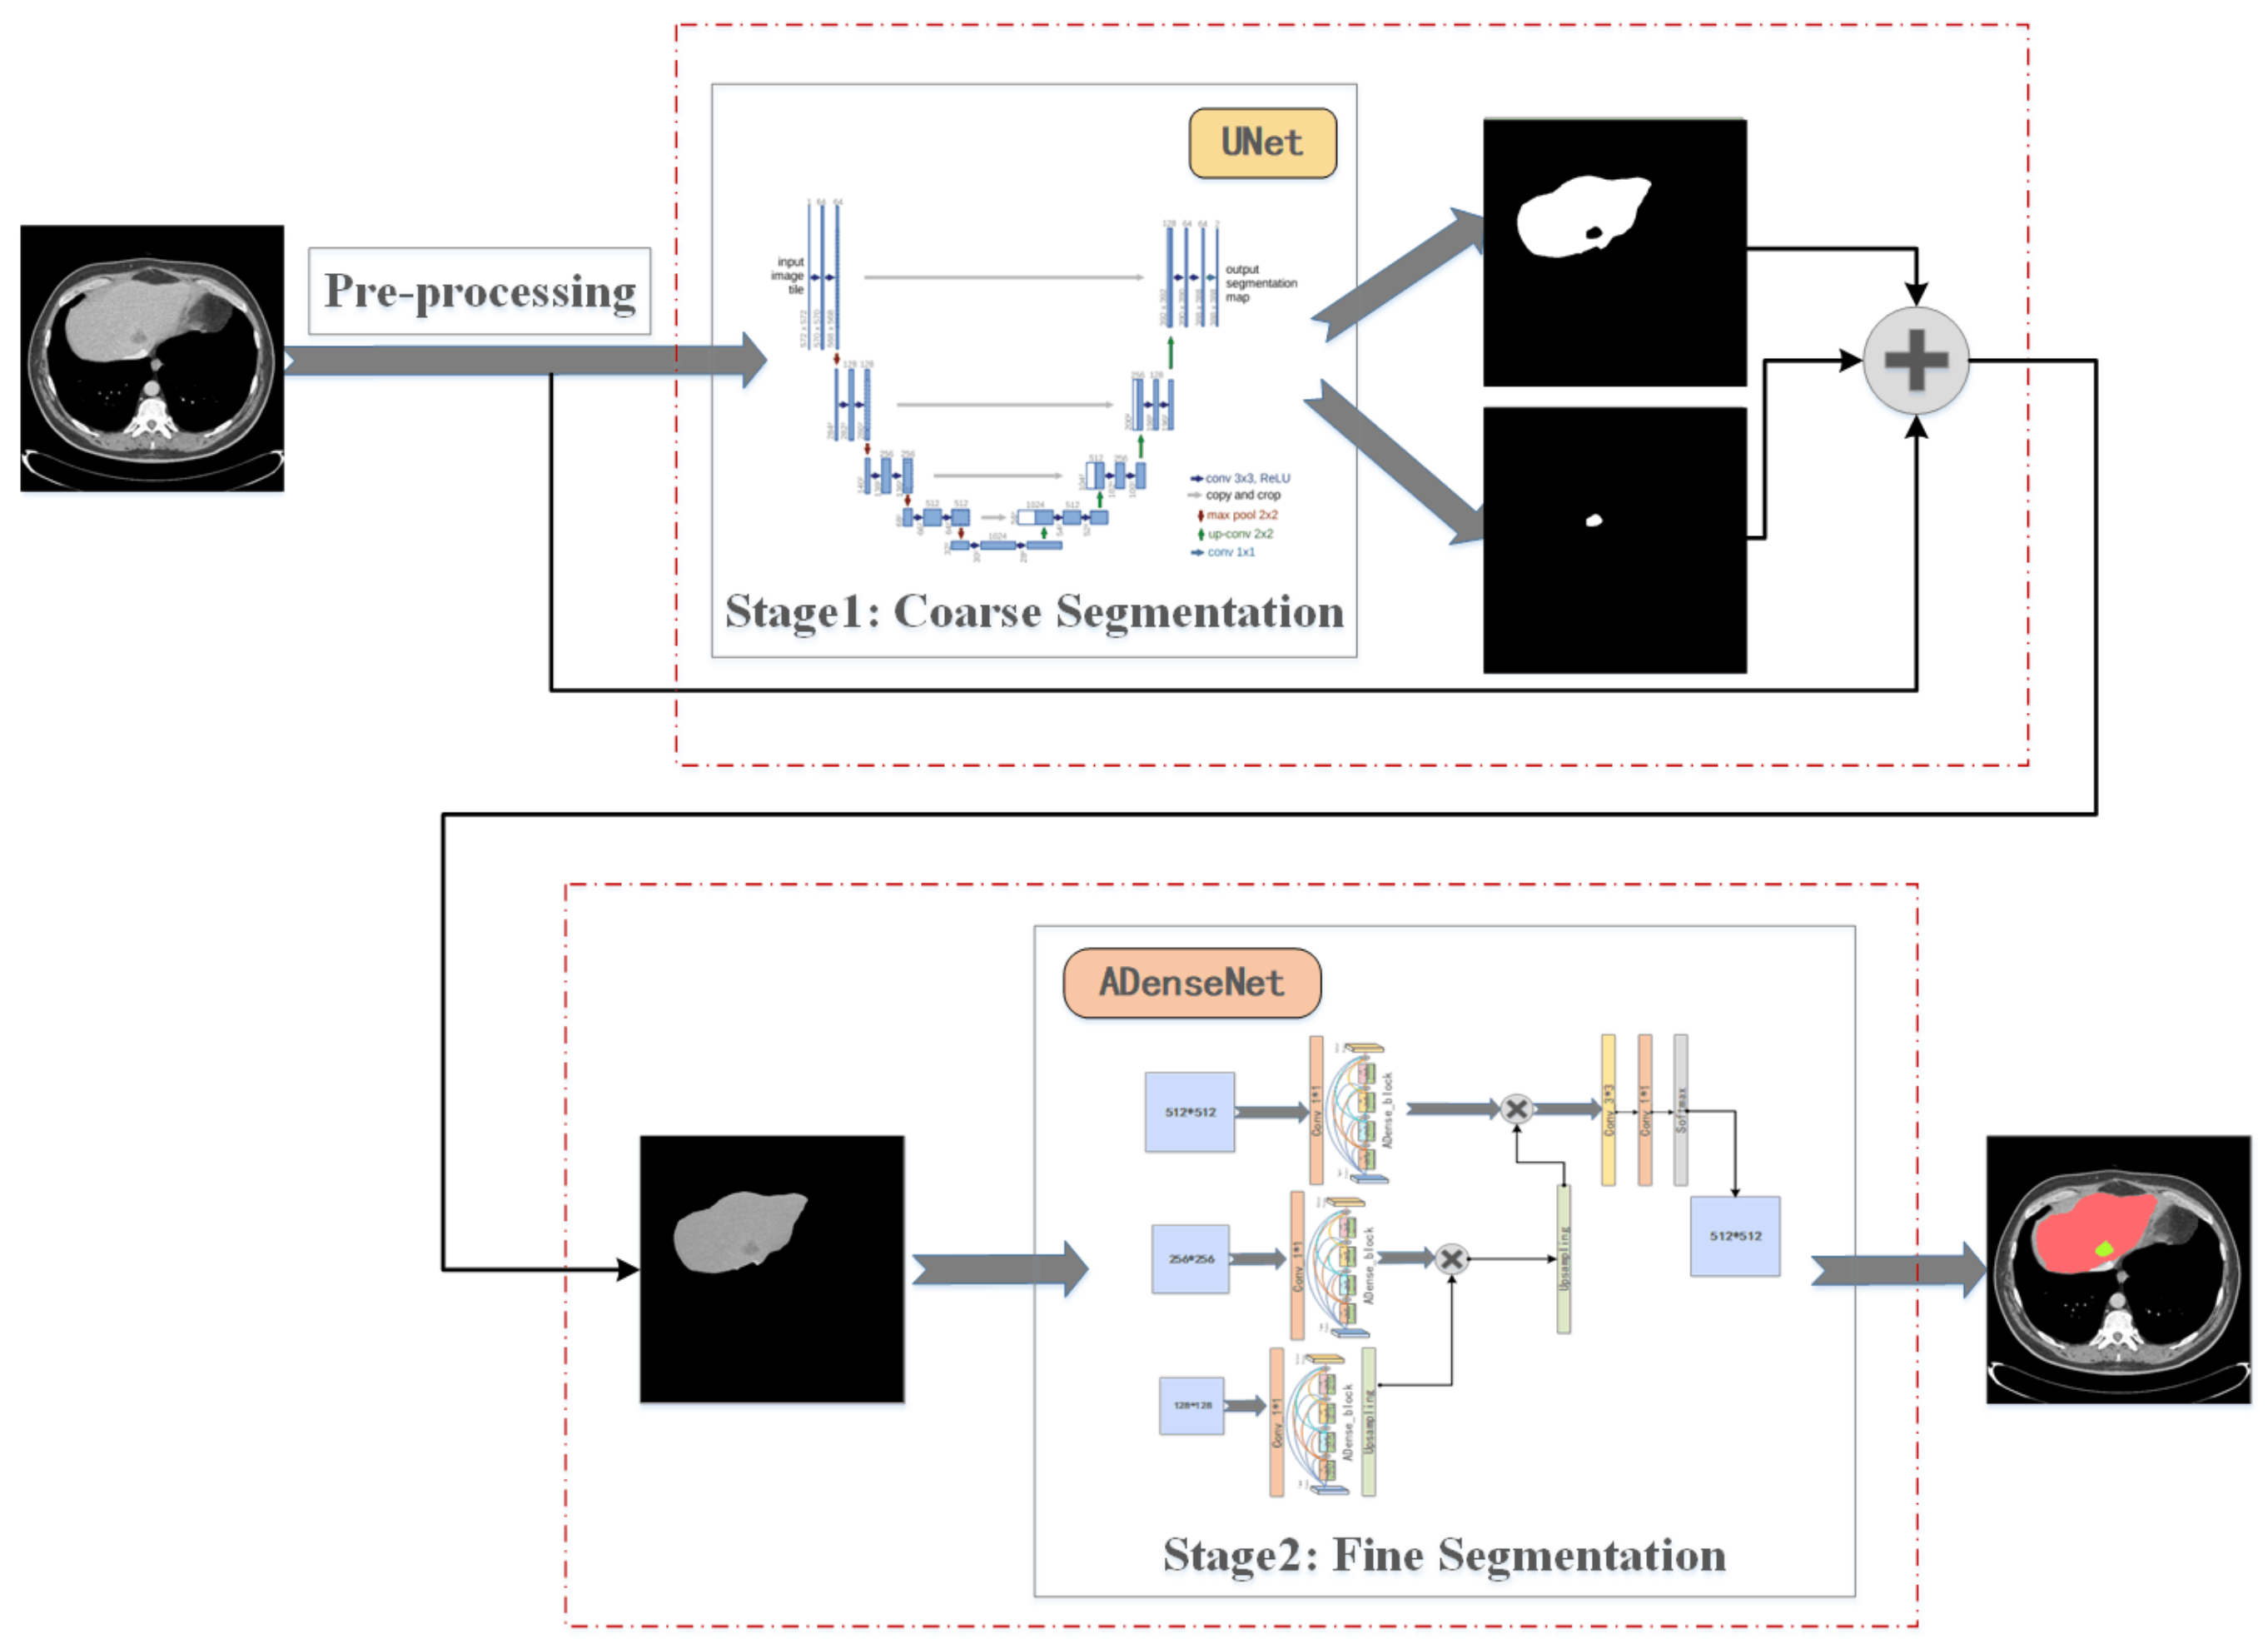
3. Proposed Method
3.1. Cascaded U-ADenseNet Network Architecture
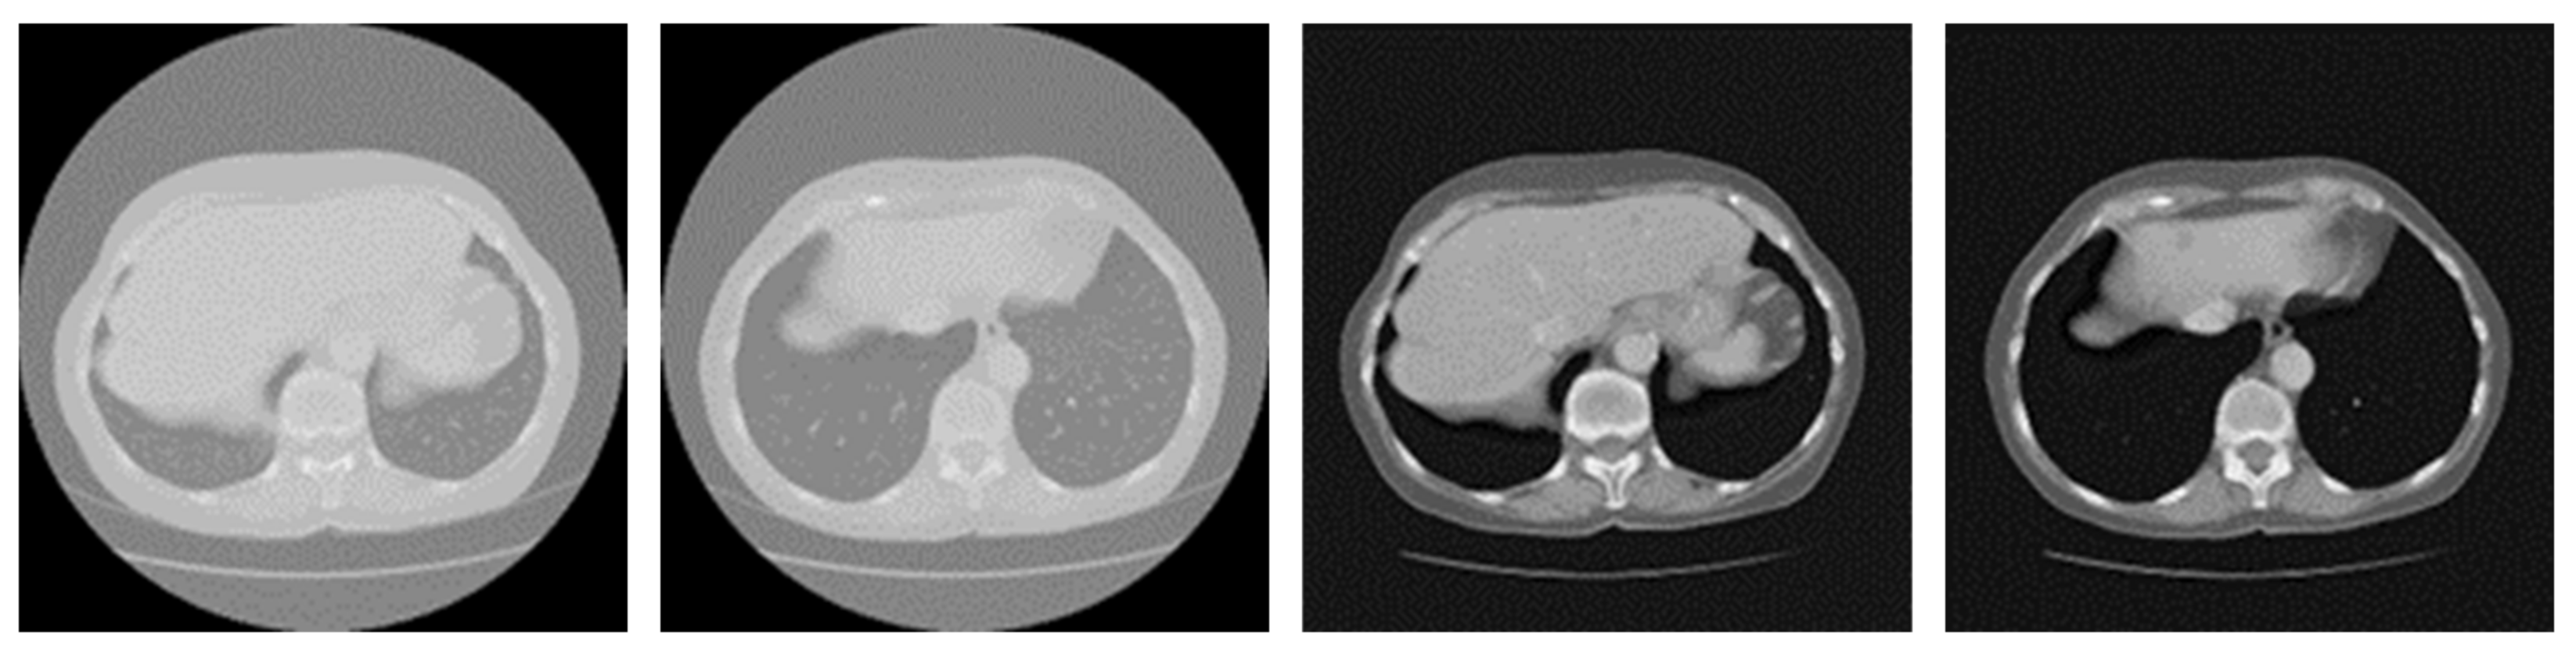
3.2. Preprocessing
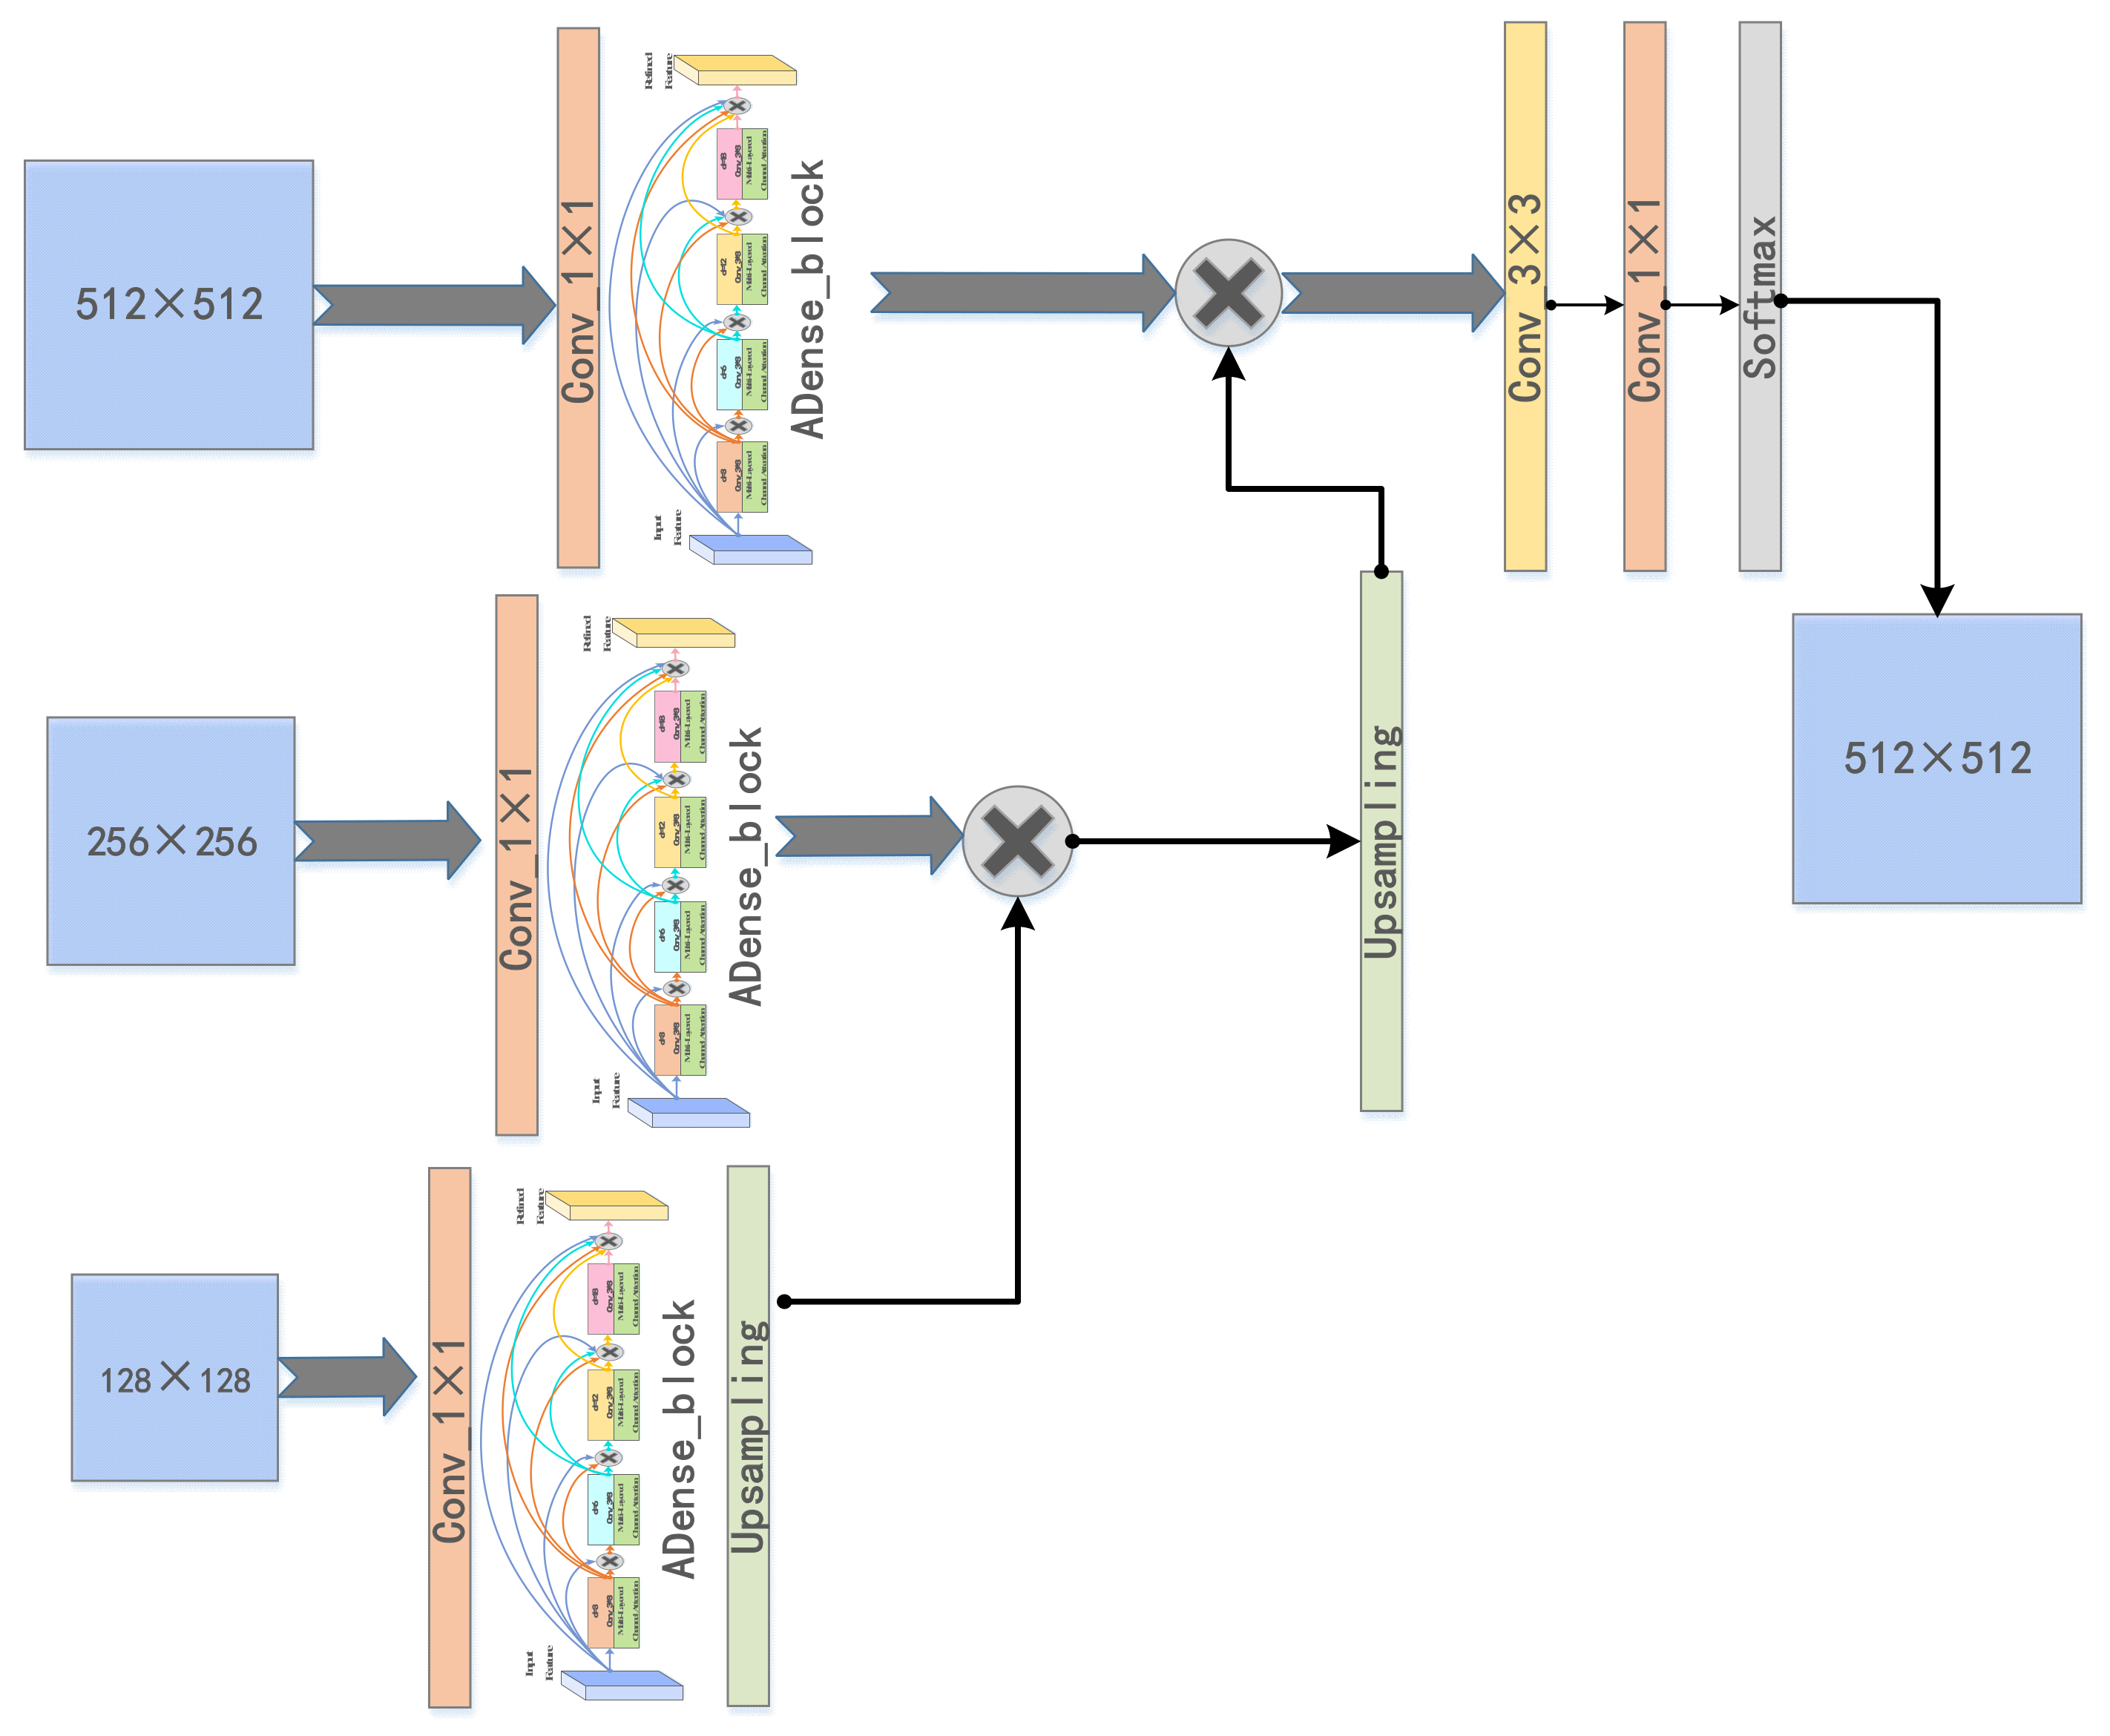
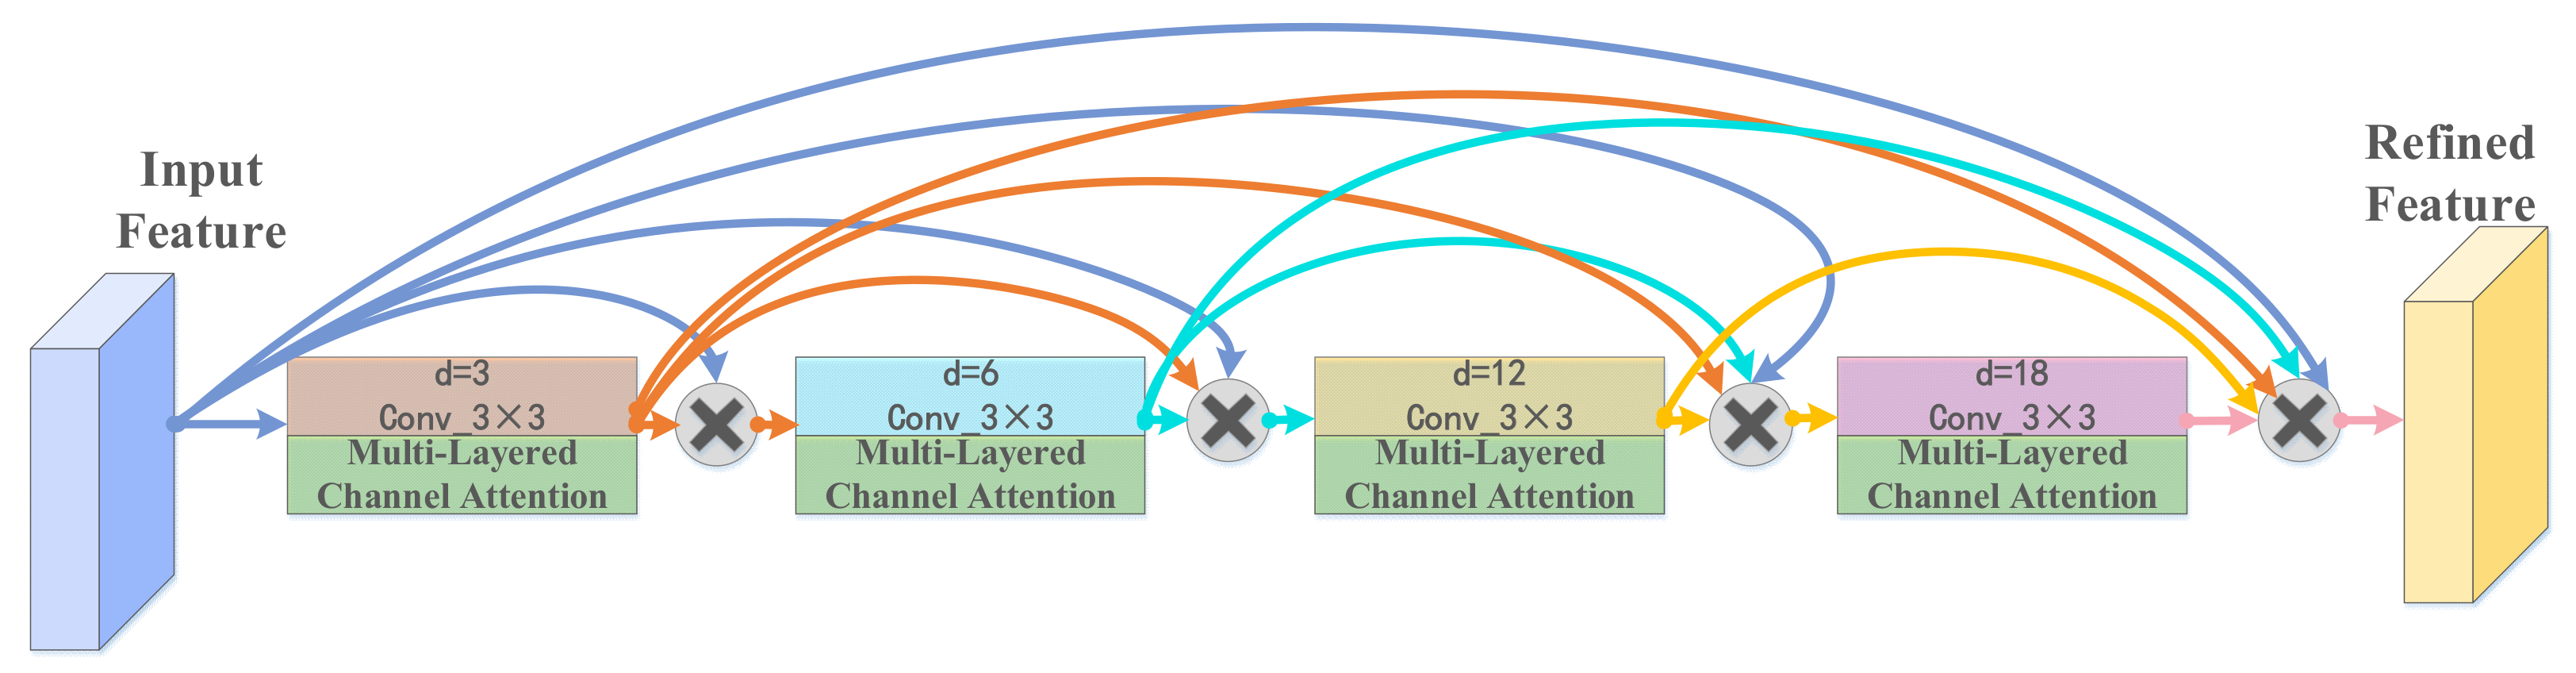
3.3. ADenseNet
3.3.1. ADenseNet Network Architecture
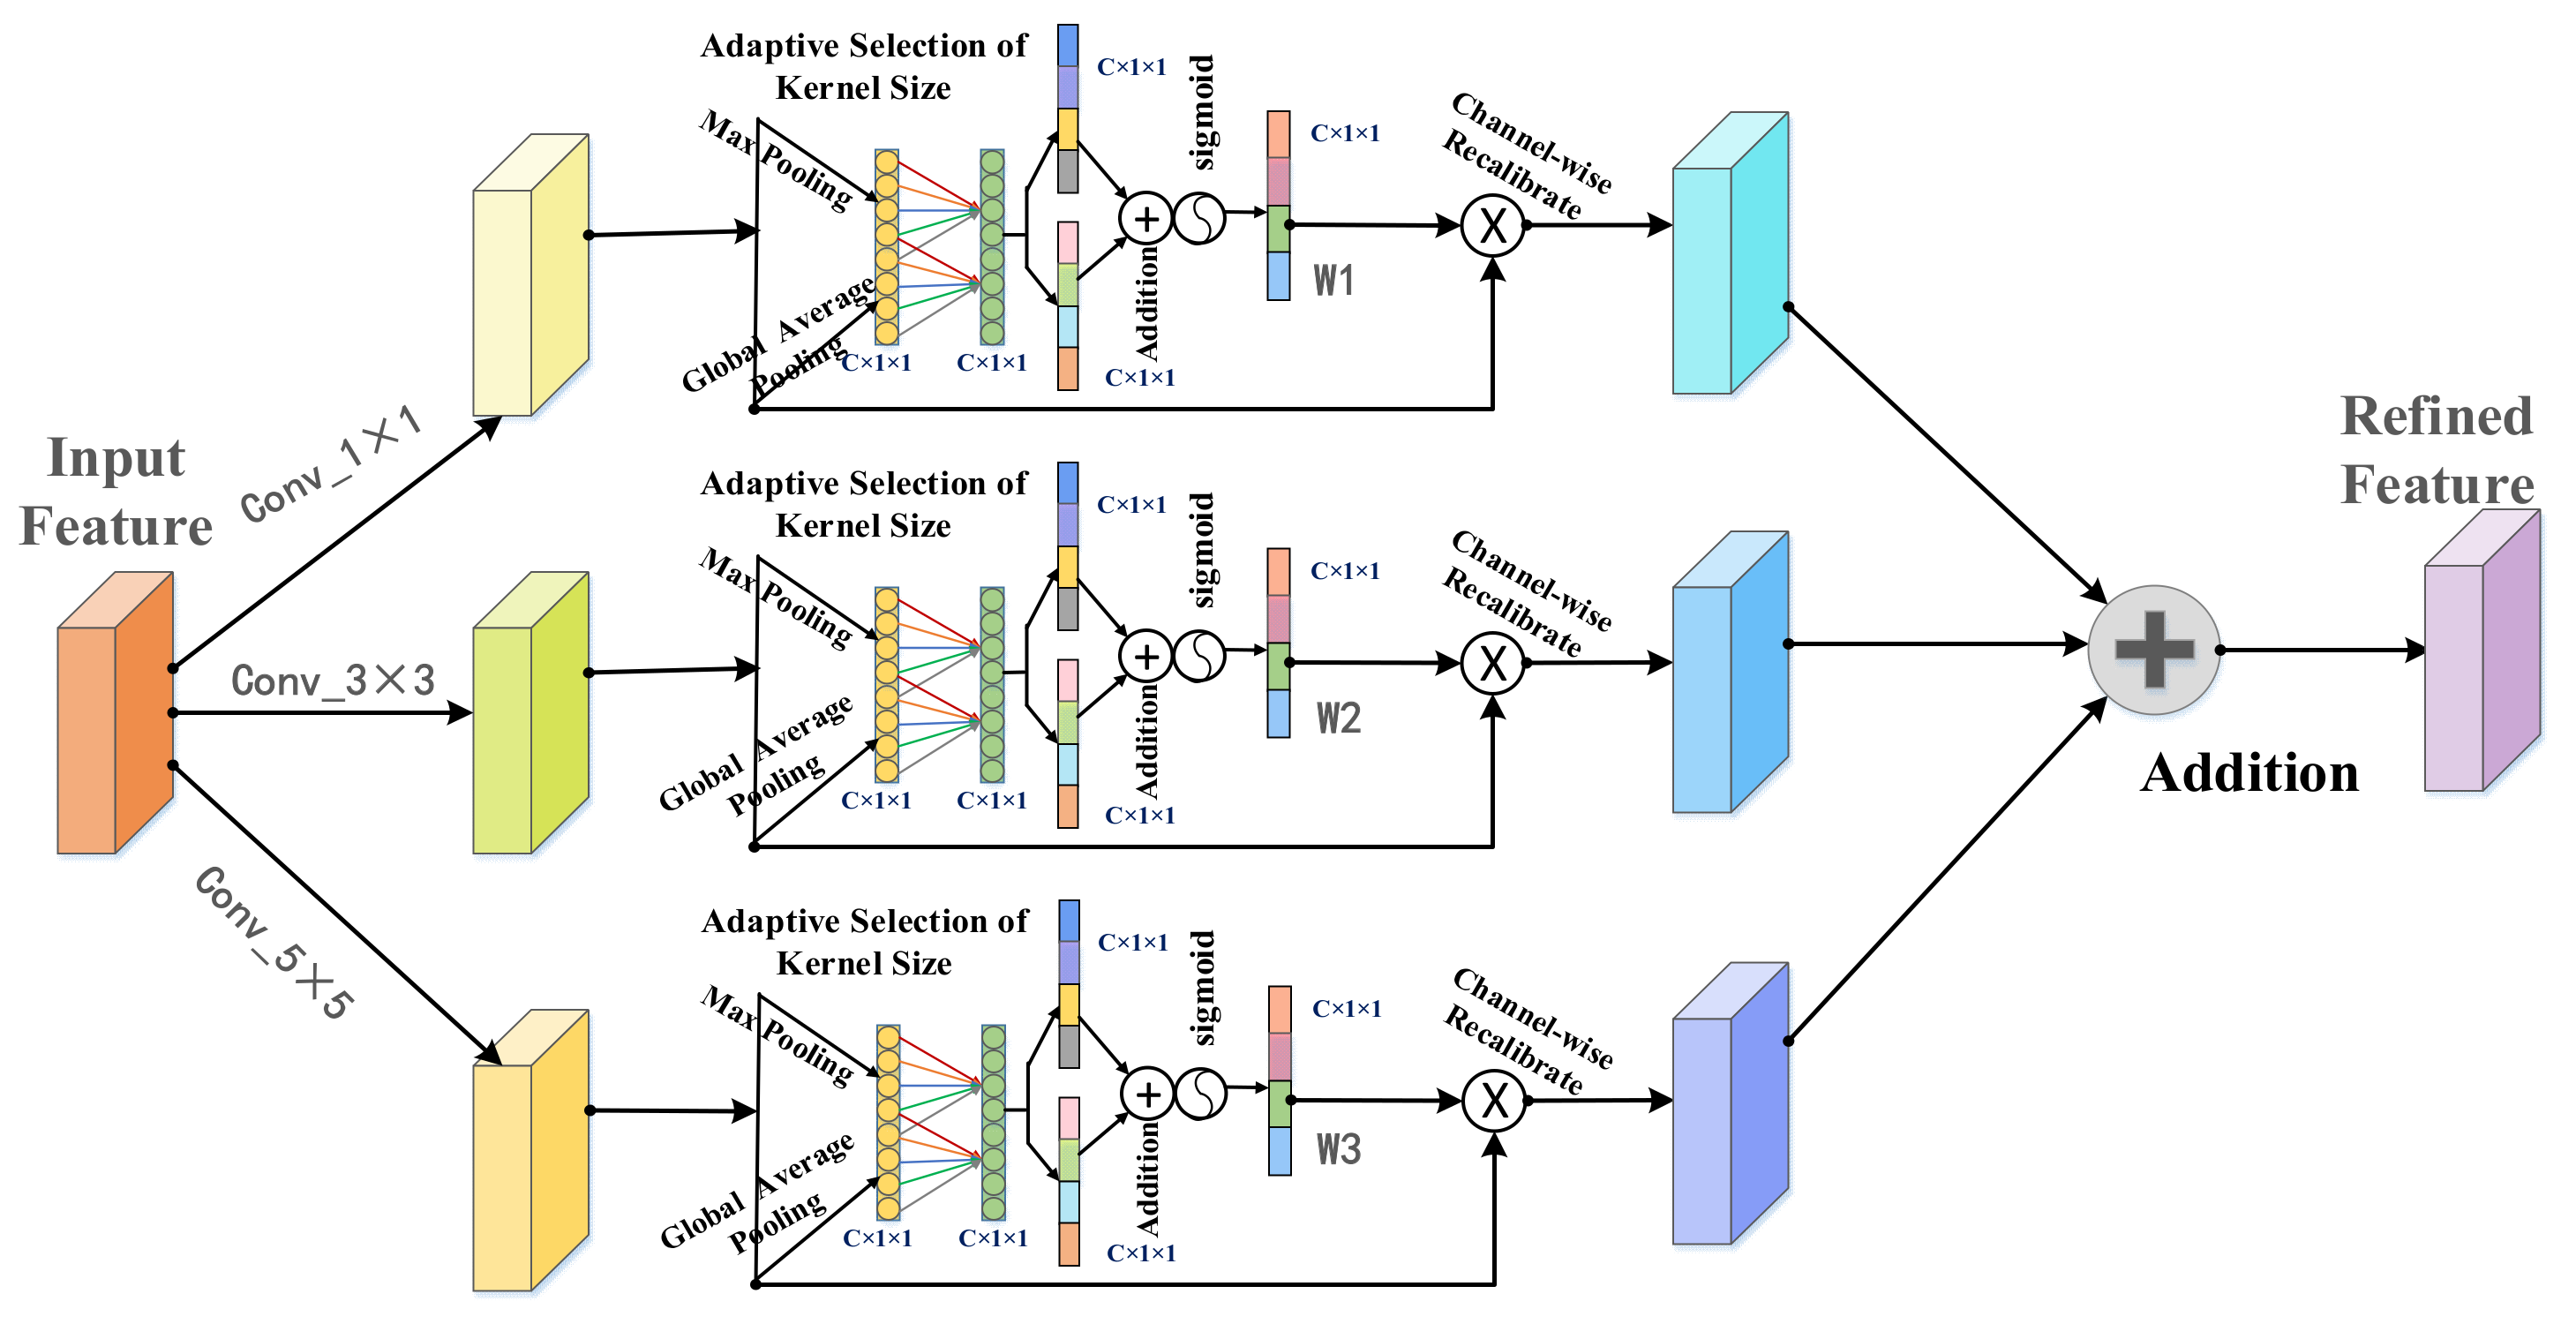
3.3.2. Multi-Layered Channel Attention
3.4. Cross-Entropy Adaptive Weight Loss Function
4. Experimental Results
4.1. Dataset and Implementation Details
4.2. Performance Metrics
4.3. Experimental Results and Analysis
4.3.1. General Comparison on Ablation Experiments
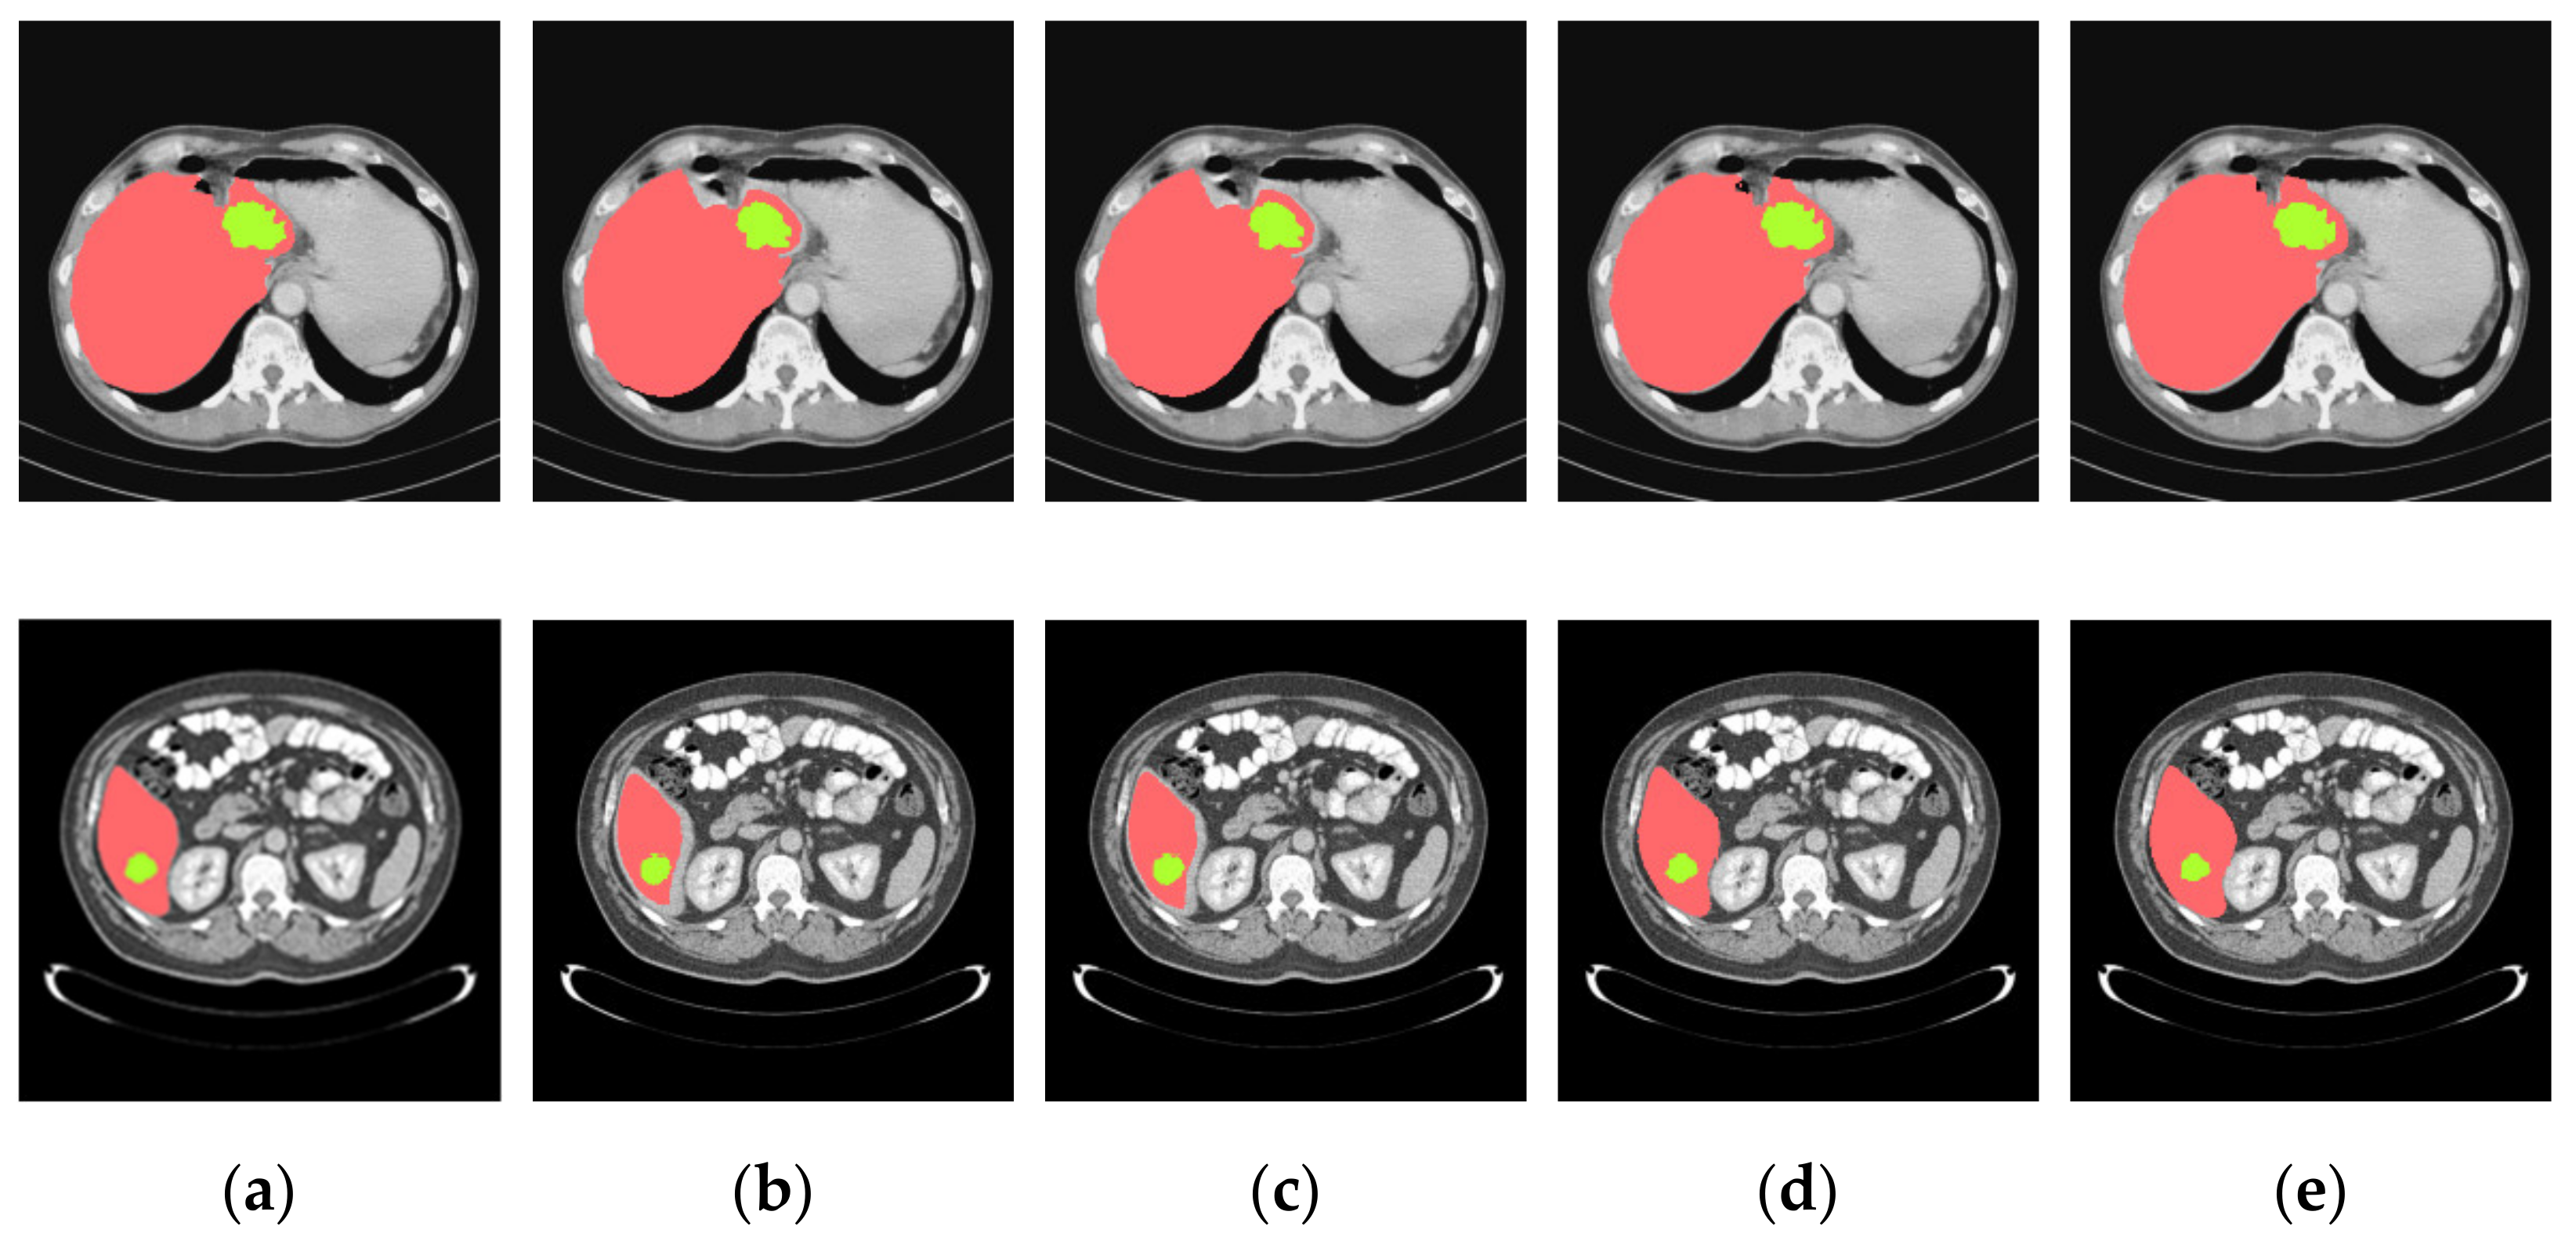
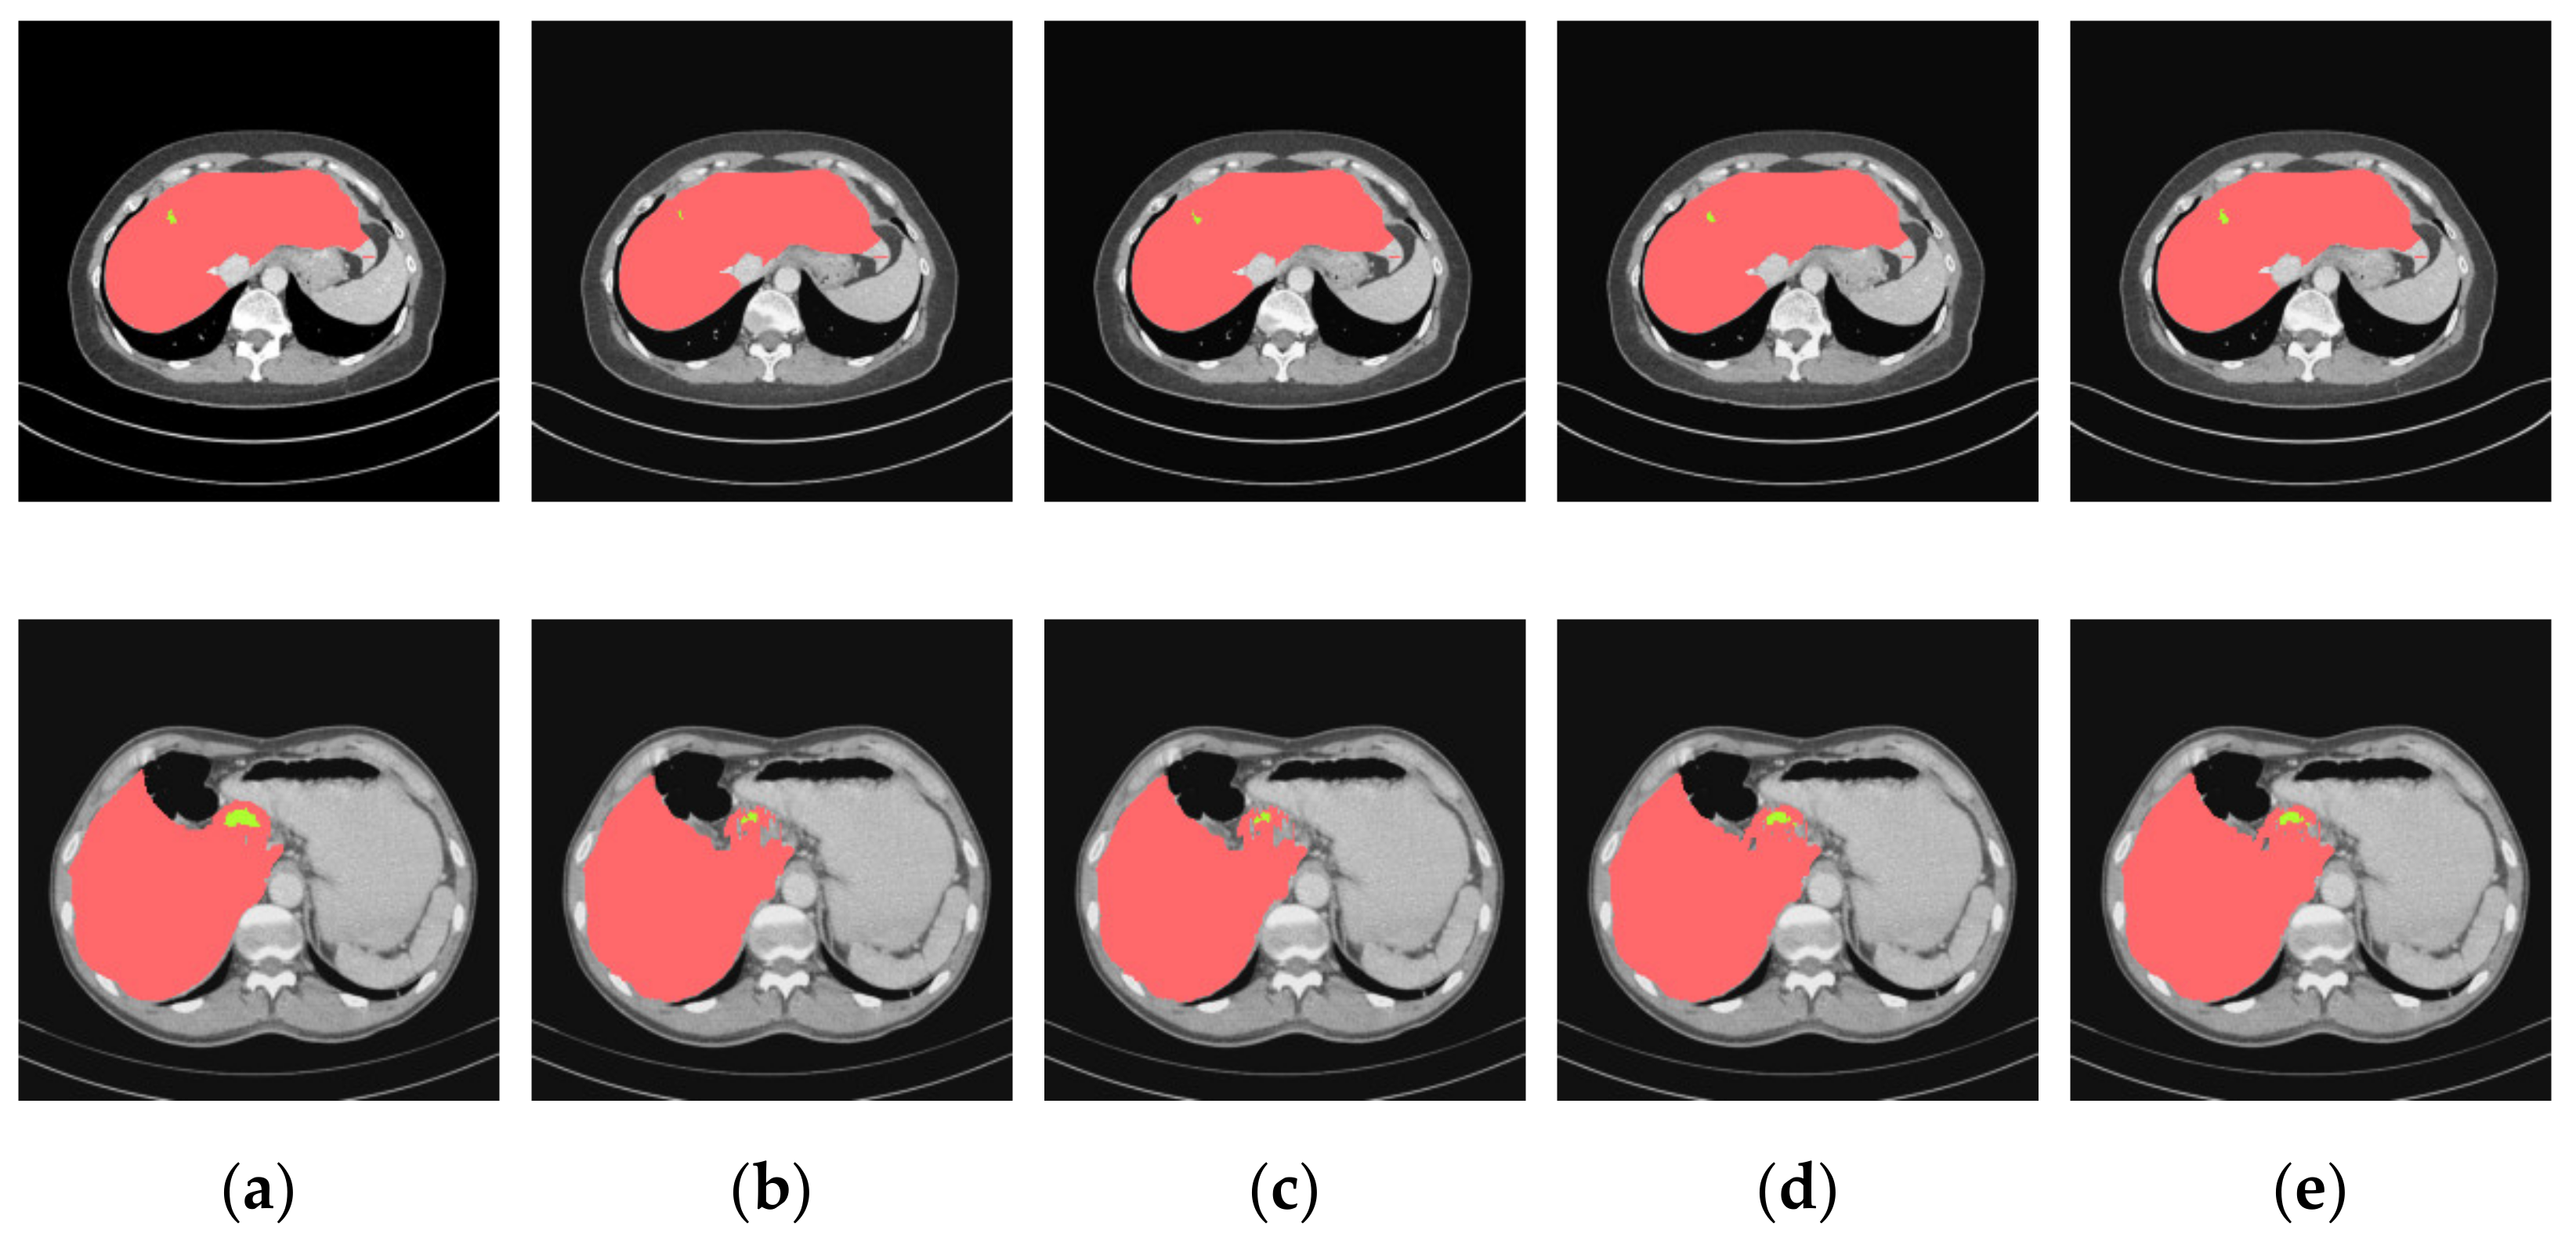
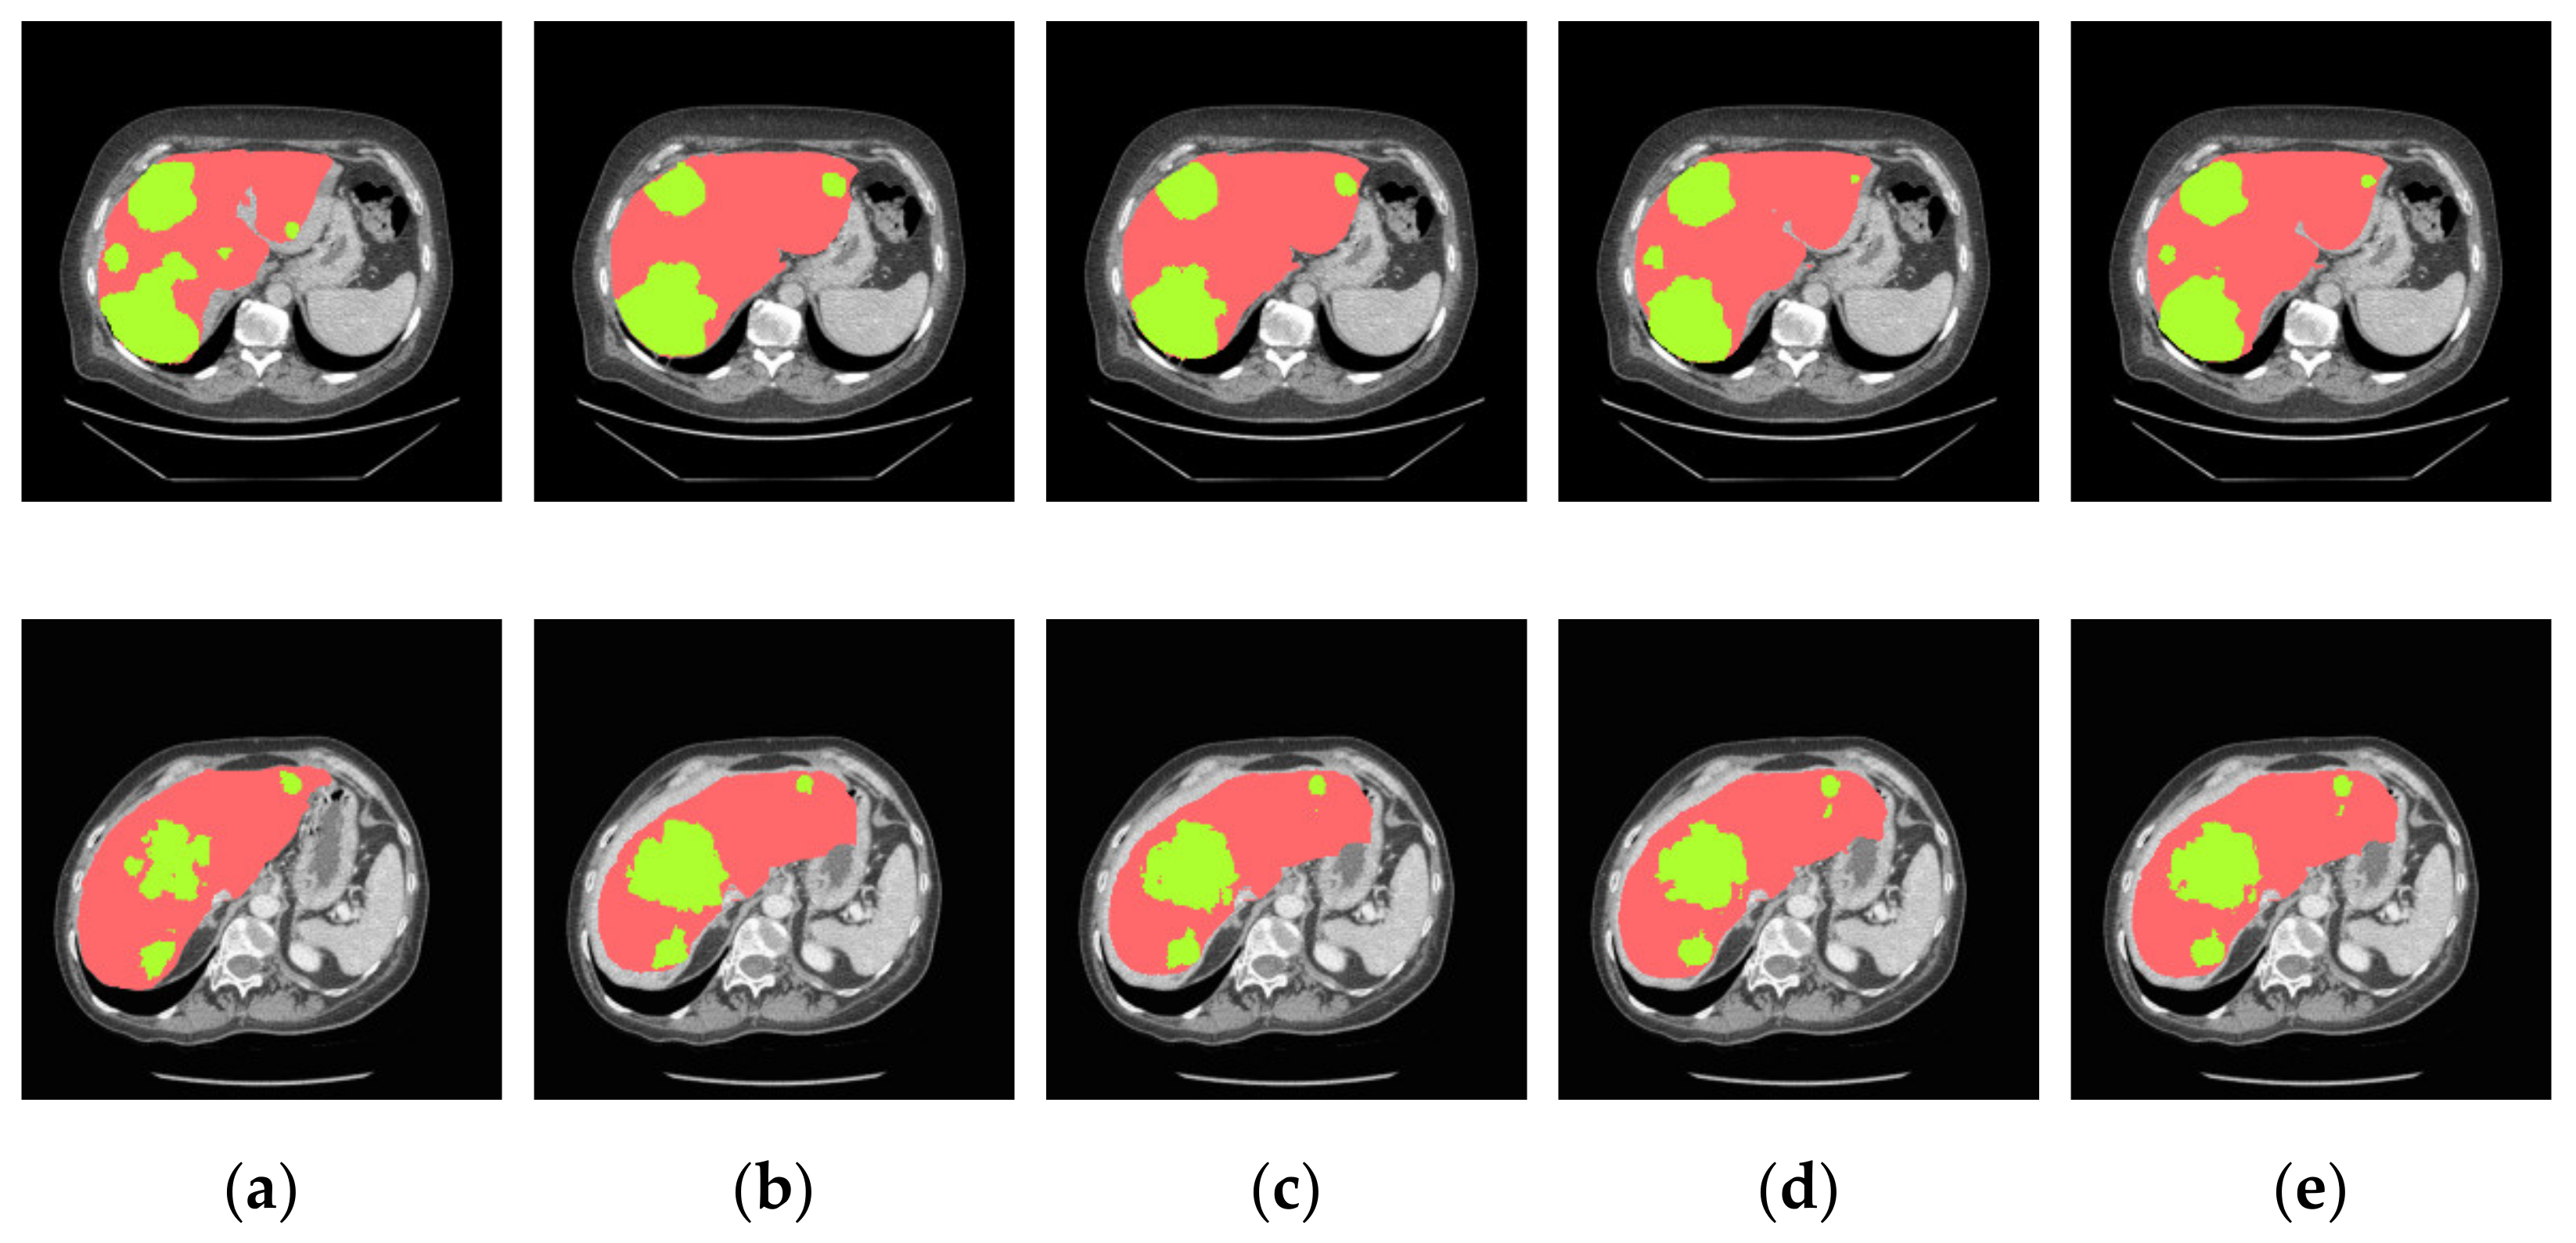
4.3.2. Analysis of Results in Three Patterns
4.3.3. Comparison of Various Algorithms
5. Conclusions
Author Contributions
Funding
Institutional Review Board Statement
Informed Consent Statement
Acknowledgments
Conflicts of Interest
References
- Seehawer, M.; Heinzmann, F.; D’Artista, L.; Harbig, J.; Roux, P.-F.; Hoenicke, L.; Dang, H.; Klotz, S.; Robinson, L.; Doré, G.; et al. Necroptosis microenvironment directs lineage commitment in liver cancer. Nature 2018, 562, 69–75. [Google Scholar] [CrossRef]
- Azer, S.A. Deep learning with convolutional neural networks for identification of liver masses and hepatocellular carcinoma: A systematic review. J. Gastrointest. Oncol. 2019, 11, 1218–1230. [Google Scholar] [CrossRef]
- Lei, T.; Wang, R.; Zhang, Y.; Wan, Y.; Liu, C.; Nandi, A.K. DefED-Net: Deformable Encoder-Decoder Network for Liver and Liver Tumor Segmentation. IEEE Trans. Radiat. Plasma Med. Sci. 2021. [Google Scholar] [CrossRef]
- Lu, X.; Wu, J.; Ren, X.; Zhang, B.; Li, Y. The study and application of the improved region growing algorithm for liver segmentation. Optik 2014, 125, 2142–2147. [Google Scholar] [CrossRef]
- Das, A.; Sabut, S.K. Kernelized Fuzzy C-means Clustering with Adaptive Thresholding for Segmenting Liver Tumors. Procedia Comput. Sci. 2016, 92, 389–395. [Google Scholar] [CrossRef] [Green Version]
- Zareei, A.; Karimi, A. Liver segmentation with new supervised method to create initial curve for active contour. Comput. Biol. Med. 2016, 75, 139–150. [Google Scholar] [CrossRef]
- Li, G.; Chen, X.; Shi, F.; Zhu, W.; Tian, J.; Xiang, D. Automatic Liver Segmentation Based on Shape Constraints and Deformable Graph Cut in CT Images. IEEE Trans. Image Process. 2015, 24, 5315–5329. [Google Scholar] [CrossRef] [PubMed]
- Tomoshige, S.; Oost, E.; Shimizu, A.; Watanabe, H.; Nawano, S. A conditional statistical shape model with integrated error estimation of the conditions; Application to liver segmentation in non-contrast CT images. Med. Image Anal. 2014, 18, 130–143. [Google Scholar] [CrossRef]
- Wang, W.; Iwamoto, Y.; Han, X.; Chen, Y.-W.; Chen, Q.; Liang, D.; Lin, L.; Hu, H.; Zhang, Q. Classification of Focal Liver Lesions Using Deep Learning with Fine-Tuning. In Proceedings of the 2018 International Conference on Digital Medicine and Image Processing, Okinawa, Japan, 12–14 November 2018; pp. 56–60. [Google Scholar]
- Lee, S.; Bae, J.S.; Kim, H.; Kim, J.H.; Yoon, S. Liver Lesion Detection from Weakly-Labeled Multi-phase CT Volumes with a Grouped Single Shot MultiBox Detector. In Proceedings of the Medical Image Computing and Computer Assisted Intervention—MICCAI 2018, Granada, Spain, 16–20 September 2018; pp. 693–701. [Google Scholar]
- Zhou, Z.; Rahman Siddiquee, M.M.; Tajbakhsh, N.; Liang, J. UNet++: A Nested U-Net Architecture for Medical Image Segmentation. In Proceedings of the Deep Learning in Medical Image Analysis and Multimodal Learning for Clinical Decision Support, Cham, Switzerland, 20 September 2018; pp. 3–11. [Google Scholar]
- Huang, Q.; Ding, H.; Wang, X.; Wang, G. Fully automatic liver segmentation in CT images using modified graph cuts and feature detection. Comput. Biol. Med. 2018, 95, 198–208. [Google Scholar] [CrossRef] [PubMed]
- Long, J.; Shelhamer, E.; Darrell, T. Fully convolutional networks for semantic segmentation. In Proceedings of the 2015 IEEE Conference on Computer Vision and Pattern Recognition (CVPR), Boston, MA, USA, 7–12 June 2015; pp. 3431–3440. [Google Scholar]
- Simonyan, K.; Zisserman, A. Very Deep Convolutional Networks for Large-Scale Image Recognition. arXiv 2014, arXiv:1409.1556. [Google Scholar]
- Sun, C.; Guo, S.; Zhang, H.; Li, J.; Chen, M.; Ma, S.; Jin, L.; Liu, X.; Li, X.; Qian, X. Automatic segmentation of liver tumors from multiphase contrast-enhanced CT images based on FCNs. Artif. Intell. Med. 2017, 83, 58–66. [Google Scholar] [CrossRef]
- Chlebus, G.; Schenk, A.; Moltz, J.H.; van Ginneken, B.; Hahn, H.K.; Meine, H. Automatic liver tumor segmentation in CT with fully convolutional neural networks and object-based postprocessing. Sci. Rep. 2018, 8, 15497. [Google Scholar] [CrossRef]
- Ben-Cohen, A.; Diamant, I.; Klang, E.; Amitai, M.; Greenspan, H. Fully Convolutional Network for Liver Segmentation and Lesions Detection. In Proceedings of the Deep Learning and Data Labeling for Medical Applications, Athens, Greece, 21 October 2016; pp. 77–85. [Google Scholar]
- Badrinarayanan, V.; Handa, A.; Cipolla, R. SegNet: A Deep Convolutional Encoder-Decoder Architecture for Robust Semantic Pixel-Wise Labelling. arXiv 2015, arXiv:1505.07293. [Google Scholar]
- Almotairi, S.; Kareem, G.; Aouf, M.; Almutairi, B.; Salem, M.A.M. Liver Tumor Segmentation in CT Scans Using Modified SegNet. Sensors 2020, 20, 1516. [Google Scholar] [CrossRef] [PubMed] [Green Version]
- Ronneberger, O.; Fischer, P.; Brox, T. U-Net: Convolutional Networks for Biomedical Image Segmentation. In Proceedings of the Medical Image Computing and Computer-Assisted Intervention—MICCAI 2015, Munich, Germany, 5–9 October 2015; pp. 234–241. [Google Scholar]
- Seo, H.; Huang, C.; Bassenne, M.; Xiao, R.; Xing, L. Modified U-Net (mU-Net) With Incorporation of Object-Dependent High Level Features for Improved Liver and Liver-Tumor Segmentation in CT Images. IEEE Trans. Med. Imaging 2020, 39, 1316–1325. [Google Scholar] [CrossRef] [PubMed] [Green Version]
- Christ, P.F.; Elshaer, M.E.A.; Ettlinger, F.; Tatavarty, S.; Bickel, M.; Bilic, P.; Rempfler, M.; Armbruster, M.; Hofmann, F.; D’Anastasi, M.; et al. Automatic Liver and Lesion Segmentation in CT Using Cascaded Fully Convolutional Neural Networks and 3D Conditional Random Fields. In Proceedings of the Medical Image Computing and Computer-Assisted Intervention—MICCAI 2016, Athens, Greece, 17–21 October 2016; pp. 415–423. [Google Scholar]
- Bi, L.; Kim, J.; Kumar, A.; Feng, D. Automatic Liver Lesion Detection using Cascaded Deep Residual Networks. arXiv 2017, arXiv:1704.02703. [Google Scholar]
- He, K.; Zhang, X.; Ren, S.; Sun, J. Deep Residual Learning for Image Recognition. In Proceedings of the 2016 IEEE Conference on Computer Vision and Pattern Recognition (CVPR), Las Vegas, NV, USA, 27–30 June 2016; pp. 770–778. [Google Scholar]
- Kaluva, K.C.; Khened, M.; Kori, A.; Krishnamurthi, G. 2D-Densely Connected Convolution Neural Networks for automatic Liver and Tumor Segmentation. arXiv 2018, arXiv:1802.02182. [Google Scholar]
- Huang, G.; Liu, Z.; Maaten, L.V.D.; Weinberger, K.Q. Densely Connected Convolutional Networks. In Proceedings of the 2017 IEEE Conference on Computer Vision and Pattern Recognition (CVPR), Honolulu, HI, USA, 21–26 July 2017; pp. 2261–2269. [Google Scholar]
- Rundo, L.; Han, C.; Nagano, Y.; Zhang, J.; Hataya, R.; Militello, C.; Tangherloni, A.; Nobile, M.S.; Ferretti, C.; Besozzi, D.; et al. USE-Net: Incorporating Squeeze-and-Excitation blocks into U-Net for prostate zonal segmentation of multi-institutional MRI datasets. Neurocomputing 2019, 365, 31–43. [Google Scholar] [CrossRef] [Green Version]
- Jin, Q.; Meng, Z.; Sun, C.; Wei, L.; Su, R. RA-UNet: A hybrid deep attention-aware network to extract liver and tumor in CT scans. Front. Bioeng. Biotechnol. 2020, 8, 1471. [Google Scholar] [CrossRef]
- Meng, L.; Zhang, Q.; Bu, S. Two-Stage Liver and Tumor Segment-ation Algorithm Based on Convolutional Neural Network. Diagnostics 2021, 11, 1806. [Google Scholar] [CrossRef]
- Bilic, P.; Christ, P.F.; Vorontsov, E.; Chlebus, G.; Chen, H.; Dou, Q.; Fu, C.-W.; Han, X.; Heng, P.-A.; Hesser, J.; et al. The Liver Tumor Segmentation Benchmark (LiTS). arXiv 2019, arXiv:1901.04056. [Google Scholar]
- Kayalibay, B.; Jensen, G.; van der Smagt, P. CNN-based Segmentation of Medical Imaging Data. arXiv 2017, arXiv:1701.03056. [Google Scholar]
- Wei, Y.; Xiao, H.; Shi, H.; Jie, Z.; Feng, J.; Huang, T.S. Revisiting Dilated Convolution: A Simple Approach for Weakly- and Semi-Supervised Semantic Segmentation. In Proceedings of the 2018 IEEE/CVF Conference on Computer Vision and Pattern Recognition, Salt Lake City, UT, USA, 18–23 June 2018; pp. 7268–7277. [Google Scholar]
- Chen, L.-C.; Zhu, Y.; Papandreou, G.; Schroff, F.; Adam, H. Encoder-Decoder with Atrous Separable Convolution for Semantic Image Segmentation. In Proceedings of the Computer Vision—ECCV 2018, Munich, Germany, 8–14 September 2018; pp. 833–851. [Google Scholar]


| Models | Liver | Liver Tumors | ||||
|---|---|---|---|---|---|---|
| Dice | VOE | RVD | Dice | VOE | RVD | |
| U-Net | 0.938 | 0.165 | 0.057 | 0.659 | 0.493 | −0.381 |
| U-Net + ADenseNet1 | 0.953 | 0.124 | 0.025 | 0.717 | 0.371 | −0.193 |
| U-Net + ADenseNet2 | 0.961 | 0.103 | 0.029 | 0.731 | 0.387 | −0.175 |
| Cascaded U-ADenseNet | 0.963 | 0.086 | 0.023 | 0.745 | 0.353 | −0.124 |
| Models | Dice (Pattern One) | Dice (Pattern Two) | Dice (Pattern Three) |
|---|---|---|---|
| U-Net | 0.913 | 0.675 | 0.628 |
| U-Net + ADenseNet1 | 0.924 | 0.683 | 0.641 |
| U-Net + ADenseNet2 | 0.931 | 0.711 | 0.663 |
| Cascaded U-ADenseNet | 0.928 | 0.719 | 0.687 |
| Models | Liver | Liver Tumors | ||||
|---|---|---|---|---|---|---|
| Dice | VOE | RVD | Dice | VOE | RVD | |
| Densely-CNN [25] | 0.923 | 0.015 | −0.008 | 0.625 | 0.411 | 19.705 |
| USE-Net [27] | 0.956 | 0.090 | 0.0703 | 0.741 | 0.240 | −0.190 |
| RA-UNet [28] | 0.961 | 0.074 | 0.002 | 0.595 | 0.389 | −0.152 |
| DCUNet [29] | 0.967 | - | - | 0.725 | - | - |
| Cascaded U-ADenseNet | 0.963 | 0.086 | 0.023 | 0.745 | 0.353 | −0.124 |
Publisher’s Note: MDPI stays neutral with regard to jurisdictional claims in published maps and institutional affiliations. |
© 2021 by the authors. Licensee MDPI, Basel, Switzerland. This article is an open access article distributed under the terms and conditions of the Creative Commons Attribution (CC BY) license (https://creativecommons.org/licenses/by/4.0/).
Share and Cite
Zhu, Y.; Yu, A.; Rong, H.; Wang, D.; Song, Y.; Liu, Z.; Sheng, V.S. Multi-Resolution Image Segmentation Based on a Cascaded U-ADenseNet for the Liver and Tumors. J. Pers. Med. 2021, 11, 1044. https://doi.org/10.3390/jpm11101044
Zhu Y, Yu A, Rong H, Wang D, Song Y, Liu Z, Sheng VS. Multi-Resolution Image Segmentation Based on a Cascaded U-ADenseNet for the Liver and Tumors. Journal of Personalized Medicine. 2021; 11(10):1044. https://doi.org/10.3390/jpm11101044
Chicago/Turabian StyleZhu, Yan, Aihong Yu, Huan Rong, Dongqing Wang, Yuqing Song, Zhe Liu, and Victor S. Sheng. 2021. "Multi-Resolution Image Segmentation Based on a Cascaded U-ADenseNet for the Liver and Tumors" Journal of Personalized Medicine 11, no. 10: 1044. https://doi.org/10.3390/jpm11101044
APA StyleZhu, Y., Yu, A., Rong, H., Wang, D., Song, Y., Liu, Z., & Sheng, V. S. (2021). Multi-Resolution Image Segmentation Based on a Cascaded U-ADenseNet for the Liver and Tumors. Journal of Personalized Medicine, 11(10), 1044. https://doi.org/10.3390/jpm11101044