Prognostic Value of CT-Attenuation and 18F-Fluorodeoxyglucose Uptake of Periprostatic Adipose Tissue in Patients with Prostate Cancer

 , , and
Abstract
1. Introduction
2. Materials and Methods
2.1. Study Population
2.2. FDG PET/CT
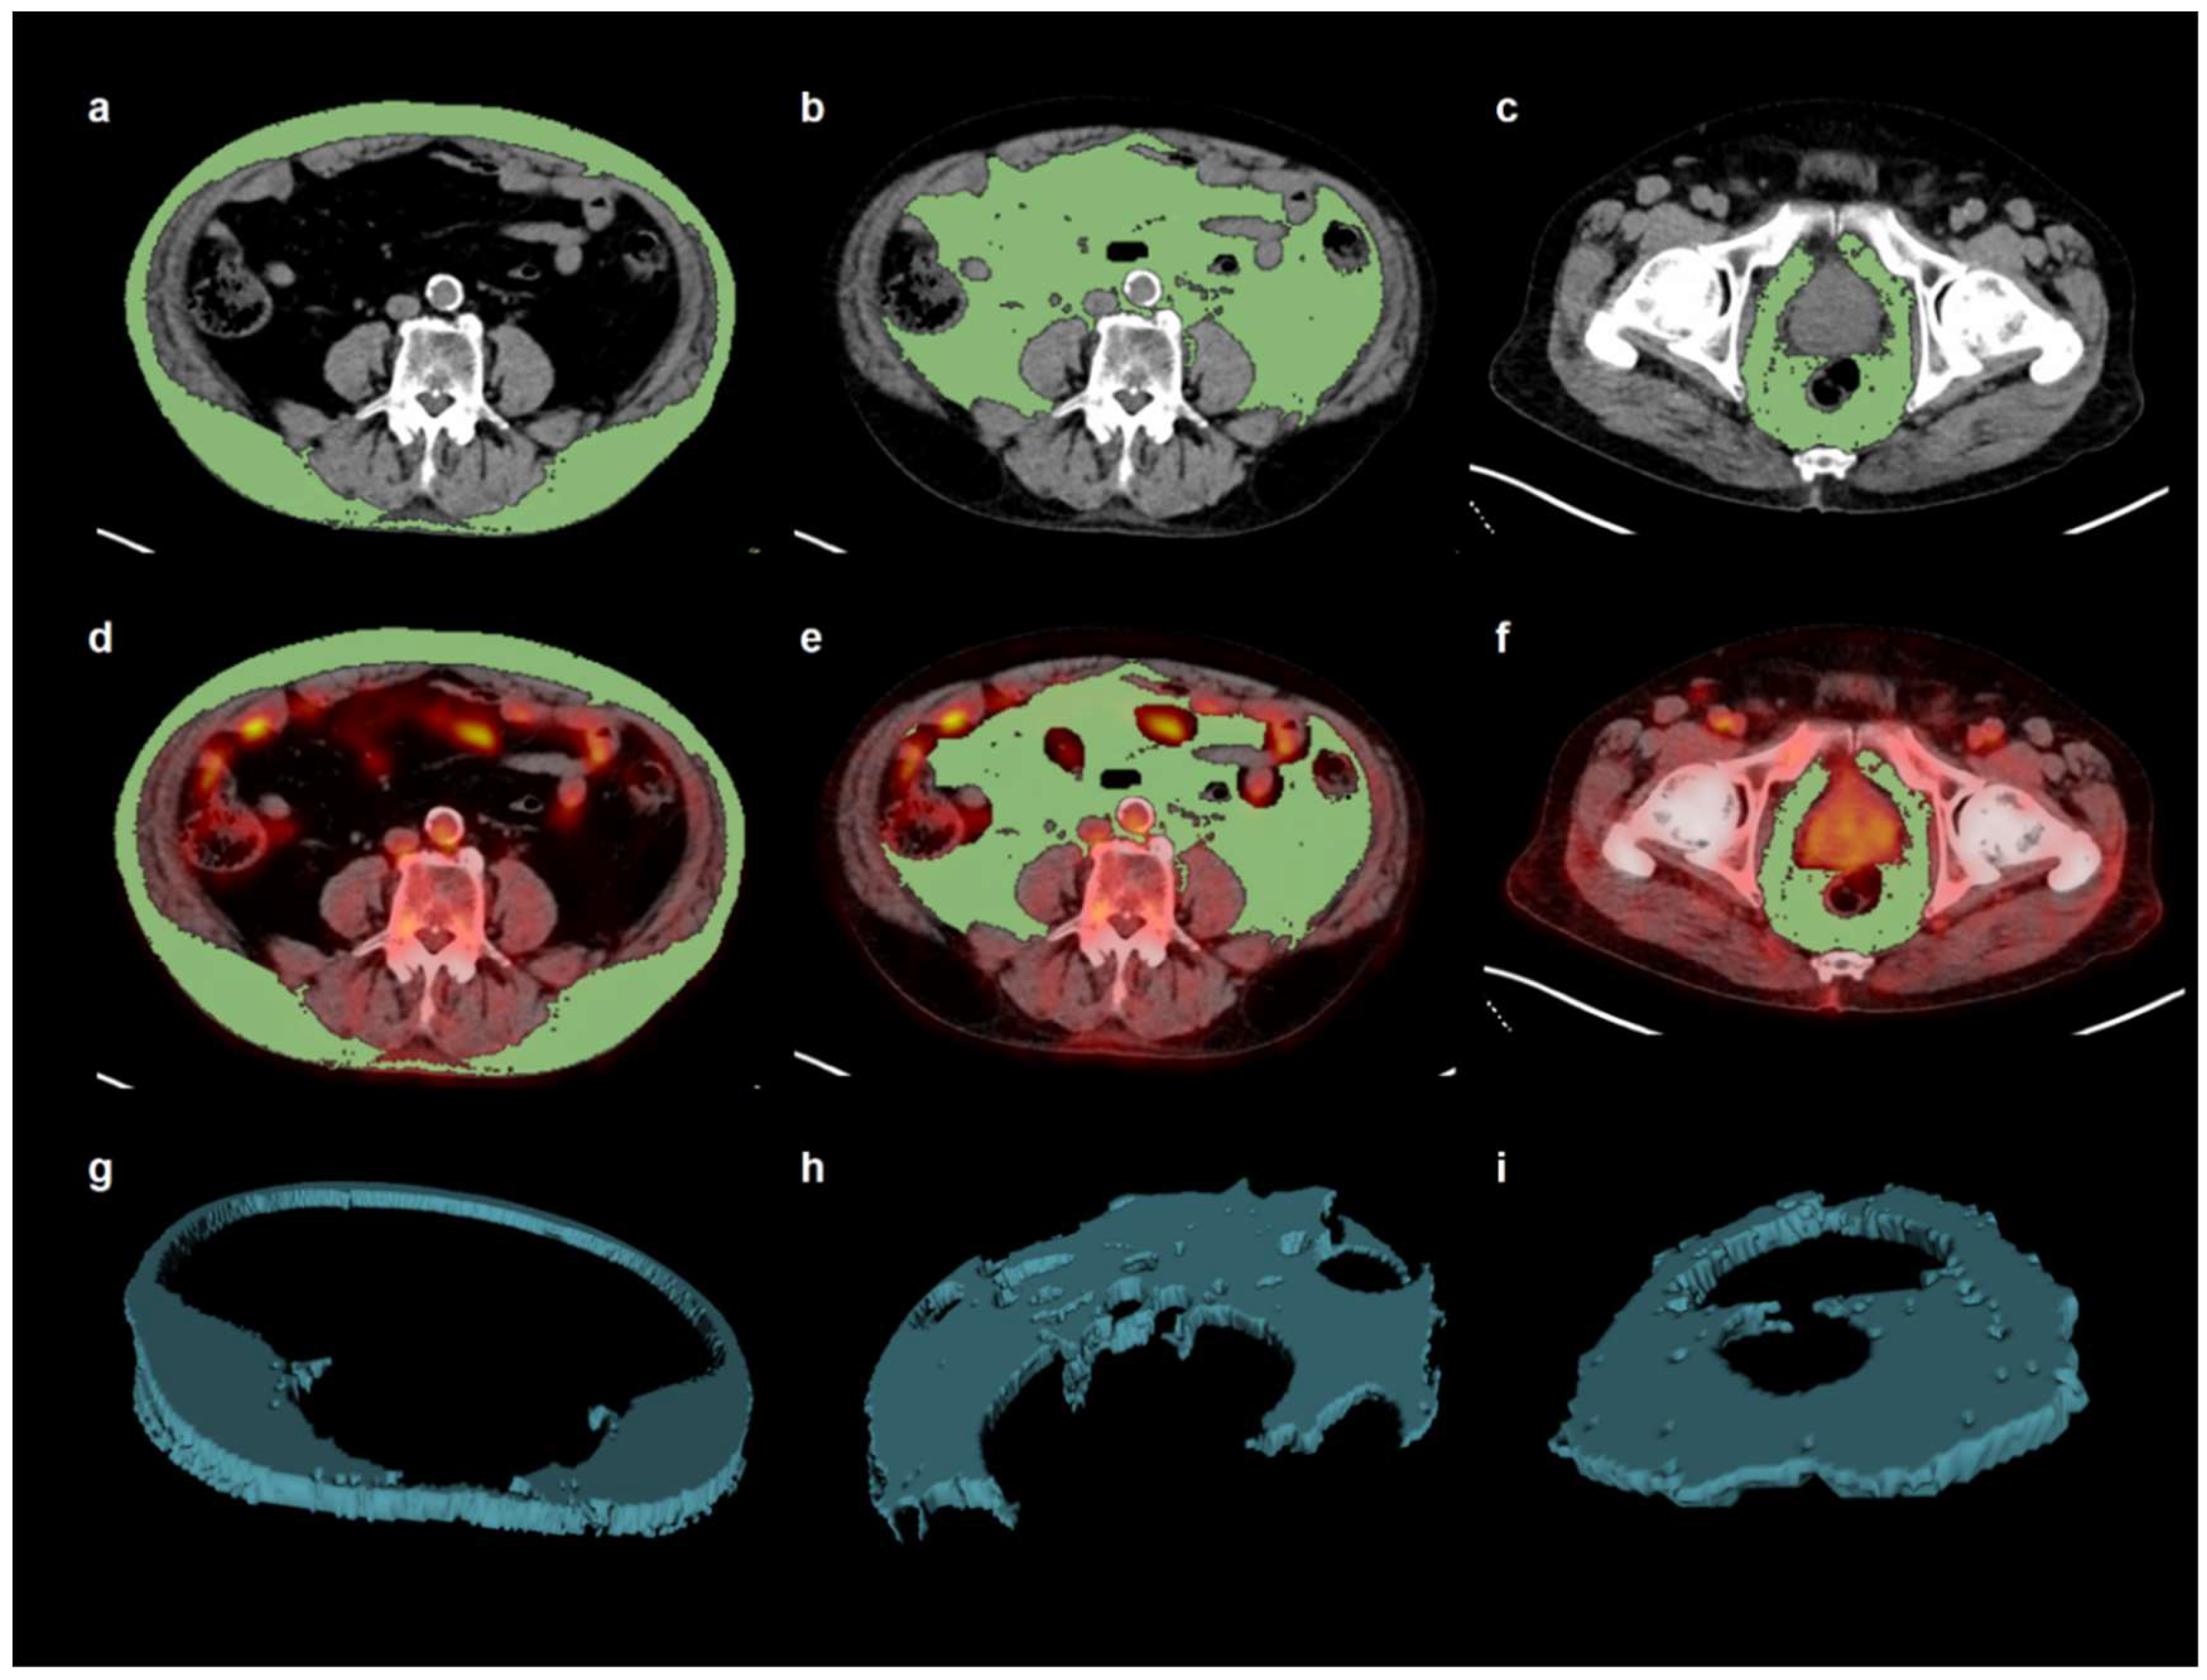
2.3. Image Analysis
2.4. Statistical Analysis
3. Results
3.1. Baseline Characteristics
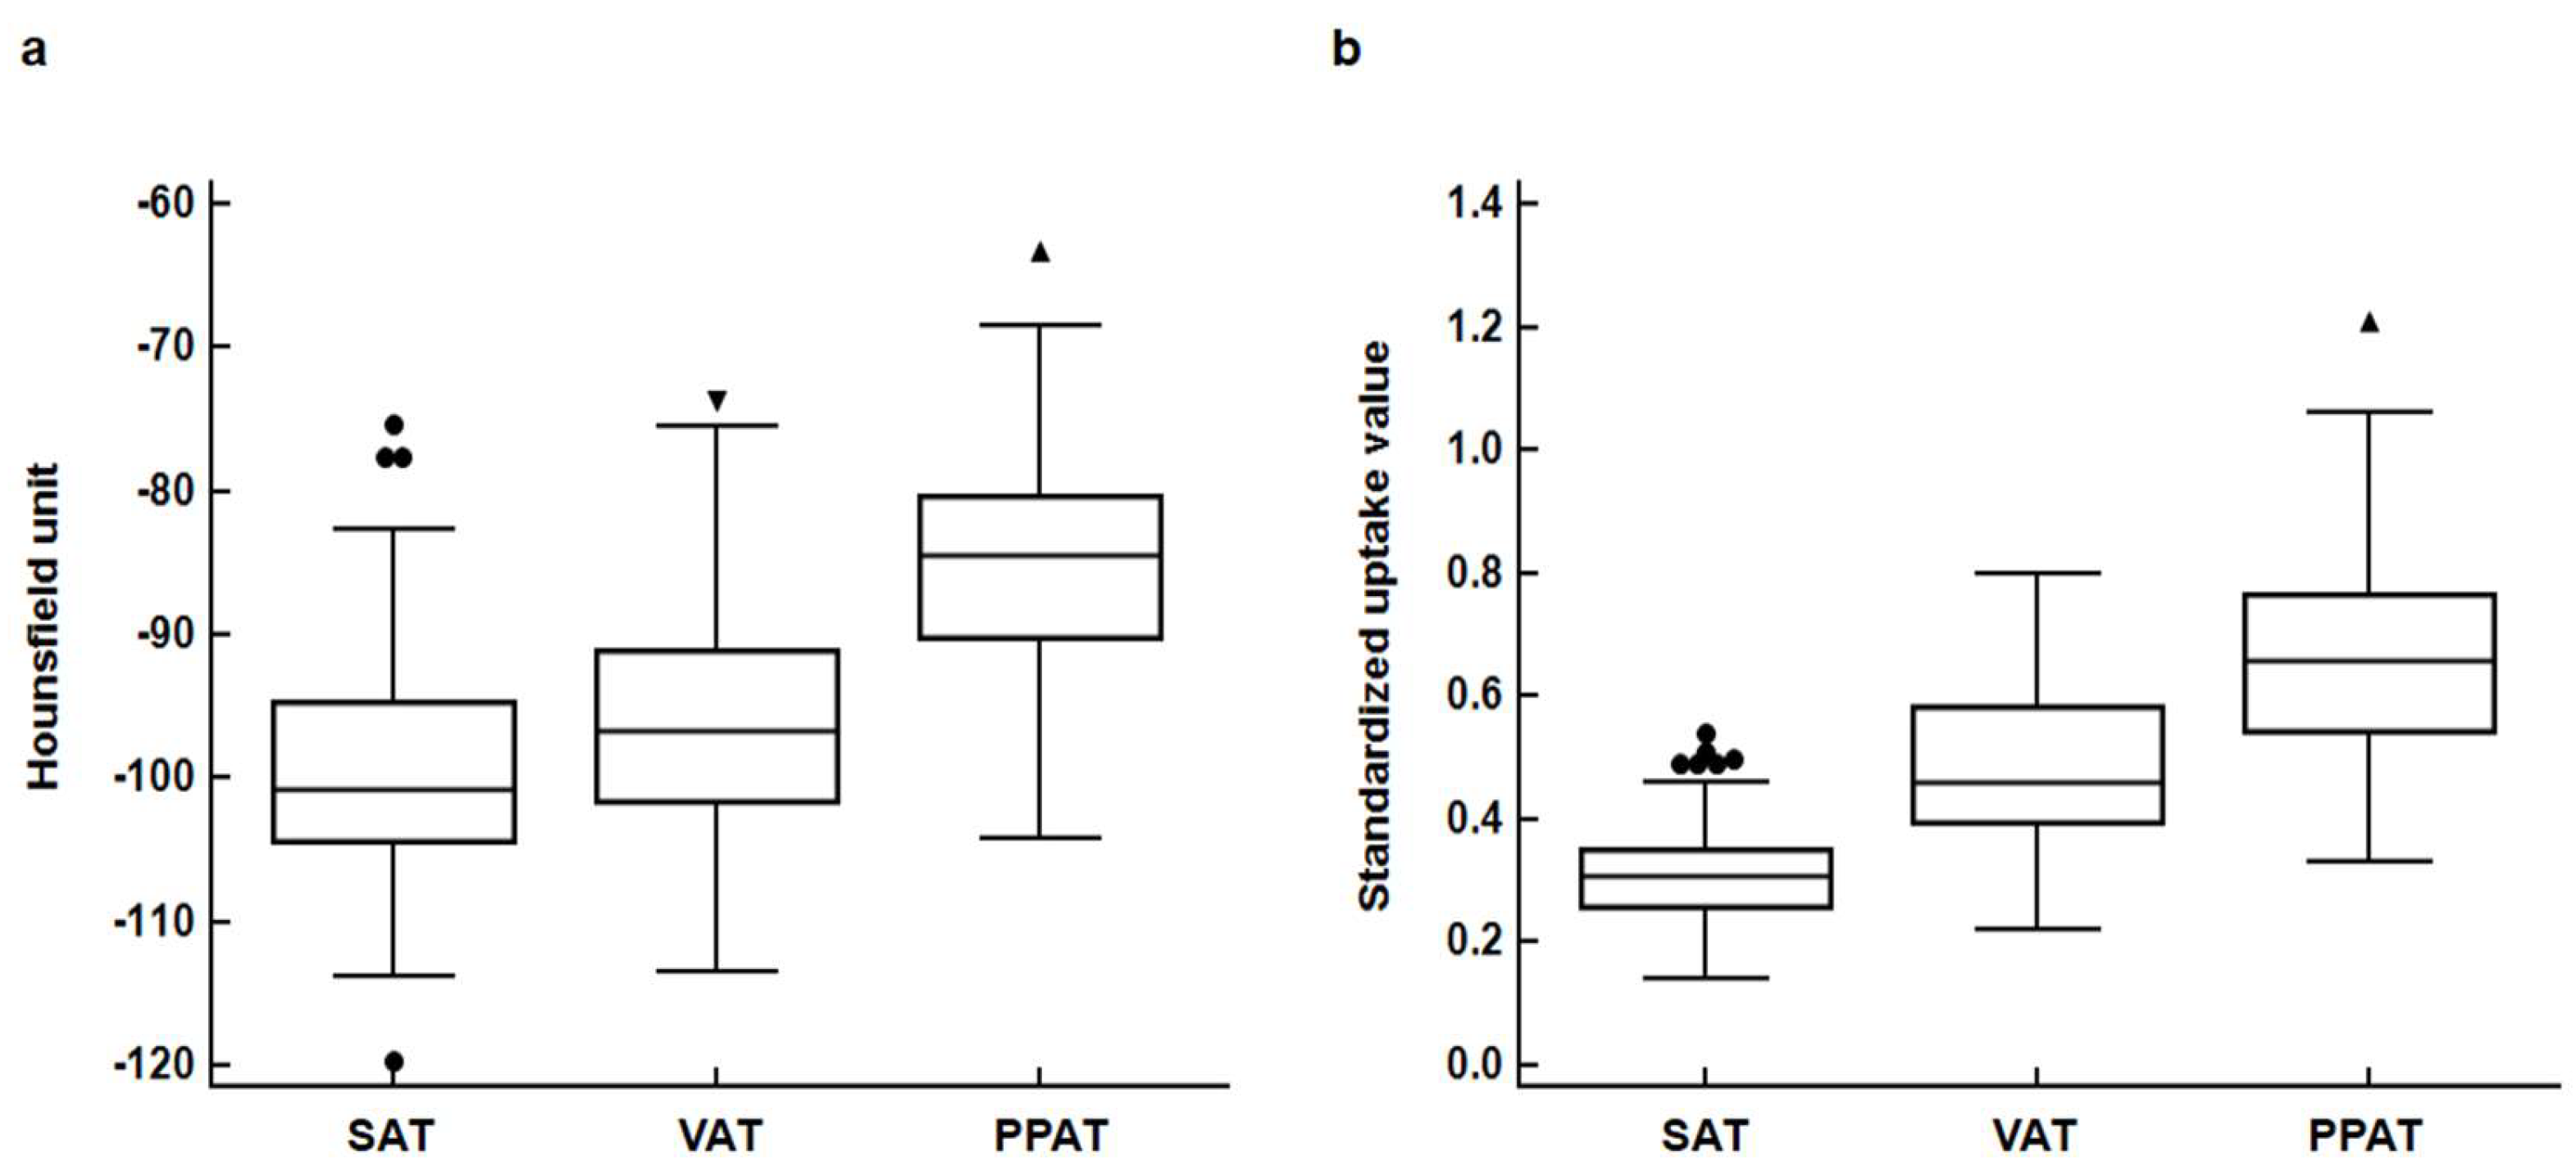
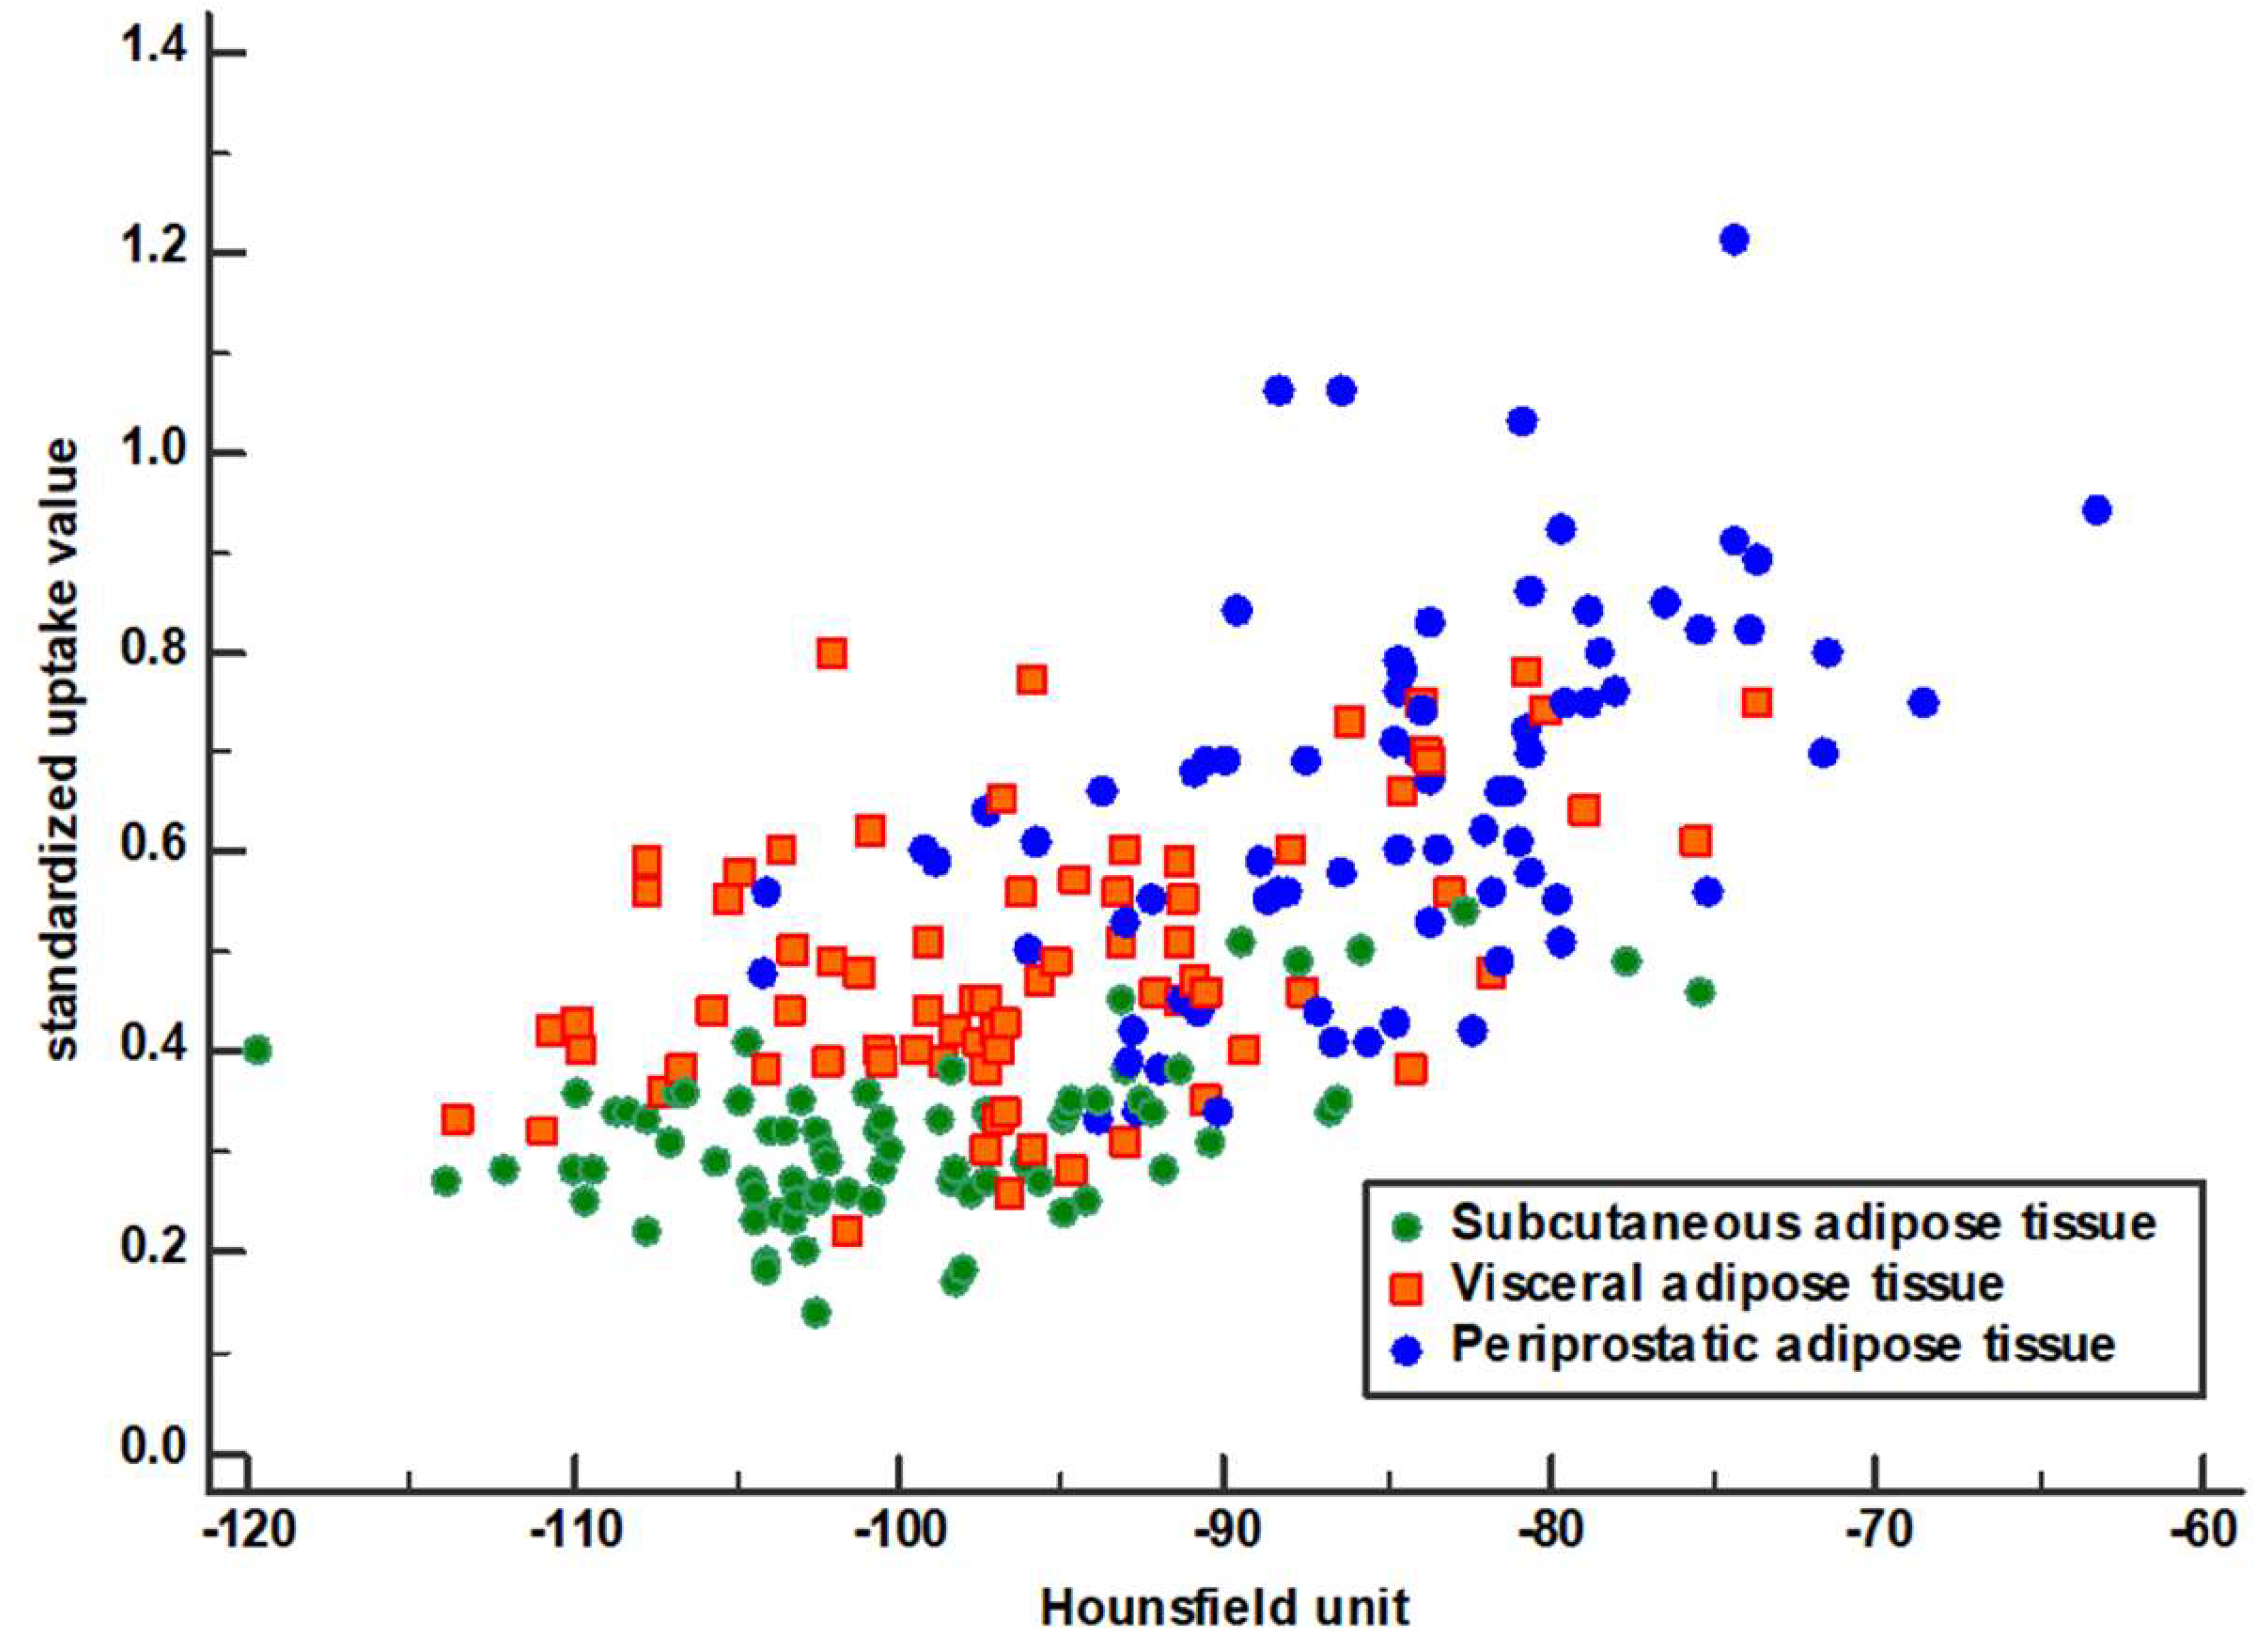
3.2. PPAT Parameters
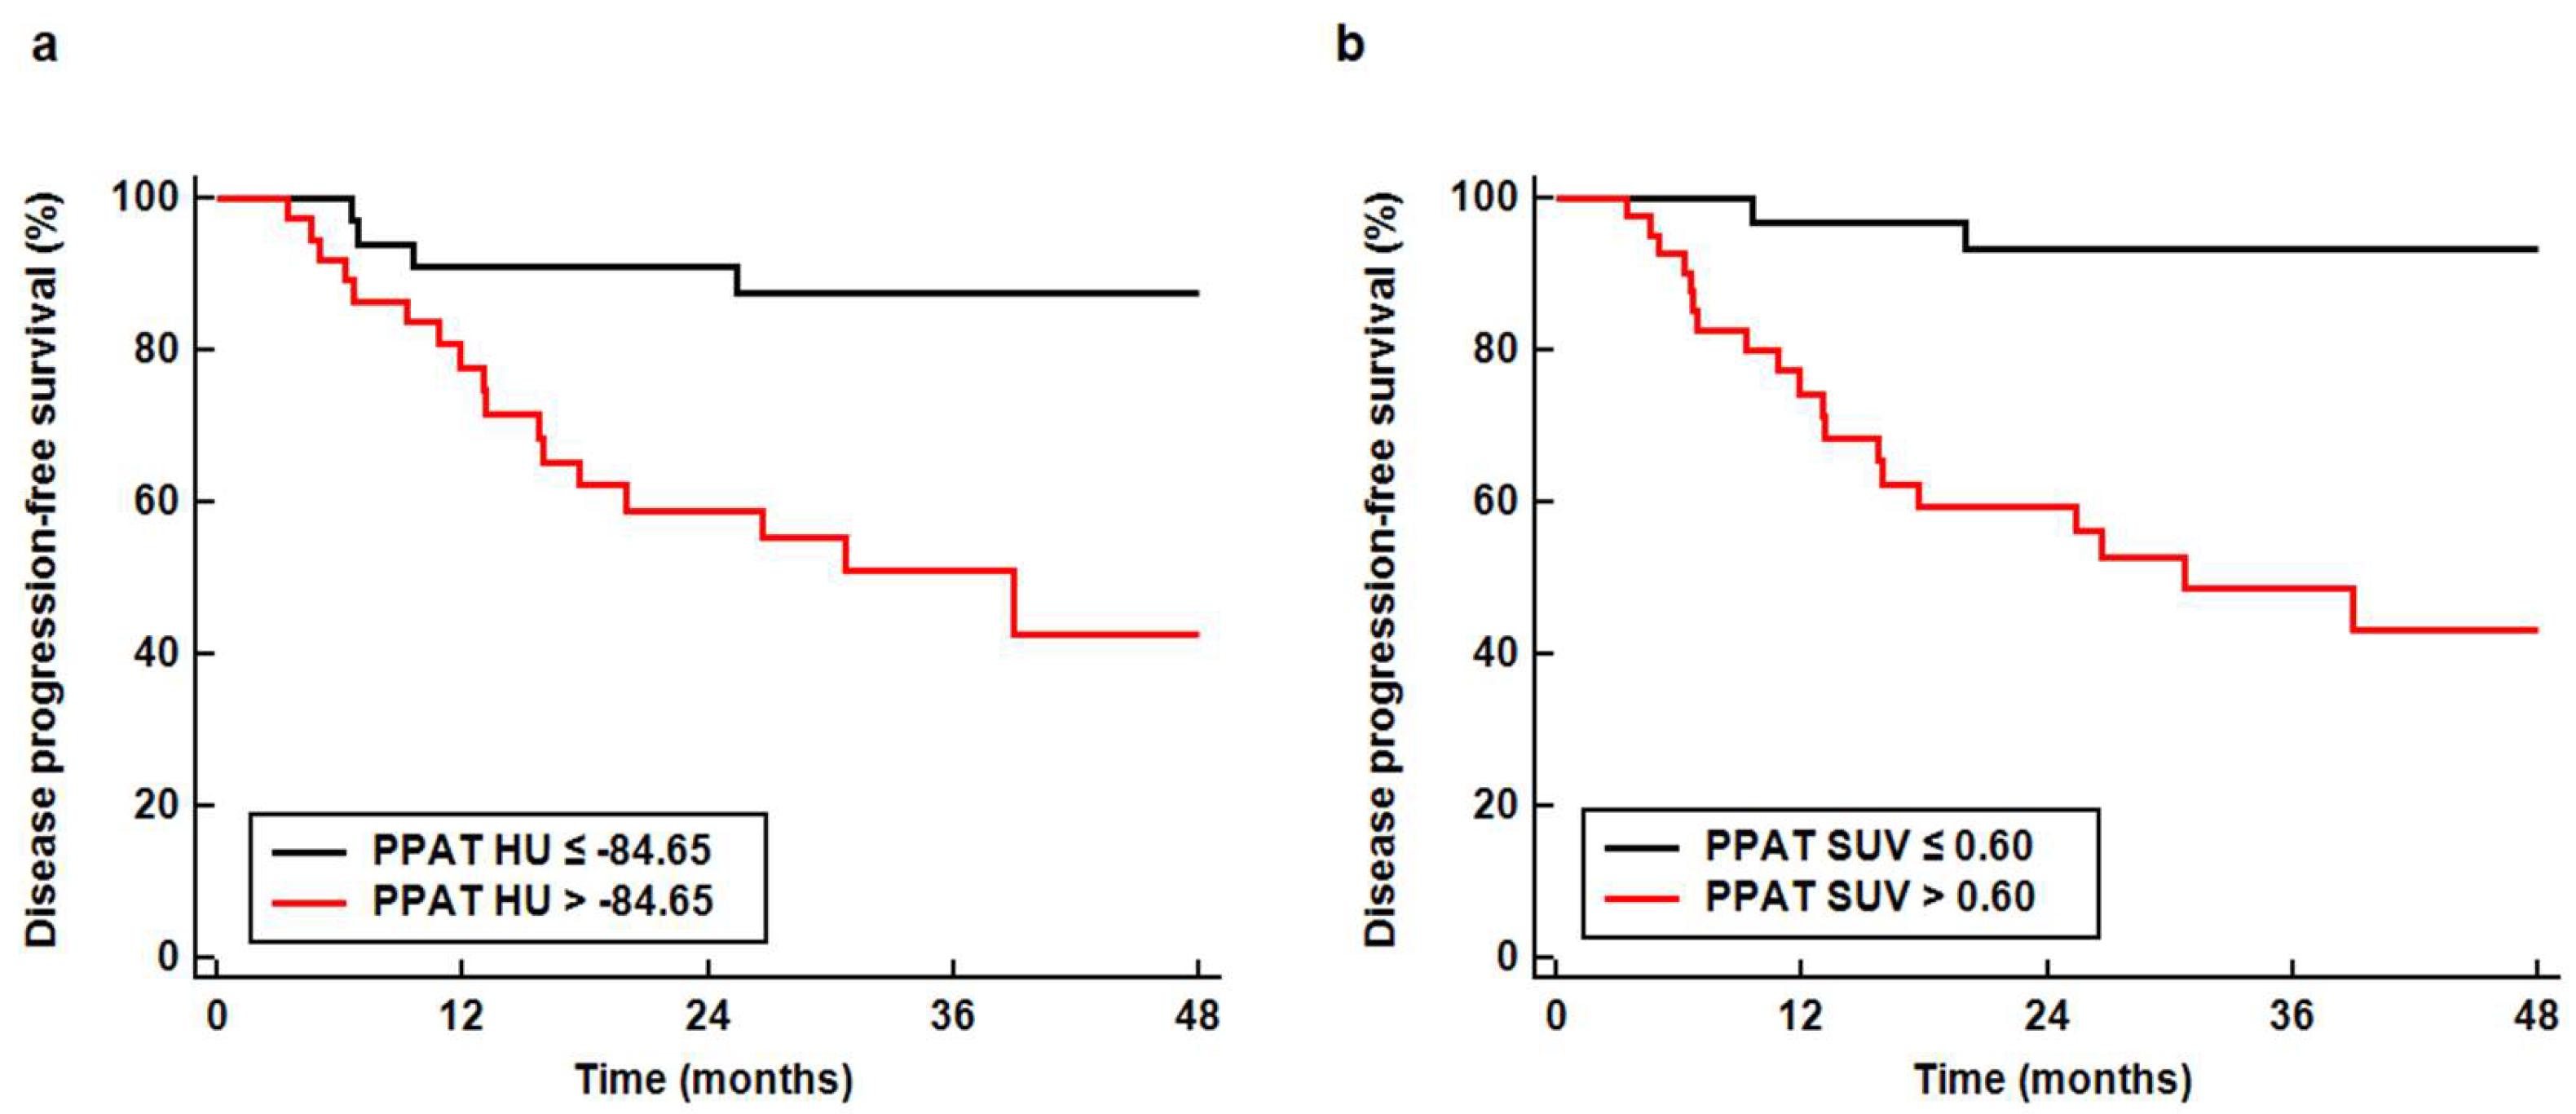
3.3. Survival Analysis
4. Discussion
5. Conclusions
Supplementary Materials
Author Contributions
Funding
Conflicts of Interest
References
- Bray, F.; Ferlay, J.; Soerjomataram, I.; Siegel, R.L.; Torre, L.A.; Jemal, A. Global cancer statistics 2018: GLOBOCAN estimates of incidence and mortality worldwide for 36 cancers in 185 countries. CA Cancer J. Clin. 2018, 68, 394–424. [Google Scholar] [CrossRef]
- Møller, H.; Roswall, N.; Van Hemelrijck, M.; Larsen, S.B.; Cuzick, J.; Holmberg, L.; Overvad, K.; Tjønneland, A. Prostate cancer incidence, clinical stage and survival in relation to obesity: A prospective cohort study in Denmark. Int. J. Cancer 2015, 136, 1940–1947. [Google Scholar] [CrossRef]
- Allott, E.H.; Masko, E.M.; Freedland, S.J. Obesity and prostate cancer: Weighing the evidence. Eur. Urol. 2013, 63, 800–809. [Google Scholar] [CrossRef]
- Pfitzenmaier, J.; Pritsch, M.; Haferkamp, A.; Jakobi, H.; Fritsch, F.; Gilfrich, C.; Djakovic, N.; Buse, S.; Pahernik, S.; Hohenfellner, M. Is the body mass index a predictor of adverse outcome in prostate cancer after radical prostatectomy in a mid-European study population? BJU Int. 2009, 103, 877–882. [Google Scholar] [CrossRef]
- van Roermund, J.G.; Kok, D.E.; Wildhagen, M.F.; Kiemeney, L.A.; Struik, F.; Sloot, S.; van Oort, I.M.; Hulsbergen-van de Kaa, C.A.; van Leenders, G.J.; Bangma, C.H.; et al. Body mass index as a prognostic marker for biochemical recurrence in Dutch men treated with radical prostatectomy. BJU Int. 2009, 104, 321–325. [Google Scholar] [CrossRef]
- Lavie, C.J.; De Schutter, A.; Patel, D.A.; Milani, R.V. Body composition and fitness in the obesity paradox--body mass index alone does not tell the whole story. Prev. Med. 2013, 57, 1–2. [Google Scholar] [CrossRef]
- Lee, J.W.; Lee, H.S.; Na, J.O.; Lee, S.M. Effect of adipose tissue volume on prognosis in patients with non-small cell lung cancer. Clin. Imaging 2018, 50, 308–313. [Google Scholar] [CrossRef]
- van Roermund, J.G.; Bol, G.H.; Witjes, J.A.; Ruud Bosch, J.L.; Kiemeney, L.A.; van Vulpen, M. Periprostatic fat measured on computed tomography as a marker for prostate cancer aggressiveness. World J. Urol. 2010, 28, 699–704. [Google Scholar] [CrossRef]
- Fain, J.N.; Madan, A.K.; Hiler, M.L.; Cheema, P.; Bahouth, S.W. Comparison of the release of adipokines by adipose tissue, adipose tissue matrix, and adipocytes from visceral and subcutaneous abdominal adipose tissues of obese humans. Endocrinology 2004, 145, 2273–2282. [Google Scholar] [CrossRef]
- Nassar, Z.D.; Aref, A.T.; Miladinovic, D.; Mah, C.Y.; Raj, G.V.; Hoy, A.J.; Butler, L.M. Peri-prostatic adipose tissue: The metabolic microenvironment of prostate cancer. BJU Int. 2018, 121 (Suppl. 3), 9–21. [Google Scholar] [CrossRef]
- Allott, E.H.; Howard, L.E.; Song, H.J.; Sourbeer, K.N.; Koontz, B.F.; Salama, J.K.; Freedland, S.J. Racial differences in adipose tissue distribution and risk of aggressive prostate cancer among men undergoing radiotherapy. Cancer Epidemiol. Biomark. Prev. 2014, 23, 2404–2412. [Google Scholar] [CrossRef]
- Delouya, G.; Tiberi, D.; Bhatnagar, S.R.; Campeau, S.; Saad, F.; Taussky, D. Impact of adipose tissue on prostate cancer aggressiveness-analysis of a high-risk population. Horm. Mol. Biol. Clin. Investig. 2018, 36, 20180049. [Google Scholar] [CrossRef]
- Woo, S.; Cho, J.Y.; Kim, S.Y.; Kim, S.H. Periprostatic fat thickness on MRI: Correlation with Gleason score in prostate cancer. AJR Am. J. Roentgenol. 2015, 204, W43–W47. [Google Scholar] [CrossRef]
- Estève, D.; Roumiguié, M.; Manceau, C.; Milhas, D.; Muller, C. Periprostatic adipose tissue: A heavy player in prostate cancer progression. Curr. Opin. Endocr. Metab. Res. 2020, 10, 29–35. [Google Scholar] [CrossRef]
- Miladinovic, D.; Cusick, T.; Mahon, K.L.; Haynes, A.M.; Cortie, C.H.; Meyer, B.J.; Stricker, P.D.; Wittert, G.A.; Butler, L.M.; Horvath, L.G.; et al. Assessment of periprostatic and subcutaneous adipose tissue lipolysis and adipocyte size from men with localized prostate cancer. Cancers 2020, 12, 1385. [Google Scholar] [CrossRef]
- Gazi, E.; Gardner, P.; Lockyer, N.P.; Hart, C.A.; Brown, M.D.; Clarke, N.W. Direct evidence of lipid translocation between adipocytes and prostate cancer cells with imaging FTIR microspectroscopy. J. Lipid Res. 2007, 48, 1846–1856. [Google Scholar] [CrossRef]
- Ribeiro, R.; Monteiro, C.; Cunha, V.; Oliveira, M.J.; Freitas, M.; Fraga, A.; Príncipe, P.; Lobato, C.; Lobo, F.; Morais, A.; et al. Human periprostatic adipose tissue promotes prostate cancer aggressiveness in vitro. J. Exp. Clin. Cancer Res. 2012, 31, 32. [Google Scholar] [CrossRef]
- Uehara, H.; Kobayashi, T.; Matsumoto, M.; Watanabe, S.; Yoneda, A.; Bando, Y. Adipose tissue: Critical contributor to the development of prostate cancer. J. Med. Investig. 2018, 65, 9–17. [Google Scholar] [CrossRef]
- Gucalp, A.; Iyengar, N.M.; Zhou, X.K.; Giri, D.D.; Falcone, D.J.; Wang, H.; Williams, S.; Krasne, M.D.; Yaghnam, I.; Kunzel, B.; et al. Periprostatic adipose inflammation is associated with high-grade prostate cancer. Prostate Cancer Prostatic Dis. 2017, 20, 418–423. [Google Scholar] [CrossRef]
- van Roermund, J.G.; Hinnen, K.A.; Tolman, C.J.; Bol, G.H.; Witjes, J.A.; Bosch, J.L.; Kiemeney, L.A.; van Vulpen, M. Periprostatic fat correlates with tumour aggressiveness in prostate cancer patients. BJU Int. 2011, 107, 1775–1779. [Google Scholar] [CrossRef]
- Zhang, Q.; Sun, L.J.; Qi, J.; Yang, Z.G.; Huang, T.; Huo, R.C. Periprostatic adiposity measured on magnetic resonance imaging correlates with prostate cancer aggressiveness. Urol. J. 2014, 11, 1793–1799. [Google Scholar]
- Lee, J.W.; Lee, S.M.; Chung, Y.A. Prognostic value of CT attenuation and FDG uptake of adipose tissue in patients with pancreatic adenocarcinoma. Clin. Radiol. 2018, 73, 1056-e1. [Google Scholar] [CrossRef]
- Lee, J.W.; Son, M.W.; Chung, I.K.; Cho, Y.S.; Lee, M.S.; Lee, S.M. Significance of CT attenuation and F-18 fluorodeoxyglucose uptake of visceral adipose tissue for predicting survival in gastric cancer patients after curative surgical resection. Gastric Cancer 2020, 23, 273–284. [Google Scholar] [CrossRef]
- McDonald, A.M.; Fiveash, J.B.; Kirkland, R.S.; Cardan, R.A.; Jacob, R.; Kim, R.Y.; Dobelbower, M.C.; Yang, E.S. Subcutaneous adipose tissue characteristics and the risk of biochemical recurrence in men with high-risk prostate cancer. Urol. Oncol. 2017, 35, 663-e15. [Google Scholar] [CrossRef]
- Murphy, R.A.; Register, T.C.; Shively, C.A.; Carr, J.J.; Ge, Y.; Heilbrun, M.E.; Cummings, S.R.; Koster, A.; Nevitt, M.C.; Satterfield, S.; et al. Adipose tissue density, a novel biomarker predicting mortality risk in older adults. J. Gerontol. Ser. A Biol. Sci. Med. Sci. 2014, 69, 109–117. [Google Scholar] [CrossRef]
- Lee, J.W.; Ban, M.J.; Park, J.H.; Lee, S.M. Visceral adipose tissue volume and CT-attenuation as prognostic factors in patients with head and neck cancer. Head Neck 2019, 41, 1605–1614. [Google Scholar] [CrossRef]
- Lee, J.W.; Kim, S.Y.; Lee, H.J.; Han, S.W.; Lee, J.E.; Lee, S.M. Prognostic significance of abdominal-to-gluteofemoral adipose tissue distribution in patients with breast cancer. J. Clin. Med. 2019, 8, 1358. [Google Scholar] [CrossRef]
- WHO Expert Consultation. Appropriate body-mass index for Asian populations and its implications for policy and intervention strategies. Lancet 2004, 363, 157–163. [Google Scholar] [CrossRef]
- Vittinghoff, E.; McCulloch, C.E. Relaxing the rule of ten events per variable in logistic and Cox regression. Am. J. Epidemiol. 2007, 165, 710–718. [Google Scholar] [CrossRef]
- Laurent, V.; Toulet, A.; Attané, C.; Milhas, D.; Dauvillier, S.; Zaidi, F.; Clement, E.; Cinato, M.; Le Gonidec, S.; Guérard, A.; et al. periprostatic adipose tissue favors prostate cancer cell invasion in an obesity-dependent manner: Role of oxidative stress. Mol. Cancer Res. 2019, 17, 821–835. [Google Scholar] [CrossRef]
- Ribeiro, R.J.; Monteiro, C.P.; Cunha, V.F.; Azevedo, A.S.; Oliveira, M.J.; Monteiro, R.; Fraga, A.M.; Príncipe, P.; Lobato, C.; Lobo, F.; et al. Tumor cell-educated periprostatic adipose tissue acquires an aggressive cancer-promoting secretory profile. Cell Physiol. Biochem. 2012, 29, 233–240. [Google Scholar] [CrossRef]
- Duong, M.N.; Geneste, A.; Fallone, F.; Li, X.; Dumontet, C.; Muller, C. The fat and the bad: Mature adipocytes, key actors in tumor progression and resistance. Oncotarget 2017, 8, 57622–57641. [Google Scholar] [CrossRef] [PubMed]
- Ito, Y.; Ishiguro, H.; Kobayashi, N.; Hasumi, H.; Watanabe, M.; Yao, M.; Uemura, H. Adipocyte-derived monocyte chemotactic protein-1 (MCP-1) promotes prostate cancer progression through the induction of MMP-2 activity. Prostate 2015, 75, 1009–1019. [Google Scholar] [CrossRef] [PubMed]
- Dahran, N.; Szewczyk-Bieda, M.; Vinnicombe, S.; Fleming, S.; Nabi, G. Periprostatic fat adipokine expression is correlated with prostate cancer aggressiveness in men undergoing radical prostatectomy for clinically localized disease. BJU Int. 2019, 123, 985–994. [Google Scholar] [CrossRef] [PubMed]
- Lee, J.W.; Kim, S.Y.; Lee, H.J.; Han, S.W.; Lee, J.E.; Lee, S.M. Prognostic significance of CT-attenuation of tumor-adjacent breast adipose tissue in breast cancer patients with surgical resection. Cancers 2019, 11, 1135. [Google Scholar] [CrossRef]
- Iordanescu, G.; Brendler, C.; Crawford, S.E.; Wyrwicz, A.M.; Venkatasubramanian, P.N.; Doll, J.A. MRS measured fatty acid composition of periprostatic adipose tissue correlates with pathological measures of prostate cancer aggressiveness. J. Magn. Reson. Imaging 2015, 42, 651–657. [Google Scholar] [CrossRef] [PubMed]
- Ribeiro, R.; Monteiro, C.; Catalán, V.; Hu, P.; Cunha, V.; Rodríguez, A.; Gómez-Ambrosi, J.; Fraga, A.; Príncipe, P.; Lobato, C.; et al. Obesity and prostate cancer: Gene expression signature of human periprostatic adipose tissue. BMC Med. 2012, 10, 108. [Google Scholar] [CrossRef]
- Mangiola, S.; Stuchbery, R.; Macintyre, G.; Clarkson, M.J.; Peters, J.S.; Costello, A.J.; Hovens, C.M.; Corcoran, N.M. Periprostatic fat tissue transcriptome reveals a signature diagnostic for high-risk prostate cancer. Endocr. Relat. Cancer 2018, 25, 569–581. [Google Scholar] [CrossRef]
- Zhang, Q.; Sun, L.J.; Yang, Z.G.; Zhang, G.M.; Huo, R.C. Influence of adipocytokines in periprostatic adipose tissue on prostate cancer aggressiveness. Cytokine 2016, 85, 148–156. [Google Scholar] [CrossRef]
- Kapoor, N.D.; Twining, P.K.; Groot, O.Q.; Pielkenrood, B.J.; Bongers, M.E.R.; Newman, E.T.; Verlaan, J.J.; Schwab, J.H. Adipose tissue density on CT as a prognostic factor in patients with cancer: A systematic review. Acta Oncol. 2020. [Google Scholar] [CrossRef]
- Pahk, K.; Rhee, S.; Kim, S.; Choe, J.G. predictive role of functional visceral fat activity assessed by preoperative F-18 FDG PET/CT for regional lymph node or distant metastasis in patients with colorectal cancer. PLoS ONE 2016, 11, e0148776. [Google Scholar] [CrossRef] [PubMed]
- Yoo, I.D.; Lee, S.M.; Lee, J.W.; Baek, M.J.; Ahn, T.S. Usefulness of metabolic activity of adipose tissue in FDG PET/CT of colorectal cancer. Abdom. Radiol. 2018, 43, 2052–2059. [Google Scholar] [CrossRef] [PubMed]
- Rayn, K.N.; Elnabawi, Y.A.; Sheth, N. Clinical implications of PET/CT in prostate cancer management. Transl. Androl. Urol. 2018, 7, 844–854. [Google Scholar] [CrossRef]
- Bednarova, S.; Lindenberg, M.L.; Vinsensia, M.; Zuiani, C.; Choyke, P.L.; Turkbey, B. Positron emission tomography (PET) in primary prostate cancer staging and risk assessment. Transl. Androl. Urol. 2017, 6, 413–423. [Google Scholar] [CrossRef] [PubMed]
- Huang, H.; Chen, S.; Li, W.; Bai, P.; Wu, X.; Xing, J. Periprostatic fat thickness on MRI is an independent predictor of time to castration-resistant prostate cancer in Chinese patients with newly diagnosed prostate cancer treated with androgen deprivation therapy. Clin. Genitourin. Cancer 2019, 17, e1036–e1047. [Google Scholar] [CrossRef] [PubMed]
- Salji, M.; Hendry, J.; Patel, A.; Ahmad, I.; Nixon, C.; Leung, H.Y. Peri-prostatic fat volume measurement as a predictive tool for castration resistance in advanced prostate cancer. Eur. Urol. Focus 2018, 4, 858–866. [Google Scholar] [CrossRef]
- Tan, W.P.; Lin, C.; Chen, M.; Deane, L.A. Periprostatic fat: A risk factor for prostate cancer? Urology 2016, 98, 107–112. [Google Scholar] [CrossRef]
- Sasaki, T.; Sugino, Y.; Kato, M.; Nishikawa, K.; Kanda, H. Pre-treatment ratio of periprostatic to subcutaneous fat thickness on MRI is an independent survival predictor in hormone-naïve men with advanced prostate cancer. Int. J. Clin. Oncol. 2020, 25, 370–376. [Google Scholar] [CrossRef]
- Taussky, D.; Barkati, M.; Campeau, S.; Zerouali, K.; Nadiri, A.; Saad, F.; Delouya, G. Changes in periprostatic adipose tissue induced by 5α-reductase inhibitors. Andrology 2017, 5, 511–515. [Google Scholar] [CrossRef]
- Bhardwaj, P.; Ikeda, T.; Zhou, X.K.; Wang, H.; Zheng, X.E.; Giri, D.D.; Elemento, O.; Verma, A.; Miyazawa, M.; Mukherjee, S.; et al. Supplemental estrogen and caloric restriction reduce obesity-induced periprostatic white adipose inflammation in mice. Carcinogenesis 2019, 40, 914–923. [Google Scholar] [CrossRef]


| Characteristics | No. of Patients (%) | Median (Range) | |
|---|---|---|---|
| Age (years) | 73 (53–89) | ||
| Body mass index (kg/m2) | 24.6 (16.5–41.4) | ||
| Gleason grade group | Group 1 | 13 (16.9%) | |
| Group 2 | 12 (15.6%) | ||
| Group 3 | 9 (11.7%) | ||
| Group 4 | 19 (24.7%) | ||
| Group 5 | 24 (31.2%) | ||
| Serum PSA (ng/mL) | 15.5 (1.3–2845.0) | ||
| T stage | T2 stage | 30 (39.0%) | |
| T3 stage | 34 (44.2%) | ||
| T4 stage | 13 (16.9%) | ||
| N stage | N0 stage | 51 (66.2%) | |
| N1 stage | 26 (33.8%) | ||
| M stage | M0 stage | 55 (71.4%) | |
| M1 stage | 22 (28.6%) | ||
| TNM stage | Stage II | 21 (27.3%) | |
| Stage III | 20 (26.0%) | ||
| Stage IV | 36 (46.8%) | ||
| Tumor SUV | 3.54 (1.72–14.88) | ||
| SAT | HU | −100.79 (−119.66–−75.36) | |
| SUV | 0.31 (0.14–0.54) | ||
| VAT | HU | −96.75 (−113.51–−73.64) | |
| SUV | 0.46 (0.22–0.80) | ||
| PPAT | HU | −84.52 (−104.18–−63.20) | |
| SUV | 0.66 (0.33–1.21) | ||
| Treatment | Hormone treatment | 35 (45.5%) | |
| Radiotherapy | 18 (23.4%) | ||
| Surgery | 14 (18.2%) | ||
| Surgery + hormone treatment | 8 (10.4%) | ||
| Surgery + radiotherapy | 1 (1.3%) | ||
| Radiotherapy + Hormone treatment | 1 (1.3%) | ||
| Variables | PPAT HU | PPAT SUV | |
|---|---|---|---|
| Gleason grade group | Grade 1 | −86.63 ± 6.18 | 0.66 ± 0.17 |
| Grade 2–3 | −86.91 ± 7.47 | 0.63 ± 0.16 | |
| Grade 4–5 | −83.28 ± 8.18 | 0.67 ± 0.20 | |
| p-value * | 0.173 | 0.622 | |
| T stage | T2 stage | −86.92 ± 9.06 | 0.65 ± 0.17 |
| T3 stage | −85.60 ± 5.27 | 0.62 ± 0.19 | |
| T4 stage | −80.62 ± 8.96 | 0.77 ± 0.16 | |
| p-value * | 0.048 ‡ | 0.022 ‡ | |
| N stage | N0 stage | −86.98 ± 7.12 | 0.59 ± 0.15 |
| N1 stage | −80.61 ± 7.45 | 0.79 ± 0.17 | |
| p-value † | <0.001 | <0.001 | |
| M stage | M0 stage | −86.51 ± 7.16 | 0.62 ± 0.17 |
| M1 stage | −80.64 ± 7.91 | 0.76 ± 0.17 | |
| p-value † | 0.007 | 0.002 | |
| Variables | p-Value | Hazard Ratio (95% CI) | |
|---|---|---|---|
| Age (1-year increase) | 0.272 | 1.03 (0.98–1.09) | |
| Body mass index (1.00 kg/m2 increase) | 0.130 | 0.89 (0.77–1.03) | |
| Gleason grade group (grade 1 vs.) | Grade 2–3 | 0.620 | 1.77 (0.18–17.06) |
| Grade 4–5 | 0.008 | 4.36 (1.47–12.97) | |
| Serum PSA (1.0 ng/mL increase) | <0.001 | 1.00 (1.00–1.00) | |
| T stage (T2 stage vs.) | T3 stage | 0.105 | 2.95 (0.80–10.91) |
| T4 stage | <0.001 | 10.42 (2.81–38.66) | |
| N stage (N0 vs. N1 stage) | <0.001 | 9.57 (3.47–26.41) | |
| M stage (M0 vs. M1 stage) | <0.001 | 9.26 (3.77–22.77) | |
| TNM stage (stage II vs.) | Stage III | 0.534 | 2.14 (0.19–23.63) |
| Stage IV | 0.006 | 16.76 (2.23–126.16) | |
| Tumor SUV (1.00 increase) | <0.001 | 1.21 (1.09–1.35) | |
| SAT HU (1.00 HU increase) | 0.235 | 1.04 (0.98–1.10) | |
| SAT SUV (0.10 increase) | <0.001 | 2.77 (1.68–4.57) | |
| VAT HU (1.00 HU increase) | 0.457 | 1.02 (0.97–1.08) | |
| VAT SUV (0.10 increase) | 0.006 | 1.60 (1.15–2.24) | |
| PPAT HU (1.00 HU increase) | 0.008 | 1.09 (1.02–1.16) | |
| PPAT SUV (0.10 increase) | <0.001 | 1.57 (1.26–1.96) |
| Model | Variables | Model with PPAT HU | Model with PPAT SUV | ||
|---|---|---|---|---|---|
| p-Value | HR (95% CI) | p-Value | HR (95% CI) | ||
| Model 1 | Age (1-year increase) | 0.576 | 1.02 (0.96–1.08) | 0.141 | 1.04 (0.99–1.11) |
| Body mass index(1.00 increase) | 0.437 | 0.94 (0.80–1.10) | 0.201 | 0.90 (0.77–1.06) | |
| PPAT HU (1.00 increase) | 0.021 | 1.08 (1.01–1.16) | - | - | |
| PPAT SUV (0.10 increase) | - | - | <0.001 | 1.72 (1.33–2.21) | |
| Model 2 | Gleason grade 2–3(vs. grade 1) | 0.525 | 2.10 (0.21–20.56) | 0.549 | 2.01 (0.20–19.64) |
| Gleason grade 4–5(vs. grade 1) | 0.329 | 2.78 (0.36–21.74) | 0.212 | 3.91 (0.46–33.20) | |
| TNM stage III (vs. stage II) | 0.648 | 1.78 (0.15–20.97) | 0.510 | 2.36 (0.18–30.28) | |
| TNM stage IV (vs. stage II) | 0.036 | 10.41 (1.16–93.14) | 0.017 | 7.55 (3.01–18.89) | |
| PPAT HU (1.00 increase) | 0.033 | 1.43 (1.11–1.92) | - | - | |
| PPAT SUV (0.10 increase) | - | - | 0.007 | 1.50 (1.11–1.94) | |
| Model 3 | Serum PSA (1.0 increase) | 0.019 | 1.00 (1.00–1.01) | 0.017 | 1.00 (1.00–1.00) |
| Tumor SUV (1.00 increase) | <0.001 | 1.21 (1.08–1.35) | 0.004 | 1.21 (1.06–1.39) | |
| PPAT HU (1.00 increase) | 0.008 | 1.09 (1.02–1.15) | - | - | |
| PPAT SUV (0.10 increase) | - | - | 0.001 | 1.64 (1.29–2.08) | |
| Model 4 | SAT SUV (0.10 increase) | 0.046 | 2.13 (1.01–4.47) | 0.039 | 2.15 (1.04–4.47) |
| VAT SUV (0.10 increase) | 0.705 | 1.10 (0.68–1.78) | 0.759 | 0.92 (0.56–1.53) | |
| PPAT HU (1.00 increase) | 0.101 | 1.06 (0.99–1.13) | - | - | |
| PPAT SUV (0.10 increase) | - | - | 0.005 | 1.45 (1.12–1.87) | |
| Model 5 | TNM stage III (vs. stage II) | 0.355 | 3.14 (0.28–35.58) | 0.247 | 4.24 (0.37–48.50) |
| TNM stage IV (vs. stage II) | 0.032 | 10.29 (1.22–87.15) | 0.013 | 4.32 (1.12–16.58) | |
| Serum PSA (1.0 increase) | 0.055 | 1.00 (1.00–1.00) | 0.050 | 1.00 (1.00–1.00) | |
| Tumor SUV (1.00 increase) | 0.273 | 1.08 (0.94–1.23) | 0.054 | 1.14 (1.00–1.31) | |
| SAT SUV (0.10 increase) | 0.100 | 1.37 (0.94–2.00) | 0.129 | 1.59 (0.87–2.91) | |
| PPAT HU (1.00 increase) | 0.343 | 1.03 (0.97–1.10) | - | - | |
| PPAT SUV (0.10 increase) | - | - | 0.003 | 1.50 (1.15–1.96) | |
Publisher’s Note: MDPI stays neutral with regard to jurisdictional claims in published maps and institutional affiliations. |
© 2020 by the authors. Licensee MDPI, Basel, Switzerland. This article is an open access article distributed under the terms and conditions of the Creative Commons Attribution (CC BY) license (http://creativecommons.org/licenses/by/4.0/).
Share and Cite
Lee, J.W.; Jeon, Y.S.; Kim, K.H.; Yang, H.J.; Lee, C.H.; Lee, S.M. Prognostic Value of CT-Attenuation and 18F-Fluorodeoxyglucose Uptake of Periprostatic Adipose Tissue in Patients with Prostate Cancer. J. Pers. Med. 2020, 10, 185. https://doi.org/10.3390/jpm10040185
Lee JW, Jeon YS, Kim KH, Yang HJ, Lee CH, Lee SM. Prognostic Value of CT-Attenuation and 18F-Fluorodeoxyglucose Uptake of Periprostatic Adipose Tissue in Patients with Prostate Cancer. Journal of Personalized Medicine. 2020; 10(4):185. https://doi.org/10.3390/jpm10040185
Chicago/Turabian StyleLee, Jeong Won, Youn Soo Jeon, Ki Hong Kim, Hee Jo Yang, Chang Ho Lee, and Sang Mi Lee. 2020. "Prognostic Value of CT-Attenuation and 18F-Fluorodeoxyglucose Uptake of Periprostatic Adipose Tissue in Patients with Prostate Cancer" Journal of Personalized Medicine 10, no. 4: 185. https://doi.org/10.3390/jpm10040185
APA StyleLee, J. W., Jeon, Y. S., Kim, K. H., Yang, H. J., Lee, C. H., & Lee, S. M. (2020). Prognostic Value of CT-Attenuation and 18F-Fluorodeoxyglucose Uptake of Periprostatic Adipose Tissue in Patients with Prostate Cancer. Journal of Personalized Medicine, 10(4), 185. https://doi.org/10.3390/jpm10040185