Radio-Frequency and Microwave Techniques for Non-Invasive Measurement of Blood Glucose Levels


Abstract
1. Introduction
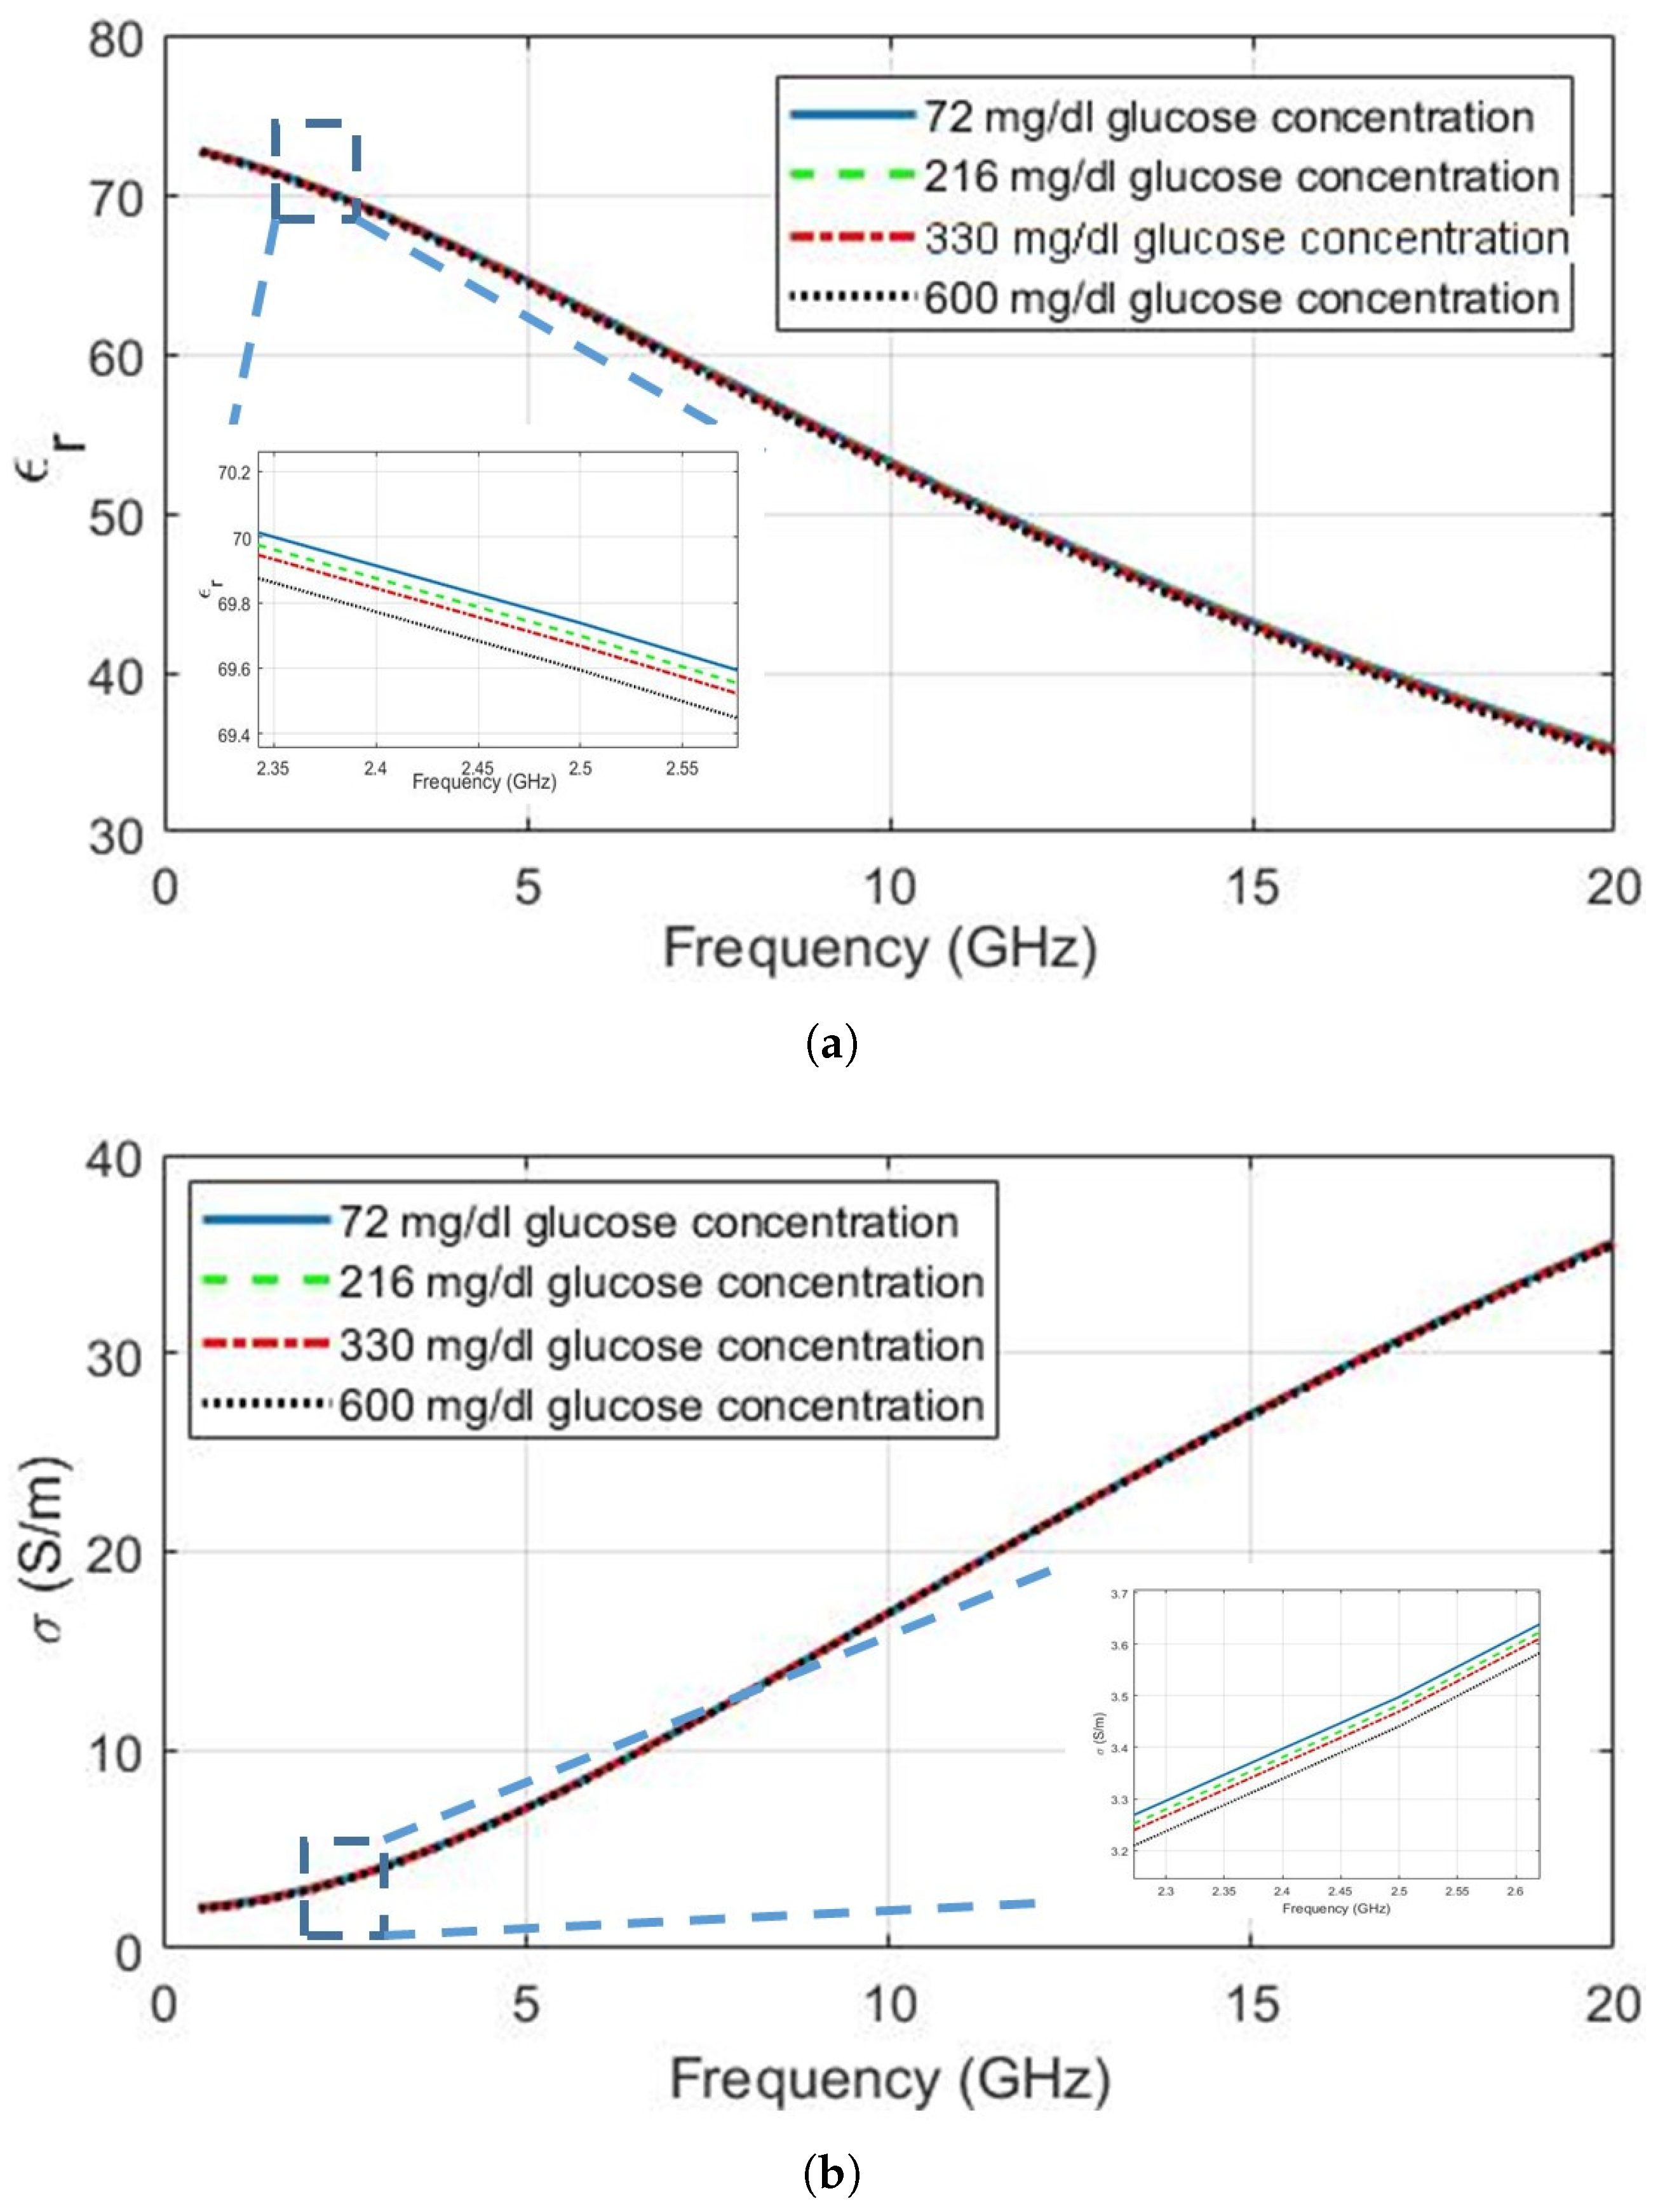
2. Glucose Dependent Dielectric Properties
- permittivity—a bulk (that is, volume-average) material property quantifying the ability of the medium to store electrical energy;
- electric constant—also called the vacuum permittivity or permittivity of free space, this is the permittivity for an ideal vacuum and a physical constant;
- relative permittivity—the permittivity of a medium normalised by the electric constant (this is often applied to the real part of the normalised permittivity only);
- dielectric loss factor—another name for the imaginary part of the permittivity (often referring to the imaginary part of the normalised permittivity);
- effective permittivity—the permittivity of a composite (heterogeneous) material (for example, a layered structure, where each homogeneous layer has different properties) represented as an equivalent homogeneous medium (this could be used for the relative effective permittivity, which should be evident from context);
- loss tangent—a means of representing the loss in a dielectric as the ratio of imaginary to real parts (usually denoted ‘’);
- conductivity—the ability to transfer charge, which is a loss mechanism for dielectrics;
- phantom—a digital or physical object that allows the parameter of interest to be changed in a controlled manner;
- tissue-mimicking material—a material designed to have the same dielectric properties as the tissue of interest, for use in physical phantoms;
- Q factor—a term used to quantify the performance of resonators, where greater Q-factors imply stronger resonances and more narrow bandwidths. A distinction is made between the ideal (‘unloaded’) performance and the ‘measured’ (‘loaded’) performance;
- resonant frequency—strictly, this is the frequency at which the input impedance of a resonator is purely real (resistive); in practice, this can be used for the frequency of a maximum (transmit-mode) or minimum (reflect-mode) of the resonator response. Changes in the dielectric properties ‘loading’ the resonator can affect some or all the resonant frequency, the bandwidth at resonance and the magnitude of the resonance (maximum or minimum) in detectable amounts.
2.1. Measurements Performed with Biological Tissues
2.2. Measurements Performed with Phantom Materials
2.3. Measurements Performed with De-Ionized Water
2.4. Discussion
- temperature—much of the above research was conducted at standard laboratory temperature and there is little-to-no research available on the combined effect of temperature and glucose-level changes on the dielectric properties. Furthermore, the effect of temperature on various tissues is known to be frequency-dependent with complex behaviour [39];
- perfusion—the volume of blood in the measured region during the measurement period will obviously affect the data and this volume will change with temperature, pulse rate, activity level and clothing (for example, tight sleeves or watch bands can restrict the flow of blood);
- sensor positioning and motion—different locations on the body have been considered for sensor placement (such as the ear lobe, the wrist, the thumb and the torso, as discussed in Section 3.2 and Section 4), either for convenience of testing, comfort for continuous-monitoring scenarios, or for tissue properties at that location (e.g., the ear lobe has a relatively thin skin layer and no bone or muscle). Small motions of the test subject can induce errors in the measurement (e.g., introduction of a small air gap between sensor and skin), potentially even for static test scenarios. For the ideal of continuous monitoring, any sensor must be robust to motion-induced artefacts from small changes in sensor position, as well as related issues (e.g., activity level, contamination of the test site from sweat, dirt and other materials);
- other biological activity—tissues are dynamic inhomogeneous materials, with many bio-chemical and bio-physical process occurring. Examples that may affect the dielectric properties include (but are not limited to) changes in the levels of blood gases (particularly oxygen and carbon dioxide), urea, lactic acid (affected by activity level), as well as changes induced by injury or infection.
- stratum corneum (the outermost and driest layer);
- viable epidermis;
- dermis;
- subcutaneous fat layer.
3. Frequency of Choice
3.1. An Empirical Approach
3.2. Frequencies Employed in the Literature
3.3. Discussion
4. Utilized Microwave Resonators and Antennas
4.1. Antennas
4.2. Resonators
4.3. Discussion
5. Addressing the Selectivity Challenge
5.1. Multi-Parameter Sensing
- dielectric property monitoring using resonators optimised for three frequency ranges:
- two temperature sensors;
- one humidity sensor;
- an accelerometer (it is unclear how many axes);
- optical ‘diffuse reflectance’ sensors, to ‘monitor hemodynamic changes’ [65].
5.2. Case Study
5.3. Discussion
6. Conclusions
“…a reasonable chance at success requires in-depth knowledge of all the following disciplines:
Funding
Acknowledgments
Conflicts of Interest
References
- Diabetes: Key Facts—World Health Organization. Available online: http://www.who.int/news-room/fact-sheets/detail/diabetes (accessed on 15 October 2018).
- Bruen, D.; Delaney, C.; Florea, L.; Diamond, D. Glucose Sensing for Diabetes Monitoring: Recent Developments. Sensors 2017, 17, 1866. [Google Scholar] [CrossRef]
- Comer, J. Semiquantitative specific test paper for glucose in urine. Anal. Chem. 1956, 28, 1748–1750. [Google Scholar] [CrossRef]
- Yao, H.; Shum, A.J.; Cowan, M.; Lähdesmäki, I.; Parviz, B.A. A contact lens with embedded sensor for monitoring tear glucose level. Biosens. Bioelectron. 2011, 26, 3290–3296. [Google Scholar] [CrossRef]
- Galassetti, P.R.; Novak, B.; Nemet, D.; Rose-Gottron, C.; Cooper, D.M.; Meinardi, S.; Newcomb, R.; Zaldivar, F.; Blake, D.R. Breath ethanol and acetone as indicators of serum glucose levels: an initial report. Diabetes Technol. Ther. 2005, 7, 115–123. [Google Scholar] [CrossRef] [PubMed]
- Wang, C.; Sahay, P. Breath analysis using laser spectroscopic techniques: breath biomarkers, spectral fingerprints and detection limits. Sensors 2009, 9, 8230–8262. [Google Scholar] [CrossRef] [PubMed]
- Wang, C.; Mbi, A.; Shepherd, M. A study on breath acetone in diabetic patients using a cavity ringdown breath analyzer: Exploring correlations of breath acetone with blood glucose and glycohemoglobin A1C. IEEE Sens. J. 2010, 10, 54–63. [Google Scholar] [CrossRef]
- Todd, C.; Salvetti, P.; Naylor, K.; Albatat, M. Towards Non-Invasive Extraction and Determination of Blood Glucose Levels. Bioengineering 2017, 4, 82. [Google Scholar] [CrossRef]
- Waltz, E. Why Noviosense’s In-Eye Glucose Monitor Might Work Better Than Alphabet’s. Available online: https://spectrum.ieee.org/the-human-os/biomedical/devices/why-noviosenses-ineye-glucose-monitor-might-work-better-than-googles (accessed on 18 November 2018).
- Smith, J. The Pursuit of Noninvasive Glucose: “Hunting the Deceitful Turkey”, 6th ed.; 2018; Self-published; Available online: https://www.researchgate.net/publication/327101583_The_Pursuit_of_Noninvasive_Glucose_Hunting_the_Deceitful_Turkey_Sixth_Edition (accessed on 18 November 2018).
- ISO 15197:2013—In Vitro Diagnostic Test Systems—Requirements for Blood-Glucose Monitoring Systems for Self-Testing in Managing Diabetes Mellitus. Available online: https://www.iso.org/standard/54976.html (accessed on 19 November 2018).
- Gao, Y.; Ghasr, M.T.; Nacy, M.; Zoughi, R. Towards Accurate and Wideband In Vivo Measurement of Skin Dielectric Properties. IEEE Trans. Instrum. Meas. 2018, PP, 1–13. [Google Scholar] [CrossRef]
- Güren, O.; Çayören, M.; Ergene, L.T.; Akduman, I. Surface impedance based microwave imaging method for breast cancer screening: Contrast-enhanced scenario. Phys. Med. Biol. 2014, 59, 5725–5739. [Google Scholar] [CrossRef]
- Paglione, R.W. Coaxial Applicator for Microwave Hyperthermia. U.S. Patent 4,204,549, 27 May 1980. [Google Scholar]
- Hall, P.S.; Hao, Y. Antennas and Propagation for Body-Centric Wireless Networks, 1st ed.; Artech House: Norwood, MA, USA, 2006; ISBN 1-58053-493-7. [Google Scholar]
- Gabriel, C.; Gabriel, S.; Corthout, E. The dielectric properties of biological tissues: I. Literature survey. Phys. Med. Biol. 1996, 41, 2231–2249. [Google Scholar] [CrossRef]
- Gabriel, S.; Lau, R.; Gabriel, C. The dielectric properties of biological tissues: II. Measurements in the frequency range 10 Hz to 20 GHz. Phys. Med. Biol. 1996, 41, 2251–2269. [Google Scholar] [CrossRef]
- Gabriel, S.; Lau, R.; Gabriel, C. The dielectric properties of biological tissues: III. Parametric models for the dielectric spectrum of tissues. Phys. Med. Biol. 1996, 41, 2271–2293. [Google Scholar] [CrossRef] [PubMed]
- Lazebnik, M.; Popovic, D.; McCartney, L.; Watkins, C.B.; Lindstrom, M.J.; Harter, J.; Sewall, S.; Ogilvie, T.; Magliocco, A.; Breslin, T.M.; et al. A large-scale study of the ultrawideband microwave dielectric properties of normal, benign and malignant breast tissues obtained from cancer surgeries. Phys. Med. Biol. 2007, 52, 6093–6115. [Google Scholar] [CrossRef] [PubMed]
- Topsakal, E.; Karacolak, T.; Moreland, E.C. Glucose-dependent dielectric properties of blood plasma. In Proceedings of the IEEE 2011 XXXth URSI General Assembly and Scientific Symposium, Istanbul, Turkey, 13–20 August 2011; pp. 1–4. [Google Scholar]
- Keysight Technologies. Agilent 85070E Dielectric Probe Kit 200 MHz to 50 GHz. Available online: http://literature.cdn.keysight.com/litweb/pdf/5989-0222EN.pdf (accessed on 18 November 2018).
- Karacolak, T.; Moreland, E.C.; Topsakal, E. Cole—Cole model for glucose-dependent dielectric properties of blood plasma for continuous glucose monitoring. Microw. Opt. Technol. Lett. 2013, 55, 1160–1164. [Google Scholar] [CrossRef]
- Cole, K.S.; Cole, R.H. Dispersion and absorption in dielectrics I. Alternating current characteristics. J. Chem. Phys. 1941, 9, 341–351. [Google Scholar] [CrossRef]
- Venkataraman, J.; Freer, B. Feasibility of non-invasive blood glucose monitoring: In-vitro measurements and phantom models. In Proceedings of the 2011 IEEE International Symposium on Antennas and Propagation (APSURSI), Spokane, WA, USA, 3–8 July 2011; pp. 603–606. [Google Scholar]
- Philis-Tsimikas, A.; Chang, A.; Miller, L. Precision, accuracy and user acceptance of the OneTouch SelectSimple blood glucose monitoring system. J. Diabetes Sci. Technol. 2011, 5, 1602–1609. [Google Scholar] [CrossRef]
- Yilmaz, T.; Foster, R.; Hao, Y. Broadband tissue mimicking phantoms and a patch resonator for evaluating noninvasive monitoring of blood glucose levels. IEEE Trans. Antennas Propag. 2014, 62, 3064–3075. [Google Scholar] [CrossRef]
- Lazebnik, M.; Madsen, E.L.; Frank, G.R.; Hagness, S.C. Tissue-mimicking phantom materials for narrowband and ultrawideband microwave applications. Phys. Med. Biol. 2005, 50, 4245–4258. [Google Scholar] [CrossRef]
- Beam, K.; Venkataraman, J. Phantom models for in-vitro measurements of blood glucose. In Proceedings of the 2011 IEEE International Symposium on Antennas and Propagation (APSURSI), Spokane, WA, USA, 3–8 July 2011; pp. 1860–1862. [Google Scholar]
- Gund, A.; Lindqvist, S. Phantom Making and Modeling of Monopole Antennas in FD-TD for Breast Cancer Studies; Department of Signals and Systems, Chalmers University of Technology: Göteborg, Sweden, 2005. [Google Scholar]
- Yilmaz, T.; Foster, R.; Hao, Y. Towards accurate dielectric property retrieval of biological tissues for blood glucose monitoring. IEEE Trans. Microw. Theory Tech. 2014, 62, 3193–3204. [Google Scholar] [CrossRef]
- Yilmaz, T.; Hao, Y. Electrical property characterization of blood glucose for on-body sensors. In Proceedings of the 5th European Conference on Antennas and Propagation (EUCAP), Rome, Italy, 11–15 April 2011; pp. 3659–3662. [Google Scholar]
- Smulders, P.F.; Buysse, M.G.; Huang, M.D. Dielectric properties of glucose solutions in the 0.5–67 GHz range. Microw. Opt. Technol. Lett. 2013, 55, 1916–1917. [Google Scholar] [CrossRef]
- Turgul, V.; Kale, I. Permittivity extraction of glucose solutions through artificial neural networks and non-invasive microwave glucose sensing. Sens. Actuators A Phys. 2018, 277, 65–72. [Google Scholar] [CrossRef]
- Turgul, V.; Kale, I. On the accuracy of complex permittivity model of glucose/water solutions for non-invasive microwave blood glucose sensing. In Proceedings of the IEEE E-Health and Bioengineering Conference (EHB), Iasi, Romania, 19–21 November 2015; pp. 1–4. [Google Scholar]
- Turgul, V.; Kale, I. Characterization of the complex permittivity of glucose/water solutions for noninvasive RF/Microwave blood glucose sensing. In Proceedings of the 2016 IEEE International Instrumentation and Measurement Technology Conference Proceedings (I2MTC), Taipei, Taiwan, 23–26 May 2016; pp. 1–5. [Google Scholar]
- Medical Device Radiocommunications Service (MedRadio) | Federal Communications Commission. Available online: https://www.fcc.gov/medical-device-radiocommunications-service-medradio (accessed on 22 November 2018).
- Wireless Medical Telemetry Service (WMTS) | Federal Communications Commission. Available online: https://www.fcc.gov/wireless/bureau-divisions/mobility-division/wireless-medical-telemetry-service-wmts (accessed on 22 November 2018).
- Li, J.; Igbe, T.; Liu, Y.; Nie, Z.; Qin, W.; Wang, L.; Hao, Y. An Approach for Noninvasive Blood Glucose Monitoring Based on Bioimpedance Difference Considering Blood Volume Pulsation. IEEE Access 2018, 6, 51119–51129. [Google Scholar] [CrossRef]
- Vander Vorst, A.; Rosen, A.; Kotsuka, Y. RF/Microwave Interaction with Biological Tissues; John Wiley & Sons, Inc.: Hoboken, NJ, USA, 2005. [Google Scholar]
- Yilmaz, T. Wearable RF Sensors for Non-Invasive Detection of Blood-Glucose Levels. Ph.D. Thesis, Queen Mary, University of London, London, UK, 2013. [Google Scholar]
- Turgul, V.; Kale, I. Influence of fingerprints and finger positioning on accuracy of RF blood glucose measurement from fingertips. Electron. Lett. 2017, 53, 218–220. [Google Scholar] [CrossRef]
- Turgul, V.; Kale, I. Simulating the Effects of Skin Thickness and Fingerprints to Highlight Problems With Non-Invasive RF Blood Glucose Sensing from Fingertips. IEEE Sens. J. 2017, 17, 7553–7560. [Google Scholar] [CrossRef]
- Yilmaz, T.; Foster, R.; Hao, Y. Patch resonator for non-invasive detection of dielectric property changes in biological tissues. In Proceedings of the IEEE Antennas and Propagation Society International Symposium (APSURSI), Chicago, IL, USA, 8–14 July 2012; pp. 1–2. [Google Scholar]
- Jepsen, P.U.; Møller, U.; Merbold, H. Investigation of aqueous alcohol and sugar solutions with reflection terahertz time-domain spectroscopy. Opt. Express 2007, 15, 14717–14737. [Google Scholar] [CrossRef] [PubMed]
- Tarr, R.V.; Steffes, P.G. Non-Invasive Blood Glucose Measurement System and Method Using Stimulated Raman Spectroscopy. US Patent 5,243,983, 14 September 1993. [Google Scholar]
- Psychoudakis, D.; Chen, C.C.; Lee, G.Y.; Volakis, J.L. Epidermal Sensor Paradigm: Inner Layer Tissue Monitoring. In Handbook of Biomedical Telemetry; John Wiley & Sons, Inc.: Hoboken, NJ, USA, 2014; Chapter 18; pp. 525–548. [Google Scholar]
- Yilmaz, T.; Kılıç, M.A.; Erdoğan, M.; Çayören, M.; Tunaoğlu, D.; Kurtoğlu, İ.; Yaslan, Y.; Çayören, H.; Arıkan, A.E.; Teksöz, S.; et al. Machine learning aided diagnosis of hepatic malignancies through in vivo dielectric measurements with microwaves. Phys. Med. Biol. 2016, 61, 5089–5102. [Google Scholar] [CrossRef] [PubMed]
- Freer, B.; Venkataraman, J. Feasibility study for non-invasive blood glucose monitoring. In Proceedings of the 2010 IEEE Antennas and Propagation Society International Symposium (APSURSI), Toronto, ON, Canada, 11–17 July 2010; pp. 1–4. [Google Scholar]
- Turgul, V.; Kale, I. A novel pressure sensing circuit for non-invasive RF/microwave blood glucose sensors. In Proceedings of the 2016 IEEE 16th Mediterranean Microwave Symposium (MMS), Abu Dhabi, UAE, 14–16 November 2016; pp. 1–4. [Google Scholar]
- Yilmaz, T.; Ozturk, T.; Joof, S. A Comparative Study for Development of Microwave Glucose Sensors. In Proceedings of the 32nd URSI GASS, Montreal, QC, Canada, 19–26 August 2017; pp. 1–4. [Google Scholar]
- Choi, H.; Naylon, J.; Luzio, S.; Beutler, J.; Birchall, J.; Martin, C.; Porch, A. Design and in vitro interference test of microwave noninvasive blood glucose monitoring sensor. IEEE Trans. Microw. Theory Tech. 2015, 63, 3016–3025. [Google Scholar] [CrossRef]
- Choi, H.; Luzio, S.; Beutler, J.; Porch, A. Microwave noninvasive blood glucose monitoring sensor: Human clinical trial results. In Proceedings of the 2017 IEEE MTT-S International Microwave Symposium (IMS), Honololu, HI, USA, 4–9 June 2017; pp. 876–879. [Google Scholar]
- Adhikari, K.K.; Kim, N.Y. Ultrahigh-sensitivity mediator-free biosensor based on a microfabricated microwave resonator for the detection of micromolar glucose concentrations. IEEE Trans. Microw. Theory Tech. 2016, 64, 319–327. [Google Scholar] [CrossRef]
- Huang, S.Y.; Yoshida, Y.; Garcia, A.; Chia, X.; Mu, W.C.; Meng, Y.S.; Yu, W. Microstrip Line-based Glucose Sensor for Noninvasive Continuous Monitoring using the Main Field for Sensing and Multivariable Crosschecking. IEEE Sens. J. 2018. [Google Scholar] [CrossRef]
- Juan, C.G.; Bronchalo, E.; Potelon, B.; Quendo, C.; Ávila-Navarro, E.; Sabater-Navarro, J.M. Concentration Measurement of Microliter-Volume water–Glucose Solutions Using Q Factor of Microwave Sensors. IEEE Trans. Instrum. Meas. 2018, 1–14. [Google Scholar] [CrossRef]
- Melikyan, H.; Danielyan, E.; Kim, S.; Kim, J.; Babajanyan, A.; Lee, J.; Friedman, B.; Lee, K. Non-invasive in vitro sensing of d-glucose in pig blood. Med. Eng. Phys. 2012, 34, 299–304. [Google Scholar] [CrossRef] [PubMed]
- Vrba, J.; Vrba, D. A Microwave Metamaterial Inspired Sensor for Non-Invasive Blood Glucose Monitoring. Radioengineering 2015, 24. [Google Scholar] [CrossRef]
- Cano-Garcia, H.; Saha, S.; Sotiriou, I.; Kosmas, P.; Gouzouasis, I.; Kallos, E. Millimeter-Wave Sensing of Diabetes-Relevant Glucose Concentration Changes in Pigs. J. Infrared Millim. Terahertz Waves 2018, 39, 761–772. [Google Scholar] [CrossRef]
- Saha, S.; Cano-Garcia, H.; Sotiriou, I.; Lipscombe, O.; Gouzouasis, I.; Koutsoupidou, M.; Palikaras, G.; Mackenzie, R.; Reeve, T.; Kosmas, P.; et al. A Glucose Sensing System Based on Transmission Measurements at Millimetre Waves using Micro strip Patch Antennas. Sci. Rep. 2017, 7, 6855. [Google Scholar] [CrossRef] [PubMed]
- Lee, D.K.; Kang, J.H.; Lee, J.S.; Kim, H.S.; Kim, C.; Hun Kim, J.; Lee, T.; Son, J.H.; Park, Q.H.; Seo, M. Highly sensitive and selective sugar detection by terahertz nano-antennas. Sci. Rep. 2015, 5, 15459. [Google Scholar] [CrossRef]
- Vrba, J.; Karch, J.; Vrba, D. Phantoms for development of microwave sensors for noninvasive blood glucose monitoring. Int. J. Antennas Propag. 2015, 2015, 570870. [Google Scholar] [CrossRef]
- Turgul, V.; Kale, I. Sensitivity of non-invasive RF/microwave glucose sensors and fundamental factors and challenges affecting measurement accuracy. In Proceedings of the 2018 IEEE International Instrumentation and Measurement Technology Conference (I2MTC), Houston, TX, USA, 14–17 May 2018; pp. 1–5. [Google Scholar]
- Buford, R.J.; Green, E.C.; McClung, M.J. A microwave frequency sensor for non-invasive blood-glucose measurement. In Proceedings of the 2008 IEEE Sensors Applications Symposium (SAS), Atlanta, GA, USA, 12–14 February 2008; pp. 4–7. [Google Scholar]
- Kim, N.Y.; Adhikari, K.K.; Dhakal, R.; Chuluunbaatar, Z.; Wang, C.; Kim, E.S. Rapid, sensitive and reusable detection of glucose by a robust radiofrequency integrated passive device biosensor chip. Sci. Rep. 2015, 5, 7807. [Google Scholar] [CrossRef]
- Caduff, A.; Zanon, M.; Zakharov, P.; Mueller, M.; Talary, M.; Krebs, A.; Stahel, W.A.; Donath, M. First Experiences With a Wearable Multisensor in an Outpatient Glucose Monitoring Study, Part I: The Users’ View. J. Diabetes Sci. Technol. 2018, 12, 562–568. [Google Scholar] [CrossRef]
- Zanon, M.; Mueller, M.; Zakharov, P.; Talary, M.S.; Donath, M.; Stahel, W.A.; Caduff, A. First Experiences With a Wearable Multisensor Device in a Noninvasive Continuous Glucose Monitoring Study at Home, Part II: The Investigators’ View. J. Diabetes Sci. Technol. 2018, 12, 554–561. [Google Scholar] [CrossRef]
- Hao, Y.; Foster, R. Wireless body sensor networks for health-monitoring applications. Physiol. Meas. 2008, 29, R27–R56. [Google Scholar] [CrossRef]
- Yilmaz, T.; Foster, R.; Hao, Y. Detecting Vital Signs with Wearable Wireless Sensors. Sensors 2010, 10, 10837–10862. [Google Scholar] [CrossRef] [PubMed]
- Caduff, A.; Hirt, E.; Feldman, Y.; Ali, Z.; Heinemann, L. First human experiments with a novel non-invasive, non-optical continuous glucose monitoring system. Biosens. Bioelectron. 2003, 19, 209–217. [Google Scholar] [CrossRef]
- Pfützner, A.; Caduff, A.; Larbig, M.; Schrepfer, T.; Forst, T. Impact of posture and fixation technique on impedance spectroscopy used for continuous and noninvasive glucose monitoring. Diabetes Technol. Ther. 2004, 6, 435–441. [Google Scholar] [CrossRef] [PubMed]
- Caduff, A.; Dewarrat, F.; Talary, M.; Stalder, G.; Heinemann, L.; Feldman, Y. Non-invasive glucose monitoring in patients with diabetes: A novel system based on impedance spectroscopy. Biosens. Bioelectron. 2006, 22, 598–604. [Google Scholar] [CrossRef] [PubMed]
- Caduff, A.; Talary, M.S.; Mueller, M.; Dewarrat, F.; Klisic, J.; Donath, M.; Heinemann, L.; Stahel, W.A. Non-invasive glucose monitoring in patients with Type 1 diabetes: A Multisensor system combining sensors for dielectric and optical characterisation of skin. Biosens. Bioelectron. 2009, 24, 2778–2784. [Google Scholar] [CrossRef] [PubMed]
- Caduff, A.; Zanon, M.; Mueller, M.; Zakharov, P.; Feldman, Y.; De Feo, O.; Donath, M.; Stahel, W.A.; Talary, M.S. The Effect of a Global, Subject and Device-Specific Model on a Noninvasive Glucose Monitoring Multisensor System. J. Diabetes Sci. Technol. 2015, 9, 865–872. [Google Scholar] [CrossRef]
- Caduff, A.; Talary, M.S.; Müller, M.; De Feo, O. Wide Band Field Response Measurement for Glucose Determination. U.S. Patent NO. 9,247,905 B2, 2 February 2016. United States Patent Document, Available from the United States Patent and Trademark Office. Available online: www.uspto.gov (accessed on 22 November 2018).
- Mueller, M.; Talary, M.S.; Falco, L.; De Feo, O.; Stahel, W.A.; Caduff, A. Data Processing for Noninvasive Continuous Glucose Monitoring with a Multisensor Device. J. Diabetes Sci. Technol. 2011, 5, 694–702. [Google Scholar] [CrossRef]
- Thinfilm Force Sensors. Available online: https://www.tekscan.com/force-sensors (accessed on 28 December 2018).
- Williams, R.; Quattrocchi, E.; Watts, S.; Wang, S.; Berry, P.; Crouthamel, M. Patient Rheumatoid Arthritis Data from the Real World (PARADE) Study: Preliminary Results from an Apple Researchkit™ Mobile App-Based Real World Study in the United States. Arthritis Rheumatol. 2017, 69, 223–224. [Google Scholar]
- Chan, Y.F.Y.; Wang, P.; Rogers, L.; Tignor, N.; Zweig, M.; Hershman, S.G.; Genes, N.; Scott, E.R.; Krock, E.; Badgeley, M.; et al. The Asthma Mobile Health Study, a large-scale clinical observational study using ResearchKit. Nat. Biotechnol. 2017, 35, 354–362. [Google Scholar] [CrossRef]
- Cadmus-Bertram, L. Using Fitness Trackers in Clinical Research: What Nurse Practitioners Need to Know. J. Nurse Pract. 2017, 13, 34–40. [Google Scholar] [CrossRef]
- Alinia, P.; Cain, C.; Fallahzadeh, R.; Shahrokni, A.; Cook, D.; Ghasemzadeh, H. How Accurate Is Your Activity Tracker? A Comparative Study of Step Counts in Low-Intensity Physical Activities. JMIR mHealth uHealth 2017, 5, e106. [Google Scholar] [CrossRef] [PubMed]
- Xie, J.; Wen, D.; Liang, L.; Jia, Y.; Gao, L.; Lei, J. Evaluating the Validity of Current Mainstream Wearable Devices in Fitness Tracking Under Various Physical Activities: Comparative Study. JMIR mHealth uHealth 2018, 6, e94. [Google Scholar] [CrossRef] [PubMed]
- Fioravanti, A.; Fico, G.; Patón, A.G.; Leuteritz, J.P.; Arredondo, A.G.; Waldmeyer, M.T.A. Health-Integrated System Paradigm: Diabetes Management. In Handbook of Biomedical Telemetry; John Wiley & Sons, Inc.: Hoboken, NJ, USA, 2014; Chapter 22; pp. 623–632. [Google Scholar]
- Fico, G.; Fioravanti, A.; Arredondo, M.T.; Leuteritz, J.P.; Guillen, A.; Fernandez, D. A user centered design approach for patient interfaces to a diabetes IT platform. In Proceedings of the IEEE 2011 Annual International Conference of the IEEE Engineering in Medicine and Biology Society, Boston, MA, USA, 30 August–3 September 2011; pp. 1169–1172. [Google Scholar]
- Fioravanti, A.; Fico, G.; Arredondo, M.T.; Leuteritz, J. A mobile feedback system for integrated E-health platforms to improve self-care and compliance of diabetes mellitus patients. In Proceedings of the 2011 Annual International Conference of the IEEE Engineering in Medicine and Biology Society, Boston, MA, USA, 30 August–3 September 2011; pp. 3550–3553. [Google Scholar]
- Otis, B. Verily Blog: Update on Our Smart Lens Program with Alcon. Available online: https://blog.verily.com/2018/11/update-on-our-smart-lens-program-with.html?m=1 (accessed on 18 November 2018).
- Kownacka, A.E.; Vegelyte, D.; Joosse, M.; Anton, N.; Toebes, B.J.; Lauko, J.; Buzzacchera, I.; Lipinska, K.; Wilson, D.A.; Geelhoed-Duijvestijn, N.; et al. Clinical Evidence for Use of a Noninvasive Biosensor for Tear Glucose as an Alternative to Painful Finger-Prick for Diabetes Management Utilizing a Biopolymer Coating. Biomacromolecules 2018, 19, 4504–4511. [Google Scholar] [CrossRef] [PubMed]


| Ingredient (g) | Wet Skin | Fat | Blood | Muscle |
|---|---|---|---|---|
| Deionized Water | 230.0 | 57.4 | 230.0 | 230.0 |
| Gelatine | 34.1 | 15.0 | 34.1 | 34.1 |
| NaCl | 1.4 | 0.0 | 1.2 | 1.2 |
| Oil | 75.0 | 329.6 | 15.0 | 35.0 |
| detergent | 40.0 | 0.0 | 40.0 | 40.0 |
| detergent | 0.0 | 10.0 | 0.0 | 0.0 |
| food colouring | 1.3 | 0.0 | 0.0 | 1.3 |
| u | |||
|---|---|---|---|
| −8.214 × 10 | 2.148 × 10 | 8.722 | |
| 2.318 × 10 | −2.793 × 10 | 81.015 | |
| −8.370 × 10 | 5.150 × 10 | 8.776 |
| Glucose | Frequency | ||||
|---|---|---|---|---|---|
| Concentration | (GHz) | BP | d-water | BP [22] | d-water [33] |
| (mg/dL) | (S/m) | (S/m) | |||
| 72 | 0.50 | 72.75 | 80.94 | 2.065 | 5.55 × 10 |
| 219 | 72.73 | 80.9 | 2.046 | 5.57 × 10 | |
| 330 | 72.71 | 80.87 | 2.030 | 5.58 × 10 | |
| 600 | 72.66 | 80.79 | 1.995 | 5.62 × 10 | |
| 72 | 2.50 | 69.74 | 79.64 | 3.498 | 13.62 × 10 |
| 219 | 69.70 | 79.58 | 3.482 | 13.67 × 10 | |
| 330 | 69.67 | 79.54 | 3.470 | 13.70 × 10 | |
| 600 | 69.59 | 79.43 | 3.441 | 13.78 × 10 | |
| 72 | 5.00 | 64.62 | 75.86 | 7.078 | 51.59 × 10 |
| 219 | 64.56 | 75.76 | 7.069 | 51.71 × 10 | |
| 330 | 64.51 | 75.69 | 7.062 | 51.80 × 10 | |
| 600 | 64.39 | 75.51 | 7.046 | 52.01 × 10 | |
| 72 | 10.00 | 53.24 | 64.07 | 16.91 | 17.00 |
| 219 | 53.14 | 63.90 | 16.91 | 17.00 | |
| 330 | 53.07 | 63.76 | 16.91 | 16.99 | |
| 600 | 52.88 | 63.44 | 16.90 | 16.97 |
| Dextrose Levels (mg/dL) | S Response (dB) at 2.45 GHz | S Response (dB) at 5.8 GHz |
|---|---|---|
| 0 | ||
| 200 | ||
| 400 | ||
| 600 |
| Subject | BMI | Subject | BMI |
|---|---|---|---|
| Force | Female | Female | Female | Female | Male |
|---|---|---|---|---|---|
| (V) | (MHz) | (MHz) | (MHz) | (MHz) | (MHz) |
| 1 | |||||
| 2 |
© 2019 by the authors. Licensee MDPI, Basel, Switzerland. This article is an open access article distributed under the terms and conditions of the Creative Commons Attribution (CC BY) license (http://creativecommons.org/licenses/by/4.0/).
Share and Cite
Yilmaz, T.; Foster, R.; Hao, Y. Radio-Frequency and Microwave Techniques for Non-Invasive Measurement of Blood Glucose Levels. Diagnostics 2019, 9, 6. https://doi.org/10.3390/diagnostics9010006
Yilmaz T, Foster R, Hao Y. Radio-Frequency and Microwave Techniques for Non-Invasive Measurement of Blood Glucose Levels. Diagnostics. 2019; 9(1):6. https://doi.org/10.3390/diagnostics9010006
Chicago/Turabian StyleYilmaz, Tuba, Robert Foster, and Yang Hao. 2019. "Radio-Frequency and Microwave Techniques for Non-Invasive Measurement of Blood Glucose Levels" Diagnostics 9, no. 1: 6. https://doi.org/10.3390/diagnostics9010006
APA StyleYilmaz, T., Foster, R., & Hao, Y. (2019). Radio-Frequency and Microwave Techniques for Non-Invasive Measurement of Blood Glucose Levels. Diagnostics, 9(1), 6. https://doi.org/10.3390/diagnostics9010006