A Preliminary Study of Contrast-Enhanced Ultrasound (CEUS) and Cytokine Expression Analysis (CEA) as Early Predictors for the Outcome of Tibial Non-Union Therapy

 , ,
, ,
Abstract
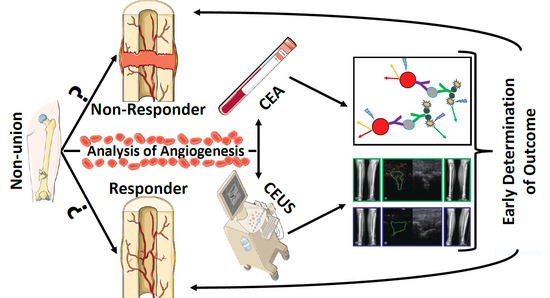
1. Introduction
2. Materials and Methods
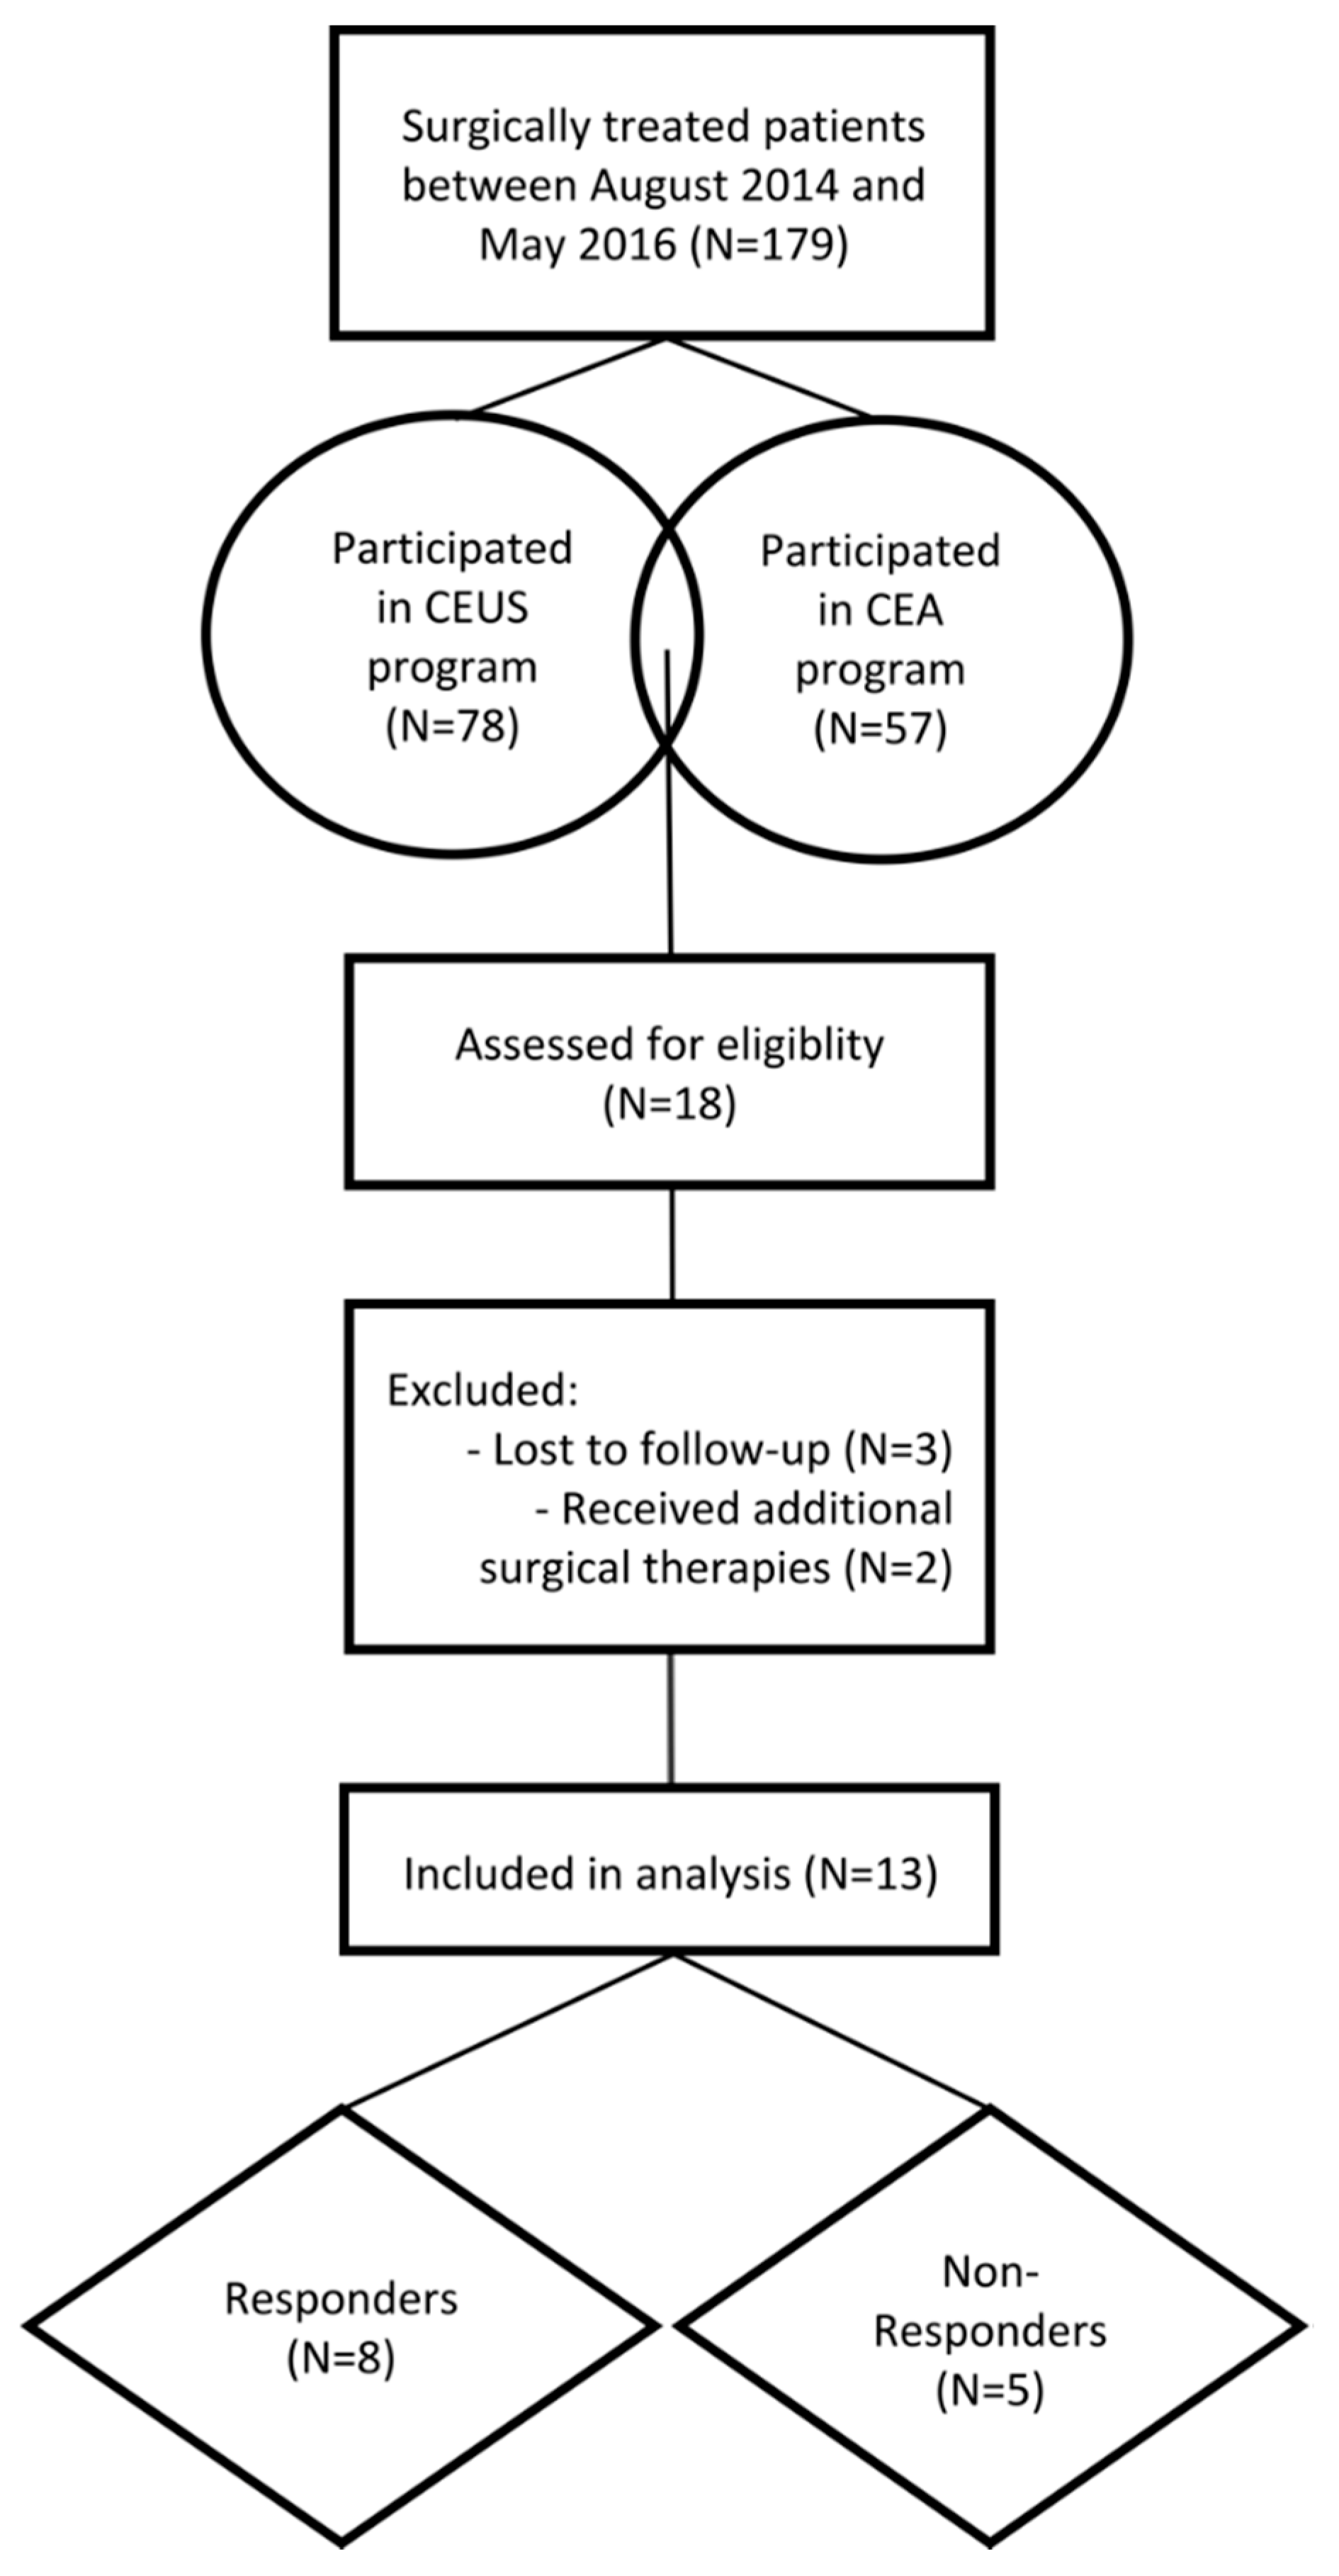
2.1. Study Design and Patient Selection Process
2.2. Inclusion and Exclusion Criteria
2.3. Intervention
2.4. Analysis of the Cytokine Expression Pattern
2.5. Contrast-Enhanced Ultrasound Examinations and Analysis
- Wash-in Rate (WiR in arbitrary units (a.u.), i.e., the maximum slope of the signal enhancement curve),
- Peak Enhancement (PE (a.u.), i.e., the maximum signal intensity of the enhancement curve),
- Rise Time (RT (s), i.e., the time a signal takes from baseline level to peak enhancement),
- Time to Peak (TTP (s), i.e., the duration from SonoVue® application to Peak Enhancement).
2.6. Evaluation of Outcome
2.7. Mathematical Modelling Process
- Estimation of the mean of each variables’ subgroup of non-consolidation and consolidation,
- If the mean of the non-consolidation was higher than in the consolidation group, the variables values were added to those of the variable characterized by the lowest p-value, while if the non-consolidation was lower than in the consolidation group values were subtracted from those of the variables mentioned above.
2.8. Statistics
3. Results
3.1. Patient Demographics
3.1.1. Responders (G1)
3.1.2. Non-Responders (G2)
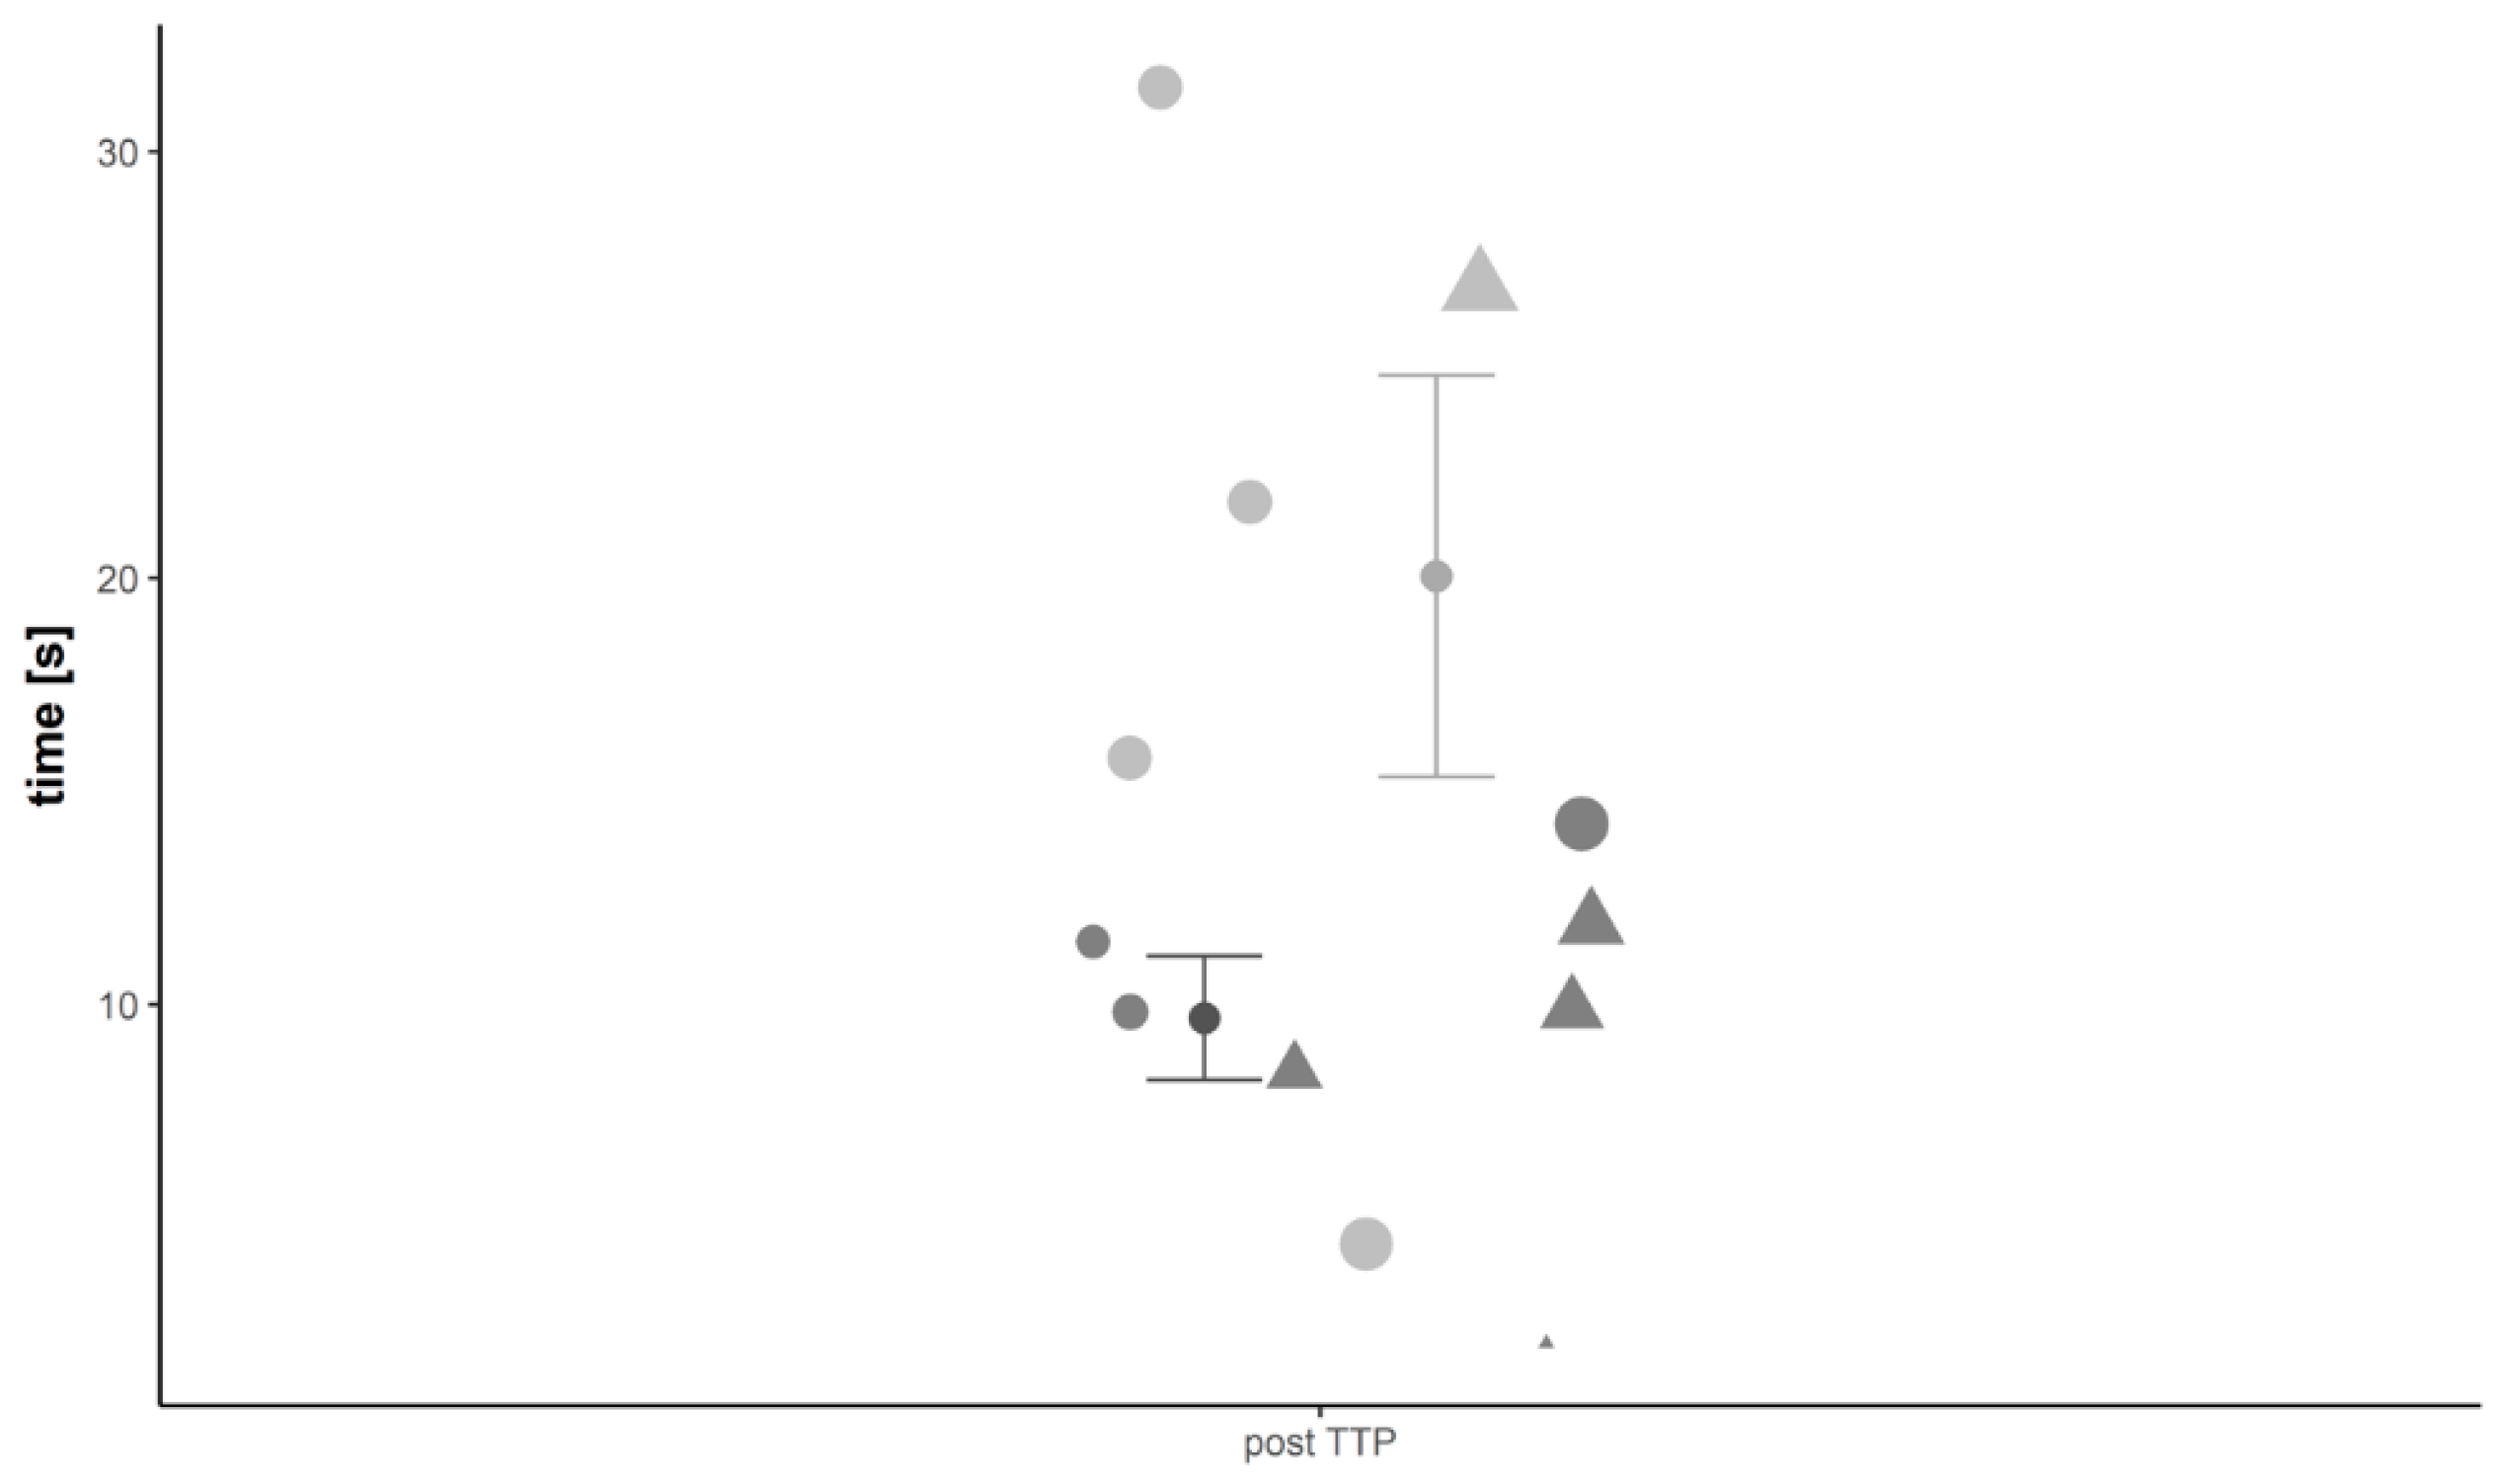
3.2. Contrast-Enhanced Ultrasound
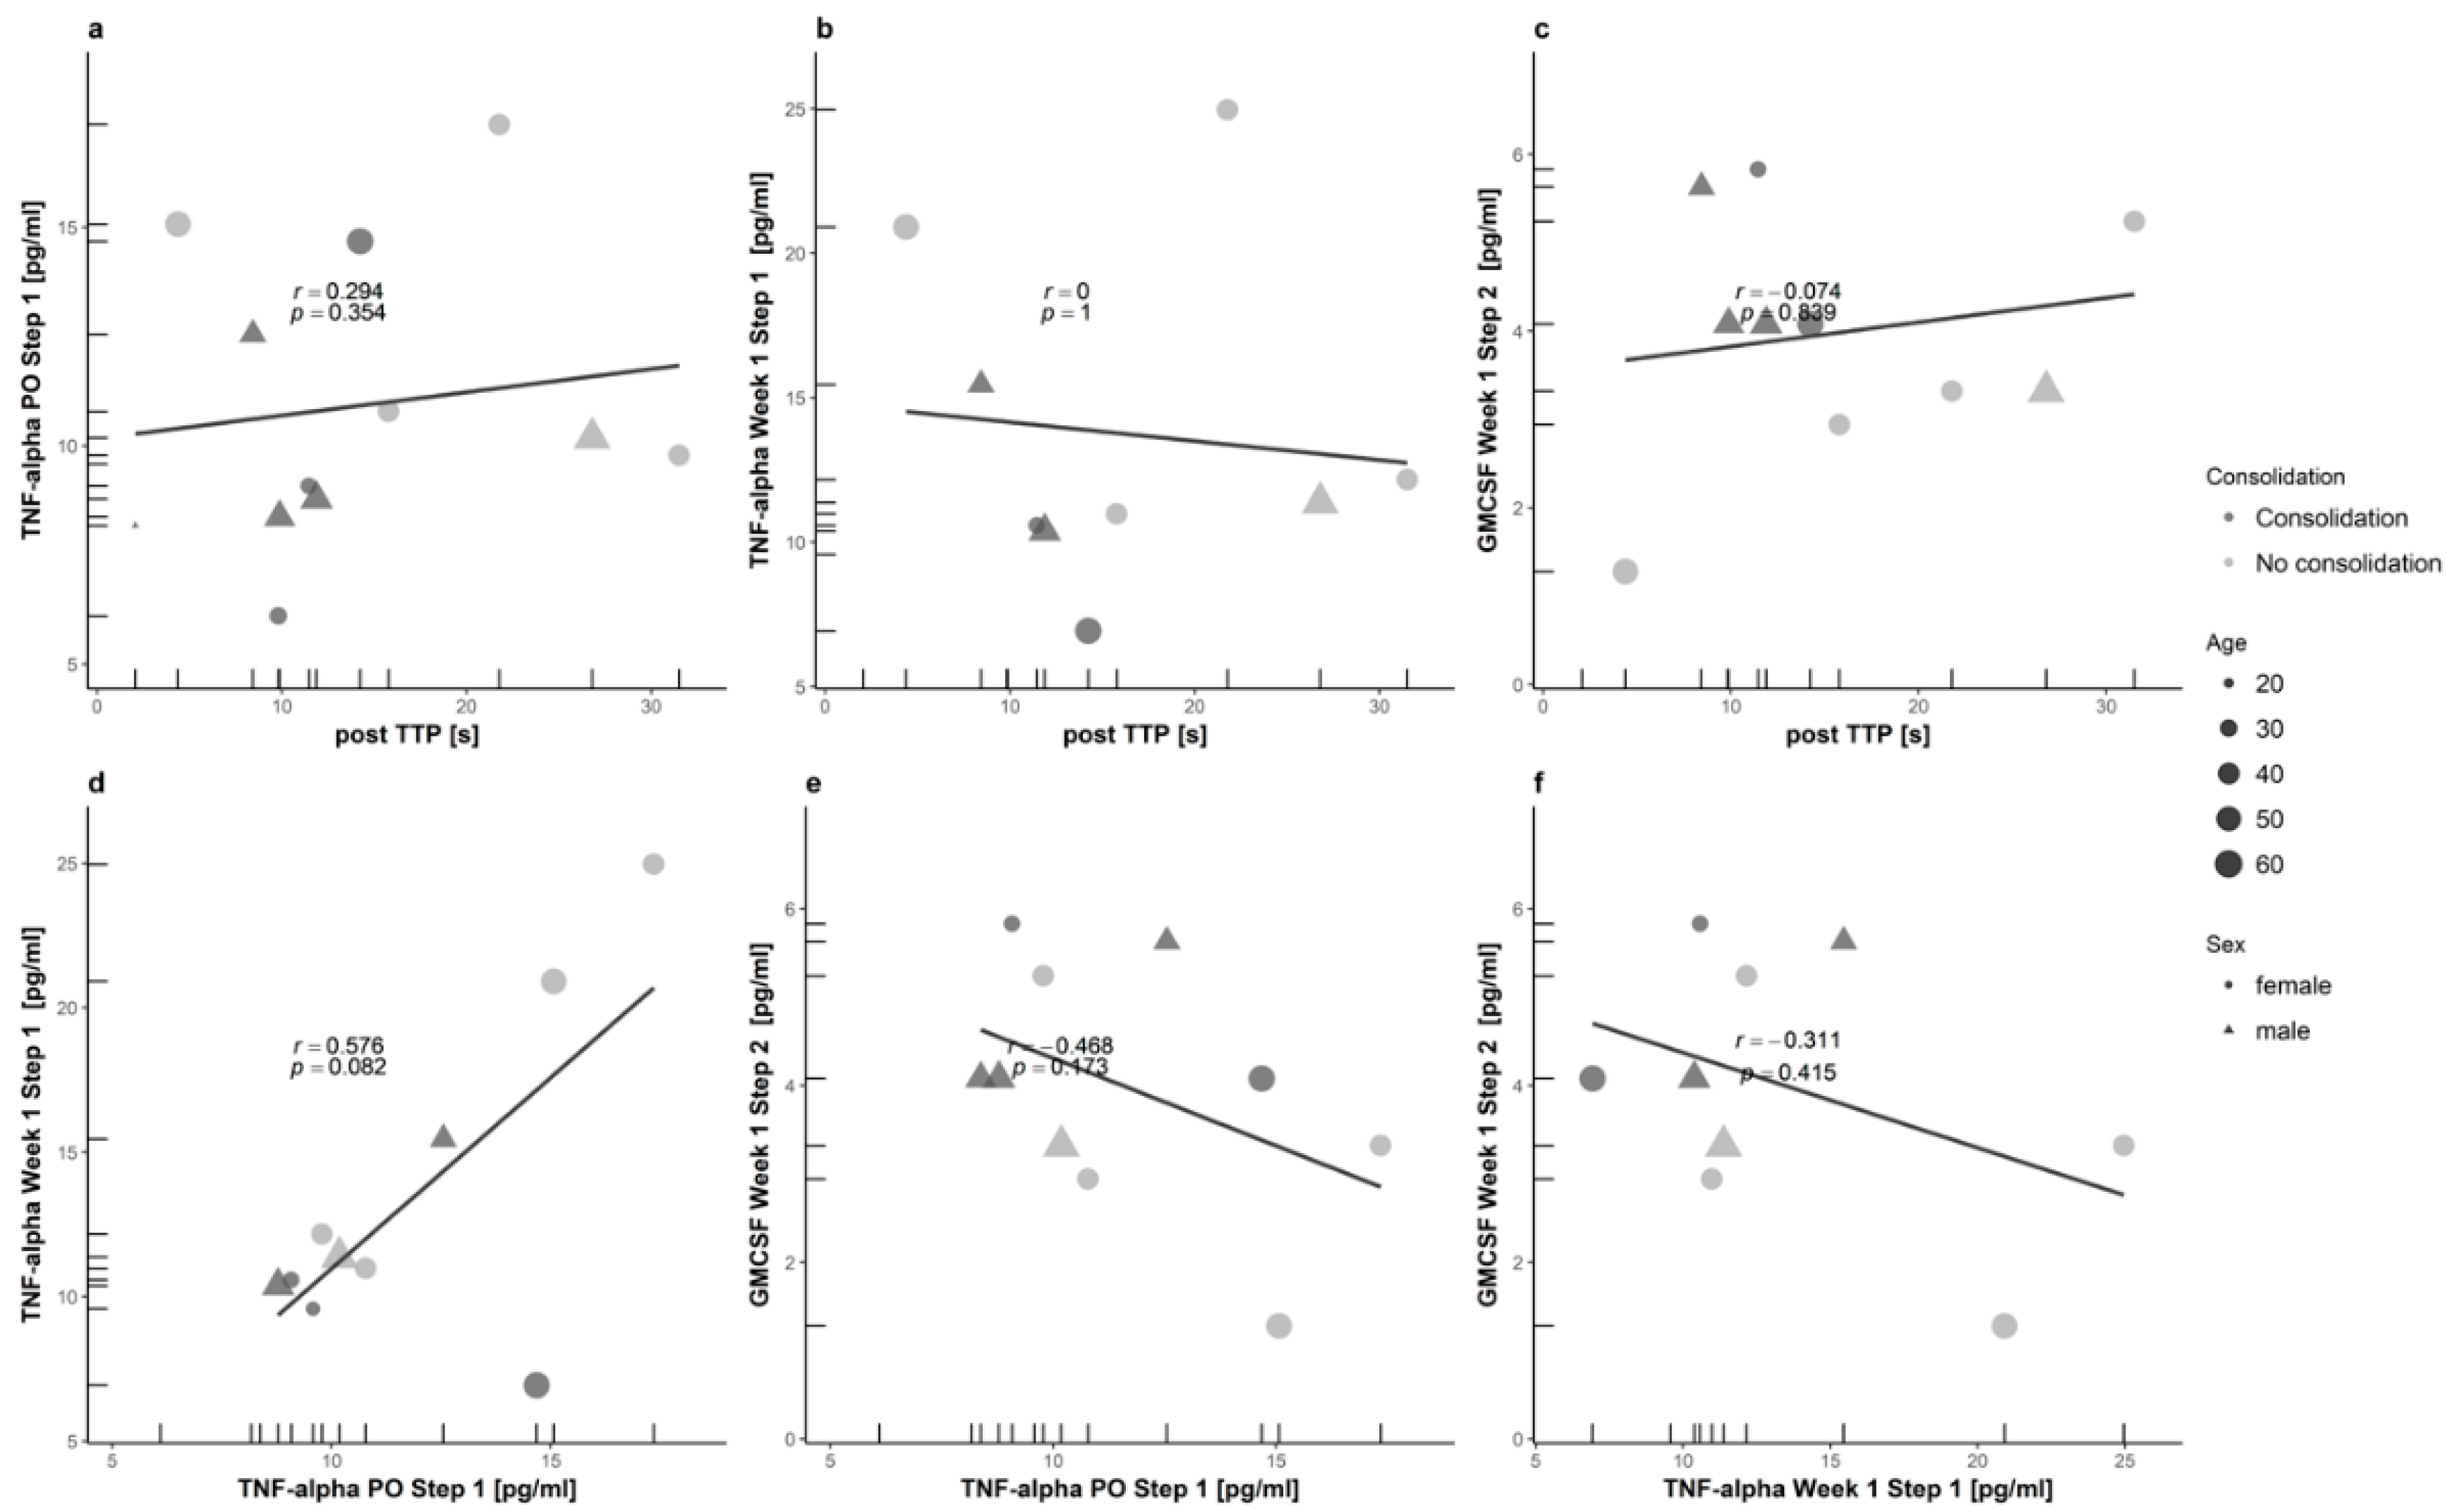
3.3. Serum Cytokine Expression Analysis
3.4. Variable Selection and Computation
- (A)
- CEUS-01 = (postTTP)
- (B)
- Cytokines-01 = (TNF.α.PO.Step.1)
- (C)
- Cytokines-02 = (TNF.α.Week.1.Step.1)
- (D)
- Cytokines-03 = (GM.CSF.Week.1.Step.2)
- (1)
- (CEUS variable) = ((A))
- (2)
- (Cytokines variable) = ((B)) + ((C)) – ((D))
- (3)
- (Together) = ((1)) + ((2))
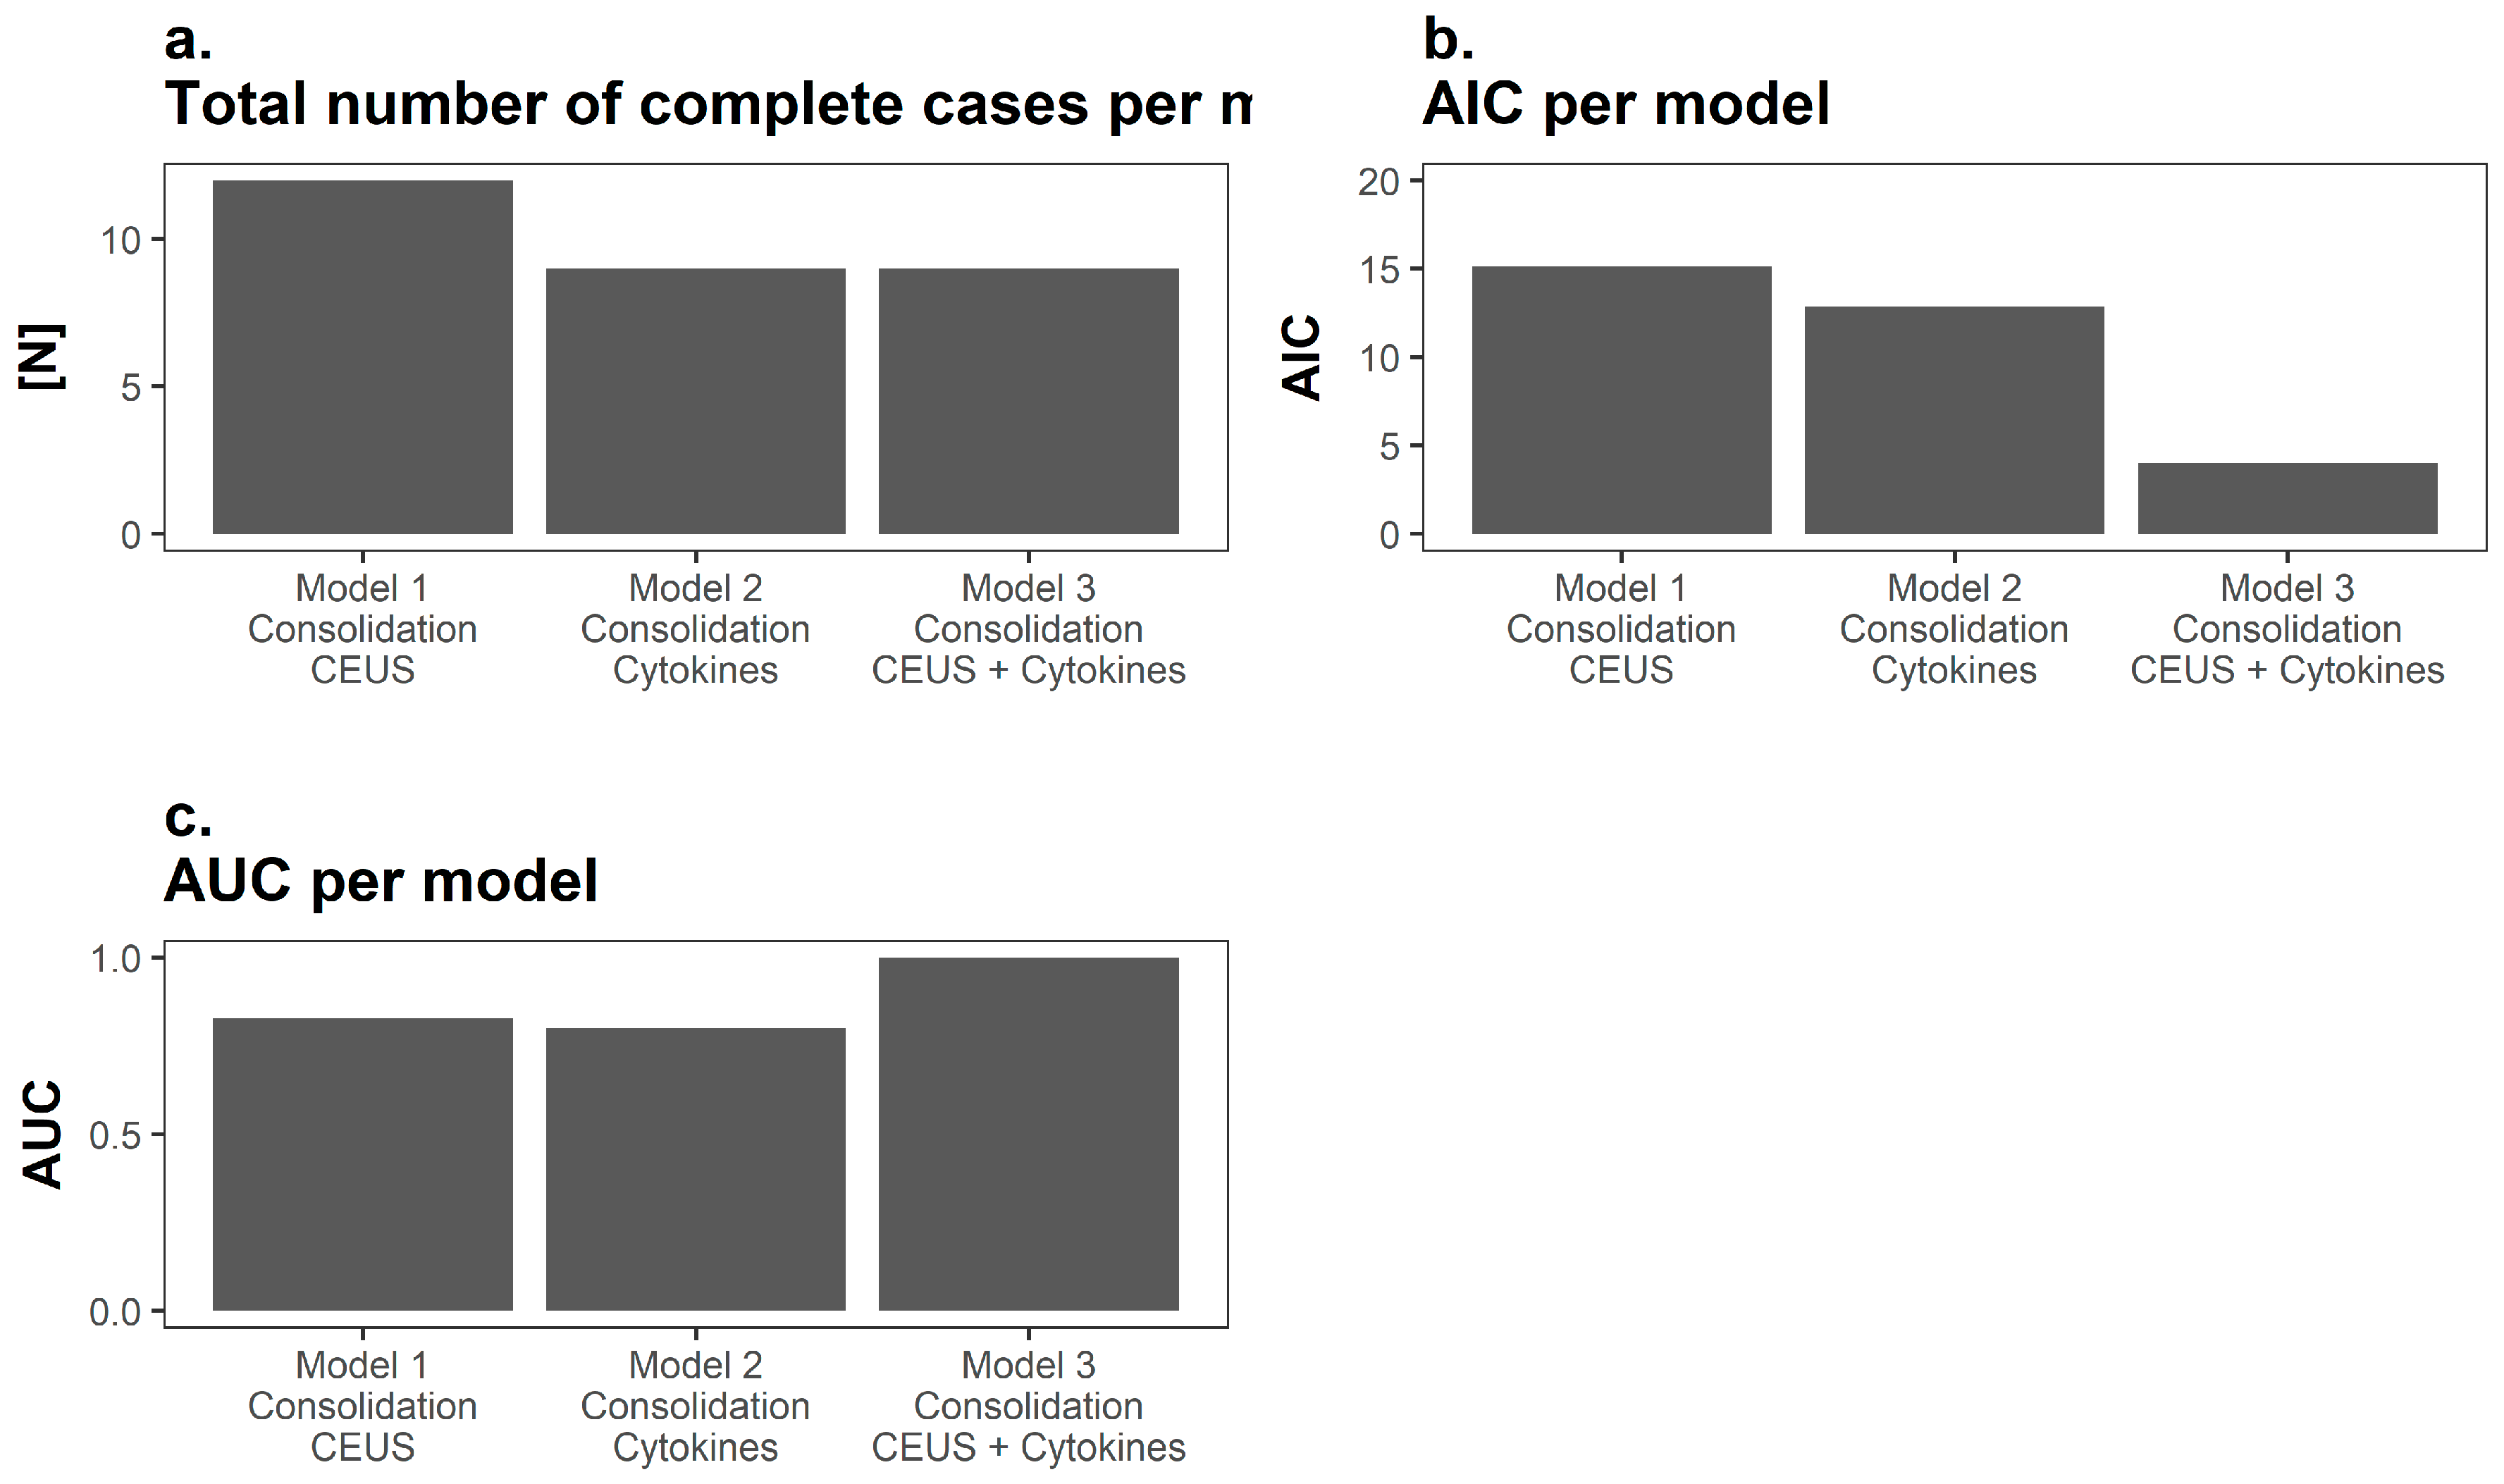
3.5. Analysis of the Prognostic Performance
4. Discussion
Limitation
5. Conclusions
Author Contributions
Funding
Acknowledgments
Conflicts of Interest
References
- Schmidmaier, G.; Moghaddam, A. Long bone nonunion. Zeitschrift fur Orthopadie und Unfallchirurgie 2015, 153, 659–674. [Google Scholar] [PubMed]
- Moghaddam, A.; Breier, L.; Haubruck, P.; Bender, D.; Biglari, B.; Wentzensen, A.; Zimmermann, G. Non-unions treated with bone morphogenic protein 7: Introducing the quantitative measurement of human serum cytokine levels as promising tool in evaluation of adjunct non-union therapy. J. Inflamm. 2016, 13, 3. [Google Scholar] [CrossRef] [PubMed]
- Brinker, M.R.; Hanus, B.D.; Sen, M.; O’Connor, D.P. The devastating effects of tibial nonunion on health-related quality of life. J. Bone Jt. Surg. 2013, 95, 2170–2176. [Google Scholar] [CrossRef] [PubMed]
- Giannoudis, P.V.; Einhorn, T.A.; Marsh, D. Fracture healing: The diamond concept. Injury 2007, 38, S3–S6. [Google Scholar] [CrossRef]
- Calori, G.M.; Giannoudis, P.V. Enhancement of fracture healing with the diamond concept: The role of the biological chamber. Injury 2011, 42, 1191–1193. [Google Scholar] [CrossRef] [PubMed]
- Moghaddam, A.; Zietzschmann, S.; Bruckner, T.; Schmidmaier, G. Treatment of atrophic tibia non-unions according to ‘diamond concept’: Results of one- and two-step treatment. Injury 2015, 46, S39–S50. [Google Scholar] [CrossRef]
- Masquelet, A.C.; Begue, T. The concept of induced membrane for reconstruction of long bone defects. Orthoped. Clin. N. Am. 2010, 41, 27–37. [Google Scholar] [CrossRef] [PubMed]
- Yin, P.; Ji, Q.; Li, T.; Li, J.; Li, Z.; Liu, J.; Wang, G.; Wang, S.; Zhang, L.; Mao, Z.; et al. A systematic review and meta-analysis of ilizarov methods in the treatment of infected nonunion of tibia and femur. PLoS ONE 2015, 10, e0141973. [Google Scholar] [CrossRef] [PubMed]
- Fischer, C.; Nissen, M.; Schmidmaier, G.; Bruckner, T.; Kauczor, H.U.; Weber, M.A. Dynamic contrast-enhanced magnetic resonance imaging (dce-mri) for the prediction of non-union consolidation. Injury 2017, 48, 357–363. [Google Scholar] [CrossRef] [PubMed]
- Piscaglia, F.; Bolondi, L.; Italian Society for Ultrasound in Medicine and Biology Study Group on Ultrasound Contrast Agents. The safety of sonovue in abdominal applications: Retrospective analysis of 23,188 investigations. Ultrasound Med. Biol. 2006, 32, 1369–1375. [Google Scholar] [CrossRef] [PubMed]
- Fischer, C.; Preuss, E.M.; Tanner, M.; Bruckner, T.; Krix, M.; Amarteifio, E.; Miska, M.; Moghaddam-Alvandi, A.; Schmidmaier, G.; Weber, M.A. Dynamic contrast-enhanced sonography and dynamic contrast-enhanced magnetic resonance imaging for preoperative diagnosis of infected nonunions. J. Ultrasound Med. 2016, 35, 933–942. [Google Scholar] [CrossRef] [PubMed]
- Jaschke, M.; Weber, M.A.; Fischer, C. CEUS-application possibilities in the musculoskeletal system. Der Radiologe 2018, 58, 579–589. [Google Scholar] [PubMed]
- Haubruck, P.; Kammerer, A.; Korff, S.; Apitz, P.; Xiao, K.; Buchler, A.; Biglari, B.; Zimmermann, G.; Daniel, V.; Schmidmaier, G.; et al. The treatment of nonunions with application of bmp-7 increases the expression pattern for angiogenic and inflammable cytokines: A matched pair analysis. J. Inflamm. Res. 2016, 9, 155–165. [Google Scholar] [CrossRef] [PubMed]
- Fischer, C.; Doll, J.; Tanner, M.; Bruckner, T.; Zimmermann, G.; Helbig, L.; Biglari, B.; Schmidmaier, G.; Moghaddam, A. Quantification of tgf-ss1, pdgf and igf-1 cytokine expression after fracture treatment vs. Non-union therapy via masquelet. Injury 2016, 47, 342–349. [Google Scholar] [CrossRef] [PubMed]
- Haubruck, P.; Heller, R.; Apitz, P.; Kammerer, A.; Alamouti, A.; Daniel, V.; Schmidmaier, G.; Moghaddam, A. Evaluation of matrix metalloproteases as early biomarkers for bone regeneration during the applied masquelet therapy for non-unions. Injury 2018. [Google Scholar] [CrossRef] [PubMed]
- Heller, R.A.; Raven, T.F.; Swing, T.; Kunzmann, K.; Daniel, V.; Haubruck, P.; Akbar, M.; Grutzner, P.A.; Schmidmaier, G.; Biglari, B.; et al. Ccl-2 as a possible early marker for remission after traumatic spinal cord injury. Spinal Cord 2017, 55, 1002–1009. [Google Scholar] [CrossRef] [PubMed]
- Masquelet, A.C.; Obert, L. Induced membrane technique for bone defects in the hand and wrist. Chirurgie de la Main 2010, 29, S221–S224. [Google Scholar] [CrossRef] [PubMed]
- Bosemark, P.; Perdikouri, C.; Pelkonen, M.; Isaksson, H.; Tagil, M. The masquelet induced membrane technique with bmp and a synthetic scaffold can heal a rat femoral critical size defect. J. Orthop. Res. Off. Publ. Orthop. Res. Soc. 2015, 33, 488–495. [Google Scholar] [CrossRef] [PubMed]
- Piscaglia, F.; Nolsoe, C.; Dietrich, C.F.; Cosgrove, D.O.; Gilja, O.H.; Bachmann Nielsen, M.; Albrecht, T.; Barozzi, L.; Bertolotto, M.; Catalano, O.; et al. The efsumb guidelines and recommendations on the clinical practice of contrast enhanced ultrasound (ceus): Update 2011 on non-hepatic applications. Ultraschall Med. 2012, 33, 33–59. [Google Scholar] [CrossRef] [PubMed]
- Kuhlman, J.E.; Fishman, E.K.; Magid, D.; Scott, W.W., Jr.; Brooker, A.F.; Siegelman, S.S. Fracture nonunion: Ct assessment with multiplanar reconstruction. Radiology 1988, 167, 483–488. [Google Scholar] [CrossRef] [PubMed]
- Savolaine, E.R.; Ebraheim, N. Assessment of femoral neck nonunion with multiplanar computed tomography reconstruction. Orthopedics 2000, 23, 713–715. [Google Scholar] [PubMed]
- Slade, J.F., 3rd; Gillon, T. Retrospective review of 234 scaphoid fractures and nonunions treated with arthroscopy for union and complications. Scand. J. Surg. 2008, 97, 280–289. [Google Scholar] [CrossRef] [PubMed]
- Akaike, H. Akaike’s information criterion. In International Encyclopedia of Statistical Science; Lovric, M., Ed.; Springer: Berlin/Heidelberg, Germany, 2011; p. 25. [Google Scholar]
- Moghaddam, A.; Sperl, A.; Heller, R.; Kunzmann, K.; Graeser, V.; Akbar, M.; Gerner, H.J.; Biglari, B. Elevated serum insulin-like growth factor 1 levels in patients with neurological remission after traumatic spinal cord injury. PLoS ONE 2016, 11, e0159764. [Google Scholar] [CrossRef] [PubMed]
- Moghaddam, A.; Heller, R.; Daniel, V.; Swing, T.; Akbar, M.; Gerner, H.J.; Biglari, B. Exploratory study to suggest the possibility of mmp-8 and mmp-9 serum levels as early markers for remission after traumatic spinal cord injury. Spinal Cord 2017, 55, 8–15. [Google Scholar] [CrossRef] [PubMed]
- Moghaddam, A.; Sperl, A.; Heller, R.; Gerner, H.J.; Biglari, B. Scd95l in serum after spinal cord injury. Spinal Cord 2016, 54, 957–960. [Google Scholar] [CrossRef] [PubMed]
- R Development Core Team. R: A Language and Environment for Statistical Computing; R Foundation for Statistical Computing: Vienna, Austria, 2015. [Google Scholar]
- Robin, X.; Turck, N.; Hainard, A.; Tiberti, N.; Lisacek, F.; Sanchez, J.C.; Muller, M. Proc: An open-source package for r and s+ to analyze and compare roc curves. BMC Bioinform. 2011, 12, 77. [Google Scholar] [CrossRef] [PubMed]
- Wickham, H. Ggplot2: Elegant Graphics for Data Analysis; Springer: New York, NY, USA, 2009. [Google Scholar]
- Bender, D.; Haubruck, P.; Boxriker, S.; Korff, S.; Schmidmaier, G.; Moghaddam, A. Validity of subjective smoking status in orthopedic patients. Ther. Clin. Risk Manag. 2015, 11, 1297–1303. [Google Scholar] [PubMed]
- Calori, G.M.; Colombo, M.; Mazza, E.L.; Mazzola, S.; Malagoli, E.; Marelli, N.; Corradi, A. Validation of the non-union scoring system in 300 long bone non-unions. Injury 2014, 45, S93–S97. [Google Scholar] [CrossRef] [PubMed]
- Krammer, D.; Schmidmaier, G.; Weber, M.A.; Doll, J.; Rehnitz, C.; Fischer, C. Contrast-enhanced ultrasound quantifies the perfusion within tibial non-unions and predicts the outcome of revision surgery. Ultrasound Med. Biol. 2018, 44, 1853–1859. [Google Scholar] [CrossRef] [PubMed]
- Qi-hua, X.; Chen, Z.; Jian-gang, Z.; Da-zhong, Z.; Yong-qiang, Z. Comparison of contrast-enhanced ultrasonography and contrast-enhanced mri for the assessment of vascularization of hydroxyapatite orbital implants. Clin. Imaging 2014, 38, 616–620. [Google Scholar] [CrossRef] [PubMed]
- Holstein, J.H.; Karabin-Kehl, B.; Scheuer, C.; Garcia, P.; Histing, T.; Meier, C.; Benninger, E.; Menger, M.D.; Pohlemann, T. Endostatin inhibits callus remodeling during fracture healing in mice. J. Orthop. Res. 2013, 31, 1579–1584. [Google Scholar] [CrossRef] [PubMed]
- Delany, A.M.; Hankenson, K.D. Thrombospondin-2 and sparc/osteonectin are critical regulators of bone remodeling. J. Cell Commun. Signal. 2009, 3, 227–238. [Google Scholar] [CrossRef] [PubMed]
- Taylor, D.K.; Meganck, J.A.; Terkhorn, S.; Rajani, R.; Naik, A.; O’Keefe, R.J.; Goldstein, S.A.; Hankenson, K.D. Thrombospondin-2 influences the proportion of cartilage and bone during fracture healing. J. Bone Miner. Res. 2009, 24, 1043–1054. [Google Scholar] [CrossRef] [PubMed]
- Yan, M.; Hu, Y.; Yao, M.; Bao, S.; Fang, Y. Gm-csf ameliorates microvascular barrier integrity via pericytes-derived ang-1 in wound healing. Wound Repair Regen. 2018, 25, 933–943. [Google Scholar] [CrossRef] [PubMed]
- Locksley, R.M.; Killeen, N.; Lenardo, M.J. The tnf and tnf receptor superfamilies: Integrating mammalian biology. Cell 2001, 104, 487–501. [Google Scholar] [CrossRef]


| Patients | All | Responders (G1) | Non-Responders (G2) | |
|---|---|---|---|---|
| Sex | Male | 8 | 4 | 4 |
| Female | 5 | 4 | 1 | |
| Age | 45.3 ± 14.9 | 41.1 ± 16 | 51.9 ± 9.8 | |
| BMI | 29.5 ± 7.8 | 29.5 ± 9.3 | 29.5 ± 3.2 | |
| Infection | Yes | 10 (77%) | 5 (62.5%) | 5 (100%) |
| No | 3 (23%) | 3(27.5%) | 0 (0%) | |
| Smoking | S | 2 | 1 | 1 |
| NS | 8 | 4 | 4 | |
| FS | 3 | 3 | 0 | |
| Trauma to Non-Union Therapy (Months) | 55.9 ± 99.4 | 38.38 ± 71 | 84 ± 127.9 | |
| NUSS Score | 43.38 ± 6 | 44 ± 6.2 | 42.4 ± 5.7 | |
| Localisation | Tibia | 13 | 8 | 5 |
| Fixation | Nail | 12 | 7 | 5 |
| Plate | 1 | 1 | 0 | |
| Previous surgeries | 2.36 ± 1.1 | 2.0 ± 0.5 | 3.0 ± 1.41 |
| Parameter | Time Point | Patients | |
|---|---|---|---|
| Responder (G1; N = 8) | Non-Responder (G2; N = 5) | ||
| WiR (a.u.) | Preoperative | 35.14 ± 11.32 | 50.43 ± 23.17 |
| 3 months postoperative | 106.59 ± 34.45 | 46.91 ± 21.47 | |
| TTP (s) | Preoperative | 26.77 ± 10.15 | 10.56 ± 1.71 |
| 3 months postoperative | 9.68 ± 1.45 | 20.05 ± 3.98 | |
| RT (s) | Preoperative | 16.37 ± 6.94 | 8.96 ± 1.69 |
| 3 months postoperative | 5.08 ± 1.00 | 15.50 ± 4.17 | |
| PE (a.u.) | Preoperative | 189.12 ± 57.15 | 218.63 ± 95.65 |
| 3 months postoperative | 318.82 ± 98.56 | 252.39 ± 92.11 | |
© 2018 by the authors. Licensee MDPI, Basel, Switzerland. This article is an open access article distributed under the terms and conditions of the Creative Commons Attribution (CC BY) license (http://creativecommons.org/licenses/by/4.0/).
Share and Cite
Haubruck, P.; Heller, R.; Tanner, M.C.; Daniel, V.; Schmidmaier, G.; Bolourchi, F.; Moghaddam, A.; Fischer, C. A Preliminary Study of Contrast-Enhanced Ultrasound (CEUS) and Cytokine Expression Analysis (CEA) as Early Predictors for the Outcome of Tibial Non-Union Therapy. Diagnostics 2018, 8, 55. https://doi.org/10.3390/diagnostics8030055
Haubruck P, Heller R, Tanner MC, Daniel V, Schmidmaier G, Bolourchi F, Moghaddam A, Fischer C. A Preliminary Study of Contrast-Enhanced Ultrasound (CEUS) and Cytokine Expression Analysis (CEA) as Early Predictors for the Outcome of Tibial Non-Union Therapy. Diagnostics. 2018; 8(3):55. https://doi.org/10.3390/diagnostics8030055
Chicago/Turabian StyleHaubruck, Patrick, Raban Heller, Michael C. Tanner, Volker Daniel, Gerhard Schmidmaier, Farhoud Bolourchi, Arash Moghaddam, and Christian Fischer. 2018. "A Preliminary Study of Contrast-Enhanced Ultrasound (CEUS) and Cytokine Expression Analysis (CEA) as Early Predictors for the Outcome of Tibial Non-Union Therapy" Diagnostics 8, no. 3: 55. https://doi.org/10.3390/diagnostics8030055
APA StyleHaubruck, P., Heller, R., Tanner, M. C., Daniel, V., Schmidmaier, G., Bolourchi, F., Moghaddam, A., & Fischer, C. (2018). A Preliminary Study of Contrast-Enhanced Ultrasound (CEUS) and Cytokine Expression Analysis (CEA) as Early Predictors for the Outcome of Tibial Non-Union Therapy. Diagnostics, 8(3), 55. https://doi.org/10.3390/diagnostics8030055