Article

A Nomogram for Predicting the Risk of Spinal Anesthesia-Induced Hypotension in Older Patients
1
Department of Anesthesiology, Peking University People’s Hospital, Beijing 100044, China
2
Department of Anesthesiology, Beijing Chest Hospital, Capital Medical University, Beijing 101149, China
*
Authors to whom correspondence should be addressed.
Diagnostics 2026, 16(4), 557; https://doi.org/10.3390/diagnostics16040557
Submission received: 28 December 2025 / Revised: 6 February 2026 / Accepted: 7 February 2026 / Published: 13 February 2026
(This article belongs to the Special Issue Clinical Diagnosis and Management in Anesthesia and Pain Medicine)

Abstract

Background: Hypotension is a common complication following spinal anesthesia, and it is particularly prevalent in older patients. The study aimed to develop and validate a nomogram integrating echocardiographic and clinical predictors for spinal anesthesia-induced hypotension (SAIH) in older patients. Methods: This was an observational cohort study conducted at Peking University People’s Hospital. A total of 865 older patients (age ≥ 65), enrolled from 1 January 2023 to 31 December 2024, were randomly split into a training set (70%) and an internal validation set (30%). For temporal external validation, 349 patients from January to March 2025 were enrolled. LASSO, univariable, and multivariate logistic regression analyses were used to identify predictive factors. A nomogram was subsequently developed based on the results of multivariate logistic regression, and its predictive efficacy was evaluated via both internal and temporal external validation. Results: SAIH occurred in 271 patients (44.8%) in the training set, 110 patients (42.3%) in the internal validation set, and 173 patients (49.6%) in the external validation set. Age, body mass index (BMI), bupivacaine dose, sensory block level, baseline systolic blood pressure (SBP), history of hypertension, interventricular septum thickness at end-diastole (IVSd), early diastolic mitral annular velocity (e’), and E/e’ ratio were significant predictors of SAIH on multivariate analysis. The diagnostic performance of the nomogram was favorable (AUC = 0.885, 95% CI: 0.859–0.911). The AUC values of the internal validation set and temporal external validation set were 0.856 (0.811–0.901) and 0.895 (0.863–0.927). Conclusions: This study identifies age, BMI, bupivacaine dose, sensory block level, baseline SBP, history of hypertension, and IVSd as predictors of SAIH with good discrimination and clinical utility. We present a predictive nomogram that accurately predicts SAIH in older patients. The external validation illustrates its generalizability.

1. Introduction

Spinal anesthesia (SA) provides favorable surgical conditions but carries significant hemodynamic risks, with an incidence of hypotension of 15–33%, representing the most common complication [1,2]. This phenomenon stems from SA-induced sympathetic blockade, which reduces systemic vascular resistance and venous return [3]. The elderly are particularly susceptible, with a >70% risk of hypotension due to age-related vascular stiffening and frequent comorbidities [4,5]. Uncontrolled spinal anesthesia-induced hypotension (SAIH) triggers acute hemodynamic instability and a cascade of severe perioperative complications in older patients: reduced coronary perfusion increases the risk of myocardial ischemia, arrhythmias, and even myocardial infarction in patients with underlying coronary artery disease; impaired cerebral blood flow autoregulation leads to cerebral hypoperfusion, presenting as dizziness, confusion, or ischemic stroke; and diminished renal perfusion precipitates acute kidney injury, particularly in those with pre-existing renal insufficiency. These adverse events collectively elevate perioperative mortality and morbidity, prolong hospital stays, and increase the risk of long-term cardiovascular and cerebrovascular sequelae [6,7,8,9].
Traditional methods for predicting spinal anesthesia-induced hypotension (SAIH) via preoperative assessment and intraoperative monitoring exhibit limited accuracy. Transthoracic echocardiography (TTE) has significantly improved the precision and safety of anesthetic management by enabling perioperative applications—preoperative risk assessment, real-time intraoperative monitoring, and postoperative complication diagnosis—which is particularly valuable for high-risk patients with hemodynamic instability [10]. Numerous studies have shown that preoperative echocardiographic parameters, including maximal inferior vena cava diameter (dIVCmax), inferior vena cava collapsibility index (IVCCI), and the dIVCmax-to-IVCCI ratio, are significant predictors of hypotension after SA in older patients [11,12,13].
Additional echocardiographic and clinical parameters may predict hypotension; however, the current lack of integrated models impedes accurate risk assessment. Nomograms serve as an efficient graphical method for multivariable risk prediction [14]. The present study aimed to develop and validate a nomogram integrating echocardiographic and clinical parameters to identify older patients at high risk of post-SA hypotension, thereby facilitating targeted prevention.

2. Materials and Methods

2.1. Study Design and Patient Enrollment

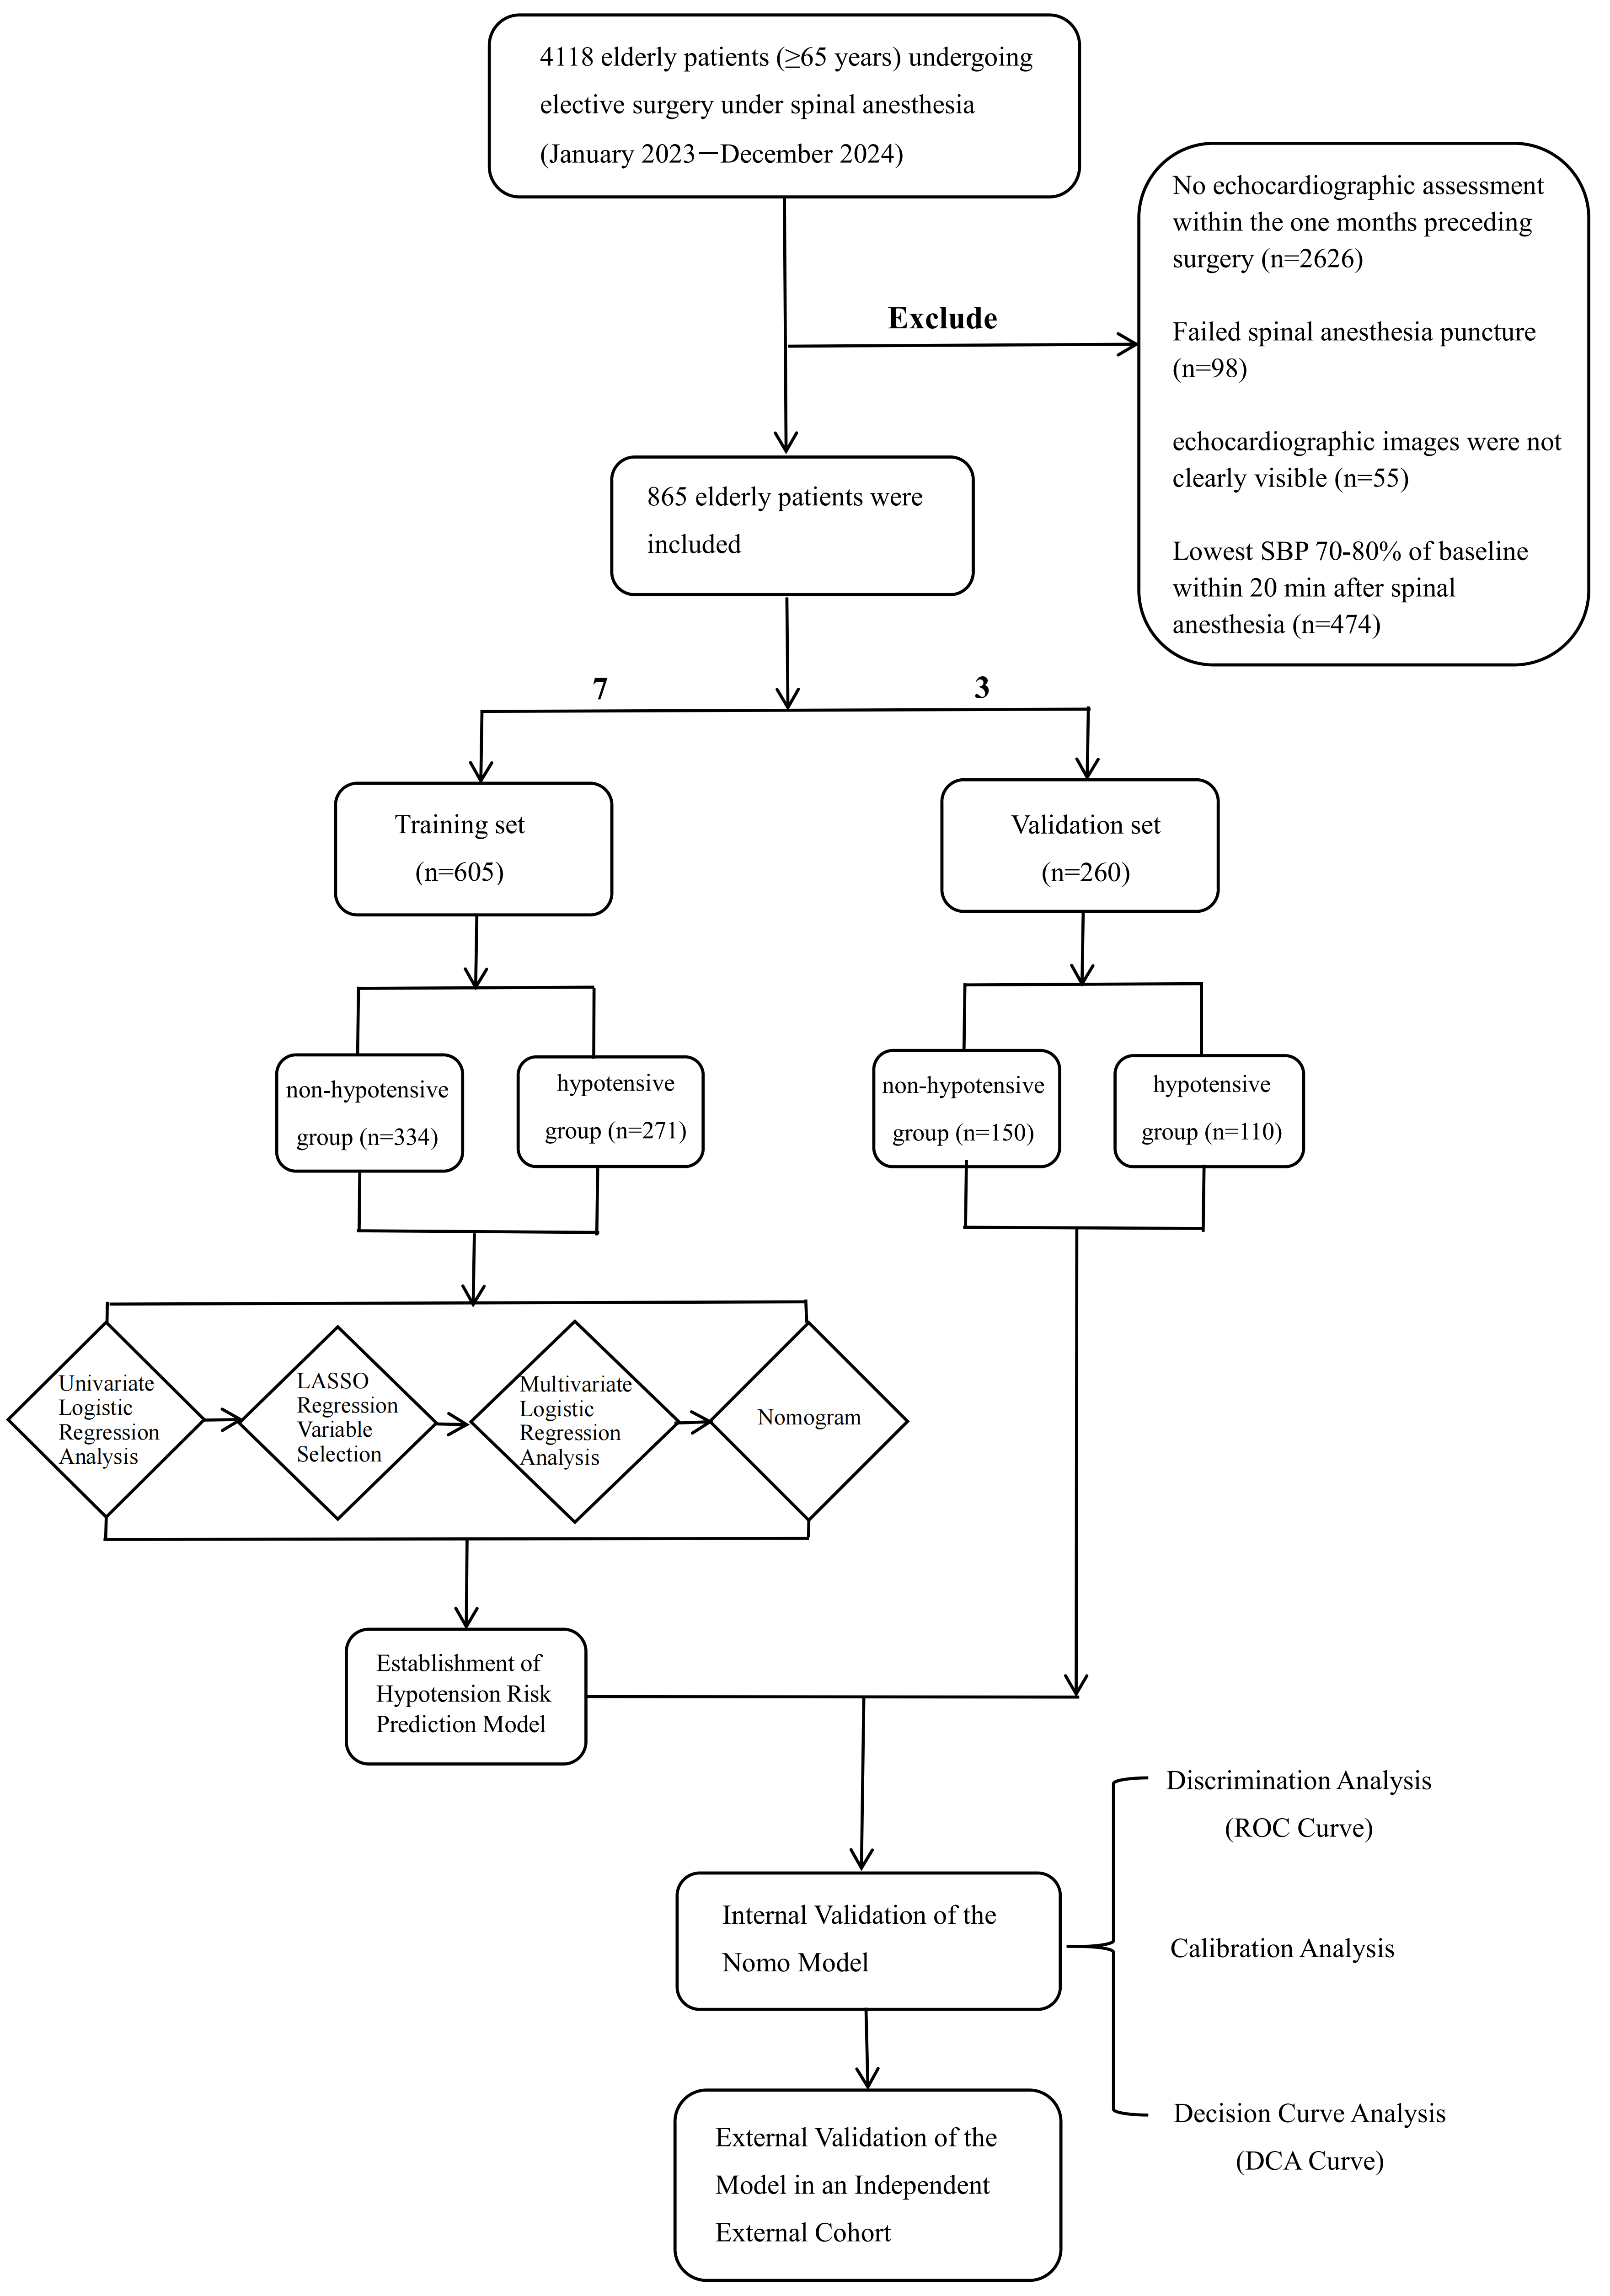
This was a retrospective cohort study, and reporting adheres to the STROBE guidelines. A total of 865 patients were enrolled from the clinical database of Peking University People’s Hospital between January 2023 and December 2024. The inclusion criteria were as follows: (1) age ≥ 65 years; (2) elective SA surgery; (3) preoperative echocardiographic examination within one month; and (4) American Society of Anesthesiologists Physical Status Classification System (ASA) I-III. The exclusion criteria were as follows: (1) failed SA puncture and (2) invisible echocardiographic images. The dataset was randomly split into training and validation sets at a 7:3 ratio. The training set was used for model development, while the validation set (150 non-hypotension and 110 hypotension cases) served for internal validation. For temporal external validation, 349 patients from January to March 2025 (176 non-hypotension and 173 hypotension cases) were enrolled. The flowchart of this study is shown in Figure 1.

2.2. Anesthesia Protocol and Hemodynamic Management

Prior to SA, midazolam was intravenously administered at a dose of 0.5–1 mg according to the patient’s individual conditions. Upon admission to the operating room, all patients received an intravenous infusion of lactated Ringer’s solution at a rate of 3–5 mL·kg−1 ·h−1 before spinal puncture. The infusion rate was individualized to prevent volume overload induced by rapid fluid administration. Preoperative unilateral nerve blocks were not administered for orthopedic surgeries included in this study. Standardized SA was performed in the lateral decubitus position at the L2–L3 or L3–L4 interspace using hypobaric bupivacaine (0.3%, 3–4 mL, 9–12 mg) via a 25-gauge Quincke needle, with the dose individually adjusted according to patient characteristics, surgical requirements, and clinical practice guidelines. The sensory block level was assessed via pinprick testing at 20 min after SA and recorded as the highest dermatomal level of analgesia, expressed as a vertebral segment. Perioperative antihypertensive management included discontinuing Angiotensin-Converting Enzyme Inhibitors (ACEIs) and Angiotensin II Receptor Blockers (ARBs), while continuing calcium channel blockers and β-blockers. Blood pressure (BP) was monitored noninvasively at 3 min intervals using an automated oscillometric device (PHILIPS MP70) on the brachial artery. Baseline BP was defined as the first measurement obtained after midazolam premedication. Hypotension was strictly defined as a ≥30% reduction in systolic blood pressure (SBP) from baseline within 20 min following SA administration [15]. Mean arterial pressure (MAP) was calculated as diastolic blood pressure (DBP) + (SBP−DBP)/3. A protocolized intervention was initiated if hypotension persisted for >3 min: phenylephrine 50 μg or ephedrine 6 mg for hypotension, and atropine 0.5 mg for bradycardia (heart rate (HR) < 50 bpm). Patients with SBP reductions of 20–30% from baseline were excluded.

2.3. Echocardiography

All transthoracic echocardiographic examinations were performed within one month before surgery in the Department of Echocardiography of our hospital by certified cardiac sonographers using a standardized protocol with an M5Sc 2–5 MHz phased-array transducer (VIVID E95 R4 WXB, Mindray, Beijing, China). From the parasternal long-axis view, M-mode measurements included left atrial diameter (LAD), interventricular septum thickness at end-diastole (IVSd), left ventricular end-systolic diameter (LVESD), left ventricular end-diastolic diameter (LVEDD), left ventricular posterior wall thickness at end-diastole (LVPWD), left ventricular mass (LVM), left ventricular end-diastolic volume (LVEDV), and left ventricular end-systolic volume (LVESV). Left ventricular ejection fraction (LVEF) was calculated using the Teichholz method in patients with normal wall motion or the modified biplane Simpson’s method in those with segmental wall motion abnormalities. Pulsed-wave spectral Doppler was used to measure Mitral early diastolic peak velocity (E) and mitral late diastolic peak velocity (A) in the apical four-chamber view. Tissue Doppler imaging (TDI) with pulsed-wave was used to measure early diastolic mitral annular velocity (e’) at the septal annulus in the apical four-chamber view, and the E/A ratio (E/A) and E/e’ ratio were calculated.

2.4. Data Collection

Patient data were collected from the clinical electronic medical record system by two authors (Z.T.C. and B.Y.W.), with duplicate checks performed for the data. Collected data included patients’ basic clinical data (sex, age, height, weight, body mass index (BMI), type of surgery), medical history (hypertension, diabetes mellitus, coronary artery disease), anesthetic data (ASA, fasting duration (calculated from 10:00 p.m. on the preoperative day to the time of operating room admission), preoperative fluid administration (intravenous infusion of glucose-saline solution at 125 mL/h, initiated at 10:00 a.m. on the operative day), dose of bupivacaine, sensory block level, baseline and post-SA SBP, DBP, MAP, and HR).

2.5. Statistical Analysis

Statistical analysis was conducted using R 4.4.2. The sample size was calculated using the 10 events per variable (10 EPV) rule. Patients with missing echocardiographic parameters (missing rate > 20%) were excluded, and the remaining missing data were imputed via multiple imputation. The normality of data was assessed using the Shapiro–Wilk test. Continuous variables are reported as mean ± standard deviation (SD) and compared using the Student’s t-test for independent samples, while non-normally distributed continuous variables are presented as median (interquartile range, IQR) and analyzed using the Mann–Whitney U test. Categorical variables are presented as counts and percentages and compared using the chi-square test or Fisher’s exact test (if an expected value of ≤5 was observed). A p value < 0.05 was considered statistically significant. Univariate logistic regression was first performed on the training dataset to identify potential predictors (p < 0.1). Significant variables were then included in Least Absolute Shrinkage and Selection Operator (LASSO) logistic regression for feature selection. Subsequently, the selected variables were entered into multivariate logistic regression, and predictors with statistical significance (p < 0.05) were retained in the final model. The final prediction model was presented as a nomogram for clinical use. Receiver operating characteristic (ROC) curves were constructed and the area under the curve (AUC) was calculated to assess the predictive performance of the model. The agreement between predicted probabilities from the nomogram and actual probabilities was assessed using calibration curves. Decision curve analysis (DCA) was performed to examine the clinical applicability of the prediction model in practical decision-making.

3. Results

3.1. Patient Demographic and Clinical Characteristics

SAIH occurred in 271 patients (44.8%) in the training set, 110 patients (42.3%) in the internal validation set, and 173 patients (49.6%) in the external validation set. The demographic and clinical characteristics of the training set, internal validation set, and external validation set are detailed in Table 1. There were no statistically significant differences between the training and internal validation sets in terms of SAIH occurrence, basic clinical data, medical history, anesthetic data, and echocardiographic parameters (p > 0.05) (Table S1).

3.2. Univariate Analysis of Hypotensive vs. Non-Hypotensive Groups in the Training Set

In the training set, compared with the non-hypotensive group, the hypotensive group had higher age, weight, and BMI but lower height in basic clinical characteristics; a higher prevalence of hypertension in medical history; a higher dose of bupivacaine, baseline SBP, baseline MAP, and sensory block level but lower post-SA SBP, DBP, and MAP in anesthetic parameters; and higher LAD, IVSd, LVM, E, and E/e’ but lower A and e’ in echocardiographic parameters (p < 0.1) (Table 1).

3.3. LASSO Regression Analysis with 10-Fold Cross-Validation

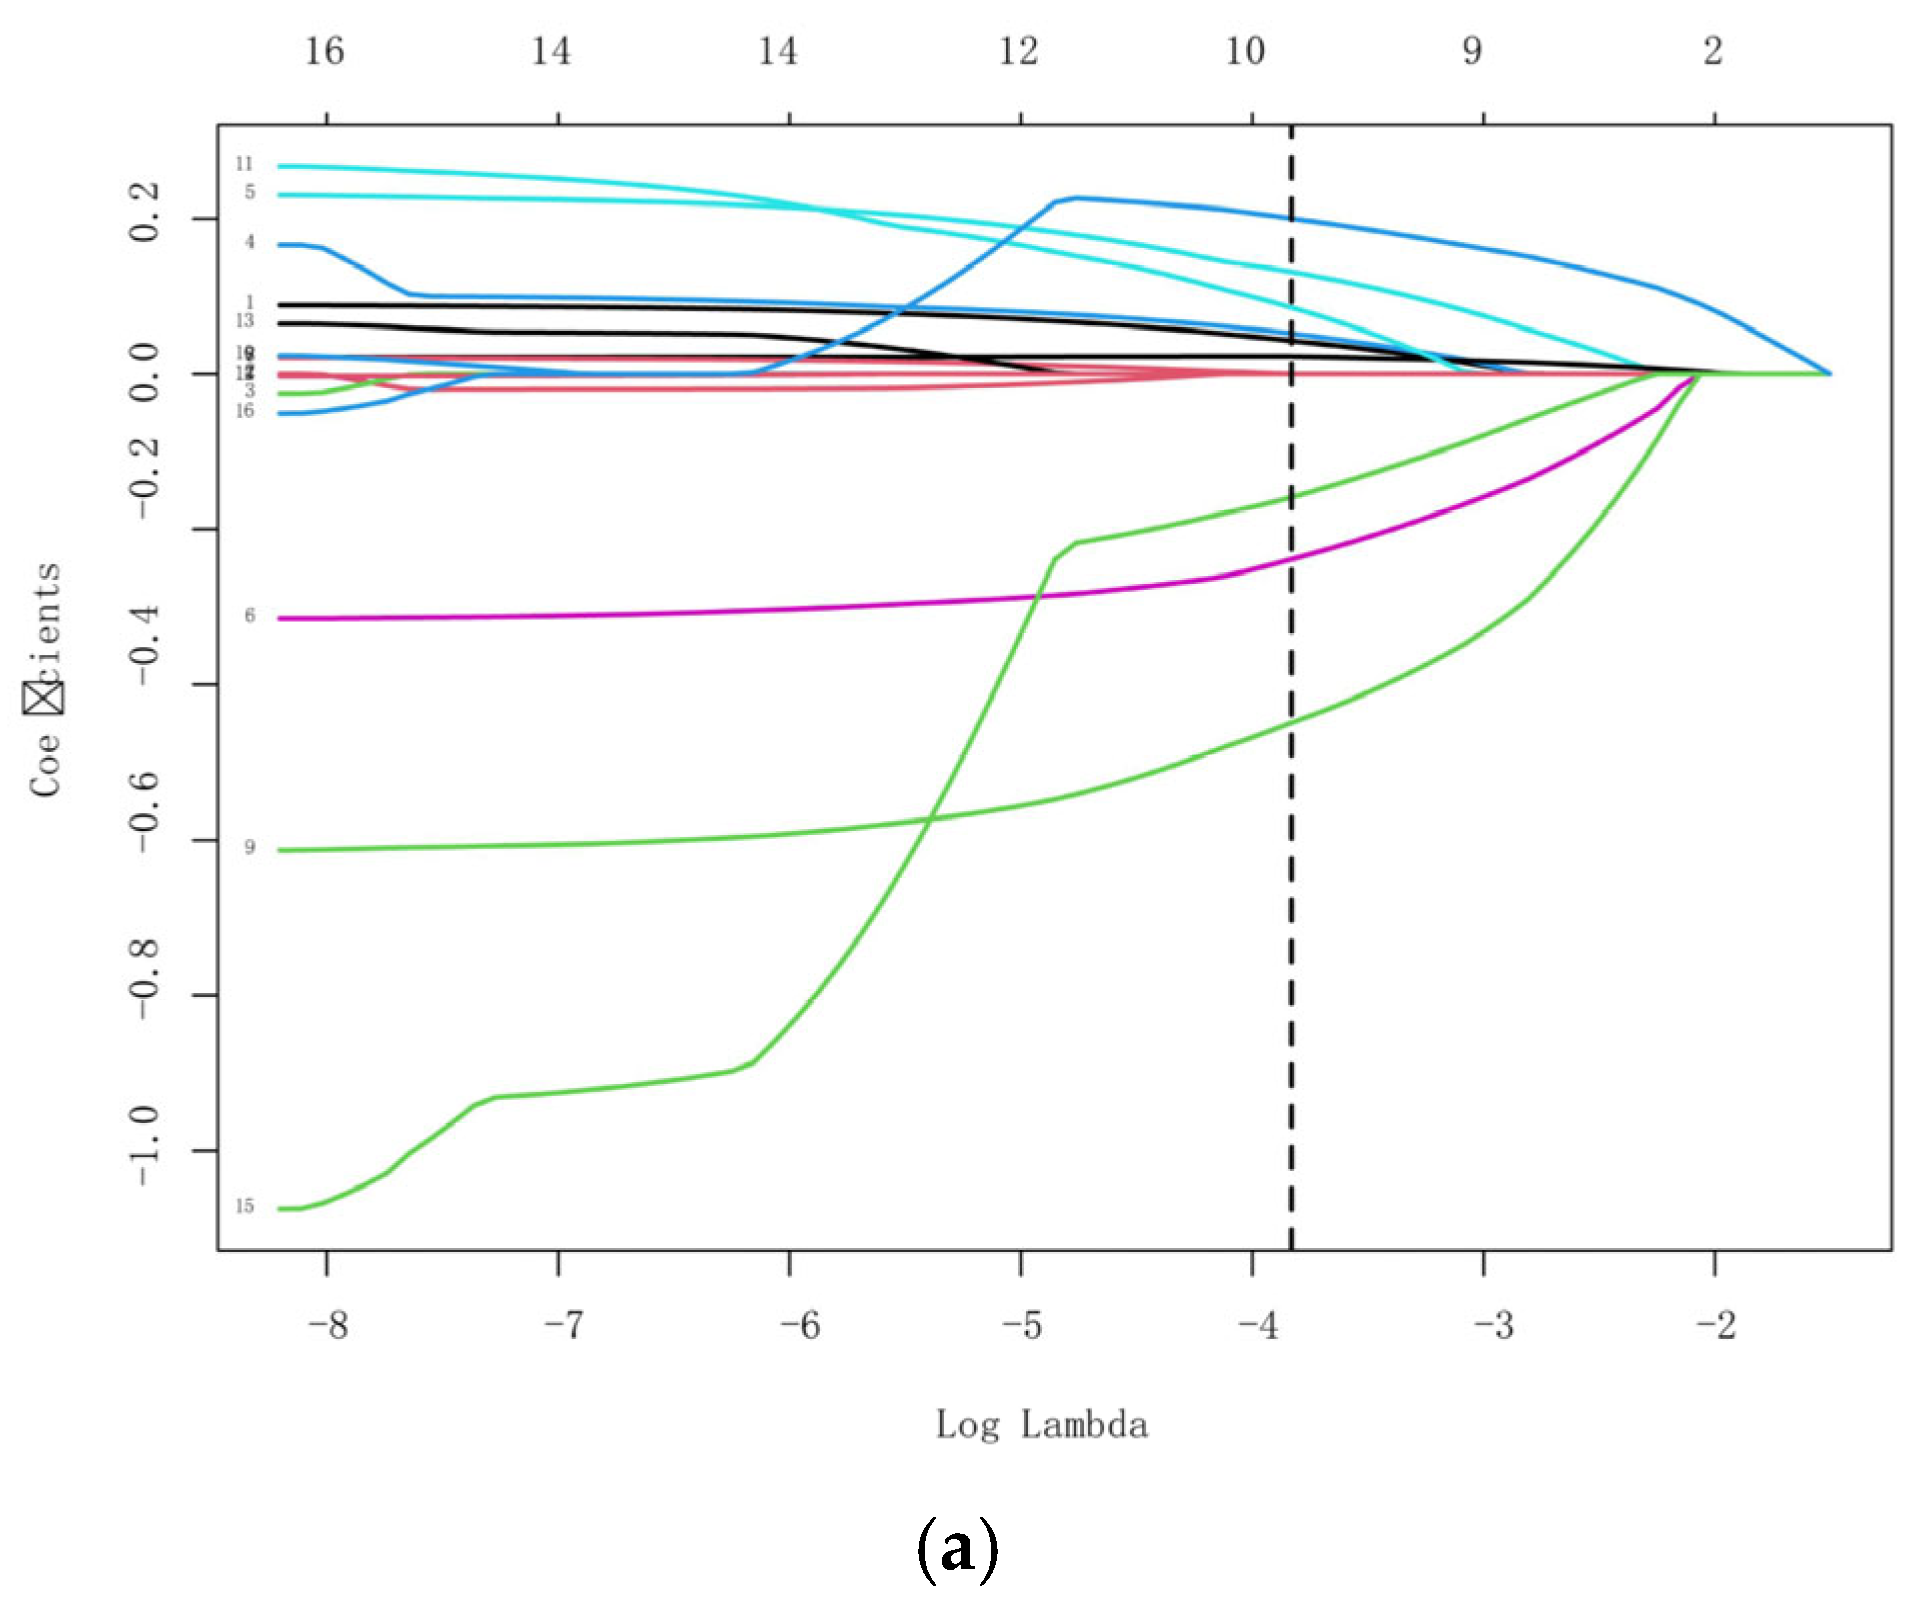
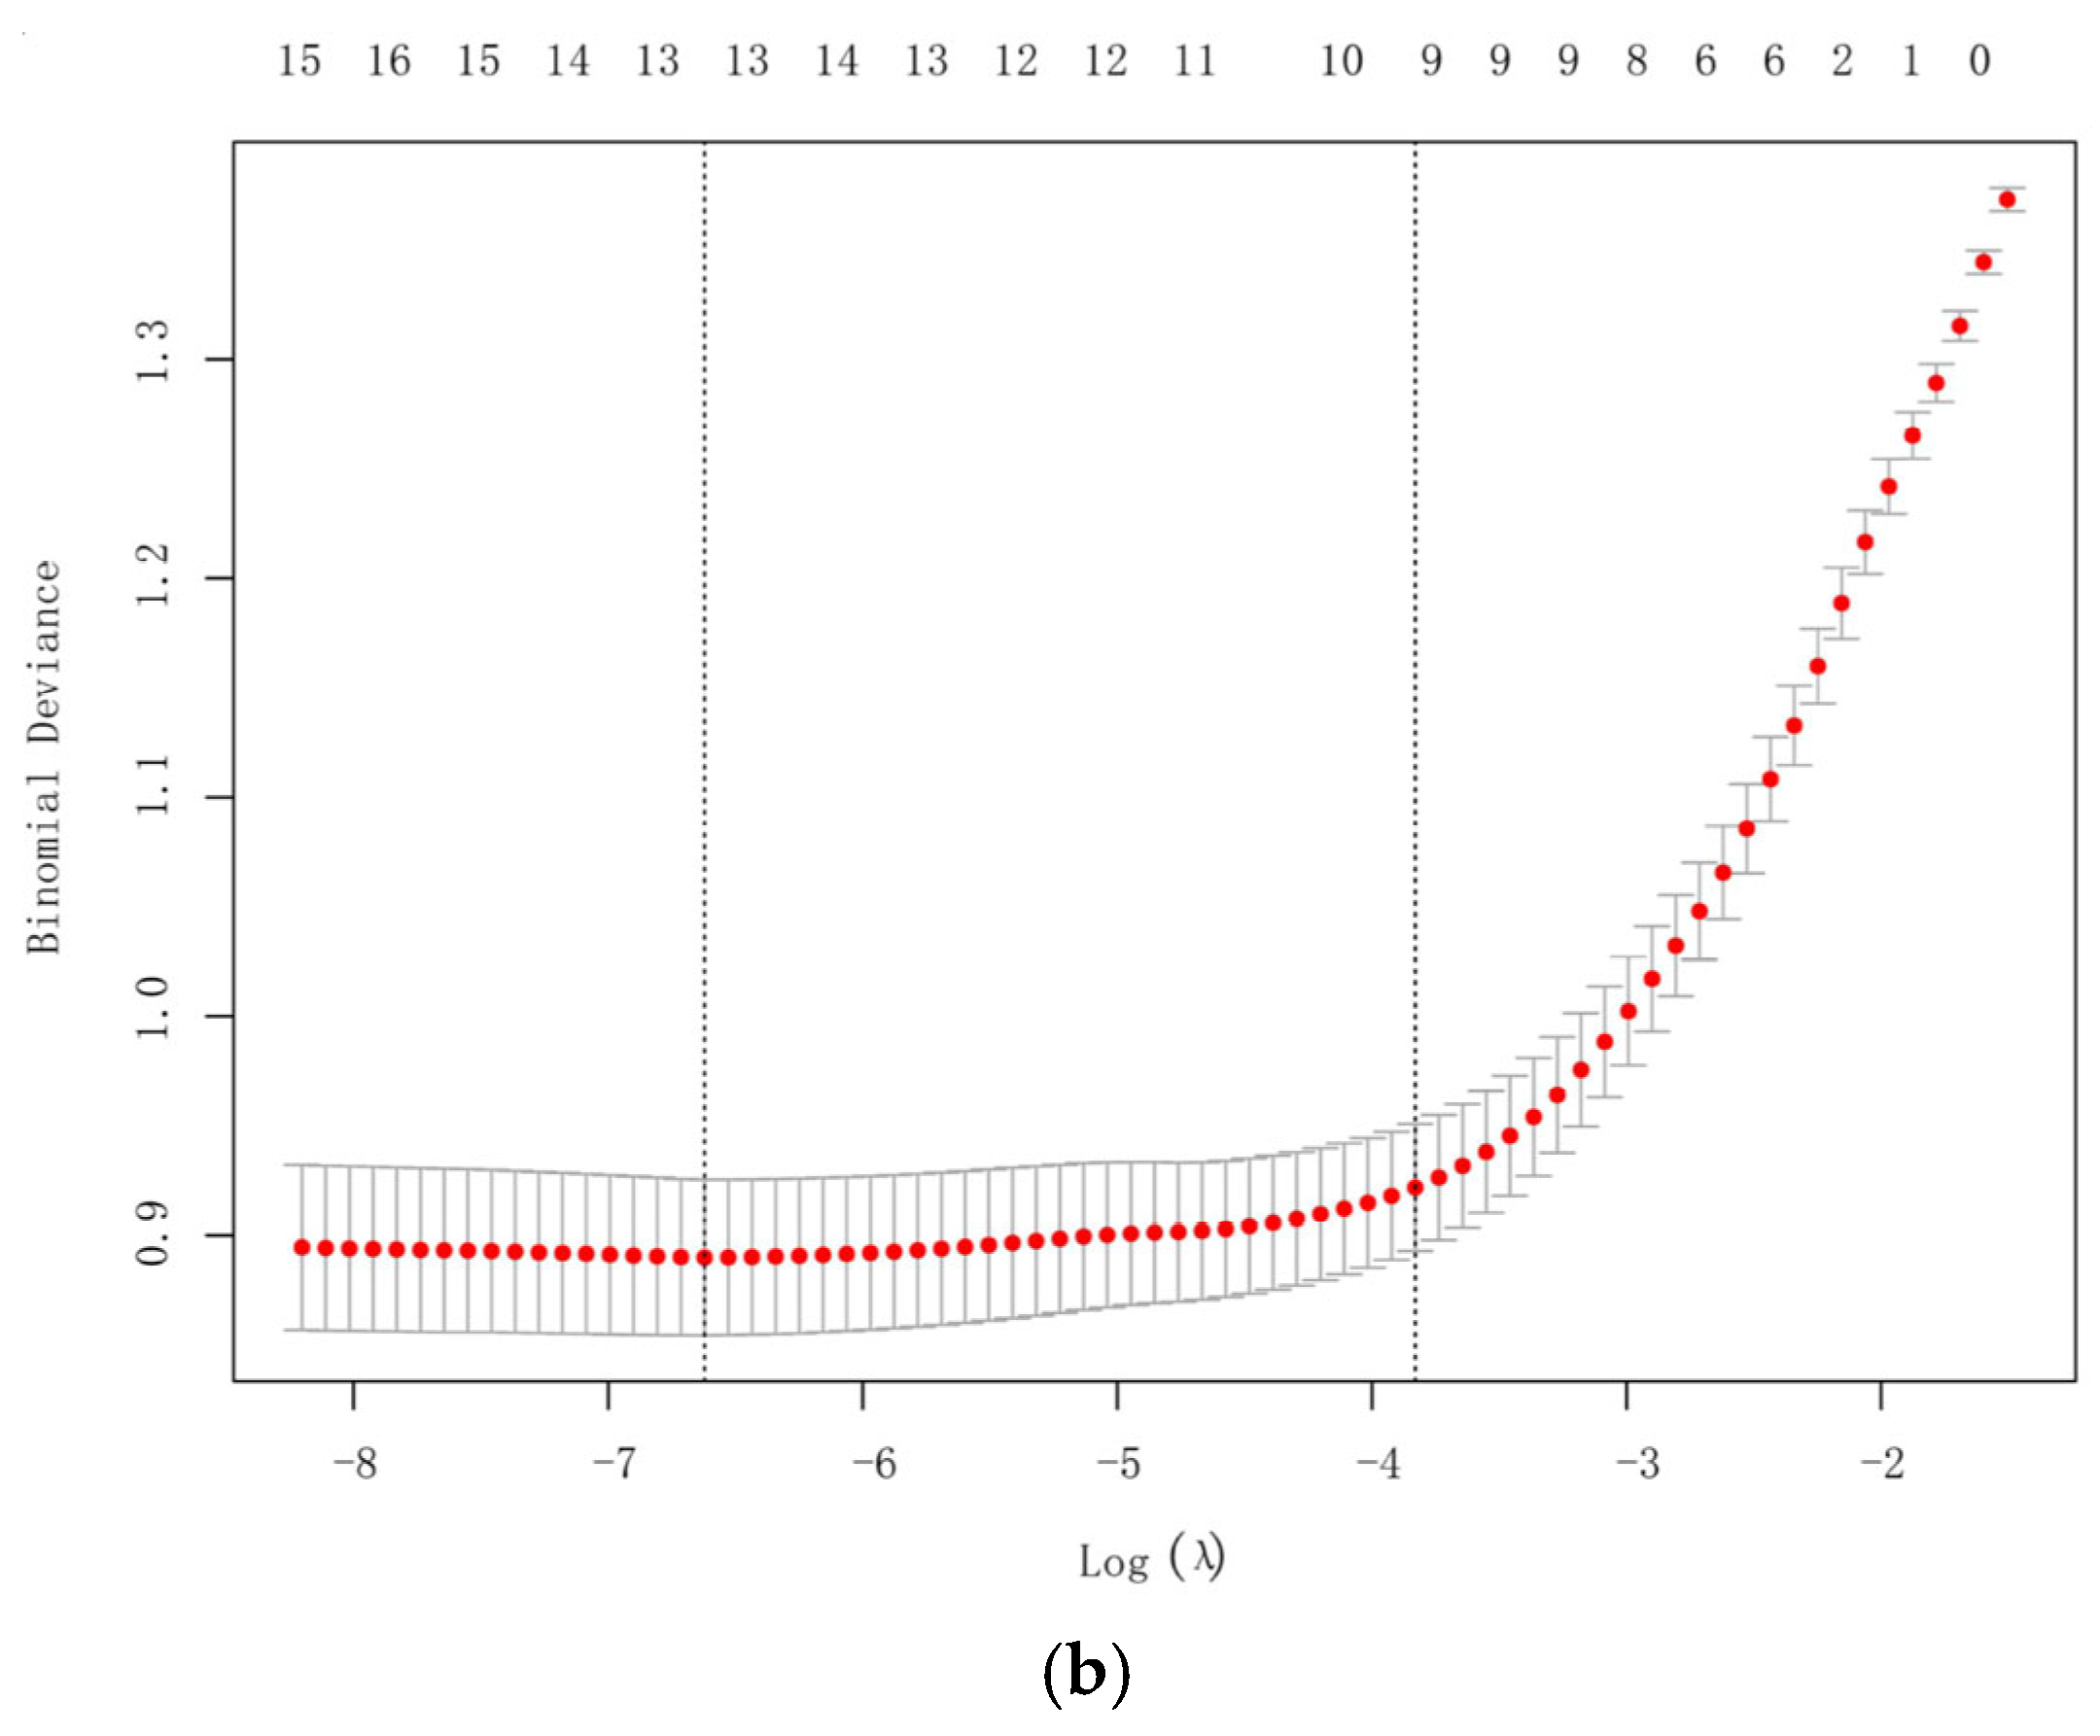
A total of 16 variables with p < 0.1 in univariate analysis (age, height, weight, BMI, bupivacaine dose, sensory block level, baseline SBP, baseline MAP, history of hypertension, LAD, IVSd, LVM, E, A, e’, E/e’) were entered into LASSO regression with 10-fold cross-validation. Nine predictors with nonzero coefficients (age, BMI, bupivacaine dose, sensory block level, baseline SBP, history of hypertension, IVSd, e’, E/e’) were included in multivariate analysis (Figure 2).

3.4. Multivariable Logistic Regression Analysis for Identifying Independent Predictors

The results indicated that age (OR: 1.083, 95% CI: 1.042–1.127), BMI (OR: 1.104, 95% CI: 1.031–1.182), dose of bupivacaine (OR: 1.216, 95% CI: 1.092–1.354), baseline SBP (OR: 1.031, 95% CI: 1.015–1.047), history of hypertension (yes) (OR: 1.78, 95% CI: 1.13–2.82), IVSd (OR: 1.210, 95% CI: 1.013, 1.444), and E/e’ (OR: 1.289, 95% CI: 1.182–1.405) are risk factors for the occurrence of hypotension, while sensory block level (OR: 0.709, 95% CI: 0.594–0.846) and e’ (OR: 0.761, 95% CI: 0.630–0.920) are protective factors against hypotension, with statistical significance (p < 0.05) (Table 2).

3.5. Development of a Nomogram Model for Spinal Anesthesia-Induced Hypotension in Older Patients

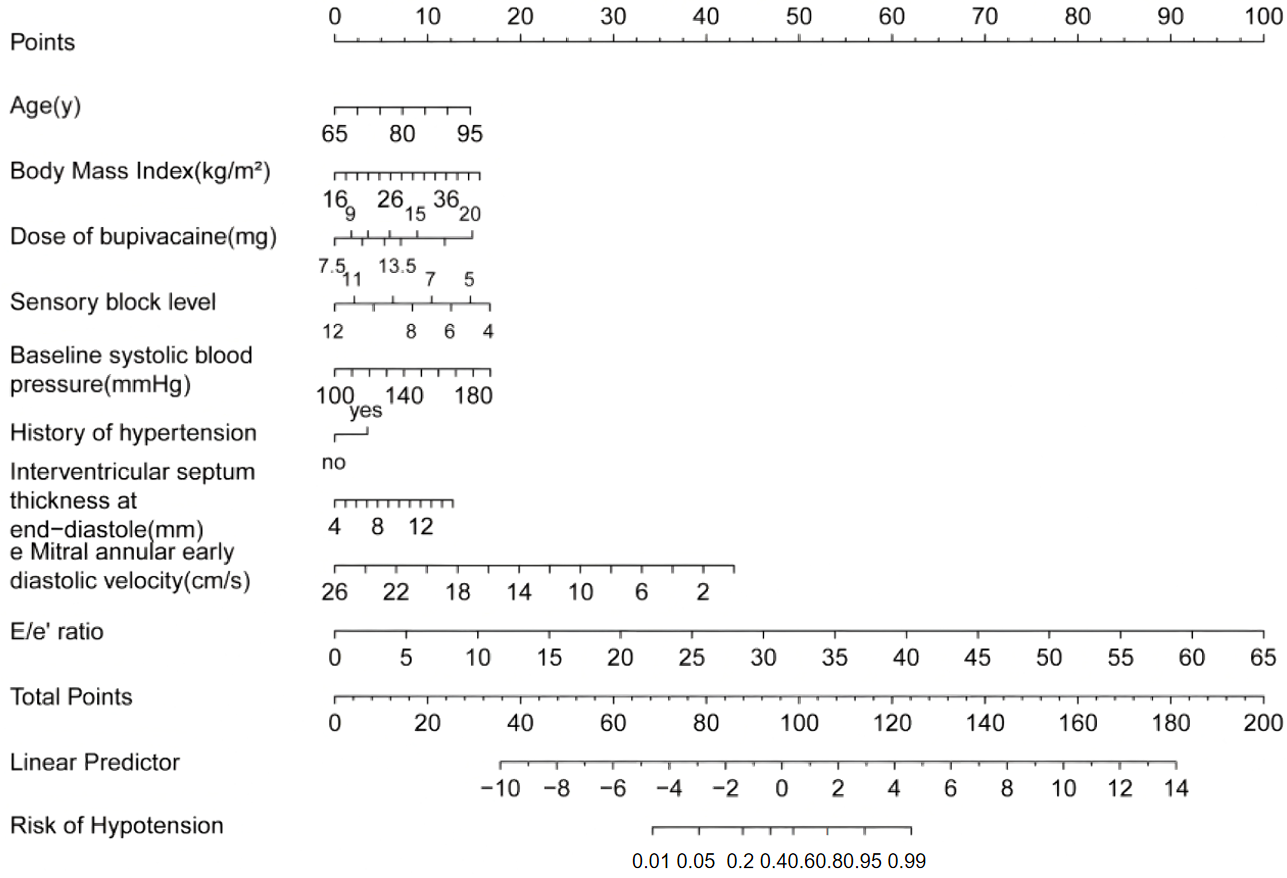
A nomogram model was constructed based on the results of multivariate logistic regression, including the following predictors: age, BMI, dose of bupivacaine, sensory block level, baseline SBP, history of hypertension, IVSd, e’, and E/e’ (Figure 3). The results of the multivariate logistic regression analysis for the diagnostic outcome are presented, with the derived linear predictor equation as follows: Logit (P) = −16.169 + 0.080 × age + 0.099 × BMI + 0.195 × dose of bupivacaine − 0.344 × sensory block level + 0.031 × baseline SBP + 0.579 × history of hypertension + 0.190 × IVSd − 0.273 × e’+ 0.254 × E/e’. For patients undergoing SA, anesthesiologists should extract each clinical indicator shown in the nomogram sequentially. To use the nomogram in clinical practice, a vertical line can be drawn upward directly from the value of each variable to the scoring line to obtain the corresponding score. The total score is calculated by summing the scores of all variables, and a vertical line is then drawn downward from the total score to the “Risk of Hypotension” axis to directly read the SAIH probability for each patient. Anesthesiologists can quickly assess the risk of SAIH in patients before surgery using this nomogram. For high-risk patients, preventive interventions can be implemented in advance, such as adjusting the bupivacaine dose, optimizing volume management, and prophylactically administering vasoactive drugs.

3.6. Online Dynamic Nomogram Establishment

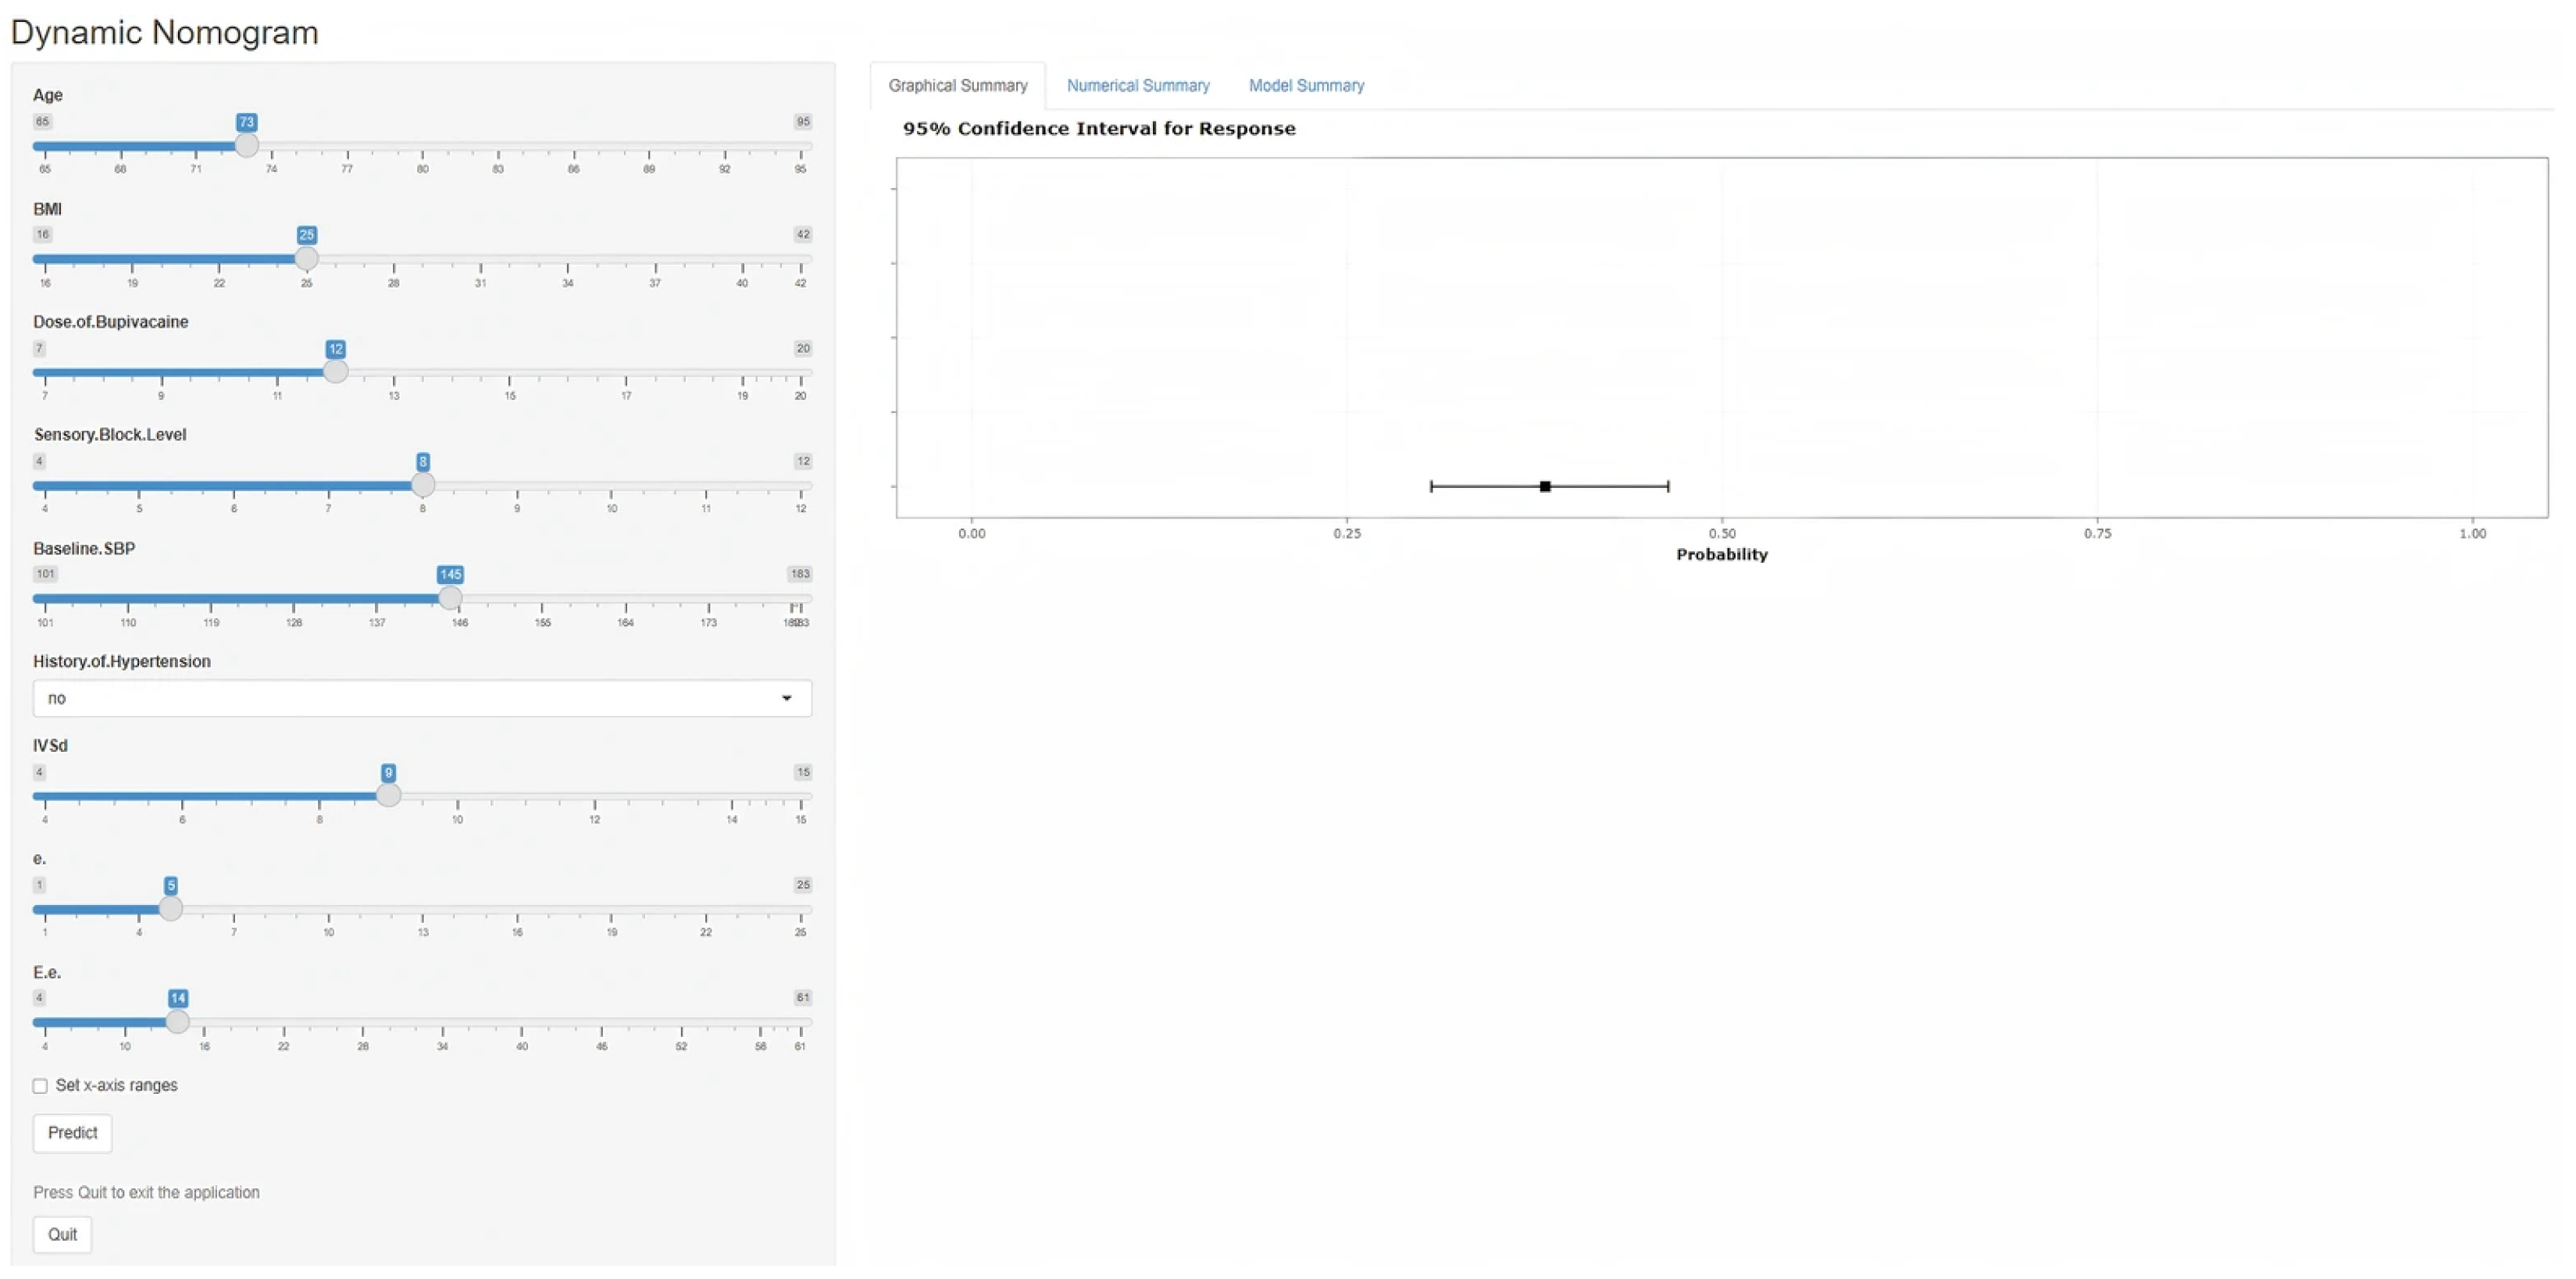
Based on the predictors screened by the multivariate logistic regression analysis and the graphical nomogram model, an online dynamic nomogram was then established (website: https://modelforsaihinelderly.shinyapps.io/dynnomapp/ accessed on 2 February 2026). Clinicians can easily input the relevant clinical and echocardiographic parameters of individual patients and quickly obtain the personalized SAIH risk probability. A screenshot of the online prediction tool is provided in Figure 4.

3.7. Model Validation

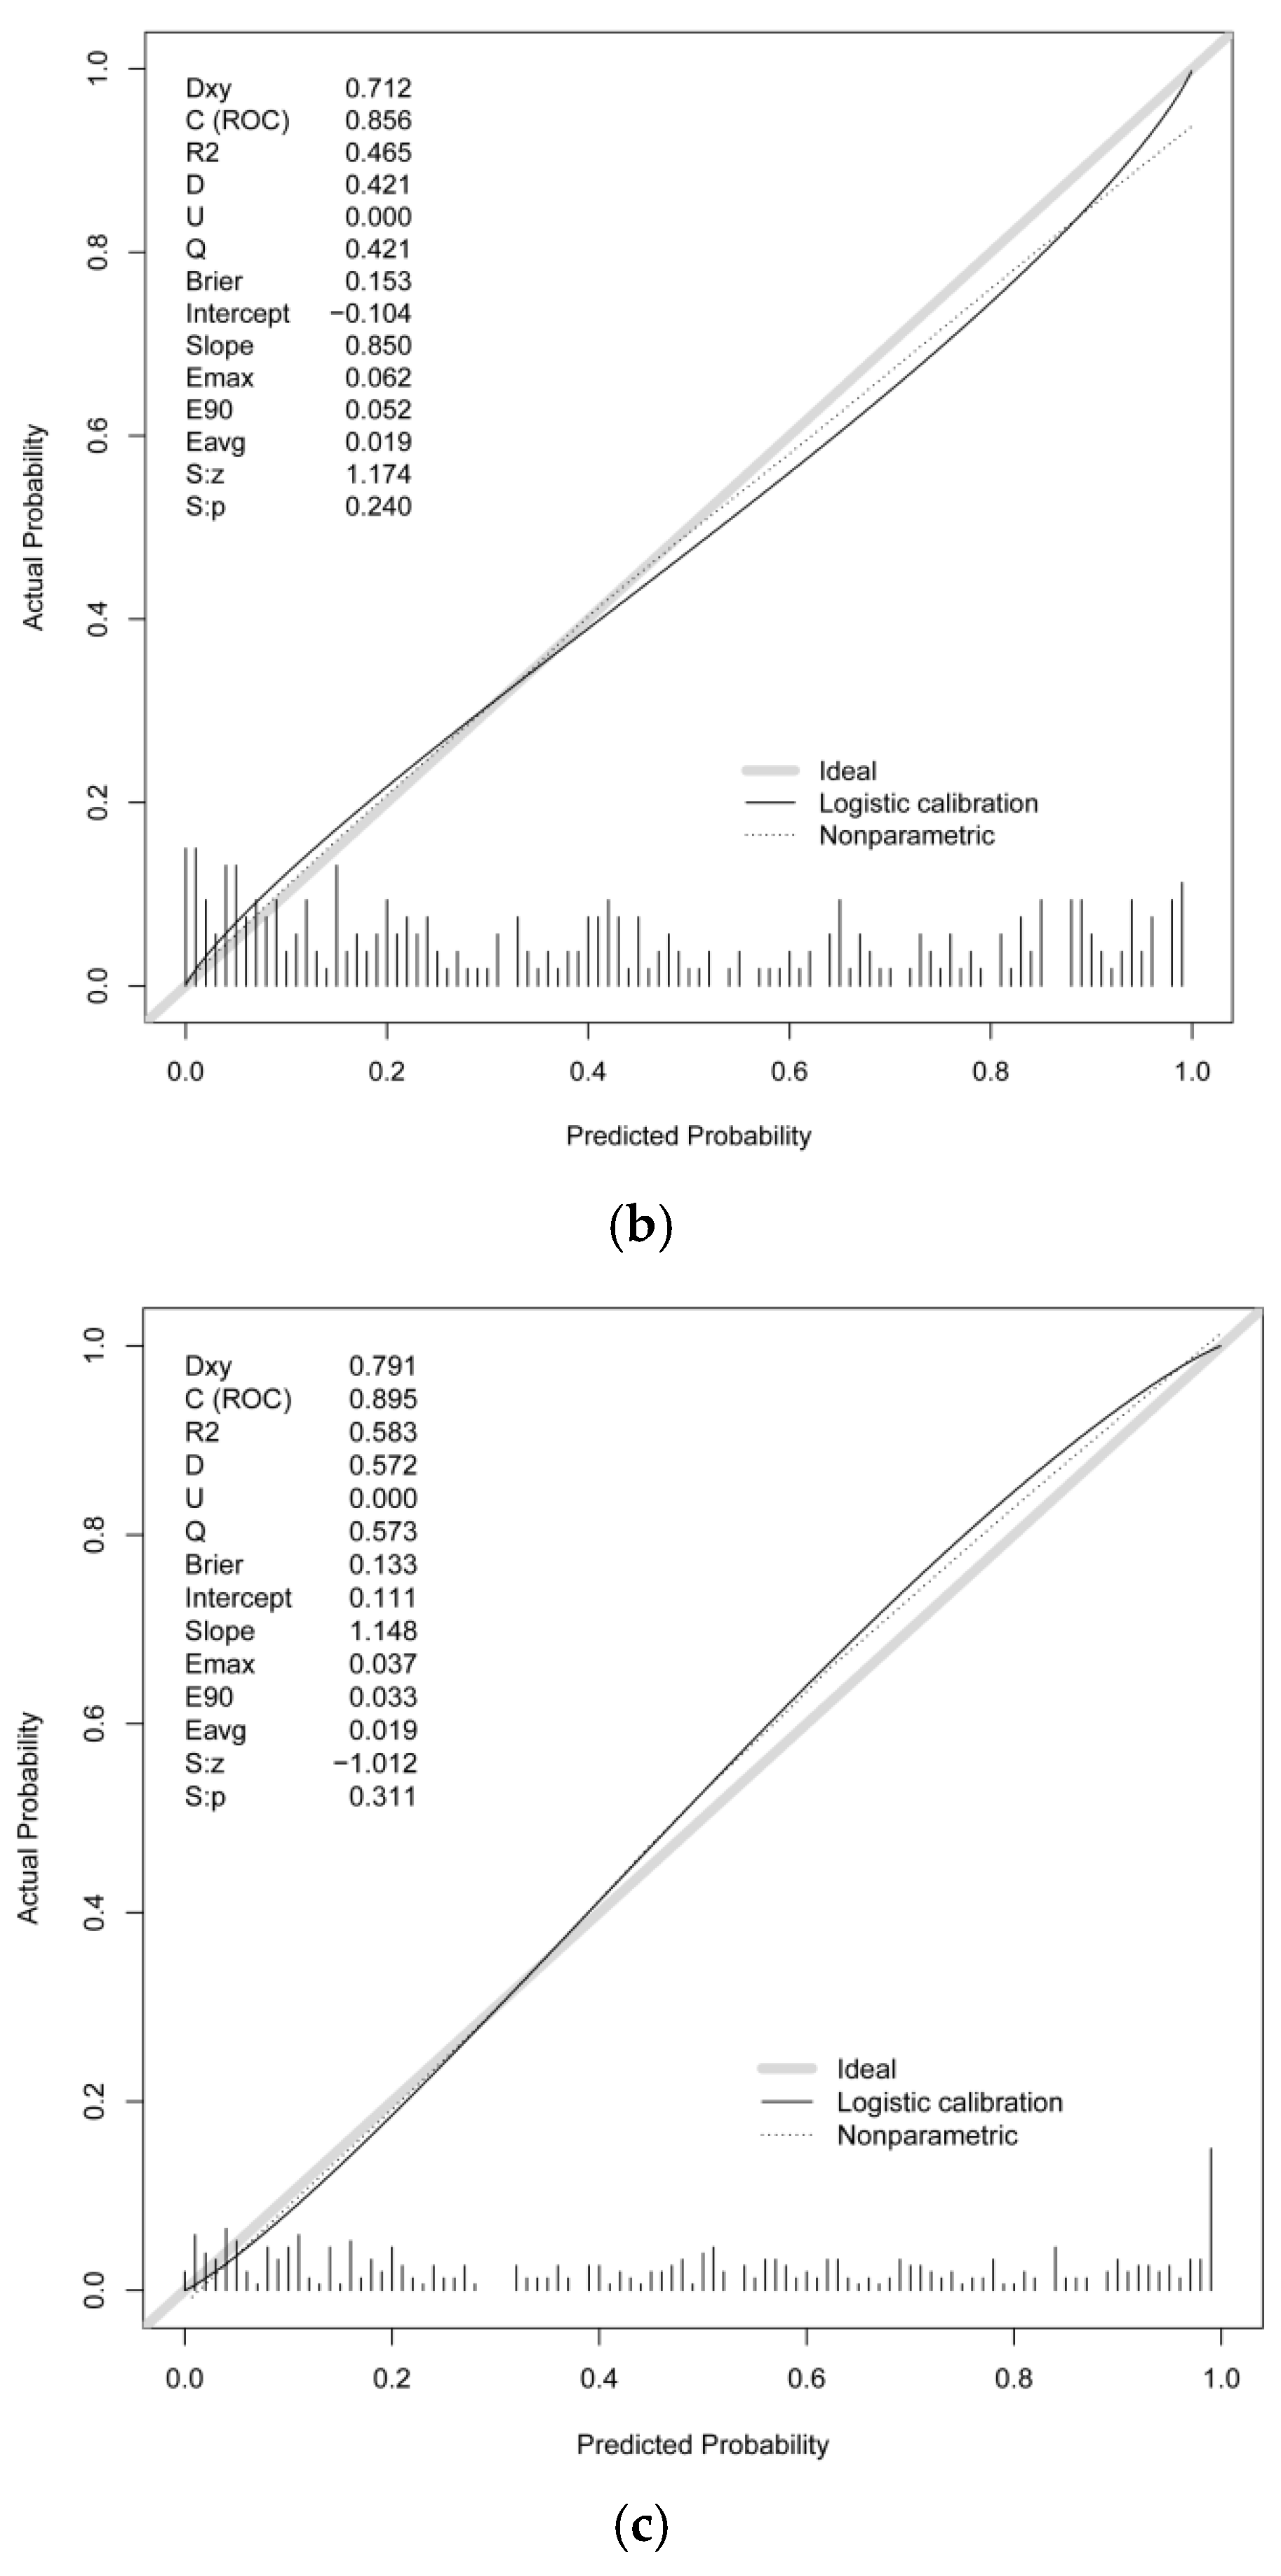
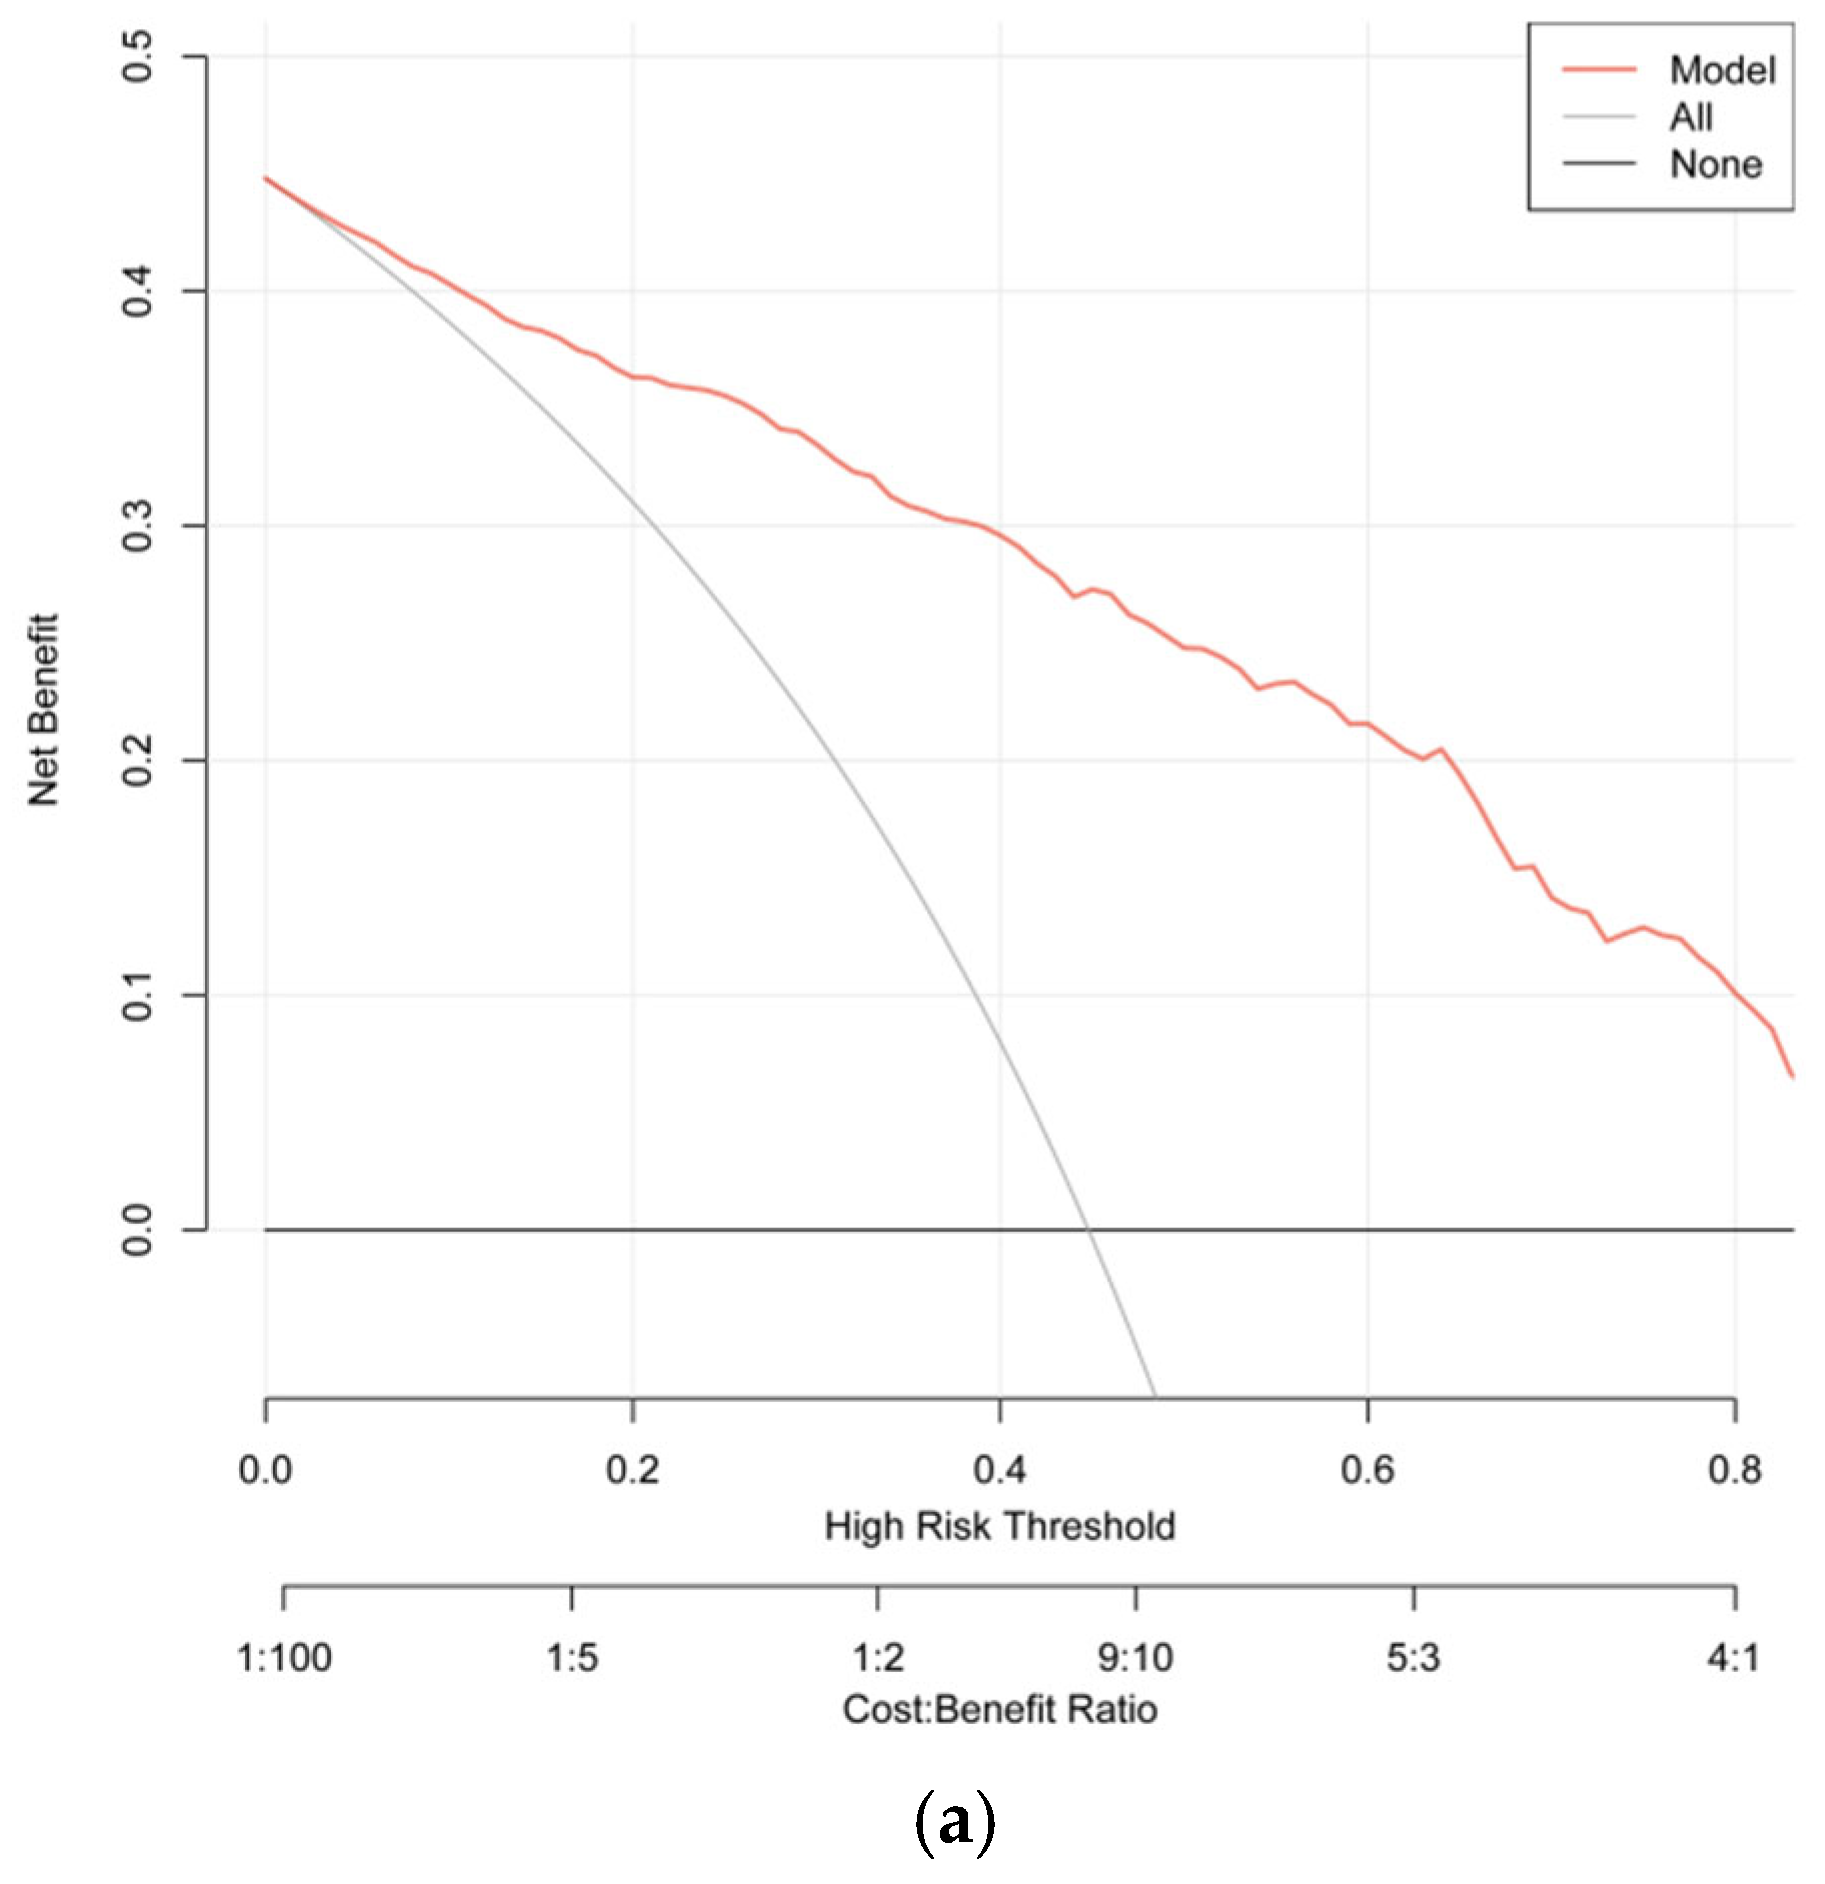
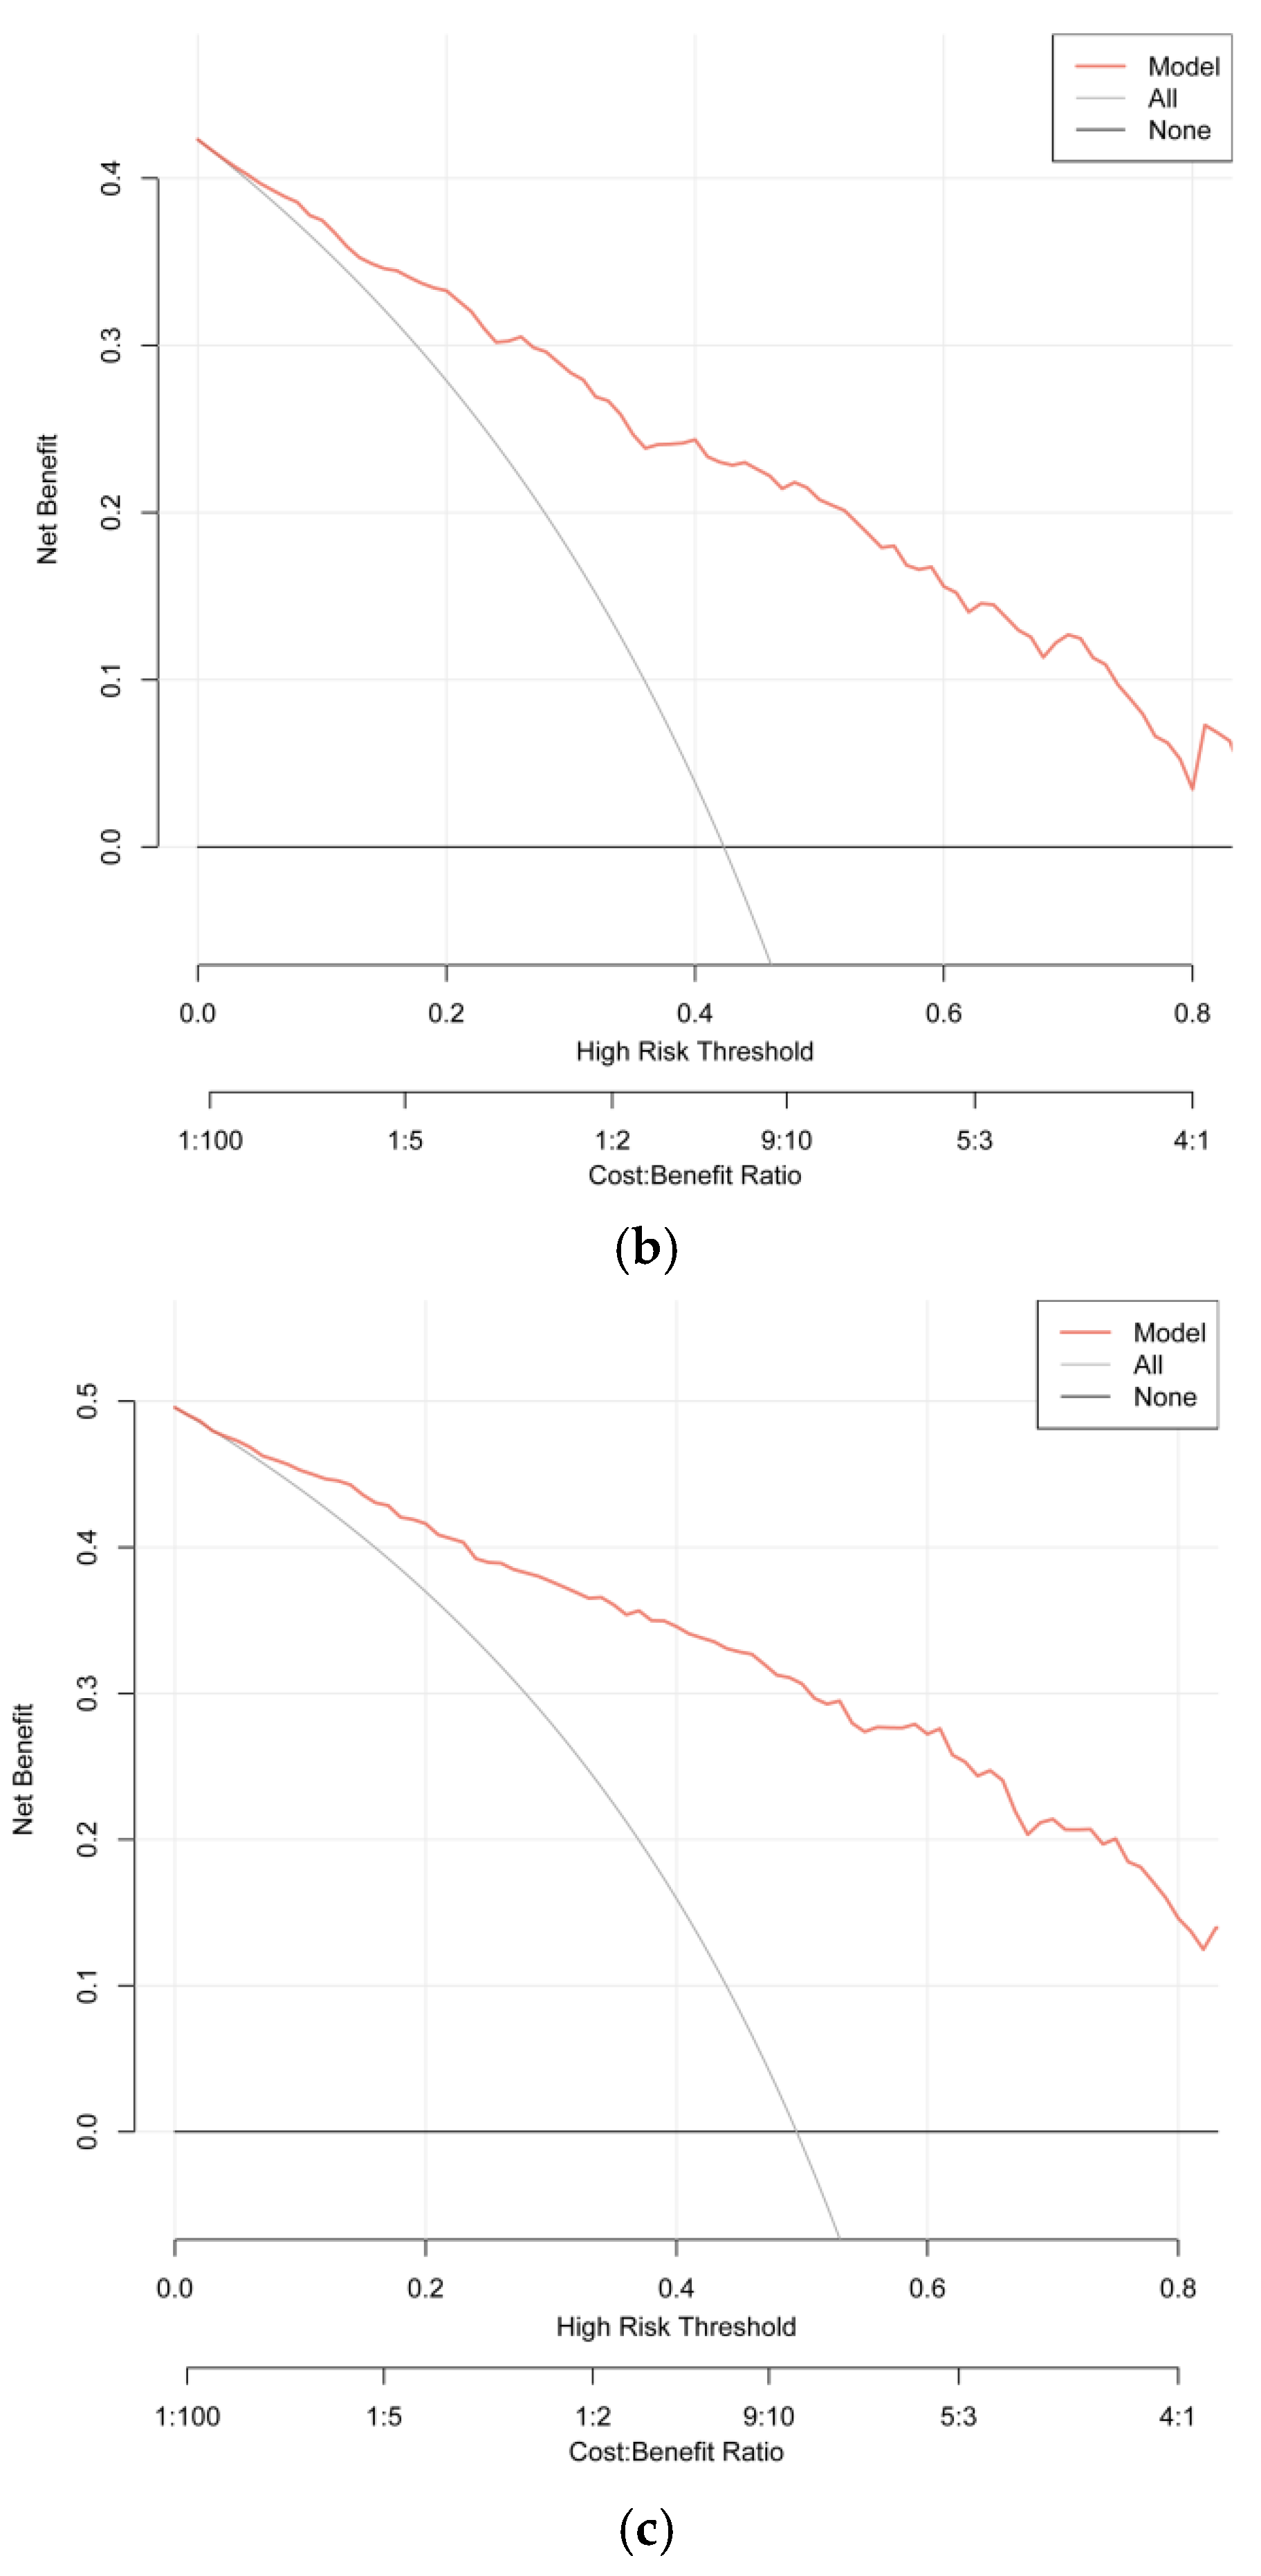
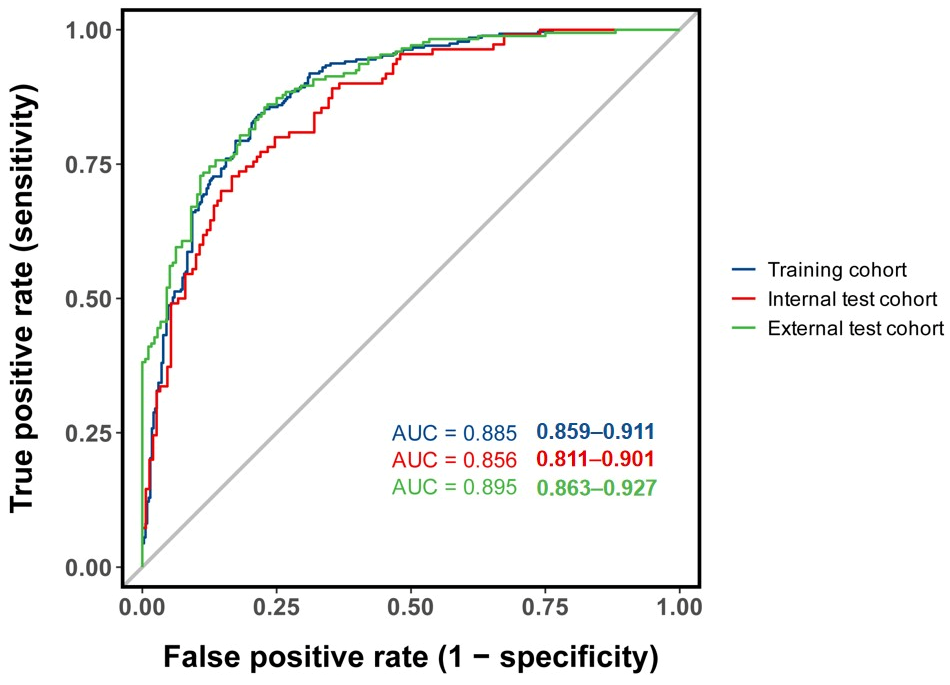
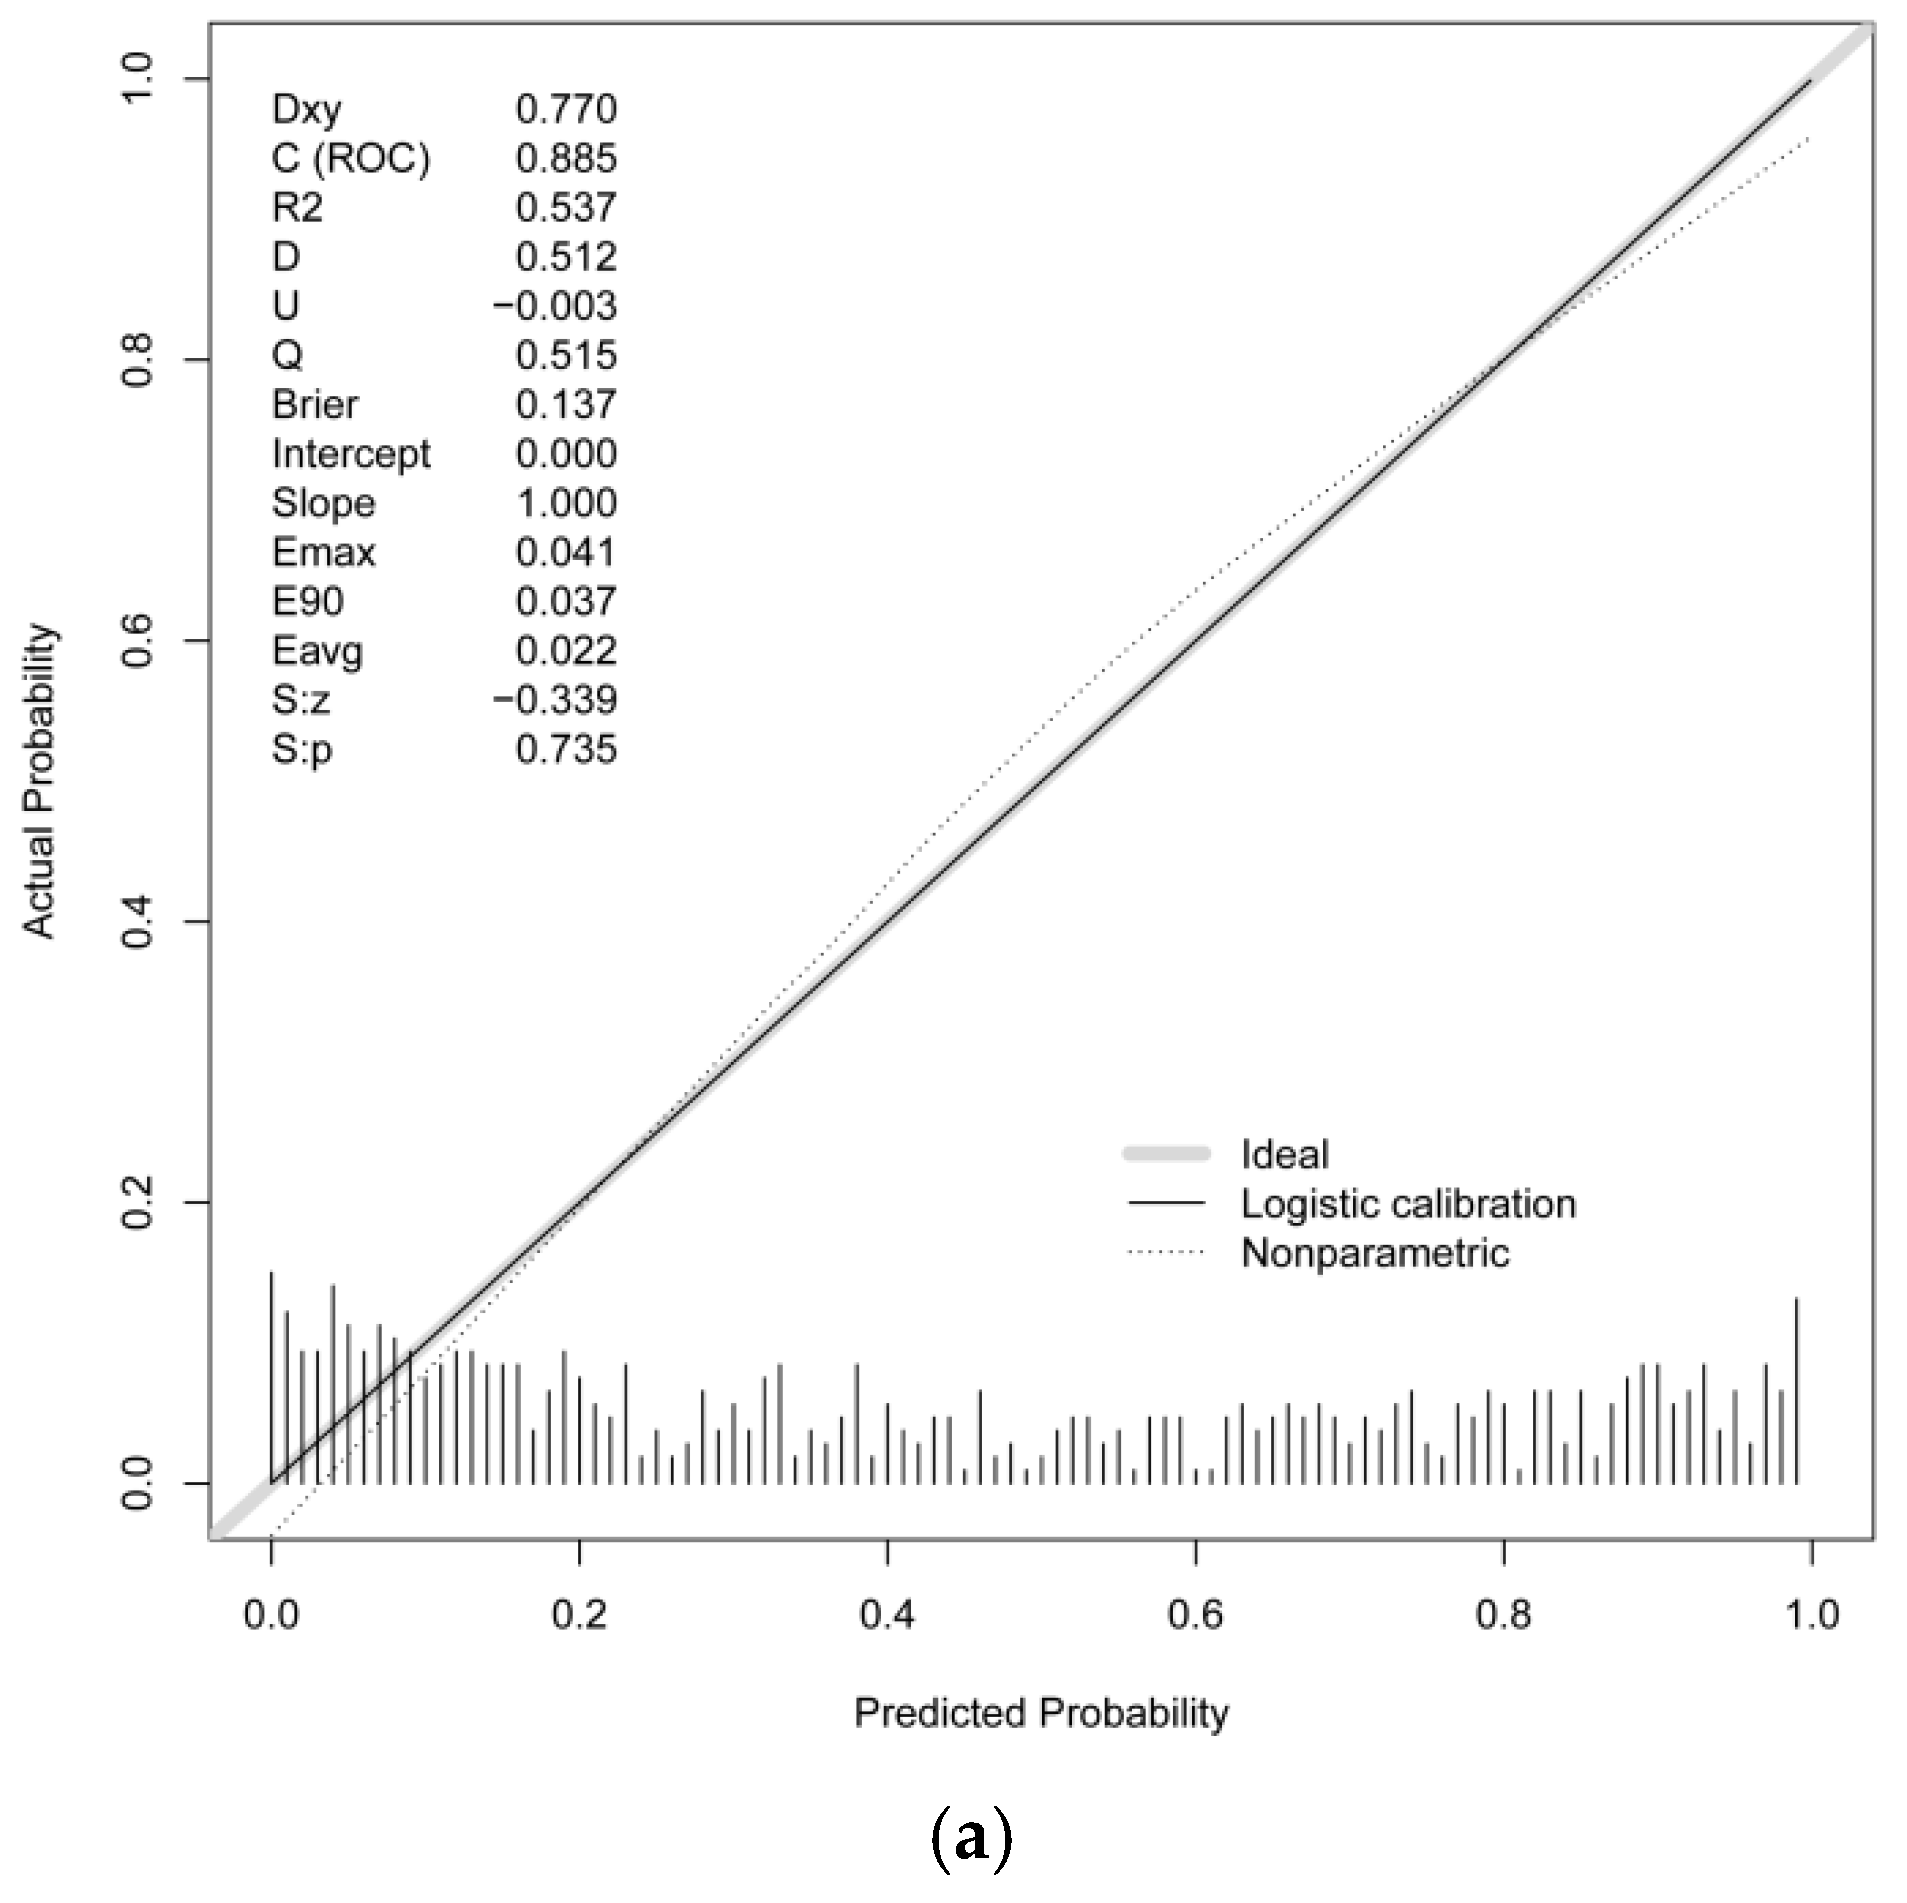
The AUC values were 0.885 (95% CI: 0.859–0.911) for the training set (cutoff: 0.395, sensitivity: 0.841, specificity: 0.784), 0.856 (95% CI: 0.811–0.901) for the internal validation set (cutoff: 0.481, sensitivity: 0.833, specificity: 0.727), and 0.895 (95% CI: 0.863–0.927) for the external validation set (cutoff: 0.560, sensitivity: 0.861, specificity: 0.767) (Figure 5). Additionally, the Nagelkerke R2 value of the final model was 0.5373, indicating that the nine selected predictors can explain 53.73% of the variance in SAIH incidence, reflecting a moderate-to-strong explanatory power of the model. Calibration curves showed good consistency between predicted and observed probabilities, supported by Hosmer–Lemeshow test results (training set: χ2 = 12.755, p = 0.121; internal validation set: χ2 = 9.395, p = 0.310; external validation set: χ2 = 2.432, p = 0.965) and favorable Brier scores (0.137, 0.153, and 0.133, respectively) (Figure 6). Decision curve analysis (DCA) showed that the standardized net benefit of the prediction model was significantly higher than that of both the “treat-all” and “treat-none” strategies (Figure 7).

4. Discussion

The present study developed a predictive model for SAIH in elderly patients, which exhibits good discriminative ability. Multivariable analysis identified nine independent predictors: age, BMI, dose of bupivacaine, sensory block level, baseline SBP, history of hypertension, IVSd, e’, and E/e’.
Previous studies have reported that the incidence of SAIH in elderly patients is 70% [5]. In contrast, the incidence of SAIH in our training set was significantly lower at 44.8%. This discrepancy may be attributed to the following reasons: (1) While prior studies defined hypotension as a >20% reduction in SBP from baseline [16,17], we adopted a stricter criterion of ≥30%, considering that older patients often have higher baseline SBP due to arterial stiffness, reduced vascular compliance, and lifestyle factors [18,19]. This stricter threshold enhances diagnostic specificity by minimizing the misclassification of physiological BP fluctuations and avoiding unnecessary interventions [20]. (2) We defined the elderly as ≥65 years [21], whereas earlier studies used a cutoff of ≥75 years [22]. Since the risk of hypotension increases with age, the inclusion of younger elderly patients may have contributed to the lower observed incidence. Our results confirmed known predictors such as age, history of hypertension history, BMI, sensory block level, and the dose of bupivacaine [5,23,24,25], while also identifying novel predictors, including baseline SBP, IVSd, e′, and E/e′.
The cardiovascular system undergoes substantial structural and functional changes with aging [26]. In older people, increased vascular stiffness, decreased adrenergic receptor responsiveness, and impaired autonomic reflexes contribute to both diastolic dysfunction and reduced myocardial contractility [27]. These changes diminish the compensatory response of cardiac output (CO) during hypoperfusion and impair the autoregulatory capacity to maintain systemic vascular resistance (SVR) [21], thereby increasing the risk of post-SA hypotension.
Obesity is associated with increased intra-abdominal pressure, which reduces cerebrospinal fluid (CSF) volume and weakens the supportive and regulatory effects of CSF on surrounding relevant structures. This, in turn, may compress the intervertebral foramina and inferior vena cava. Such compression further reduces CSF volume, potentially increasing the concentration of local anesthetics and promoting cephalad spread. However, the spread of local anesthetics is not linearly associated with CSF volume, and individual variability along with compensatory hemodynamic mechanisms contributes to heterogeneous responses [28,29,30]. This heterogeneity may be due to differences in study populations, anesthetic protocols, and the definition or monitoring of hypotension. Obesity may affect SA outcomes through multiple pathophysiological pathways involving the respiratory, cardiovascular, and endocrine systems [31].
There is a clear dose-dependent relationship between the administration of local anesthetics and the incidence of SAIH [32]. The core mechanism of hypotension following spinal anesthesia is vasodilation induced by sympathetic blockade, which subsequently reduces venous return [33]. Higher intrathecal doses of local anesthetics result in higher block levels, leading to more extensive sympathetic blockade and increasing the risk of SAIH [34]. Dose-reduction strategies have been consistently shown to reduce this risk [35,36]. Combining low-dose local anesthetics with opioids enhances analgesic efficacy while maintaining cardiovascular stability and facilitating faster recovery [37,38].
Higher sensory block levels are a major cause of SAIH, as they induce vasodilation and decrease SVR [32]. Sympathetic nerve fibers regulating vascular tone originate from T5–L1, and cardiac accelerator fibers arise from T1–T4 [39,40]. Thus, higher block levels result in more extensive sympathetic blockade and an increased risk of SAIH [41,42]. Several studies have reported an increased risk of hypotension at block levels of T5 or above [23,43]. Seltenrich et al. reported that different rates of sympathetic blockade may affect the incidence of hypotension, even when the final block levels are similar [44]. Therefore, both the block level and rate of ascent should be closely monitored to reduce the risk of SAIH.
Our study found that elevated preoperative SBP is an independent risk factor for SAIH. Patients with higher baseline BP may have elevated sympathetic activity and thus experience a more profound sympatholytic effect following SA, increasing their susceptibility to SAIH. This finding is consistent with that of Prashanth et al. [45], who reported that patients with increased preoperative sympathetic activity were more prone to hypotension.
Essential hypertension is more prevalent in the elderly due to arterial stiffness and endothelial dysfunction [46]. Chronic hypertension induces vascular wall thickening and reduced compliance, increasing the risk of SAIH. Racle et al. [47] reported that hypertensive patients have twice the risk of post-SA hypotension. Antihypertensive medications also influence this risk. Kaimar et al. [48] reported no significant difference in the incidence of SAIH between patients receiving β-blockers and those receiving calcium channel blockers, whereas Coriat et al. [49] reported that continuing ACEI on the day of surgery increased the risk of hypotension. Thus, both hypertension and its pharmacologic management significantly impact perioperative hemodynamic stability.
TTE has emerged as a crucial noninvasive bedside tool for the rapid assessment of cardiac function and volume status in the operating room [50]. Although left ventricular diastolic dysfunction (LVDD) affects 30% of the general population, its prevalence increases to 65–86% in the elderly [51,52]. Patients with LVDD are often asymptomatic at rest, with abnormalities only detected under stress [53]. Echocardiographic markers such as left atrial area, tricuspid regurgitant velocity, E/e’, e’, E, and E/A ratio are established indicators of LVDD [13,54,55]. e′ reflects early myocardial relaxation, and reduced values indicate diastolic dysfunction. In contrast to E, which is highly influenced by preload, e’ is a less preload-dependent parameter. E/e’ is an indicator that fully accounts for preload effects and is normalized by e’. Diastolic dysfunction leads to insufficient ventricular filling during diastole and a reduction in ventricular blood reserve; due to this inadequate diastolic filling, stroke volume decreases, and even with a compensatory increase in heart rate, cardiac output remains reduced. While SA-induced reduction in venous return contributes to SAIH, it is not the sole cause; decreased ventricular compliance leads to diastolic impairment, which ultimately restricts ventricular filling and reduces stroke volume. E is highly preload-dependent and primarily reflects instantaneous preload status, making it inadequate for the comprehensive assessment of these complex diastolic abnormalities. In contrast, e’ and E/e’ are less influenced by preload and better reflect intrinsic myocardial properties, thereby demonstrating superior predictive value for SAIH.
Our study newly identified IVSd as a potential predictor. The normal range of IVSd is approximately 6–12 mm, which can reflect the degree of myocardial hypertrophy and diastolic function status. IVSd is often elevated in patients with hypertension and hypertrophic cardiomyopathy [56]. Older patients may experience myocardial remodeling due to long-term hypertension, coronary heart disease, and other conditions, leading to IVSd thickening. IVSd thickening is associated with a decrease in ventricular diastolic compliance, which in turn results in diastolic dysfunction. In older patients with IVSd thickening and diastolic dysfunction, the left ventricular end-diastolic volume is reduced, and blood reserve is decreased. After SA, peripheral vasodilation further reduces venous return. Owing to the reduced ventricular volume and left ventricular outflow tract obstruction, the heart exhibits a decrease in stroke volume. Compared with normal IVSd, interventricular septal hypertrophy increases the incidence of coronary heart disease and myocardial infarction [57]. Nevertheless, further validation is needed to clarify its role in predicting SAIH.
Notably, the Nagelkerke R2 value of the final model was 0.5373, demonstrating that the nine identified predictors could collectively explain 53.73% of the variance in SAIH incidence. This moderate-to-strong explanatory power, in combination with the favorable discriminative ability (AUC = 0.885 in the training set and 0.895 in the external validation set) and favorable calibration performance, confirms that our model has robust statistical reliability and high clinical applicability. This superiority can be ascribed to the integration of echocardiographic parameters associated with left ventricular diastolic function, which effectively compensates for the inherent limitations of conventional models relying exclusively on clinical variables.
This study aimed to construct a nomogram to facilitate early identification of older patients at risk for SAIH. Current prevention strategies include fluid preloading and prophylactic vasopressor use [33]. Other effective measures involve correcting hypovolemia, limiting block height, using the Trendelenburg position to improve venous return, and employing cautious sedation [58]. However, several limitations of this study should be noted: (1) The time window for echocardiographic parameters involved in this study was excessively long. These parameters were not collected on the day before surgery or immediately before anesthesia, which fails to accurately reflect the patient’s physiological state during surgery. (2) Conventional echocardiographic parameters do not include indicators for evaluating volume status; thus, volume status indicators like IVCd and IVCCI were not incorporated into the model, failing to account for fasting-induced volume depletion. Moreover, this study lacks the inclusion of echocardiographic parameters related to cardiac valve function, such as the orifice area of the aortic valve and mitral valve, peak transvalvular flow velocity, and mean transvalvular pressure gradient. Aortic valve or mitral valve stenosis can seriously affect the hemodynamic stability of older patients, which may further impact the occurrence of SAIH. Future studies could expand the range of echocardiographic parameters and incorporate biomarkers such as inflammatory or myocardial injury markers. (3) The model exhibited excessively high performance in both internal and external validation sets, suggesting a potential overfitting issue; additionally, the single-center design may introduce selection bias and limit the generalizability of the findings. Therefore, further validation using multi-center external validation sets is required.

5. Conclusions

This study developed a predictive model integrating clinical and echocardiographic parameters for SAIH in older patients. Key independent predictors identified include age, BMI, bupivacaine dose, sensory block level, baseline SBP, history of hypertension, IVSd, e’, and E/e’. The model exhibits favorable predictive performance for clinical risk stratification and optimization of preventive strategies.

Supplementary Materials

The following supporting information can be downloaded at https://www.mdpi.com/article/10.3390/diagnostics16040557/s1, Table S1: Baseline characteristics of the training and internal validation sets.

Author Contributions

Conceptualization, B.W. and L.J.; methodology, B.W., L.J. and B.J.; software, B.W.; validation, B.W., Z.C. and B.J.; formal analysis, B.W.; investigation, B.W., Z.C. and Q.H.; resources, B.W., Z.C. and Q.H.; data curation, B.W. and Y.F.; writing—original draft preparation, B.W.; writing—review and editing, B.W.; visualization, B.W.; supervision, B.J. and L.J.; project administration, B.J. and L.J.; funding acquisition, B.J. All authors have read and agreed to the published version of the manuscript.

Funding

This research was funded by Research and Development Foundation of Peking University People’s Hospital, grant number RDL2024-11.

Institutional Review Board Statement

The study was conducted in accordance with the Declaration of Helsinki and approved by the Ethics Committee of Peking University People’s Hospital, Beijing, China (protocol code 2024PHB491-001, issued on 05 December 2024), and the study was registered at the Chinese Clinical Trial Registry (ChiCTR2500096902).

Informed Consent Statement

Patient consent was waived due to the retrospective design of the study and the use of fully anonymized data, which does not allow for identification of individual patients.

Data Availability Statement

The data presented in this study are not publicly available due to privacy and ethical restrictions. Anonymized data may be available from the corresponding author upon reasonable request, subject to institutional and data protection regulations.

Conflicts of Interest

The authors declare no conflicts of interest.

Abbreviations

SASpinal Anesthesia 
SAIHSpinal Anesthesia-Induced Hypotension
dIVCmaxMaximal Inferior Vena Cava Diameter
IVCCIInferior Vena Cava Collapsibility Index
ASAAmerican Society of Anesthesiologists Physical Status Classification System
ACEIAngiotensin-Converting Enzyme Inhibitors
ARBsAngiotensin II Receptor Blockers 
BPBlood Pressure
MAPMean Arterial Pressure
HRHeart Rate
LADLeft Atrial Diameter
IVSdInterventricular Septum Thickness at End-Diastole
LVESDLeft Ventricular End-Systolic Diameter
LVEDDLeft Ventricular End-Diastolic Diameter
LVPWDLeft Ventricular Posterior Wall Thickness at End-Diastole
LVMLeft Ventricular Mass
LVEDVLeft Ventricular End-diastolic Volume
LVESVLeft Ventricular End-systolic Volume 
EMitral Early Diastolic Peak Velocity
AMitral Late Diastolic Peak Velocity
e’Early Diastolic Mitral Annular Velocity
E/AE/A Ratio
E/e’E/e’ Ratio
BMIBody Mass Index
10 EPV10 Events Per Variable 
SDStandard Deviation 
LASSOLeast Absolute Shrinkage and Selection Operator 
ROC Receiver Operating Characteristic
AUCArea Under the Curve
DCADecision Curve Analysis
COCardiac Output 
SVRSystemic Vascular Resistance 
CSFCerebrospinal Fluid
TTETransthoracic Echocardiography
LVDDLeft Ventricular Diastolic Dysfunction

References

  1. Hartmann, B.; Junger, A.; Klasen, J.; Benson, M.; Jost, A.; Banzhaf, A.; Hempelmann, G. The Incidence and Risk Factors for Hypotension after Spinal Anesthesia Induction: An Analysis with Automated Data Collection. Anesth. Analg. 2002, 94, 1521–1529. [Google Scholar] [CrossRef] [PubMed]
  2. Messina, A.; La Via, L.; Milani, A.; Savi, M.; Calabrò, L.; Sanfilippo, F.; Negri, K.; Castellani, G.; Cammarota, G.; Robba, C.; et al. Spinal Anesthesia and Hypotensive Events in Hip Fracture Surgical Repair in Elderly Patients: A Meta-Analysis. J. Anesth. Analg. Crit. Care 2022, 2, 19. [Google Scholar] [CrossRef]
  3. Dobson, P.M.; Caldicott, L.D.; Gerrish, S.P.; Cole, J.R.; Channer, K.S. Changes in Haemodynamic Variables during Transurethral Resection of the Prostate: Comparison of General and Spinal Anaesthesia. Br. J. Anaesth. 1994, 72, 267–271. [Google Scholar] [CrossRef]
  4. Ferré, F.; Marty, P.; Bruneteau, L.; Merlet, V.; Bataille, B.; Ferrier, A.; Gris, C.; Kurrek, M.; Fourcade, O.; Minville, V.; et al. Prophylactic Phenylephrine Infusion for the Prevention of Hypotension after Spinal Anesthesia in the Elderly: A Randomized Controlled Clinical Trial. J. Clin. Anesth. 2016, 35, 99–106. [Google Scholar] [CrossRef]
  5. Minville, V.; Fourcade, O.; Grousset, D.; Chassery, C.; Nguyen, L.; Asehnoune, K.; Colombani, A.; Goulmamine, L.; Samii, K. Spinal Anesthesia Using Single Injection Small-Dose Bupivacaine versus Continuous Catheter Injection Techniques for Surgical Repair of Hip Fracture in Elderly Patients. Anesth. Analg. 2006, 102, 1559–1563. [Google Scholar] [CrossRef] [PubMed]
  6. Li, L.; He, L.-X.; Yao, Y.-T. The Efficacy and Safety of Pre-Emptive Methoxamine Infusion in Preventing Hypotension by in Elderly Patients Receiving Spinal Anesthesia: A PRISMA-Compliant Protocol for Systematic Review and Meta-Analysis. Medicine 2022, 101, e32262. [Google Scholar] [CrossRef]
  7. Beecham, G.; Cusack, R.; Vencken, S.; Crilly, G.; Buggy, D.J. Hypotension during Hip Fracture Surgery and Postoperative Morbidity. Ir. J. Med. Sci. 2020, 189, 1087–1096. [Google Scholar] [CrossRef]
  8. Mascha, E.J.; Yang, D.; Weiss, S.; Sessler, D.I. Intraoperative Mean Arterial Pressure Variability and 30-Day Mortality in Patients Having Noncardiac Surgery. Anesthesiology 2015, 123, 79–91. [Google Scholar] [CrossRef]
  9. Gu, W.-J.; Hou, B.-L.; Kwong, J.S.W.; Tian, X.; Qian, Y.; Cui, Y.; Hao, J.; Li, J.-C.; Ma, Z.-L.; Gu, X.-P. Association between Intraoperative Hypotension and 30-Day Mortality, Major Adverse Cardiac Events, and Acute Kidney Injury after Non-Cardiac Surgery: A Meta-Analysis of Cohort Studies. Int. J. Cardiol. 2018, 258, 68–73. [Google Scholar] [CrossRef] [PubMed]
  10. Yip, H.C.; Chan, P.Y.; Irwin, M.G. Perioperative Transthoracic Echocardiography Applications in Orthogeriatric Patients. Anaesth. Intensive Care Med. 2023, 24, 767–771. [Google Scholar] [CrossRef]
  11. Moschovaki, N.; Saranteas, T.; Spiliotaki, E.; Giannoulis, D.; Anagnostopoulos, D.; Talliou, C.; Milionis, O.; Briassoulis, P.; Katogiannis, K.; Papadimos, T. Point of Care Transthoracic Echocardiography for the Prediction of Post—Spinal Anesthesia Hypotension in Elderly Patients with Cardiac Diseases and Left Ventricular Dysfunction: Inferior Vena Cava and Post-Spinal Anesthesia Hypotension in Elderly Patients. J. Clin. Monit. Comput. 2023, 37, 1207–1218. [Google Scholar] [CrossRef]
  12. Saranteas, T.; Spiliotaki, H.; Koliantzaki, I.; Koutsomanolis, D.; Kopanaki, E.; Papadimos, T.; Kostopanagiotou, G. The Utility of Echocardiography for the Prediction of Spinal-Induced Hypotension in Elderly Patients: Inferior Vena Cava Assessment Is a Key Player. J. Cardiothorac. Vasc. Anesth. 2019, 33, 2421–2427. [Google Scholar] [CrossRef] [PubMed]
  13. Lairez, O.; Ferré, F.; Portet, N.; Marty, P.; Delmas, C.; Cognet, T.; Kurrek, M.; Carrié, D.; Fourcade, O.; Minville, V. Cardiovascular Effects of Low-Dose Spinal Anaesthesia as a Function of Age: An Observational Study Using Echocardiography. Anaesth. Crit. Care Pain Med. 2015, 34, 271–276. [Google Scholar] [CrossRef]
  14. Balachandran, V.P.; Gonen, M.; Smith, J.J.; DeMatteo, R.P. Nomograms in Oncology: More than Meets the Eye. Lancet Oncol. 2015, 16, e173–e180. [Google Scholar] [CrossRef]
  15. Bijker, J.B.; Persoon, S.; Peelen, L.M.; Moons, K.G.M.; Kalkman, C.J.; Kappelle, L.J.; van Klei, W.A. Intraoperative hypotension and perioperative ischemic stroke after general surgery: A nested case-control study. Anesthesiology 2012, 116, 658–664. [Google Scholar]
  16. Šklebar, I.; Bujas, T.; Habek, D. SPINAL ANAESTHESIA-INDUCED HYPOTENSION IN OBSTETRICS: PREVENTION AND THERAPY. Acta Clin. Croat. 2019, 58, 90–95. [Google Scholar] [CrossRef]
  17. Klöhr, S.; Roth, R.; Hofmann, T.; Rossaint, R.; Heesen, M. Definitions of Hypotension after Spinal Anaesthesia for Caesarean Section: Literature Search and Application to Parturients. Acta Anaesthesiol. Scand. 2010, 54, 909–921. [Google Scholar] [CrossRef] [PubMed]
  18. Pimenta, E.; Oparil, S. Management of Hypertension in the Elderly. Nat. Rev. Cardiol. 2012, 9, 286–296. [Google Scholar] [CrossRef]
  19. Sri Hari, T.Y.; Sree Sudha, T.Y.; Varghese, A.M.; Krishna Sasanka, K.S.B.S.; Thangaraju, P. A Study of Risk Factors and Complications in Elderly Hypertensive Subjects. J. Family Med. Prim. Care 2021, 10, 2230–2234. [Google Scholar] [CrossRef]
  20. Ibrahim, S.S.; Patil, B. A Comparative Study of Infusion of Ephedrine and Phenylephrine on Hemodynamic Stability After Spinal Anesthesia in Elderly Patients Undergoing Lower Limb Orthopedic Surgeries. Cureus 2024, 16, e69977. [Google Scholar] [CrossRef]
  21. Jakobsson, J.; Kalman, S.H.; Lindeberg-Lindvet, M.; Bartha, E. Is Postspinal Hypotension a Sign of Impaired Cardiac Performance in the Elderly? An Observational Mechanistic Study. Br. J. Anaesth. 2017, 119, 1178–1185. [Google Scholar] [CrossRef] [PubMed]
  22. Nakanishi, K.; Daimon, M. Aging and Myocardial Strain. J. Med. Ultrason. (2001) 2022, 49, 53–60. [Google Scholar] [CrossRef]
  23. Kyokong, O.; Charuluxananan, S.; Sriprajittichai, P.; Poomseetong, T.; Naksin, P. The Incidence and Risk Factors of Hypotension and Bradycardia Associated with Spinal Anesthesia. J. Med. Assoc. Thai. 2006, 89, S58–S64. [Google Scholar]
  24. Tarkkila, P.; Isola, J. A Regression Model for Identifying Patients at High Risk of Hypotension, Bradycardia and Nausea during Spinal Anesthesia. Acta Anaesthesiol. Scand. 1992, 36, 554–558. [Google Scholar] [CrossRef]
  25. Algarni, R.A.; Albakri, H.Y.; Albakri, L.A.; Alsharif, R.M.; Alrajhi, R.K.; Makki, R.M.; Khan, M.A.; Kayal, H. Incidence and Risk Factors of Spinal Anesthesia-Related Complications After an Elective Cesarean Section: A Retrospective Cohort Study. Cureus 2023, 15, e34198. [Google Scholar] [CrossRef]
  26. Ferrari, A.U. Modifications of the Cardiovascular System with Aging. Am. J. Geriatr. Cardiol. 2002, 11, 30–33. [Google Scholar] [CrossRef]
  27. Priebe, H.J. The Aged Cardiovascular Risk Patient. Br. J. Anaesth. 2000, 85, 763–778. [Google Scholar] [CrossRef]
  28. Hogan, Q.H.; Prost, R.; Kulier, A.; Taylor, M.L.; Liu, S.; Mark, L. Magnetic Resonance Imaging of Cerebrospinal Fluid Volume and the Influence of Body Habitus and Abdominal Pressure. Anesthesiology 1996, 84, 1341–1349. [Google Scholar] [CrossRef]
  29. Greene, N.M. Distribution of Local Anesthetic Solutions within the Subarachnoid Space. Anesth. Analg. 1985, 64, 715–730. [Google Scholar] [CrossRef]
  30. Pitkänen, M.T. Body Mass and Spread of Spinal Anesthesia with Bupivacaine. Anesth. Analg. 1987, 66, 127–131. [Google Scholar] [CrossRef]
  31. Powell-Wiley, T.M.; Poirier, P.; Burke, L.E.; Després, J.-P.; Gordon-Larsen, P.; Lavie, C.J.; Lear, S.A.; Ndumele, C.E.; Neeland, I.J.; Sanders, P.; et al. Obesity and Cardiovascular Disease: A Scientific Statement From the American Heart Association. Circulation 2021, 143, e984–e1010. [Google Scholar] [CrossRef]
  32. Lee, J.E.; George, R.B.; Habib, A.S. Spinal-Induced Hypotension: Incidence, Mechanisms, Prophylaxis, and Management: Summarizing 20 Years of Research. Best Pract. Res. Clin. Anaesthesiol. 2017, 31, 57–68. [Google Scholar] [CrossRef]
  33. Ferré, F.; Martin, C.; Bosch, L.; Kurrek, M.; Lairez, O.; Minville, V. Control of Spinal Anesthesia-Induced Hypotension in Adults. Local Reg. Anesth. 2020, 13, 39–46. [Google Scholar] [CrossRef]
  34. Acar, N.S.; Uzman, S.; Toptas, M.; Vahapoglu, A.; Akkoc, I.; Dinc, S.C. Spinal Anesthesia with Hyperbaric Bupivacaine: A Comparison of Hypertensive and Normotensive Patients. Med. Sci. Monit. 2013, 19, 1109–1113. [Google Scholar] [CrossRef] [PubMed][Green Version]
  35. Van de Velde, M. Low-Dose Spinal Anesthesia for Cesarean Section to Prevent Spinal-Induced Hypotension. Curr. Opin. Anaesthesiol. 2019, 32, 268–270. [Google Scholar] [CrossRef]
  36. Qiu, M.-T.; Lin, F.-Q.; Fu, S.-K.; Zhang, H.-B.; Li, H.-H.; Zhang, L.-M.; Li, Q. Combination of Low-Dose Bupivacaine and Opioids Provides Satisfactory Analgesia with Less Intraoperative Hypotension for Spinal Anesthesia in Cesarean Section. CNS Neurosci. Ther. 2012, 18, 426–432. [Google Scholar] [CrossRef]
  37. Fischer, H.B.J.; Simanski, C.J.P. A Procedure-Specific Systematic Review and Consensus Recommendations for Analgesia after Total Hip Replacement. Anaesthesia 2005, 60, 1189–1202. [Google Scholar] [CrossRef]
  38. Tejwani, G.A.; Rattan, A.K.; McDonald, J.S. Role of Spinal Opioid Receptors in the Antinociceptive Interactions between Intrathecal Morphine and Bupivacaine. Anesth. Analg. 1992, 74, 726–734. [Google Scholar] [CrossRef]
  39. Zhang, N.; He, L.; Ni, J.-X. Level of Sensory Block after Spinal Anesthesia as a Predictor of Hypotension in Parturient. Medicine 2017, 96, e7184. [Google Scholar] [CrossRef]
  40. Chen, H.S.; van Roon, L.; Ge, Y.; van Gils, J.M.; Schoones, J.W.; DeRuiter, M.C.; Zeppenfeld, K.; Jongbloed, M.R.M. The Relevance of the Superior Cervical Ganglion for Cardiac Autonomic Innervation in Health and Disease: A Systematic Review. Clin. Auton. Res. 2024, 34, 45–77. [Google Scholar] [CrossRef] [PubMed]
  41. Hallworth, S.P.; Fernando, R.; Columb, M.O.; Stocks, G.M. The Effect of Posture and Baricity on the Spread of Intrathecal Bupivacaine for Elective Cesarean Delivery. Anesth. Analg. 2005, 100, 1159–1165. [Google Scholar] [CrossRef] [PubMed]
  42. Coppejans, H.C.; Hendrickx, E.; Goossens, J.; Vercauteren, M.P. The Sitting versus Right Lateral Position during Combined Spinal-Epidural Anesthesia for Cesarean Delivery: Block Characteristics and Severity of Hypotension. Anesth. Analg. 2006, 102, 243–247. [Google Scholar] [CrossRef] [PubMed]
  43. Chumpathong, S.; Chinachoti, T.; Visalyaputra, S.; Himmunngan, T. Incidence and Risk Factors of Hypotension during Spinal Anesthesia for Cesarean Section at Siriraj Hospital. J. Med. Assoc. Thai. 2006, 89, 1127–1132. [Google Scholar]
  44. Yorozu, T.; Morisaki, H.; Kondoh, M.; Zenfuku, M.; Shigematsu, T. Comparative Effect of 6% Hydroxyethyl Starch (Containing 1% Dextrose) and Lactated Ringer’s Solution for Cesarean Section under Spinal Anesthesia. J. Anesth. 2002, 16, 203–206. [Google Scholar] [CrossRef]
  45. Prashanth, A.; Chakravarthy, M.; George, A.; Mayur, R.; Hosur, R.; Pargaonkar, S. Sympatho-Vagal Balance, as Quantified by ANSindex, Predicts Post Spinal Hypotension and Vasopressor Requirement in Parturients Undergoing Lower Segmental Cesarean Section: A Single Blinded Prospective Observational Study. J. Clin. Monit. Comput. 2017, 31, 805–811. [Google Scholar] [CrossRef] [PubMed]
  46. Glazier, J.J. Pathophysiology, Diagnosis, and Management of Hypertension in the Elderly. Int. J. Angiol. 2022, 31, 222–228. [Google Scholar] [CrossRef] [PubMed]
  47. Racle, J.P.; Poy, J.Y.; Haberer, J.P.; Benkhadra, A. A Comparison of Cardiovascular Responses of Normotensive and Hypertensive Elderly Patients Following Bupivacaine Spinal Anesthesia. Reg. Anesth. 1989, 14, 66–71. [Google Scholar] [CrossRef]
  48. Kaimar, P.; Sanji, N.; Upadya, M.; Mohammed, K.R. A Comparison of Hypotension and Bradycardia Following Spinal Anesthesia in Patients on Calcium Channel Blockers and β-Blockers. Indian J. Pharmacol. 2012, 44, 193–196. [Google Scholar] [CrossRef]
  49. Coriat, P.; Richer, C.; Douraki, T.; Gomez, C.; Hendricks, K.; Giudicelli, J.F.; Viars, P. Influence of Chronic Angiotensin-Converting Enzyme Inhibition on Anesthetic Induction. Anesthesiology 1994, 81, 299–307. [Google Scholar] [CrossRef]
  50. Katsnelson, Y.; Raman, J.; Katsnelson, F.; Mor-Avi, V.; Heller, L.B.; Jayakar, D.; Bacha, E.; Jeevanandam, V. Current State of Intraoperative Echocardiography. Echocardiography 2003, 20, 771–780. [Google Scholar] [CrossRef]
  51. Redfield, M.M.; Jacobsen, S.J.; Burnett, J.C.; Mahoney, D.W.; Bailey, K.R.; Rodeheffer, R.J. Burden of Systolic and Diastolic Ventricular Dysfunction in the Community: Appreciating the Scope of the Heart Failure Epidemic. JAMA 2003, 289, 194–202. [Google Scholar] [CrossRef]
  52. Rosamond, W.; Flegal, K.; Friday, G.; Furie, K.; Go, A.; Greenlund, K.; Haase, N.; Ho, M.; Howard, V.; Kissela, B.; et al. Heart Disease and Stroke Statistics--2007 Update: A Report from the American Heart Association Statistics Committee and Stroke Statistics Subcommittee. Circulation 2007, 115, e69–e171. [Google Scholar] [CrossRef] [PubMed]
  53. Nicoara, A.; Swaminathan, M. Diastolic Dysfunction, Diagnostic and Perioperative Management in Cardiac Surgery. Curr. Opin. Anaesthesiol. 2015, 28, 60–66. [Google Scholar] [CrossRef]
  54. Mitter, S.S.; Shah, S.J.; Thomas, J.D. A Test in Context: E/A and E/e’ to Assess Diastolic Dysfunction and LV Filling Pressure. J. Am. Coll. Cardiol. 2017, 69, 1451–1464. [Google Scholar] [CrossRef]
  55. Nagueh, S.F.; Smiseth, O.A.; Appleton, C.P.; Byrd, B.F.; Dokainish, H.; Edvardsen, T.; Flachskampf, F.A.; Gillebert, T.C.; Klein, A.L.; Lancellotti, P.; et al. Recommendations for the Evaluation of Left Ventricular Diastolic Function by Echocardiography: An Update from the American Society of Echocardiography and the European Association of Cardiovascular Imaging. Eur. Heart J. Cardiovasc. Imaging 2016, 17, 1321–1360. [Google Scholar] [CrossRef] [PubMed]
  56. Park, S.K.; Jung, J.Y.; Kang, J.G.; Chung, P.-W.; Oh, C.-M. Left Ventricular Geometry and Risk of Incident Hypertension. Heart 2019, 105, 1402–1407. [Google Scholar] [CrossRef] [PubMed]
  57. Yang, Y.; Li, Z.; Guo, X.; Zhou, Y.; Chang, Y.; Yang, H.; Yu, S.; Ouyang, N.; Chen, S.; Sun, G.; et al. Interventricular Septum Thickness for the Prediction of Coronary Heart Disease and Myocardial Infarction in Hypertension Population: A Prospective Study. J. Clin. Med. 2022, 11, 7152. [Google Scholar] [CrossRef]
  58. McCrae, A.F.; Wildsmith, J.A. Prevention and Treatment of Hypotension during Central Neural Block. Br. J. Anaesth. 1993, 70, 672–680. [Google Scholar] [CrossRef] [PubMed]
Figure 1. Flowchart of this study.
Diagnostics 16 00557 g001
Figure 2. Feature selection using LASSO regression. (a). LASSO coefficient profiles of 16 clinical features. The plot was created using a logarithmic scale for the lambda values. A vertical line was added to indicate the lambda value selected through tenfold cross-validation. This optimal lambda value led to the identification of nine features with nonzero coefficients. (b). The optimal parameter λ selection in the LASSO model employed tenfold cross-validation using a minimum criterion approach. The optimal values of λ are represented by dotted vertical lines. Among these values, λ = 0.022 was selected as the optimal choice.
Diagnostics 16 00557 g002aDiagnostics 16 00557 g002b
Figure 3. Nomogram for predicting SAIH in older patients.
Diagnostics 16 00557 g003
Figure 4. Web-based dynamic nomogram.
Diagnostics 16 00557 g004
Figure 5. Discriminative performance of the nomogram. Training set (blue line), AUC: 0.885, 95% CI: (0.859–0.911); internal validation (red line), AUC: 0.856, 95%, CI: (0.811–0.901); external validation (green line), AUC: 0.895, 95% CI: (0.863–0.927).
Diagnostics 16 00557 g005
Figure 6. Calibration analysis of the nomogram. (a) Training set; (b) internal test set; (c) external test set.
Diagnostics 16 00557 g006aDiagnostics 16 00557 g006b
Figure 7. Clinical utility assessment by decision curve analysis. (a) Training set; (b) Internal test set; (c) External test set. Clinical model (red line), total (gray line, indicating assumption of hypotension in all patients), and none (horizontal solid line, black line, indicating assumption of hypotension in no patients).
Diagnostics 16 00557 g007aDiagnostics 16 00557 g007b
Table 1. Baseline characteristics of the training, internal validation, and external test sets.
CharacteristicTraining Set, N = 605Internal Test Set, N = 260External Test Set, N = 349
Control
N = 334
Hypotension
N = 271
pControl
N = 150
Hypotension
N = 110
pControl
N = 176
Hypotension
N = 173
p
Sex   0.726  0.070  0.481
Male 104 (31.14%)88 (32.47%) 48 (32.00%)24 (21.82%) 43 (24.43%)48 (27.75%) 
Female 230 (68.86%)183 (67.53%) 102 (68.00%)86 (78.18%) 133 (75.57%)125 (72.25%) 
Age(y) 72.00 (68.00, 75.00)73.00 (69.00, 78.00)<0.00172.00 (69.00, 77.00)72.00 (68.00, 78.00)0.60471.00 (67.00, 74.00)73.00 (69.00, 79.00)<0.001
ASA Physical Status Classification   0.192  0.231  0.005
II 243 (72.75%)184 (67.90%) 106 (70.67%)70 (63.64%) 127 (72.16%)100 (57.80%) 
III 91 (27.25%)87 (32.10%) 44 (29.33%)40 (36.36%) 49 (27.84%)73 (42.20%) 
Height (cm) 162.00 (158.00, 168.00)160.00 (156.00, 166.00)0.041161.00 (158.00, 168.00)158.50 (155.00, 164.00)0.008160.00 (156.00, 167.00)161.00 (157.00, 167.00)0.498
Weight (kg) 65.00 (58.00, 72.00)68.00 (60.00, 75.00)0.01367.00 (60.00, 71.00)65.00 (58.50, 75.00)0.61760.00 (55.00, 65.00)66.00 (60.00, 73.00)<0.001
Body Mass Index (kg/m2) 24.77 (22.86, 27.44)25.85 (23.34, 28.65)<0.00125.04 (23.34, 27.34)25.35 (22.77, 28.40)0.48823.23 (22.04, 24.03)25.39 (23.80, 27.34)<0.001
Type of Surgery   0.549  0.961  0.969
Orthopedics 228 (68.26%)196 (72.32%) 110 (73.33%)82 (74.55%) 139 (78.98%)136 (78.61%) 
Gynecology 44 (13.17%)32 (11.81%) 22 (14.67%)16 (14.55%) 16 (9.09%)15 (8.67%) 
Urology 62 (18.56%)43 (15.87%) 18 (12.00%)12 (10.91%) 21 (11.93%)22 (12.72%) 
Fasting Duration (h) 13.77 (11.72, 15.35)12.18 (9.50, 17.27)0.10813.64 (11.77, 15.43)12.31 (9.50, 17.18)0.33213.43 (11.28, 16.03)12.40 (9.50, 15.35)0.031
Preoperative Fluid Administration (mL) 220.83 (0.00, 418.75)22.92 (0.00, 658.75)0.221205.21 (0.00, 429.17)38.54 (0.00, 647.50)0.343179.17 (0.00, 503.12)50.00 (0.00, 418.75)0.048
Dose of Bupivacaine (mg) 12.00 (10.50, 13.50)13.50 (12.00, 15.00)<0.00112.00 (10.00, 13.50)12.50 (10.50, 15.00)<0.00110.50 (10.50, 13.50)12.00 (12.00, 15.00)<0.001
Sensory Block Level 8.00 (8.00, 10.00)8.00 (6.00, 8.00)<0.0018.00 (8.00, 10.00)8.00 (6.00, 8.00)<0.0018.00 (8.00, 10.00)8.00 (6.00, 8.00)<0.001
Baseline Systolic Blood Pressure (mmHg) 141.50 (130.00, 151.00)151.00 (140.00, 163.00)<0.001139.50 (128.00, 150.00)150.00 (140.00, 162.00)<0.001138.50 (127.00, 151.00)150.00 (141.00, 161.00)<0.001
Baseline Diastolic Blood Pressure (mmHg) 74.95 ± 10.13375.74 ± 10.4660.34874.53 ± 10.14276.90 ± 10.4510.06975.13 ± 9.59774.94 ± 10.0060.858
Baseline Mean Arterial Pressure (mmHg) 96.83 ± 9.352100.95 ± 9.620<0.00196.17 ± 8.931101.35 ± 9.714<0.00196.44 ± 9.43899.76 ± 7.827<0.001
Baseline Heart Rate (bpm) 73.00 (66.00, 81.00)75.00 (67.00, 82.00)0.16471.00 (65.00, 78.00)76.00 (70.00, 85.00)<0.00171.50 (65.00, 78.00)74.00 (66.00, 82.00)0.023
History of Hypertension 128 (38.32%)189 (69.74%)<0.00160 (40.00%)74 (67.27%)<0.00199 (56.25%)118 (68.21%)0.021
History of Diabetes Mellitus 71 (21.26%)64 (23.62%)0.48828 (18.67%)23 (20.91%)0.65341 (23.30%)55 (31.79%)0.076
History of Coronary artery Disease 44 (13.17%)43 (15.87%)0.34816 (10.67%)14 (12.73%)0.60729 (16.48%)28 (16.18%)0.941
Left Atrial Anterior Posterior Diameter (cm) 3.50 (3.30, 3.90)3.60 (3.40, 4.00)0.0083.60 (3.30, 3.90)3.65 (3.30, 4.00)0.3913.60 (3.30, 3.90)3.70 (3.40, 4.00)0.006
Interventricular Septum Thickness at End-Diastole (mm) 8.70 (7.90, 9.60)9.00 (8.10, 10.00)0.0058.70 (7.90, 9.70)8.60 (8.10, 9.50)0.5108.90 (8.10, 9.50)9.70 (8.50, 11.00)<0.001
Left Ventricular End-Diastolic Diameter (cm) 4.80 (4.50, 5.10)4.80 (4.50, 5.10)0.2284.70 (4.50, 5.00)4.75 (4.50, 5.00)0.6144.80 (4.50, 5.10)4.70 (4.40, 5.00)0.075
Left Ventricular End-Systolic Diameter (cm) 2.90 (2.70, 3.20)3.00 (2.80, 3.20)0.3332.95 (2.70, 3.20)2.90 (2.70, 3.20)0.4113.00 (2.80, 3.20)2.90 (2.70, 3.10)0.006
Left Ventricular Posterior Wall Thickness at End-Diastole (cm) 0.87 (0.78, 0.94)0.87 (0.80, 0.95)0.1540.87 (0.80, 0.95)0.87 (0.80, 0.94)0.5590.87 (0.80, 0.94)0.87 (0.80, 0.94)0.840
Left Ventricular Mass (g) 140.55 (117.60, 161.00)146.30 (125.40, 168.40)0.013139.85 (121.70, 163.90)138.30 (123.30, 155.50)0.991142.50 (118.95, 164.20)138.60 (117.60, 158.30)0.212
Left Ventricular Ejection Fraction (%) 67.84 (63.68, 72.22)67.83 (64.08, 71.27)0.82068.09 (63.77, 72.10)69.18 (65.26, 71.89)0.24866.62 (62.81, 69.43)67.81 (63.46, 72.15)0.026
Left Ventricular End-Diastolic Volume (mL) 105.75 (91.70, 122.00)108.80 (94.10, 122.00)0.262103.95 (91.40, 120.30)104.35 (91.40, 118.10)0.697107.90 (91.40, 122.06)102.20 (88.10, 116.20)0.070
Left Ventricular End-Systolic Volume (mL) 33.45 (27.20, 39.70)33.70 (29.00, 39.70)0.37033.55 (27.00, 40.10)31.70 (26.20, 39.70)0.38934.60 (30.55, 39.70)33.00 (27.20, 38.30)0.008
Mitral Early Diastolic Peak Velocity (cm/s) 64.70 (54.60, 77.50)69.90 (58.30, 82.10)0.00365.60 (54.60, 82.60)65.30 (57.50, 78.30)0.56667.50 (58.60, 78.80)71.30 (56.20, 86.90)0.126
Mitral Late Diastolic Peak Velocity (cm/s) 92.50 (83.70, 104.70)97.10 (84.00, 111.00)0.00792.45 (82.10, 103.10)97.25 (86.50, 110.90)0.01495.30 (85.00, 103.25)102.00 (87.80, 112.70)0.004
E/A Ratio 0.69 (0.60, 0.80)0.69 (0.58, 0.81)0.7890.71 (0.59, 0.83)0.66 (0.59, 0.81)0.2870.71 (0.63, 0.80)0.69 (0.59, 0.81)0.348
Mitral Annular Early Diastolic Velocity (cm/s) 5.70 (4.70, 7.00)4.50 (3.80, 5.30)<0.0015.81 (4.90, 6.80)4.27 (3.60, 4.90)<0.0015.43 (4.74, 6.49)4.32 (3.46, 5.14)<0.001
E/e’ Ratio 11.50 (9.29, 13.92)15.04 (13.48, 16.50)<0.00111.99 (9.46, 14.22)15.02 (13.80, 17.00)<0.00113.00 (10.70, 14.50)15.50 (14.00, 19.10)<0.001
Table 2. Multivariate logistic regression analysis of independent predictors for spinal anesthesia-induced hypotension.
VariableβSEZ ValueOR95% CIp Value
Age (y)0.0800.0204.0051.0831.042, 1.127<0.001
Body Mass Index (kg/m2)0.0990.0352.8261.1041.031, 1.1820.005
Dose of Bupivacaine (mg)0.1950.0553.5651.2161.092, 1.354<0.001
Sensory Block Level−0.3440.090−3.8090.7090.594, 0.846<0.001
Baseline Systolic Blood Pressure (mmHg)0.0310.0083.8771.0311.015, 1.047<0.001
History of Hypertension0.5790.2332.481  0.013
Yes   1.7831.129, 2.820 
No   -- 
Interventricular Septum Thickness at End-Diastole (mm)0.1900.0902.1061.2101.013, 1.4440.035
e’ Mitral Annular Early Diastolic Velocity (cm/s)−0.2730.097−2.8160.7610.630, 0.9200.005
E/e’ Ratio0.2540.0445.7411.2891.182, 1.405<0.001
Disclaimer/Publisher’s Note: The statements, opinions and data contained in all publications are solely those of the individual author(s) and contributor(s) and not of MDPI and/or the editor(s). MDPI and/or the editor(s) disclaim responsibility for any injury to people or property resulting from any ideas, methods, instructions or products referred to in the content.