


Abstract
Background: Obesity, defined as an abnormal accumulation of body fat, is becoming a global epidemic. Individuals with obesity may present with increased abdominal fat, which is associated with hypertension, altered respiratory mechanics, higher resting heart rate, and may contribute to an increased cardiovascular risk. Physiological parameters, such as heart rate, blood pressure, respiratory rate, and oxygen saturation, can change hours before the occurrence of a clinically relevant adverse event. Thus, physiological parameters can be considered good predictors of clinical deterioration. Obesity is also associated with physical dysfunctions that can impair physical performance. The non-pharmacological therapeutic strategy for the treatment of obesity involves lifestyle modifications, including a healthy diet and regular physical exercise. Whole-body vibration (WBV) exercise, a type of physical activity, has demonstrated benefits in several specific populations, including obese individuals. Objectives: The objective of this study was to evaluate the immediate effects of a single whole-body vibration (WBV) exercise session, consisting of 15 sets, using a vibration platform (VP) with alternating vertical or lateral displacement, on physiological parameters, perceived exertion, strength, and functionality in obese adults. Methods: Seventy-two obese adult participants were randomly divided into three groups (vertical group, alternating lateral group, and placebo group). Physiological parameters were assessed before, during, and after the intervention, in addition to perceived exertion, functionality, and muscle strength. Results: When comparing the results before and after the intervention, the heart rate–pressure product increased significantly in the alternating lateral group (p = 0.005), and heart rate increased significantly (p = 0.0001) and then decreased significantly (p = 0.030) only in the alternating lateral group. Post hoc analysis revealed a significant increase in perceived exertion in the lateral alternation group, from the period before the intervention to the 10th set (p = 0.006) and from the period before to the period after the intervention (p = 0.011). In the vertical group, a significant increase was observed from the period before the intervention to the 10th set (p = 0.020). Conclusions: In conclusion, considering all the findings of this study, whole-body vibration (WBV) exercise promoted some immediate changes in physiological parameters and perception of effort in obese adults. WBV exercise with the alternating vibration platform induced significant fluctuations in heart rate and increased the heart rate–blood pressure product, although with values within the normal range. Perception of effort increased in all groups. Considering the absence of discrepant changes in physiological parameters, impact on the cardiovascular system, and fatigue, the WBV exercise intervention in side-alternating or vertical vibration vibratory platforms can be considered a viable non-conventional exercise option for the obese population.
1. Introduction
Obesity is a health condition characterized by excessive accumulation of body fat, often resulting from an interplay of genetic, behavioral, and environmental factors. Its global prevalence has been steadily increasing, accompanied by a rise in the incidence of associated comorbidities [1], such as hypertension. [2]. Notably, the prevalence of hypertension among obese individuals with a BMI ≥ 30 kg/m2 is 42.5%, compared to 15.3% in non-obese individuals. This increase in the prevalence of hypertension among individuals with obesity may be attributed to the accumulation of fat in the abdominal region, mainly related to visceral fat, which is a strong determinant of elevated BP levels [3].
Abdominal and thoracic fat deposition, in addition to affecting BP levels, may also lead to a reduction in respiratory capacity [4]. This fat accumulation compresses and impairs diaphragmatic and thoracic mobility, leading to changes in lung compliance and respiratory resistance, which ultimately reduce lung volume and increase respiratory rate (RR) and dyspnea [5]. Dyspnea is a common symptom in individuals with obesity and may be associated with body mass gain, even in the absence of respiratory diseases [6]. Furthermore, Garg et al. (2016) [7] suggest that increased abdominal circumference is a negative regulator of arterial oxygen saturation (SpO2) in both diabetic and non-diabetic obese patients. Therefore, obesity could be considered a contributing factor to hypoxia [7].
Obesity is also associated with various cardiovascular health problems such as coronary artery disease and heart failure [8]. Heart rate (HR) is commonly used as an indicator of cardiovascular function, reflecting the heart’s ability to respond to metabolic demands [9]. Studies have shown that individuals with obesity may present a higher resting HR compared to non-obese individuals [10,11], possibly due to increased metabolic demand and autonomic imbalance with enhanced sympathetic activity [12]. In this context, individuals with obesity tend to report a higher perceived effort during physical exercise (PE) compared to lean individuals and oxidize less body fat during submaximal exercise [13]. Therefore, monitoring perceived exertion in these individuals and developing PE strategies to increase fat oxidation and reduce perceptions of discomfort during PE may improve exercise tolerance and adherence and facilitate fat mass reduction [14].
In addition to its influence on the cardiovascular system, obesity is also associated with sarcopenic obesity, characterized by low muscle mass and high body fat, which impairs musculoskeletal tissue in both youth and older adulthood [15]. The implications of reduced muscle strength relative to body mass in the lower limbs may contribute to impaired physical performance, including slower walking speed, increased risk of falls, and a higher risk of joint diseases [16]. Aging and obesity progression also contribute to muscle quality decline due to intramuscular fat accumulation [17].
According to studies, changes in physiological parameters such as HR, BP, RR, and SpO2 occur several hours before an important adverse event takes place [18]. Therefore, physiological parameters can predict deterioration hours before clinical adverse events [19]. Moreover, they represent simple and low-cost information collected at the bedside, in outpatient settings, or in research environments, identifying health deterioration, management responses to clinical situations, and monitoring interventions involving PE [20].
Regular PE improves cardiovascular and metabolic function, muscle mass, strength, and physical performance in obesity [21]. PE benefits involve multifactorial mechanisms, including energy balance regulation [22]. However, barriers such as poor fitness, joint pain, and social embarrassment reduce adherence to traditional PE programs in obese individuals [23]. Therefore, it would be useful to develop and study PE alternatives that can positively and safely encourage adherence in this population to PE [24].
Whole-body vibration (WBV) exercise is generated in an individual exposed to mechanical vibration produced in a vibrating platform (VP) during systemic vibratory therapy (SVT) [25]. WBV exercise has been reported as a modality of PE for various populations, including individuals with obesity [26]. In general, individuals appear to have good adherence to WBV exercise because the exercises can be easily performed with rest periods between sets and potentially lower perceived exertion [27].
The VP promotes SVT to the entire body through two different transmission systems of mechanical vibrations: (i) vertical VP, where the base of the VP performs uniform vertical displacements, moving up and down, and (ii) side-alternating VP, where the base of the VP performs alternating lateral displacements, like a seesaw [28].
The posture adopted (standing, sitting), the type of exercise (dynamic or static), work and rest time, and the number of sets performed, as well as the intensity of the vibratory stimulus defined by the formula a Peak = 2 × π2 × f2 × PPD (a Peak = peak acceleration in m/s2; f = frequency in hertz; PPD = peak-to-peak displacement in millimeters), may vary considerably and influence the intended intervention effect [29].
In SVT, the vibratory stimulus is transmitted to muscles and tendons during WBV exercise. Consequently, a cyclic transition between eccentric and concentric muscle contractions occurs, leading to a neuromuscular response of chronic adaptations to the intervention effect through muscle spindles and rapidly adapting mechanoreceptors, potentially resulting in improved neuromuscular performance [30].
Immediate WBV exercise protocols may contribute to improvements in flexibility, physical performance, and increased oxygen uptake [31]. Although WBV exercise appears to be a promising modality for enhancing physical performance, there is a gap in the literature regarding conclusive evidence on immediate-effect protocols of WBV exercise using two different types of vibration platforms and investigating physiological parameters, perceived exertion, and functionality in obese participants. Therefore, the aim of this study was to assess the immediate effects of a single WBV exercise session using vertical and side-alternating vibrating platforms on physiological parameters, perceived exertion, strength, and functionality in adults with obesity. The hypothesis is that a single session of whole-body vibration (WBV) exercise, performed on a vertical or side-alternating vibration platform, may promote changes in physiological parameters, functionality, and perceived exertion in obese adults.
2. Methods
2.1. Study Design/Participants
The current randomized, interventional study, with participant and outcome assessor blinding, was conducted at the Laboratório de Vibrações mecânicas e Práticas Integrativas (LAVIMPI), Universidade do Estado do Rio de Janeiro, from 2022 to 2024. The protocol was approved by the ethics committee under registration number CAAE 30649620.1.0000.5259 and approved on 6 May 2020 [32]. Participants were recruited from the endocrinology department of the Policlinica Universitária Piquet Carneiro, Universidade do Estado do Rio de Janeiro, and from the general community between October 2022 and October 2023. Potential participants were identified through consultation of service records and dissemination in the community through posters and social networks.
Initial contact was made by telephone by a previously trained researcher, who provided detailed information about the objectives, procedures, and duration of the study. During this contact, an initial screening was conducted to verify the main eligibility criteria. All participants signed the informed consent form, and the procedures were performed at LAVIMPI in the morning.
2.2. Randomization and Masking
In this study, sample randomization was performed using the online randomization tool available at https://www.random.org/lists/ [33]. This website generated a numbered random sequence list containing three groups: (1) vertical group; (2) side-alternating group; and (3) sham group (SG). A researcher not involved in the collection prepared opaque, sealed and numbered envelopes, each containing the group allocation and trial order, randomized accordingly.
On the day of randomization, each participant drew a numbered, sealed envelope and handed it to the researcher responsible for administering the intervention. Participants had no access to information regarding their group allocation. All results were recorded anonymously using participant identification numbers and were transferred to the blinded statistical analysis team prior to final processing. Both the participants and the statistician were blinded to allocation. All assessments were performed in a controlled laboratory setting, maintaining ambient conditions (22–24 °C).
2.3. Eligibility Criteria
Eligible patients were men and women aged 18 to 59 years with a diagnosis of grade 1 or grade 2 obesity (BMI between 30 and 39.9 kg/m2), as defined by the World Health Organization (WHO) criteria [34], and who provided written informed consent. The age range and BMI were defined to ensure greater homogeneity within the group.
The exclusion criteria were considered to be individuals with BP levels above BP ≥ 180/110 mmHg, cardiovascular diseases manifested in the last 6 months, pregnant women, abuse or use of psychiatric medications, cardiac pacemaker wearers, any disease that prevents the individual from maintaining the orthostatic position in VP and individuals who had any contraindication to the protocols of the intervention.
Study procedures, including assessments and interventions, were as follows: All participants were instructed to refrain from engaging in any strenuous physical activity for 48 h prior to the intervention. None reported any cardiorespiratory or musculoskeletal problems that could interfere with the protocol.
2.4. Procedures
2.4.1. Outcome Measures
Anamnesis: During the anamnesis, data were collected regarding sex, age, history of chronic diseases (DM2, systemic arterial hypertension) and current use of medications, smoking habits, alcohol consumption, and whether the patient performs regular PE. These data were used to promote a greater understanding of the results obtained and to characterize the sample.
2.4.2. Anthropometric Measurements
Anthropometric measurements were performed by experienced and trained researchers. Participants were instructed to stand in the standing position, and with the body areas to be evaluated undressed.
- Height was measured using a stadiometer attached to an electronic scale (MIC 200 PPA, Micheletti, São Paulo, Brazil) [35];
- Body mass was measured using an electronic scale of the bioelectrical impedance device (In Body 370, BIOSPACE, Seoul, Republic of Korea) [36];
- The body mass index (BMI) was calculated by dividing the body mass (kg) by the height squared (m2) [37]. BMI was classified according to the WHO criteria: obesity class I, BMI between 30 and 34.9 kg/m2; obesity class II, BMI between 35 and 39.9 kg/m2 [38].
- Waist circumference (WC) assessment was measured with non-stretchable, flexible tape at the midpoint between the last rib and the iliac crest [37]. WC > than 102 cm in men and greater than 88 cm in women indicates abdominal obesity [39]. All measurements were recorded by experienced staff to minimize variability, with each measurement taken three times and the average used for analysis [39].
- Hip circumference (HC) was measured using a non-flexible tape measure (tape measure: 0.1 cm) at the level of the widest part of the gluteal region [40]. Values below 95 cm for men and 108 cm for women are recommended [41].
- Calf circumference was measured on the right leg at the point of maximum circumference using a non-flexible tape (precision: 0.1 cm). Cutoff points of 32 cm for women and 34 cm for men are associated with greater predictive ability for reduced muscle mass in adults [42].
- Neck circumference (NC) was measured with the participants standing, head in the Frankfurt horizontal plane, using a tape placed below the laryngeal prominence, perpendicular to the longest axis of the neck. Mean values of 39.5 cm (standard deviation [SD] ± 3.6) for men and 34.0 cm (SD ± 2.9) for women are reported; values above these thresholds are associated with increased cardiovascular risk [43].
- Waist-to-hip ratio (WHR) was calculated by dividing the WC (cm) by the HC (cm). Cutoff points were 0.85 for women and 0.90 for men [44].
- Waist-to-height ratio (WHtR) was calculated by dividing the WC (cm) by the height (cm); WHtR correlates well with body fat and predicts hypertension, a key complication of obesity. A cutoff point of 0.50 was used for both sexes to indicate increased metabolic risk [45].
- Body composition was assessed using a Tetrapolar Electrical Bioimpedance Analyzer (In Body 370, BIOSPACE, Republic of Korea), following the manufacturer’s recommendations to ensure standardization [46]. Participants were instructed to fast for 4 h; refrain from PE for 12 h; avoid coffee or alcohol for 48 h prior to assessment; empty bladder; wear swimwear or light clothing; stand for 5 min before collection; and remove bracelets, watches, shoes, and socks [46]. Parameters analyzed included body fat mass (kg), fat-free mass (kg), metabolic basal task, and trunk fat percentage (%).
2.4.3. Blood Pressure
Systolic blood pressure (SBP) and diastolic blood pressure (DBP) were measured using a properly calibrated digital sphygmomanometer (Omron HEM-RML31, Omron Healthcare, Kyoto, Japan).
The measurement was performed after a 5 min rest period. Participants were instructed to refrain from PE for at least 90 min and to avoid alcoholic beverages, coffee, food, or smoking within 30 min prior to assessment. At the time of measurement, participants were asked to empty the bladder and position their left arm at heart level, with the palm facing upwards, ensuring that clothing did not constrict the arm [47].
The cuff was selected according to arm circumference and positioned without gaps, 2–3 cm above the cubital fossa, with the middle of the inflatable bag centered over the brachial artery [48].
Measurements were performed three times with a 1 min interval. The average of three BP measurements was used for statistical analysis [48]. The cutoff points considered were (i) normal (systolic pressure < 120 mmHg and diastolic pressure < 80 mmHg), (ii) high (systolic pressure from 120 to 129 mmHg and diastolic pressure < 80 mmHg), (iii) stage 1 hypertension (systolic pressure from 130 to 139 mmHg or diastolic pressure from 80 to 89 mmHg), and (iv) stage 2 hypertension (systolic pressure ≥ 140 mmHg or diastolic pressure ≥ 90 mmHg) and/or use of antihypertensive medications [48].
2.4.4. Heart Rate
HR was assessed using a calibrated digital sphygmomanometer (Omron HEM-RML31, Omron Healthcare, Kyoto, Japan) and during the intervention, HR was measured after the 5th and 10th sets using a portable digital pulse oximeter (G. Tech, OLED Graph (MD300C23), Beijing Choice Electronic Technology Co., Ltd., Beijing, China), and values were recorded in beats per minute (bpm).
Considering the normal reference range for HR, values between 60 and 100 bpm were regarded as within the physiological limits. HR was monitored at the following time points during the intervention: (i) before the intervention; (ii) after the 5th set; (iii) after the 10th set; and (iv) after the intervention [49].
2.4.5. Mean Arterial Pressure, Rate–Pressure Product, and Pulse Pressure
Mean arterial pressure (MAP) reflects cardiac workload and organ perfusion. It is calculated as (SBP + 2 × DBP)/3. MAP represents the average arterial pressure throughout a complete cardiac cycle, encompassing both systole and diastole. Values well above the normal range may indicate cardiovascular stress and potential organ damage, whereas values below 60 mm Hg may indicate insufficient blood supply to the organs, with a risk of organ failure. The normal range varies between 70 and 110 mmHg [50].
The rate–pressure product (RPP) is considered an index marker of myocardial oxygen demand (MVO2). MVO2 may be a good predictor of cardiovascular disease. RPP is calculated as the product of SBP and HR [51].
Pulse pressure (PP) is a risk factor for the development of heart disease; an increase of just 10 mmHg in pulse pressure increases cardiovascular risk by up to 20%. The coefficient of PP variation can reflect the magnitude of blood pressure fluctuation within a cardiac cycle and was calculated using the formula PP = SBP − DBP. A pulse pressure less than 25% of systolic pressure is considered inappropriately low or narrow, while a pulse pressure greater than 100 is considered high or wide [52].
2.4.6. Respiratory Rate
The RR assessment was conducted in a quiet room by an experienced health researcher with the patient comfortably seated in a chair. RR measurements were made by counting breaths, with the evaluator carefully monitoring chest movements for one minute using a digital stopwatch, without the volunteers being aware of the process, so that no changes in the respiratory pattern occurred.
The normal reference range for adults is typically 12–20 breaths per minute (bpm). Slow breathing was defined as RR < 12 bpm, and tachypnea as RR > 20 bpm [53]. RR was measured three times before starting the intervention and three times after completing the intervention. The average of these values was recorded and used in the analyses [53].
2.4.7. Arterial Oxygen Saturation
SpO2 was measured using a portable pulse oximeter (G. Tech, OLED Graph (MD300C23), Beijing Choice Electronic Technology Co., Ltd.) placed on the second finger of the right hand, with nails free of polish. Values greater than 95% were considered normal [54]. Measurements were taken at four time points: before the intervention, after the 5th set, after the 10th set, and after the intervention. At the beginning and end of the intervention, participants rested in a seated position for 10 min before three measurements were recorded at 1 min intervals; the mean value was used for analysis.
2.4.8. Perceived Exertion (BORG Scale)
The Borg Rating of Perceived Exertion (RPE) scale (0–10) was used to evaluate the participants’ subjective effort during the intervention. Participants were shown a printed scale and asked, “How tired are you?”, with responses ranging from 0 (no fatigue) to 10 (maximum fatigue) [55]. The scale was applied at four time points: before the intervention, after the 5th set, after the 10th set, and after the intervention.
2.4.9. Handgrip Strength/Dynamometry
Handgrip strength (HGS) was assessed using the American Society of Hand Therapists (ASHT) protocol. Participants sat comfortably with their feet shoulder-width apart, shoulders slightly adducted, elbows at 90°, forearms in a neutral position, and wrists extended between 0° and 30° [56]. Three maximal grip attempts were performed per limb (right and left), each lasting three seconds, with a 1 min rest between attempts to prevent fatigue [57]. All measurements were recorded in kilograms, and the mean value of three repeated trials was used for subsequent analysis.”,Cutoff values vary by sex, age, body mass, and hand dominance [58,59].
2.4.10. Functionality Assessment
To assess functionality and physical performance, participants underwent the Short Physical Performance Battery test (SPPB), conducted by an experienced researcher. The SPPB is a tool used to evaluate functional capacity in adults, comprising three test categories: static balance, gait speed, and muscle strength. It includes three standing balance tests (feet side by side, semi-tandem, and tandem positions), with the maximum score awarded if the participant maintains balance for 10 s in each test; a timed 3 m walk at normal pace, recording the best of two attempts; and a timed sit-to-stand test measuring the time to complete five repetitions of sitting and standing from a standardized chair, with arms crossed in front of the body. Performance in each category is scored from 0 to 4 points, with a total score ranging from 0 to 12. The test battery takes approximately 10 to 15 min and was performed before and after the intervention [60]. The total SPPB score classifies functional capacity as follows: 0–3 points, indicating incapacity or low functional capacity; 4–6 points, indicating low functional capacity; 7–9 points, indicating moderate functional capacity; and 10–12 points, indicating good functional capacity. The minimum clinically significant change for the SPPB is 0.5 points, with 1 point representing a substantial change [61].
For the analyses, the following were considered: (i) balance test: score; (ii) walking test: gait speed, displacement time, and score; (iii) sit-to-stand test: execution time and score; (iv) the total score of the three tests.
2.4.11. Intervention Procedures
All procedures were performed in a single day. Participants received prior instructions regarding preparation for the collection day (e.g., clothing, fasting, exercise). Upon arrival at the laboratory, they signed the informed consent form. After signing, participants completed an anamnesis questionnaire covering health status (medications, diabetes, hypertension) and lifestyle habits (smoking, alcohol consumption, physical activity).
Participants were taken to a room with a controlled temperature for height and bioelectrical impedance analysis (BIA) measurements, followed by the collection of anthropometric data (waist circumference, neck circumference, hip circumference, and calf circumference) in the same room for the interventions.
Before the intervention, physiological parameters (BP, HR, RR, SpO2) and perceived exertion (Borg scale) were measured. Functional capacity (SPPB test) and muscle strength (manual dynamometry) were also assessed. During the intervention, HR, SpO2, and perceived exertion were monitored. After the intervention, assessments of BP, HR, RR, SpO2, Borg scale, SPPB test, and dynamometry were repeated.
Intervention
Two different models of VP were used in the study: the vertical VP model (Power Plate Pro 5, North America, Inc., Irvine, CA, USA) [62] and the side-alternating VP (Kikos P204IX, Kikos Fitness, São Paulo, Brazil) [63]. The vertical VP was used by the vertical group, while the side-alternating VP was used by the side-alternating and sham groups, as shown in Figure 1A–C.
Figure 1.
(A). Participant in the study being positioned by the researcher on the basis of the vertical VP in a static semi-squat posture, with the aid of a goniometer adjusted to 50° of knee flexion;The red line represents the sinusoidal wave produced by the vibrating platform during operation. (B). Participant in the study being positioned by the researcher on the basis of the side-alternating VP in a static semi-squat posture, with the aid of a goniometer adjusted to 50° of knee flexion; The red line represents the sinusoidal wave produced by the vibrating platform during operation. (C). Participant in sham group in the study being positioned by the researcher on the base of the side-alternating VP in a static semi-squat posture, with the aid of a goniometer adjusted to 50°, with VP turned off and and the red circle highlighting a device that emits a sound similar to that of a VP in operation.
2.4.12. Side-Alternating Group
Participants randomized to the side-alternating group were instructed to perform a static semi-squat with knees flexed to 50° (measured using a goniometer) at the base of the VP, remaining barefoot, standing, with the head in a neutral position, arms relaxed and lightly resting on the VP handles (Figure 1).
Regarding biomechanical parameters, the VP frequency was set to 30 Hz on the display, and the second toe was positioned in line with the peak-to-peak displacement of 2.5 mm, corresponding to a distance of 2 cm between the feet (measured with a non-flexible tape measure), using the base of the hallux as an anatomical reference. Participants performed 15 sets of 1 min static squats (work time), alternating with 1 min of rest in a standing position between sets, as shown in Figure 2. The total session duration was 30 min.
Figure 2.
The timeline shows how the study protocol was performed from before intervention, through the 1 min work and 1 min rest periods, to the 5th set; from the 5th set to the 10th set; and from the 10th set to the end of the intervention, totaling 15th sets and 30 min of protocol.
2.4.13. Vertical Group
Participants randomized to the vertical group were instructed to perform a static semi-squat with knees flexed at 50° (measured using a goniometer) at the base of the VP. They remained barefoot with a 2 cm distance between the feet (measured using a non-flexible tape measure), using the base of the hallux as an anatomical reference. They were in the standing position, with the head in a neutral position and arms relaxed, lightly resting on the VP handles—the same positioning used in the side-alternating group.
Regarding biomechanical parameters, the VP frequency was set to 30 Hz, and the peak-to-peak displacement was set to “low” on the display. Participants performed 15 sets of 1 min static squats, with a 1 min rest between each set. The total session duration was 30 min.
2.4.14. Sham Group
Participants randomized to the sham group performed the same static semi-squat position with knees flexed at 50° (measured by a goniometer) at the base of the side-alternating VP. They were barefoot, with the second toe aligned with the peak-to-peak displacement of 2.5 mm, corresponding to a 2 cm distance between the feet (measured using a non-flexible tape measure), with the base of the hallux as an anatomical reference. They were in the standing position with the head neutral and arms relaxed, lightly supported on the VP handles. However, the VP remained stationary, despite the display being on. Instead, a device behind the VP emitted a sound mimicking VP operation, providing participants with a false sensation of WBV exercise. Participants completed 15 sequences of 1 min static semi-squats, with 1 min rest between sets. The total session time was 30 min.
2.5. Statistical Analysis
The sample size was calculated using G*Power® 3.1.9.2 software (Franz Faul, Universität Kiel, Kiel, Germany) [64]. A power analysis was conducted using the repeated measures ANOVA within-between interaction test, based on Sá-Caputo et al. (2019) [65], using diastolic BP, with 85% power, 5% error probability, and an effect size of 0.15. The required total sample was 69 individuals (23 per group) [65].
Data processing and analyses were performed in R software version 4.4.2. Missing data were handled through multiple imputations using linear regression. Assumptions for multivariate analyses, including multivariate normality, homogeneity of variances and covariances, sphericity, and absence of multivariate outliers, were checked before hypothesis testing [66].
Baseline comparisons among groups were conducted using multivariate analysis of variance (MANOVA) for continuous variables and Fisher’s exact test for categorical variables. Handgrip strength was analyzed using a factorial repeated-measures ANOVA with group and time (pre- and post-test) as factors. Bonferroni-adjusted post hoc tests were applied when significant effects were found.
Vital signs (BP, HR, RR, SpO2) and perceived exertion were analyzed with mixed repeated measures ANOVA: moment (pre, moment 2, moment 3, post) as the within-subject factor and group (vertical, side-alternating, sham group) as the between-subject factor. The Greenhouse–Geisser correction was applied when sphericity was violated; Tukey post hoc tests were used to explore significant effects or interactions. SPPB scores were analyzed similarly using repeated-measures ANOVA to assess changes in functional performance over time and between groups.
Data are presented as mean ± standard deviation (continuous data), or as absolute and relative frequencies (categorical data). Statistical significance was set at a p-value of ≤0.05.
3. Results
3.1. Flowchart of the Study
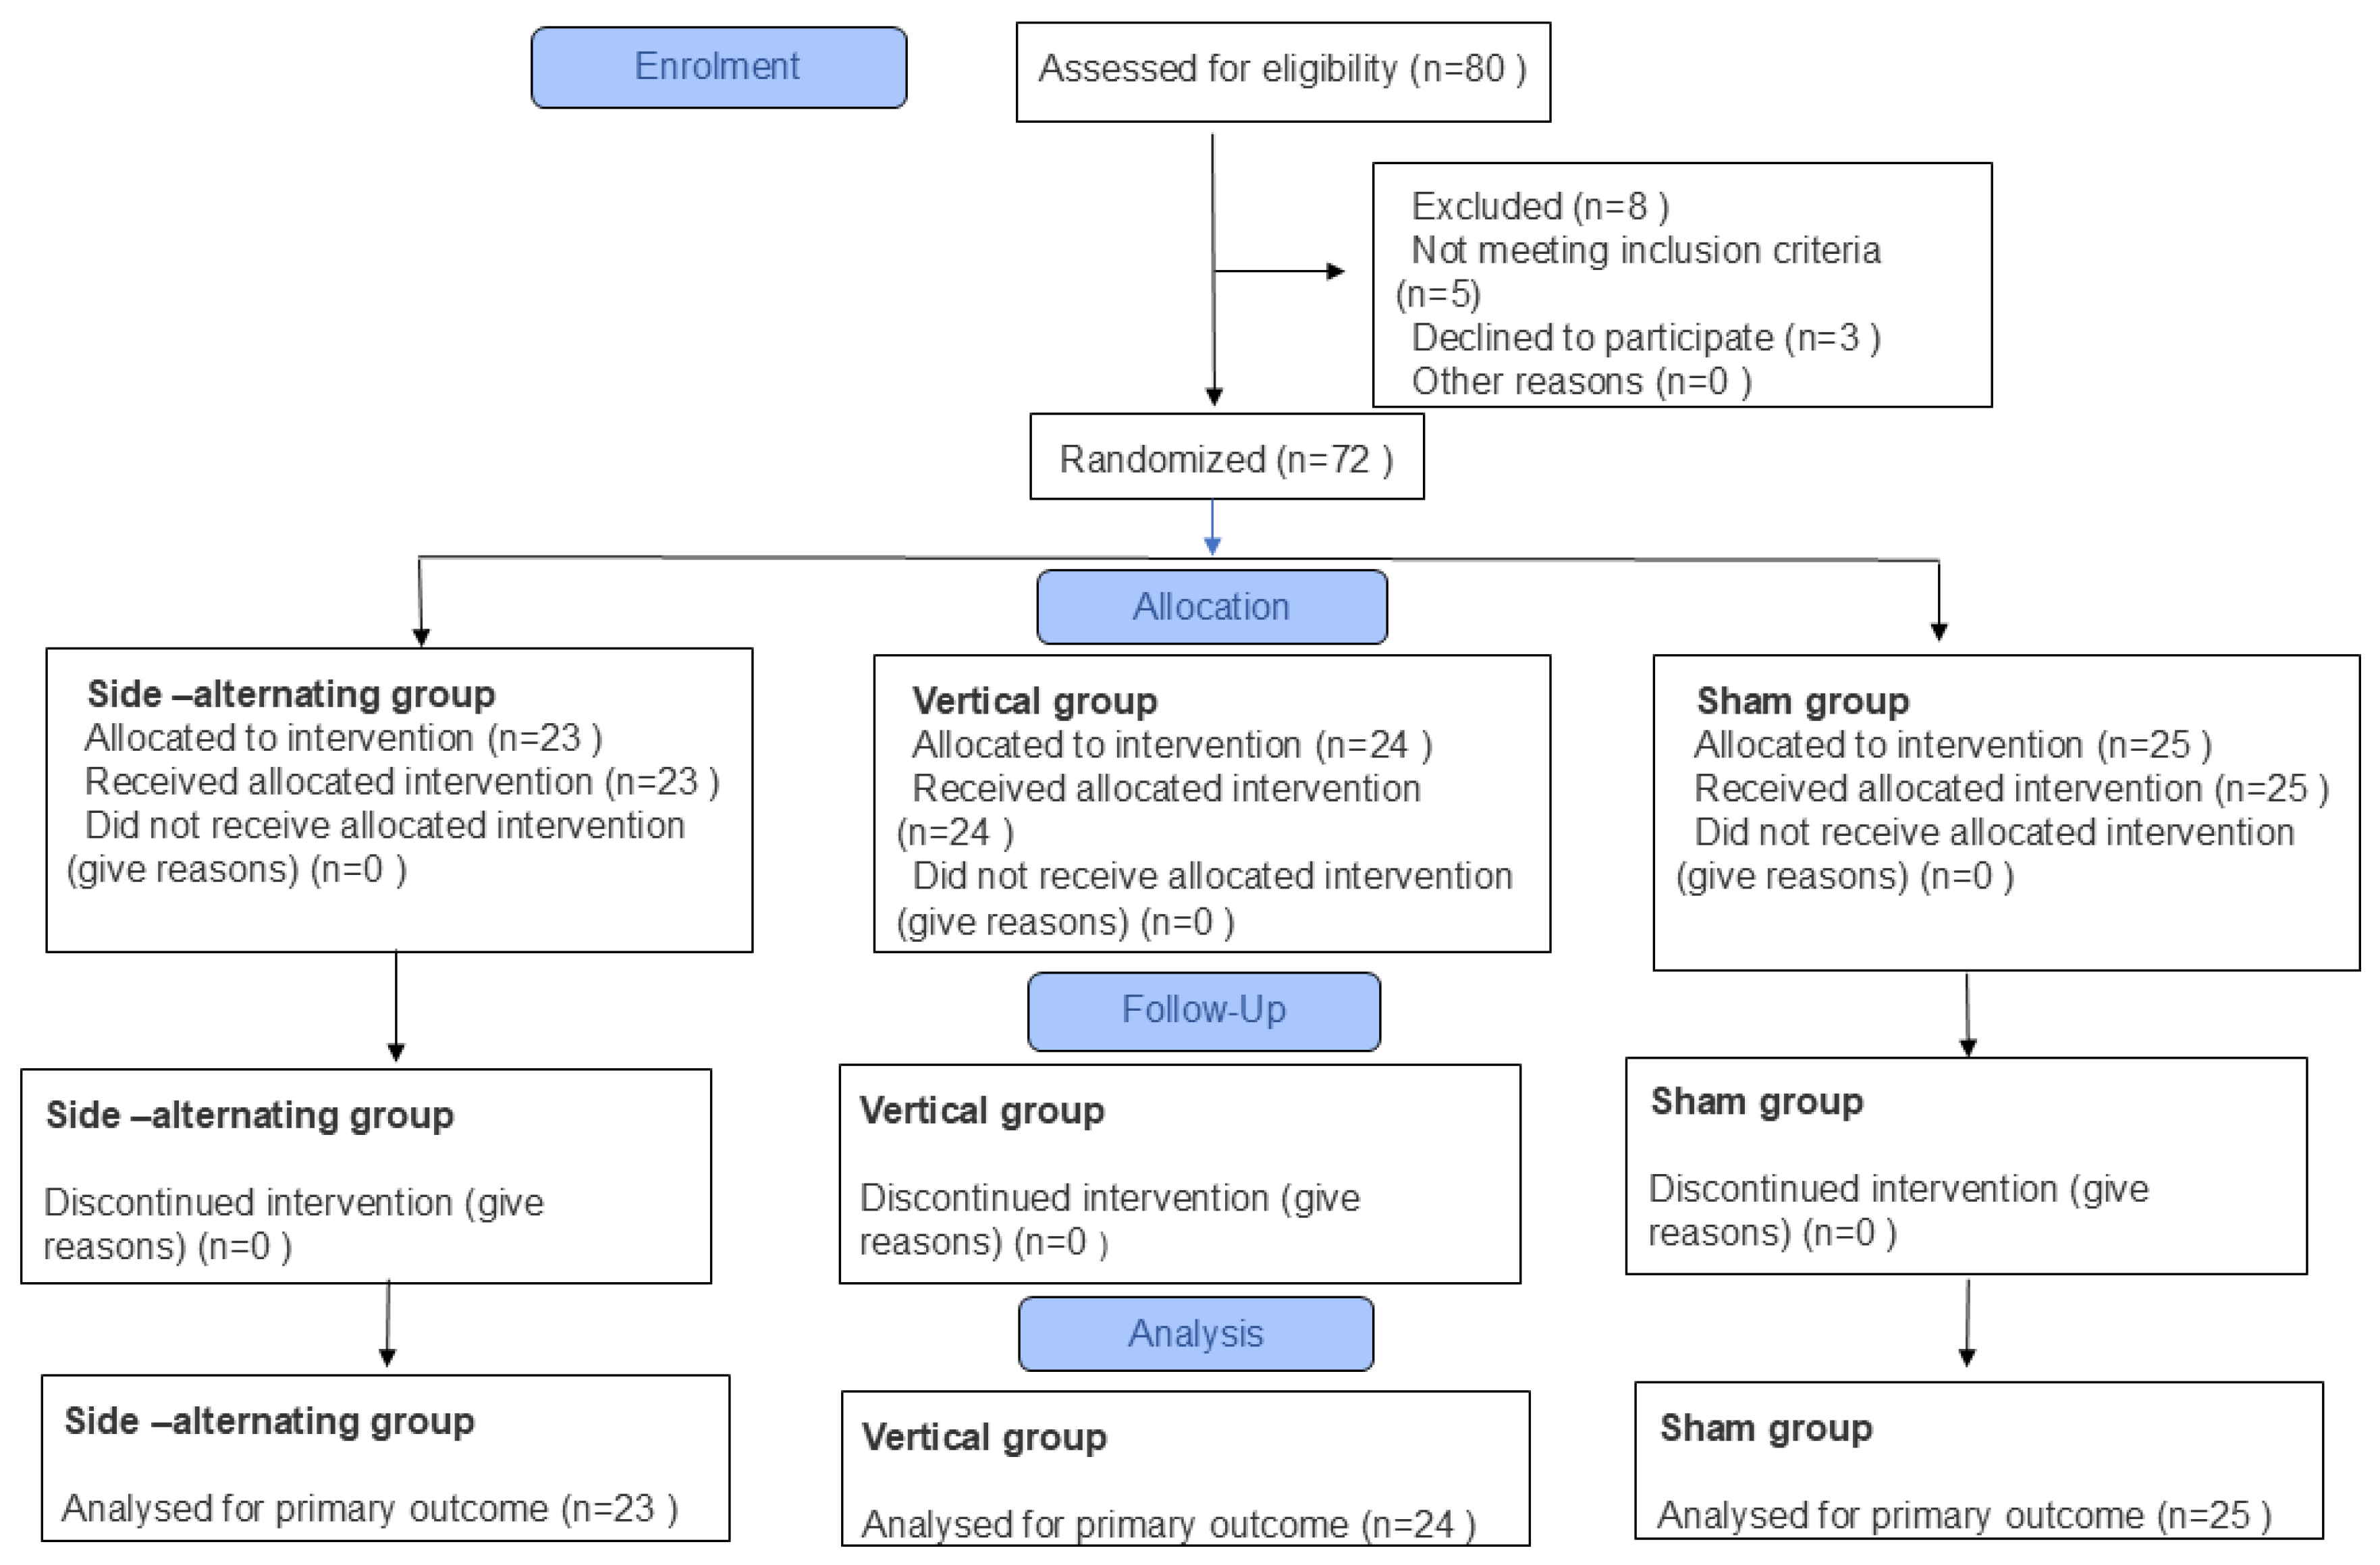
Eighty participants were recruited. Eight individuals did not meet the inclusion criteria: one volunteer was hypertensive with uncontrolled high BP; two volunteers had cardiovascular events in the past six months; two had a BMI above 39.9 kg/m2; and three declined to participate. Thus, seventy-two participants were randomized into three groups. As a result of randomization, 23 participants were assigned to the side-alternating group, 24 to the vertical group, and 25 to the sham group. There was no loss to follow-up during the study, possibly because the entire study was conducted in a single day. The study flowchart is shown in Figure 3.
Figure 3.
Flow diagram illustrating the number of participants in each group.
3.2. Baseline Characteristics of Study Participants
Table 1 describes the characteristics of the 72 participants, including 20 males and 52 females, with an average age of 43.5 years. The mean age was 47.33 ± 8.23 years in the vertical group, 41.09 ± 9.37 years in the side-alternating group, and 42.08 ± 8.95 years in the sham group. All participants were individuals with obesity, with an average BMI of 34.72 kg/m2. The mean BMI was 34.79 ± 2.87 kg/m2 in the vertical group, 34.34 ± 2.94 kg/m2 in the side-alternating group, and 35.04 ± 2.64 kg/m2 in the sham group. Regarding BMI classification, 50% of participants were classified as obese grade I and 50% as obese grade II. Anthropometric variables, bioimpedance parameters, and lifestyle characteristics are also presented. Regarding chronic diseases associated with obesity, 27.7% of participants reported a medical diagnosis of hypertension, and 8.33% reported diabetes mellitus. There were no significant differences in demographic, anthropometric, or comorbidity profiles among the three groups.
Table 1.
Baseline characteristics of study participants.
3.3. Physiological Parameters
Table 2 presents the results for physiological parameters before and after the intervention in the three groups (vertical, side-alternating, and sham groups).
Table 2.
Physiological parameters in obese individuals before and after the intervention.
The analysis of BP showed no statistically significant differences in both intra- and intergroup comparisons for SBP (mmHg): vertical group (125.65 ± 15.72/126.93 ± 15.72), p = 0.278; side-alternating group (120.98 ± 13.79/120.82 ± 13.25), p = 0.919; sham group (120.98 ± 13.79/120.82 ± 13.25), p = 0.109; intergroup analysis, p = 0.321.
Similarly, DBP (mmHg) showed no significant intra- or intergroup differences: vertical group (82.69 ± 7.69/83.37 ± 7.15), p = 0.405; side-alternating group (80.50 ± 9.23/80.31 ± 8.42), p = 0.832; sham group (84.52 ± 11.60/83.42 ± 11.34), p = 0.401; intergroup, p = 0.419.
Mean arterial pressure (MAP, mmHg) also did not show significant intra- or intergroup changes: vertical group (183.08 ± 19.18/185.01 ± 18.61), p = 0.310; side-alternating group (177.08 ± 19.98/176.24 ± 18.11), p = 0.707; sham group (187.96 ± 23.20/183.24 ± 24.19), p = 0.239; intergroup, p = 0.311.
Regarding pulse pressure (PP), no significant differences were observed after the intervention in either intra- or intergroup analyses: vertical group (44.12 ± 14.95/45.91 ± 16.90), p = 0.411; side-alternating group (41.43 ± 11.84/42.47 ± 11.24), p = 0.558; sham group (45.76 ± 12.76/44.04 ± 12.65), p = 0.338; intergroup, p = 0.696.
However, the rate–pressure product (RPP) showed a significant increase only in the intragroup analysis of the side-alternating group after the intervention (8679.47 ± 1692.74/9395.86 ± 2273.57), p = 0.005. No significant changes were observed in the vertical group (9339.79 ± 1622.98/9443.45 ± 2070.50), p = 0.739; sham group (9589.16 ± 1819.02/9674.44 ± 1717.38), p = 0.751; or intergroup, p = 0.877.
Finally, RR showed no statistically significant changes: vertical group (17.68 ± 3.00/18.34 ± 2.89), p = 0.154; side-alternating group (15.53 ± 2.79/16.50 ± 3.34), p = 0.050; sham group (15.86 ± 4.51/16.21 ± 4.26), p = 0.352; intergroup, p = 0.086.
3.4. Vital Signs Measured During the Interventions
Table 3 presents the results regarding the physiological parameters (SpO2, HR, and Borg scale) assessed at four periods: (i) before the intervention [pre]; (ii) after the 5th set [moment 2]; (iii) after the 10th set [moment 3]; and (iv) after the intervention [post].
Table 3.
Physiological parameters (HR, SpO2) and perception of effort (Borg scale) during the intervention.
The analysis of SpO2 showed no statistically significant differences between groups (p = 0.229), across time points (p = 0.149; Greenhouse–Geisser-corrected), or for the group × time interaction (p = 0.649), indicating that SpO2 levels remained stable throughout the intervention period regardless of group allocation.
For the Borg scale of perceived exertion, a significant main effect of time (pre- to post- intervention) was observed (p < 0.001), with no significant differences between groups (p = 0.804) or group × time interaction (p = 0.824). Post hoc analysis revealed a significant increase in perceived exertion in the side-alternating group from pre to moment 3 (p = 0.006) and moment 3 to post-intervention (p = 0.011). In the vertical group, a significant increase was observed from pre to moment 3 (p = 0.020), while in the sham group, the increase from pre to post was marginal (p = 0.047).
HR also showed a significant effect of time (p = 0.020), without differences between groups (p = 0.226) or a significant group × time interaction (p = 0.192). Intra-group comparisons revealed a significant increase in HR in the side-alternating group between the pre- and moment 2 (p = 0.0001), followed by a further increase from moment 2 to post-intervention (p = 0.030). Between-group comparisons revealed significant differences only at moment 2, when the side-alternating group presented lower HR values compared to both the sham group (p = 0.011) and vertical group (p = 0.005).
3.5. SPPB Test Score and Hand Dynamometry
Table 4 presents the physical performance results, including scores from the SPPB test and the handgrip strength assessment.
Table 4.
Short Physical Battery test and handgrip strength.
For the SPPB balance domain, intragroup analysis before and after the intervention showed no significant differences: vertical group (4.00 ± 0.00/4.00 ± 0.00), side-alternating group (3.96 ± 0.21/3.96 ± 0.21), and sham group (4.00 ± 0.00/3.96 ± 0.20), p = 0.381. No significant differences were observed in the intergroup analysis (p = 0.327).
Regarding the gait domain, no significant changes were observed in gait speed (m/s) in the intragroup analysis: vertical group (1.03 ± 0.17/1.00 ± 0.20), side-alternating group (0.96 ± 0.15/0.98 ± 0.58), and sham group (0.97 ± 0.16/0.96 ± 0.11), p = 0.601; nor in the intergroup comparison (p = 0.266). Similarly, the 3 m walk time (s) showed no statistical differences within groups: vertical group (2.98 ± 0.48/3.15 ± 0.81), side-alternating group (3.19 ± 0.46/3.16 ± 0.58), and sham group (3.17 ± 0.50/3.17 ± 0.34), p = 0.394; or between groups (p = 0.243). The gait domain score also did not differ significantly in either the intra- or intergroup analysis: vertical group (3.96 ± 0.20/3.92 ± 0.41), side-alternating group (3.74 ± 0.45/3.70 ± 0.56), and sham group (3.79 ± 0.41/3.96 ± 0.20), p = 0.572; intergroup p = 0.064.
In the lower limb strength domain, assessed by the sit-to-stand test (time in seconds), no significant differences were found within or between groups: vertical group (11.42 ± 2.45/11.01 ± 2.88), side-alternating group (11.31 ± 3.97/11.18 ± 4.59), and sham group (11.25 ± 5.08/10.91 ± 4.62), p = 0.194; intergroup p = 0.803. Similarly, the sit-to-stand domain score showed no significant changes in either the intragroup or intergroup analysis: vertical group (3.42 ± 0.88/3.58 ± 0.78), side-alternating group (3.35 ± 1.03/3.22 ± 1.13), and sham group (3.38 ± 1.06/3.54 ± 0.88), p = 0.366; intergroup p = 0.347.
The total SPPB score also showed no significant modifications: vertical group (11.25 ± 1.07/11.54 ± 1.10), side-alternating group (11.04 ± 1.26/10.87 ± 1.42), p = 0.200; intergroup p = 0.193.
The analysis of handgrip strength in the upper limbs, also presented in Table 4, did not reveal statistically significant changes after the intervention in any of the groups. For the right arm, mean values ranged from 28.5 ± 2.69 to 28.7 ± 2.69 kgf in the sham group, from 31.6 ± 2.73 kgf to 31.2 ± 2.73 kgf in the side-alternating group, and from 32.7 ± 2.71 kgf to 32.8 ± 2.71 kgf in the vertical group. Intragroup comparisons (before vs. after the intervention) showed no significant differences (sham group: p = 0.7566; side-alternating group: p = 0.6131; vertical group: p = 0.8771).
Similarly, for the left arm, values ranged from 28.0 ± 2.48 kgf to 28.6 ± 2.48 kgf in the sham group, from 29.6 ± 2.52 kgf to 28.7 ± 2.52 kgf in the side-alternating group, and from 31.9 ± 2.50 kgf to 31.3 ± 2.50 kgf in the vertical group. The intragroup p-values were 0.4276, 0.2532, and 0.5065, respectively. The intergroup comparison after the intervention also showed no statistically significant differences for the right arm (p = 0.558) or the left arm (p = 0.679).
4. Discussion
4.1. Blood Pressure
Previous researchers demonstrated that a single session of exercise can elicit changes in physiological parameters, including reductions in BP during the recovery period [67,68]. However, the current study did not observe significant changes in SBP, DBP, or mean arterial pressure (MAP) between groups before and after the immediate WBV exercise intervention. These findings align with Aoyama et al. (2019), who reported no significant BP changes following an acute WBV exercise protocol in older adults using a frequency of 30 Hz and a peak-to-peak displacement (PPD) of 3 mm, parameters closely matching those in our study [69].
In contrast, Jinakote et al. (2023) found significant increases in SBP and MAP after acute intervention in healthy adults; however, these changes were observed across all groups evaluated (WBV exercise, WBV exercise combined with dynamic squats, and dynamic squats alone) [70]. The differences between our findings and Jinakote et al.’s results may be explained by variations in protocols. Their intervention used a lower vibration frequency (25 Hz with a PPD of 2 mm) but longer set durations (2 min per set versus 1 min in our study). Additionally, participant characteristics differ: our study involved individuals with obesity, Aoyama et al. studied older adults, and Jinakote et al. recruited younger, healthy participants, which may have influenced BP responses due to differences in health conditions.
Cardoso Jr. et al. (2010) suggest that exercise effects on clinical BP may differ between normotensive and hypertensive individuals, given altered cardiovascular dynamics in hypertension [71]. Zeigler et al. (2016) demonstrated a post-exercise hypotensive effect, a sustained BP reduction, using an acute WBV exercise protocol (mechanical vibration of 35 Hz and 5 mm amplitude) combined with resistance exercises in prehypertensive adults [72]. This combined approach produced greater BP-lowering effects compared to both a control group and a group that performed resistance exercise only [72].
Previous studies have shown that WBV exercise combined with resistance training enhanced muscle perfusion in the lower limbs and reduced peripheral vascular stiffness [73,74]. These vascular adaptations likely decrease peripheral resistance without increasing cardiac output, resulting in lower BP [75]. Discrepancies in detecting post-exercise hypotension across studies may be related to differences in the timing of BP measurements after exercise, ranging from 4 to 30 min post-exercise. Notably, Zeigler et al. (2016) reported maximum BP reductions approximately 45 min post-session [72].
4.2. Respiratory Rate and Arterial Oxygen Saturation
Although some studies have reported that individuals with obesity may exhibit lower tidal volume and higher RR, resulting in greater minute ventilation compared to individuals with normal body mass, participants in the present study showed a baseline RR within the normal range (12 to 20 breaths per minute) [76]. RR and peripheral SpO2 did not change significantly following the WBV exercise intervention. Similarly, Aoyama et al. (2019) found no changes in SpO2 using pulse oximetry after an acute WBV exercise protocol employing biomechanical parameters similar to those in our study (vertical VP, mechanical vibration at a 30 Hz frequency, 3 mm peak-to-peak displacement) in individuals with cardiovascular disease [69]. Supporting these findings, Sousa-Gonçalves et al. (2019) also reported no significant changes in SpO2 after 15 bouts of an acute WBV exercise protocol (35 Hz, 5 mm peak-to-peak displacement) in obese adolescents [77]. However, Gloeckl et al. (2017) demonstrated a significant increase in SpO2 following WBV exercise in individuals with chronic obstructive pulmonary disease compared to a group performing squats alone [78]. Notably, their protocol differed substantially from previous studies, including six sets of squats synchronized with auditory cues, a 10 min warm-up on a cycle ergometer, and mechanical vibration settings of 26 Hz with a 5 mm peak-to-peak displacement [78].
SpO2 levels during physical exertion can vary depending on the type and intensity of exercise. Monitoring SpO2 is essential in in-patient health management and is recommended in exercise physiology research [79]. SpO2 reflects the percentage of hemoglobin bound to oxygen relative to total hemoglobin [80], and hypoxemia can acutely affect critical organs such as the brain, heart, and kidneys [81]. Given the absence of WBV exercise-induced changes in SpO2 across cited studies, this modality may represent a low-impact, viable, and safe intervention, particularly for populations with high cardiovascular risk, such as individuals with obesity.
4.3. HR and Rate–Pressure Product
In the current study, HR and rate–pressure product (RPP) increased significantly after immediate WBV exercise, but only in the group performing exercises on the side-alternating VP (mechanical vibration at 30 Hz, with a peak-to-peak displacement of 2.5 mm). Conversely, Tamini et al. (2020) found no significant HR differences in obese adults after a WBV exercise protocol (30 Hz, PPD 3 mm) using a vertical VP [82]. However, Gojanovic et al. (2012), in a similar study comparing vertical VP, side-alternating VP, and control groups, corroborated our results by reporting significantly higher mean and peak HR values in the side-alternating VP group compared to the other groups [83]. Their biomechanical parameters were 26 Hz and 15 mm PPD for the side-alternating VP, and 35 Hz and 8 mm PPD for the vertical VP, tested in sedentary young women [83].
This raises the question of why side-alternating platforms elicit a greater HR response. Abercromby et al. (2007) directly compared lower limb muscle activity between side-alternating and vertical VP, finding greater overall muscle activation during side-alternating VP [84]. The asymmetric, non-vertical forces of this VP may induce increased muscle stretch, joint movement, postural challenges, and tissue vibration in the legs, contributing to distinct neuromuscular responses [85]. Therefore, it is suggested that different acute neuromuscular responses elicited by different VP types may be associated with varying cardiovascular outcomes, such as increased sympathetic activity leading to elevated HR [84].
4.4. Perceived Exertion (BORG Scale)
Perceived exertion can be an important factor influencing adherence to PE programs or even the performance of daily activities in overweight or obese individuals [86]. Perceived exertion changed over time in all three groups. Post hoc analysis confirms that within each group, there were significant reductions in perceived exertion, assessed by the Borg Scale (0 to 10 points), in the side-alternating, vertical, and sham groups.
Saldıran et al. (2020) [87] also reported a significant increase in Borg Scale scores in both the WBV exercise group and the control group in overweight and obese individuals. The protocol used in their study involved similar biomechanical parameters to the current study (30 Hz, low intensity); however, only a vertical VP was used [87].
Interestingly, Van Ruymbeke et al. (2014) found that frequencies that induce greater muscle activation, i.e., 20 and 30 Hz, presented lower scores on the perceived exertion scale compared to higher frequencies [88]. Furthermore, scores did not differ between breast cancer survivors and healthy controls, suggesting that the WBV exercise intervention was not perceived as more strenuous by survivors of a serious illness and may be indicated for other patients with other diseases, special health conditions with increased cardiovascular risk, or with low adherence to conventional exercise programs, such as obese participants.
4.5. Functionality Assessment
In the current study, functionality was assessed using the SPPB test, which evaluates balance, gait speed, and lower limb muscle strength. No statistically significant differences were observed in balance among the three groups analyzed. Similarly, Rendos et al. (2017) reported no significant improvements in balance following a single session of WBV exercise (30 Hz; PPD 5 mm) using a VP in adults with and without ankle instability [89]. Likewise, Freitas et al. (2018) found no significant changes in balance after a single session of WBV exercise (30 Hz; PPD 3 mm) on a VP in women with multiple sclerosis [90]. However, Lee et al. (2013) [91] reported significant improvements in balance following a six-week WBV exercise intervention (15–30 Hz; PPD 1–3 mm) in older adults with diabetic neuropathy. Their protocol also incorporated balance-specific exercises [91]. It is noteworthy that regular PE has the potential to effectively improve postural control by reducing body sway [92].
A potential factor contributing to the divergent findings across studies may be the duration of the intervention. In both the current study and that of Rendos et al., only a single session of WBV exercise was administered, whereas Lee et al. applied a six-week intervention that combined WBV exercise with balance intervention exercises [89,91].
The total SPPB score did not change significantly in the current study. However, Zhuang et al. (2025) [93] reported significant improvements in total SPPB scores following a 12-week WBV exercise protocol involving static squats on a VP (12 Hz; 4 mm) in older adults. It is worth noting that their study did not include a control group but rather compared outcomes with a group performing resistive exercises [93]. Similarly, Paineiras-Domingos et al. (2018) described significant improvements in SPPB scores after a protocol of 10 WBV exercise sessions using a side-alternating VP (6–14 Hz; PPD 2.5, 5.0, and 7.5 mm), when compared to a control group that performed the same exercises with the VP turned off in metabolic syndrome individuals [94]. Jo et al. (2021), in a study involving older adults, similarly demonstrated a significant increase in total SPPB scores only in the group that underwent WBV exercise intervention [27]. A vertical VP was used, with a protocol consisting of 12 intervention sessions with mechanical vibration of 10 Hz and PPD of 5 mm, followed by 20 min of resistive exercises. The control group performed only 20 min of stretching exercises [27].
It is possible that the studies by Zhuang et al. (2025), Paineiras-Domingos et al. (2018), and Jo et al. (2021) demonstrated significant improvements in SPPB scores due to the higher number of WBV exercise sessions compared to the current study, which included only a single intervention session [27,93,94].
Low physical performance is a key indicator in the diagnosis of sarcopenic obesity (SO) and has been associated with increased mortality risk. According to the Clinical Nutrition and Metabolism (ESPEN) and the European Association for the Study of Obesity, sarcopenia in SO is defined as a reduction in skeletal muscle mass and function [95]. Therefore, assessing physical performance in individuals with obesity and designing therapeutic strategies, including long-term interventions aimed at improving functional capacity, may be of great relevance for this population.
4.6. Handgrip Strength
In the present study, muscle strength was assessed using hand dynamometry. No significant changes were found after the intervention in any of the three groups evaluated (vertical, alternating lateral, and placebo). Corroborating our results, García-Gutiérrez (2014) also found no significant changes in hand dynamometry after a session of immediate-effect whole-body vibration (WBV) exercise in young university students who performed static squats in a vertical WBV model with biomechanical parameters of 50 Hz with a peak-to-peak displacement of 2.51 mm (High), although they used a higher frequency than that used in this study [96]. On the other hand, Santos et al. (2021) [97] reported a significant increase in intergroup values of upper limb hand dynamometry in healthy women who performed the push-up position during WBV exercise, compared to a placebo group and a group that performed static half-squats during WBV exercise. The biomechanical parameters of the WBV exercise protocol were a frequency of 45 Hz and PPD of 2 mm in a vertical VP [97]. The position adopted by the group that showed statistical significance was the “push-up” position, with hands supported on the base of the VP [97]. The difference between the results of these studies may be related to the patient’s positioning on the VP. In the present study and in that of García-Gutiérrez (2014), participants performed a static semi-squat position with their feet supported on the base of the VP [96]. In contrast, in the study by Santos et al. (2021), participants were positioned with their hands directly on the base of the VP [97].
In the study by Santos et al. (2021), one group performed a static semi-squat; in other words, this group received direct vibratory stimulation in the lower limbs, but this did not significantly affect the results of manual dynamometry after whole-body vibration (WBV) exercise, suggesting that the stimulation applied to the lower limbs was insufficient to promote efficient muscle contraction in the upper limbs or improvement in post-activation potential [97]. Physiologically, the literature offers some explanations for this improvement in performance after WBV exercise. It may be due to a phenomenon called post-activation potentiation (PAP), in which muscle performance characteristics are enhanced as a result of contractile activity preceding a physical performance test. Several mechanisms may explain PAP, such as increased recruitment of high-threshold motor units, phosphorylation of myosin regulatory light chains, and changes in the tilt angle of muscle fibers [98]. Thus, even though muscle strength and functional capacity are qualities that require chronic adaptations and longer periods of intervention like exercise, VCI exercise imposes an additional gravitational load compared to exercise without vibratory stimulation; this additional stimulus could lead to PPA. Furthermore, the body’s response to WBV exercise differs when the vibratory stimulus is applied through the feet or hands. This difference would be due to the transmission and attenuation of mechanical vibrations, which can vary depending on the body’s biomechanics and the location of the mechanical vibration source [99]. Among the study’s strengths, the randomized design stands out, with the inclusion of two distinct types of vibration platforms (vertical and side-alternating) and a sham group, which enhances the internal validity of the findings. Furthermore, the detailed assessment of physiological responses before, during, and after a single WBV exercise session allowed for a comprehensive analysis of acute changes, an aspect still little explored in the literature, especially in obese adults.
Another relevant point is the inclusion of a population with potential cardiometabolic risk and results showing no discrepant physiological changes, and the maintenance of cardiovascular parameters within limits considered safe. This reinforces the potential of WBV exercise as a viable alternative to traditional exercise programs for individuals who have difficulty adhering to them.
4.7. Limitations
Because this was an acute exercise protocol, the results may not reflect the chronic adaptations that occur with repeated training over time. Although it was a randomized design, the lack of a crossover format or a control group may limit the ability to fully control for interindividual variability. Furthermore, the sample was predominantly composed of female participants, which may limit the generalizability of the results to male individuals. Although this distribution partly reflects the higher prevalence of the studied condition in women, the findings should be interpreted with caution. The results were measured immediately after exercise, and it is unclear whether the observed effects persist for hours or days following the session. Future studies should investigate whether the observed acute effects translate into chronic adaptations and explore responses in more diverse populations.
5. Conclusions
In conclusion, considering all the findings of this study, a single whole-body vibration (WBV) exercise session promoted some immediate changes in physiological parameters and perceived exertion in obese adults, with specific responses depending on the type of vibration platform, but not on functionality. Alternating lateral WBV exercise induced significant fluctuations in heart rate and increased the heart rate–blood pressure product, although with values within the normal range. Perceived exertion increased in all groups. This suggests that, even when adding vibration to static squat exercise and increasing the gravitational load, individuals did not report significantly greater effort compared to the placebo group; furthermore, the level of exertion was not considered high. These findings may be of interest for clinical practice, since whole-body vibration exercise leads to changes in physiological parameters but does not exceed cutoff values, which may indicate that these exercises do not pose health risks. In addition, they were not considered very tiring and therefore could encourage better adherence from this population, which tends to be sedentary and has low tolerance to conventional physical exercise.
Perspective and Facts
Obesity is a complex condition that can negatively impact the cardiovascular, respiratory, and musculoskeletal systems, increasing the risk of functional decline and cardiometabolic complications. In this context, WBV exercise emerges as a promising, low-impact option that may be particularly suitable for populations with physical limitations. The findings of this study reinforce the safety and feasibility of WBVI using alternating vertical and lateral platforms, with no adverse hemodynamic changes detected and evidence of reduced perception of exertion and preserved functionality. These results suggest that WBVI may represent a viable complementary tool for promoting physical activity in obese adults. Future studies should explore long-term adaptations and potential benefits in individuals with sarcopenic obesity or cardiometabolic comorbidities.
Author Contributions
Conceptualization, A.R.-S., D.d.C.d.S.-C. and M.B.-F.; methodology, A.R.-S.; software, A.R.-S.; validation, A.R.-S., D.d.C.d.S.-C., M.B.-F., R.T. and A.S.; formal analysis, A.R.-S.; investigation, A.R.-S., A.L.B.D.C., A.C.C.-O., D.B.-S., G.S.D.d.S., J.S.M., A.G.V.-P., A.A.-N. and M.C.M.-F.; resources, M.B.-F., D.d.C.d.S.-C., R.T. and A.S.; data curation, A.R.-S.; writing—original draft preparation, A.R.-S.; writing—review and editing, A.R.-S., D.d.C.d.S.-C., M.B.-F., R.T. and A.S.; visualization, A.R.-S.; supervision, D.d.C.d.S.-C. and M.B.-F.; project administration, D.d.C.d.S.-C. and M.B.-F.; funding acquisition, R.T., A.S. and M.B.-F. All authors have read and agreed to the published version of the manuscript.
Funding
This research received no external funding.
Institutional Review Board Statement
The study was conducted in accordance with the Declaration of Helsinki and approved by the Institutional Review Board (CAAE 90160825.6.0000.5259) of Plataforma Brasil https://plataformabrasil.saude.gov.br/visao/publico/indexPublico.jsf (protocol code 7755184 and date of approval: 6 May 2020).
Informed Consent Statement
Informed consent was obtained from all subjects involved in the study.
Data Availability Statement
The data presented in this study are available on reasonable request from the corresponding author. The data are not publicly available due to ethical and privacy restrictions.
Acknowledgments
Conselho Nacional de Desenvolvimento Científico e Tecnológico (CNPq), Fundação de Amparo à Pesquisa do Estado do Rio de Janeiro (FAPERJ), and Coordenação de Aperfeiçoamento de Pessoal de Nível Superior (CAPES).
Conflicts of Interest
The authors declare that they have no conflict of interest.
References
- Mahmoud, R.; Kimonis, V.; Butler, M.G. Genetics of Obesity in Humans: A Clinical Review. Int. J. Mol. Sci. 2022, 23, 11005. [Google Scholar] [CrossRef] [Scilit]
- Berger, P.K.; Plows, J.F.; Jones, R.B.; Pollock, N.K.; Alderete, T.L.; Ryoo, J.H.; Goran, M.I. Maternal Blood Pressure Mediates the Association between Maternal Obesity and Infant Weight Gain in Early Postpartum. Pediatr. Obes. 2019, 14, e12560. [Google Scholar] [CrossRef] [Scilit]
- Muluvhu, T.C.; Monyeki, M.A.; Strydom, G.L.; Toriola, A.L. Relationship between Obesity and Blood Pressure among Employees in the Vhembe District Municipality of Limpopo Province, South Africa. Cardiovasc. J. Afr. 2019, 30, 361–368. [Google Scholar] [CrossRef] [Scilit]
- Marillier, M.; Bernard, A.C.; Reimao, G.; Castelli, G.; Alqurashi, H.; O’Donnell, D.E.; Neder, J.A. Breathing at Extremes: The Restrictive Consequences of Super- and Super-Super Obesity in Men and Women. Chest 2020, 158, 1576–1585. [Google Scholar] [CrossRef] [Scilit]
- Perossi, L.; Holtz, M.; Santos, D.O.D.; Perossi, J.; Souza, H.C.D.; Salgado Junior, W.; Gastaldi, A.C. Increased Airway Resistance Can Be Related to the Decrease in the Functional Capacity in Obese Women. PLoS ONE 2022, 17, e0267546. [Google Scholar] [CrossRef] [Scilit] [PubMed]
- Lo Mauro, A.; Tringali, G.; Codecasa, F.; Abbruzzese, L.; Sartorio, A.; Aliverti, A. Pulmonary and Chest Wall Function in Obese Adults. Sci. Rep. 2023, 13, 17753. [Google Scholar] [CrossRef] [Scilit]
- Garg, S.; Gupta, S.; Mobeen, M.S.; Madhu, S.V. Effect of Obesity and Glycated Hemoglobin on Oxygen Saturation in Ambulatory Type 2 Diabetic Individuals: A Pilot Study. Diabetes Metab. Syndr. 2016, 10, 157–160. [Google Scholar] [CrossRef] [Scilit] [PubMed]
- Lee, H.; Rhee, T.M.; Choi, J.M.; Choi, S.Y.; Kim, D.W. The Close Link Between Obesity and Cardiovascular Disease: Current Insights and Remaining Challenges. Endocrinol. Metab. Clin. N. Am. 2025, 54, 175–192. [Google Scholar] [CrossRef] [Scilit]
- Yadav, R.L.; Yadav, P.K.; Yadav, L.K.; Agrawal, K.; Sah, S.K.; Islam, M.N. Association between Obesity and Heart Rate Variability Indices: An Intuition toward Cardiac Autonomic Alteration—A Risk of CVD. Diabetes Metab. Syndr. Obes. 2017, 10, 57–64. [Google Scholar] [CrossRef] [Scilit]
- Al-Rashed, F.; Sindhu, S.; Al Madhoun, A.; Ahmad, Z.; AlMekhled, D.; Azim, R.; Al-Kandari, S.; Wahid, M.A.; Al-Mulla, F.; Ahmad, R. Elevated Resting Heart Rate as a Predictor of Inflammation and Cardiovascular Risk in Healthy Obese Individuals. Sci. Rep. 2021, 11, 13883. [Google Scholar] [CrossRef] [Scilit] [PubMed]
- Rossi, R.C.; Vanderlei, L.C.M.; Gonçalves, A.C.; Vanderlei, F.M.; Bernardo, A.F.; Yamada, K.M.; da Silva, N.T.; de Abreu, L.C. Impact of Obesity on Autonomic Modulation, Heart Rate and Blood Pressure in Obese Young People. Auton. Neurosci. 2015, 193, 138–141. [Google Scholar] [CrossRef] [Scilit]
- Abel, E.D.; Litwin, S.E.; Sweeney, G. Cardiac Remodeling in Obesity. Physiol. Rev. 2008, 88, 389–419. [Google Scholar] [CrossRef] [Scilit]
- Chávez-Guevara, I.A.; Amaro-Gahete, F.J.; Ramos-Jiménez, A.; Brun, J.F. Toward Exercise Guidelines for Optimizing Fat Oxidation during Exercise in Obesity: A Systematic Review and Meta-Regression. Sports Med. 2023, 53, 2399–2416. [Google Scholar] [CrossRef] [Scilit] [PubMed]
- Flack, K.D.; Stults-Kolehmainen, M.A.; Anderson, R.E., III; Handlery, R.; Creasy, S.A.; Catenacci, V.A. Exploring Strategies to Promote Exercise as a Viable Obesity and Chronic Disease Treatment. Nutrients 2025, 17, 1997. [Google Scholar] [CrossRef] [Scilit]
- Avesani, C.M.; de Abreu, A.M.; Ribeiro, H.S.; Brismar, T.B.; Stenvinkel, P.; Sabatino, A.; Lindholm, B. Muscle Fat Infiltration in Chronic Kidney Disease: A Marker Related to Muscle Quality, Muscle Strength and Sarcopenia. J. Nephrol. 2023, 36, 895–910. [Google Scholar] [CrossRef] [Scilit]
- Riviati, N.; Darma, S.; Reagan, M.; Iman, M.B.; Syafira, F.; Indra, B. Relationship between Muscle Mass and Muscle Strength with Bone Density in Older Adults: A Systematic Review. Ann. Geriatr. Med. Res. 2025, 29, 1–14. [Google Scholar] [CrossRef] [Scilit] [PubMed]
- Jang, S.Y.; Choi, K.M. Impact of Adipose Tissue and Lipids on Skeletal Muscle in Sarcopenia. J. Cachexia Sarcopenia Muscle 2025, 16, e70000. [Google Scholar] [CrossRef] [Scilit]
- Brekke, I.J.; Puntervoll, L.H.; Pedersen, P.B.; Kellett, J.; Brabrand, M. The Value of Vital Sign Trends in Predicting and Monitoring Clinical Deterioration: A Systematic Review. PLoS ONE 2019, 14, e0210875. [Google Scholar] [CrossRef] [Scilit]
- Chung, J.; Jung, H. Indicators of Clinical Deterioration in Adult General Ward Patients from Nurses’ Perspectives: A Mixed-Methods Systematic Review. BMC Nurs. 2024, 23, 861. [Google Scholar] [CrossRef] [Scilit] [PubMed]
- Becking-Verhaar, F.L.; Verweij, R.P.H.; de Vries, M.; Vermeulen, H.; van Goor, H.; Huisman-de Waal, G.J. Continuous Vital Signs Monitoring with a Wireless Device on a General Ward: A Survey to Explore Nurses’ Experiences in a Post-Implementation Period. Int. J. Environ. Res. Public Health 2023, 20, 5794. [Google Scholar] [CrossRef] [Scilit]
- Raiman, L.; Amarnani, R.; Abdur-Rahman, M.; Marshall, A.; Mani-Babu, S. The Role of Physical Activity in Obesity: Let’s Actively Manage Obesity. Clin. Med. 2023, 23, 311–317. [Google Scholar] [CrossRef] [Scilit]
- Davison, K.; Bircher, S.; Hill, A.; Coates, A.M.; Howe, P.R.; Buckley, J.D. Relationships between Obesity, Cardiorespiratory Fitness, and Cardiovascular Function. J. Obes. 2010, 2010, 191253. [Google Scholar] [CrossRef] [Scilit]
- Baillot, A.; Chenail, S.; Barros Polita, N.; Simoneau, M.; Libourel, M.; Nazon, E.; Riesco, E.; Bond, D.S.; Romain, A.J. Physical Activity Motives, Barriers, and Preferences in People with Obesity: A Systematic Review. PLoS ONE 2021, 16, e0253114. [Google Scholar] [CrossRef] [Scilit]
- Ayyaswami, V.; Subramanian, J.; Nickerson, J.; Erban, S.; Rosano, N.; McManus, D.D.; Gerber, B.S.; Faro, J.M. A Clinician and Electronic Health Record Wearable Device Intervention to Increase Physical Activity in Patients with Obesity: Formative Qualitative Study. JMIR Form. Res. 2024, 8, e56962. [Google Scholar] [CrossRef] [Scilit]
- Coelho-Oliveira, A.C.; Monteiro-Oliveira, B.B.; Gonçalves de Oliveira, R.; Reis-Silva, A.; Ferreira-Souza, L.F.; Lacerda, A.C.R.; Mendonça, V.A.; Sartorio, A.; Taiar, R.; Bernardo-Filho, M.; et al. Evidence of Use of Whole-Body Vibration in Individuals with Metabolic Syndrome: A Systematic Review and Meta-Analysis. Int. J. Environ. Res. Public Health 2023, 20, 3765. [Google Scholar] [CrossRef] [Scilit]
- Rubio-Arias, J.Á.; Martínez-Aranda, L.M.; Andreu-Caravaca, L.; Sanz, G.; Benito, P.J.; Ramos-Campo, D.J. Effects of Whole-Body Vibration Training on Body Composition, Cardiometabolic Risk, and Strength in the Population Who Are Overweight and Obese: A Systematic Review With Meta-Analysis. Arch. Phys. Med. Rehabil. 2021, 102, 2442–2453. [Google Scholar] [CrossRef] [Scilit]
- Jo, N.G.; Kang, S.R.; Ko, M.H.; Yoon, J.Y.; Kim, H.S.; Han, K.S.; Kim, G.W. Effectiveness of Whole-Body Vibration Training to Improve Muscle Strength and Physical Performance in Older Adults: Prospective, Single-Blinded, Randomized Controlled Trial. Healthcare 2021, 9, 652. [Google Scholar] [CrossRef] [Scilit] [PubMed]
- van Heuvelen, M.J.G.; Rittweger, J.; Judex, S.; Sañudo, B.; Seixas, A.; Fuermaier, A.B.M.; Tucha, O.; Nyakas, C.; Marín, P.J.; Taiar, R.; et al. Reporting Guidelines for Whole-Body Vibration Studies in Humans, Animals and Cell Cultures: A Consensus Statement from an International Group of Experts. Biology 2021, 10, 965. [Google Scholar] [CrossRef] [Scilit] [PubMed]
- Rauch, F.; Sievanen, H.; Boonen, S.; Cardinale, M.; Degens, H.; Felsenberg, D.; Roth, J.; Schoenau, E.; Verschueren, S.; Rittweger, J. Reporting Whole-Body Vibration Intervention Studies: Recommendations of the International Society of Musculoskeletal and Neuronal Interactions. J. Musculoskelet. Neuronal Interact. 2010, 10, 193. [Google Scholar] [PubMed]
- Sá-Caputo, D.C.; Taiar, R.; Bernardo-Filho, M. Whole-Body Vibration Exercise as an Intervention to Improve Musculoskeletal Performance; IntechOpen: London, UK, 2019. [Google Scholar] [CrossRef] [Scilit]
- Rittweger, J.; Beller, G.; Felsenberg, D. Acute Physiological Effects of Exhaustive Whole-Body Vibration Exercise in Man. Clin. Physiol. 2000, 20, 134–142. [Google Scholar] [CrossRef] [Scilit]
- Conselho Nacional de Saúde. Plataforma Brasil. 2025. Available online: https://www.gov.br/conselho-nacional-de-saude/pt-br/camaras-tecnicas-e-comissoes/conep/plataforma-brasil (accessed on 11 January 2026).
- Random.org. RANDOM.ORG—List Randomizer. 2019. Available online: https://www.random.org/lists/ (accessed on 6 June 2025).
- World Health Organization. 2025. Available online: https://www.who.int/ (accessed on 11 January 2026).
- Moura-Fernandes, M.C.; Moreira-Marconi, E.; de Meirelles, A.G.; Reis-Silva, A.; de Souza, L.F.F.; Lírio Pereira da Silva, A.; de Oliveira, B.B.M.; de Souza Gama, M.A.; de Oliveira, A.C.C.; Batouli-Santos, D.; et al. Acute Effects of Whole-Body Vibration Exercise on Pain Level, Functionality, and Rating of Exertion of Elderly Obese Knee Osteoarthritis Individuals: A Randomized Study. Appl. Sci. 2020, 10, 5870. [Google Scholar] [CrossRef] [Scilit]
- Orkin, S.; Yodoshi, T.; Romantic, E.; Hitchcock, K.; Arce-Clachar, A.C.; Bramlage, K.; Sun, Q.; Fei, L.; Xanthakos, S.A.; Trout, A.T.; et al. Body Composition Measured by Bioelectrical Impedance Analysis Is a Viable Alternative to Magnetic Resonance Imaging in Children with Nonalcoholic Fatty Liver Disease. JPEN J. Parenter. Enteral Nutr. 2022, 46, 378–384. [Google Scholar] [CrossRef] [Scilit]
- Assefa, M.; Tsegaye, A.; Addissie, A.; Worku, A. Body Composition-Derived Abdominal Circumference, Waist-to-Hip Ratio, and Waist-to-Height Ratio Cut-Offs for Ethiopian Adults in Northwest Ethiopia, 2023. J. Health Popul. Nutr. 2024, 43, 185. [Google Scholar] [CrossRef] [Scilit]
- Ross, R.; Neeland, I.J.; Yamashita, S.; Shai, I.; Seidell, J.; Magni, P.; Santos, R.D.; Arsenault, B.; Cuevas, A.; Hu, F.B.; et al. Waist Circumference as a Vital Sign in Clinical Practice: A Consensus Statement from the IAS and ICCR Working Group on Visceral Obesity. Nat. Rev. Endocrinol. 2020, 16, 177–189. [Google Scholar] [CrossRef] [Scilit]
- Li, F.; Wilkens, L.R.; Novotny, R.; Fialkowski, M.K.; Paulino, Y.C.; Nelson, R.; Bersamin, A.; Martin, U.; Deenik, J.; Boushey, C.J. Anthropometric Measurement Standardization in the US-Affiliated Pacific: Report from the Children’s Healthy Living Program. Am. J. Hum. Biol. 2016, 28, 364–371. [Google Scholar] [CrossRef] [Scilit]
- Jaeschke, L.; Steinbrecher, A.; Pischon, T. Measurement of Waist and Hip Circumference with a Body Surface Scanner: Feasibility, Validity, Reliability, and Correlations with Markers of the Metabolic Syndrome. PLoS ONE 2015, 10, e0119430. [Google Scholar] [CrossRef] [Scilit]
- Azarbad, A.; Aghnia, T.; Gharibzadeh, A.; Rafati, S.; Hashemi, S.M.; Zarei, H.; Kheirandish, M. Cut-Off Points for Anthropometric Indices to Screen for Hypertension among Iranian Adults of the Bandare-Kong Cohort: A Cross-Sectional Study. BMC Public Health 2022, 22, 2064. [Google Scholar] [CrossRef] [Scilit] [PubMed]
- Fernandes, D.P.S.; Juvanhol, L.L.; Lozano, M.; Ribeiro, A.Q. Calf Circumference Is an Independent Predictor of Mortality in Older Adults: An Approach with Generalized Additive Models. Nutr. Clin. Pract. 2022, 37, 1190–1198. [Google Scholar] [CrossRef] [Scilit]
- Silva, A.A.G.O.; Araujo, L.F.; Diniz, M.F.H.S.; Lotufo, P.A.; Bensenor, I.M.; Barreto, S.M.; Giatti, L. Neck Circumference and 10-Year Cardiovascular Risk at the Baseline of the ELSA-Brasil Study: Differences by Sex. Arq. Bras. Cardiol. 2020, 115, 840–848. [Google Scholar] [CrossRef] [Scilit] [PubMed]
- Park, M.J.; Hwang, S.Y.; Kim, N.H.; Kim, S.G.; Choi, K.M.; Baik, S.H.; Yoo, H.J. A Novel Anthropometric Parameter, Weight-Adjusted Waist Index Represents Sarcopenic Obesity in Newly Diagnosed Type 2 Diabetes Mellitus. J. Obes. Metab. Syndr. 2023, 32, 130–140. [Google Scholar] [CrossRef] [Scilit] [PubMed]
- Gibson, S.; Ashwell, M. A Simple Cut-Off for Waist-to-Height Ratio (0·5) Can Act as an Indicator for Cardiometabolic Risk: Recent Data from Adults in the Health Survey for England. Br. J. Nutr. 2020, 123, 681–690. [Google Scholar] [CrossRef] [Scilit]
- Branco, M.G.; Mateus, C.; Capelas, M.L.; Pimenta, N.; Santos, T.; Mäkitie, A.; Ganhão-Arranhado, S.; Trabulo, C.; Ravasco, P. Bioelectrical Impedance Analysis (BIA) for the Assessment of Body Composition in Oncology: A Scoping Review. Nutrients 2023, 15, 4792. [Google Scholar] [CrossRef] [Scilit]
- Akahashi, H.; Saito, K. Validation of the Omron HEM-1040 Blood Pressure Monitor According to the American National Standards Institute/Association for the Advancement of Medical Instrumentation/International Organization for Standardization 81060-2:2013 Protocol. Vasc. Health Risk Manag. 2020, 16, 571–575. [Google Scholar] [CrossRef] [Scilit]
- Lack, J.M.; Adekola, B. Blood Pressure and the New ACC/AHA Hypertension Guidelines. Trends Cardiovasc. Med. 2020, 30, 160–164. [Google Scholar] [CrossRef] [Scilit] [PubMed]
- Sobieraj, P.; Siński, M.; Lewandowski, J. Resting Heart Rate and Cardiovascular Outcomes during Intensive and Standard Blood Pressure Reduction: An Analysis from SPRINT Trial. J. Clin. Med. 2021, 10, 3264. [Google Scholar] [CrossRef] [Scilit]
- Tałałaj, M.; Bogołowska-Stieblich, A.; Wąsowski, M.; Sawicka, A.; Jankowski, P. The Influence of Body Composition and Fat Distribution on Circadian Blood Pressure Rhythm and Nocturnal Mean Arterial Pressure Dipping in Patients with Obesity. PLoS ONE 2023, 18, e0281151. [Google Scholar] [CrossRef] [Scilit]
- Goyal, R.; Lata, H.; Walia, L.; Narula, M.K. Effect of Pranayama on Rate Pressure Product in Mild Hypertensives. Int. J. Appl. Basic Med. Res. 2014, 4, 67–71. [Google Scholar] [CrossRef] [Scilit] [PubMed]
- Homan, T.D.; Bordes, S.J.; Cichowski, E. Physiology, Pulse Pressure. In StatPearls; StatPearls Publishing: Treasure Island, FL, USA, 2025. Available online: https://www.ncbi.nlm.nih.gov/books/NBK482408/ (accessed on 11 January 2026).
- Jones, M.T.; Heiden, E.; Fogg, C.; Meredith, P.; Smith, G.; Sayer, N.; Toft, L.; Williams, E.; Williams, M.; Brown, T.; et al. An Evaluation of Agreement of Breathing Rates Measured by a Novel Device, Manual Counting, and Other Techniques Used in Clinical Practice: Protocol for the Observational VENTILATE Study. JMIR Res. Protoc. 2020, 9, e15437. [Google Scholar] [CrossRef] [Scilit] [PubMed]
- Tekin, K.; Karadogan, M.; Gunaydin, S.; Kismet, K. Everything about Pulse Oximetry—Part 1: History, Principles, Advantages, Limitations, Inaccuracies, Cost Analysis, the Level of Knowledge about Pulse Oximeter among Clinicians, and Pulse Oximetry versus Tissue Oximetry. J. Intensive Care Med. 2023, 38, 775–784. [Google Scholar] [CrossRef] [Scilit]
- Lopes, T.R.; Pereira, H.M.; Silva, B.M. Perceived Exertion: Revisiting the History and Updating the Neurophysiology and the Practical Applications. Int. J. Environ. Res. Public Health 2022, 19, 14439. [Google Scholar] [CrossRef] [Scilit]
- Mehmet, H.; Yang, A.W.H.; Robinson, S.R. Measurement of hand grip strength in the elderly: A scoping review with recommendations. J. Bodyw. Mov. Ther. 2020, 24, 235–243. [Google Scholar] [CrossRef] [Scilit]
- Lee, S.H.; Gong, H.S. Grip Strength Measurement for Outcome Assessment in Common Hand Surgeries. Clin. Orthop. Surg. 2022, 14, 1–12. [Google Scholar] [CrossRef] [Scilit]
- González-Rosalén, J.; Benítez-Martínez, J.C.; Medina-Mirapeix, F.; Cuerda-Del Pino, A.; Cervelló, A.; Martín-San Agustín, R. Intra- and Inter-Rater Reliability of Strength Measurements Using a Pull Hand-Held Dynamometer Fixed to the Examiner’s Body and Comparison with Push Dynamometry. Diagnostics 2021, 11, 1230. [Google Scholar] [CrossRef] [Scilit] [PubMed]
- Lupton-Smith, A.; Fourie, K.; Mazinyo, A.; Mokone, M.; Nxaba, S.; Morrow, B. Measurement of Hand Grip Strength: A Cross-Sectional Study of Two Dynamometry Devices. S. Afr. J. Physiother. 2022, 78, 1768. [Google Scholar] [CrossRef] [Scilit]
- Guralnik, J.M.; Winograd, C.H. Physical Performance Measures in the Assessment of Older Persons. Aging 1994, 6, 303–305. [Google Scholar] [CrossRef] [Scilit]
- Perera, S.; Mody, S.H.; Woodman, R.C.; Studenski, S.A. Meaningful Change and Responsiveness in Common Physical Performance Measures in Older Adults. J. Am. Geriatr. Soc. 2006, 54, 743–749. [Google Scholar] [CrossRef] [Scilit] [PubMed]
- Ko, M.C.; Wu, L.S.; Lee, S.; Wang, C.C.; Lee, P.F.; Tseng, C.Y.; Ho, C.C. Whole-Body Vibration Training Improves Balance Control and Sit-to-Stand Performance among Middle-Aged and Older Adults: A Pilot Randomized Controlled Trial. Eur. Rev. Aging Phys. Act. 2017, 14, 11. [Google Scholar] [CrossRef] [Scilit] [PubMed]
- Reis-Silva, A.; Coelho-Oliveira, A.C.; Martins-Anjos, E.; Moura-Fernandes, M.C.; Mulder, A.; Xavier, V.L.; Mendonça, V.A.; Lacerda, A.C.R.; Paineiras-Domingos, L.L.; Taiar, R.; et al. Impact of Two Whole-Body Vibration Exercise Protocols on Body Composition of Patients with Metabolic Syndrome: A Randomized Controlled Trial. Int. J. Environ. Res. Public Health 2022, 20, 436. [Google Scholar] [CrossRef] [Scilit] [PubMed] [PubMed Central]
- Heinrich-Heine-Universität Düsseldorf. GPower. Software Informer. 2019. Available online: https://gpower.software.informer.com/3.1/ (accessed on 11 January 2026).
- Sá-Caputo, D.; Paineiras-Domingos, L.L.; Francisca-Santos, A.; Anjos, E.M.D.; Reis, A.S.; Neves, M.F.T.; Oigman, W.; Oliveira, R.; Brandão, A.; Machado, C.B.; et al. Whole-Body Vibration Improves the Functional Parameters of Individuals with Metabolic Syndrome: An Exploratory Study. BMC Endocr. Disord. 2019, 19, 6. [Google Scholar] [CrossRef] [Scilit]
- R Core Team. R: A Language and Environment for Statistical Computing, Version 4.5.1; R Foundation for Statistical Computing: Vienna, Austria, 2025. Available online: https://www.r-project.org/ (accessed on 11 January 2026).
- Carpio-Rivera, E.; Moncada-Jiménez, J.; Salazar-Rojas, W.; Solera-Herrera, A. Acute Effects of Exercise on Blood Pressure: A Meta-Analytic Investigation. Arq. Bras. Cardiol. 2016, 106, 422–433. [Google Scholar] [CrossRef] [Scilit]
- Powell-Wiley, T.M.; Poirier, P.; Burke, L.E.; Després, J.P.; Gordon-Larsen, P.; Lavie, C.J.; Lear, S.A.; Ndumele, C.E.; Neeland, I.J.; Sanders, P.; et al. Obesity and Cardiovascular Disease: A Scientific Statement from the American Heart Association. Circulation 2021, 143, e984–e1010. [Google Scholar] [CrossRef] [Scilit]
- Aoyama, A.; Yamaoka-Tojo, M.; Obara, S.; Shimizu, E.; Fujiyoshi, K.; Noda, C.; Matsunaga, A.; Ako, J. Acute Effects of Whole-Body Vibration Training on Endothelial Function and Cardiovascular Response in Elderly Patients with Cardiovascular Disease. Int. Heart J. 2019, 60, 854–861. [Google Scholar] [CrossRef] [Scilit]
- Jinakote, M.; Yoysungnoen, B.; Vaddhanaphuti, C.S.; Kasiyaphat, A. Combined Effects of Whole-Body Vibration and Dynamic Squats on Cardiovascular and Salivary Biomarker Responses in Healthy Adults. J. Exerc. Rehabil. 2023, 19, 280–292. [Google Scholar] [CrossRef] [Scilit]
- Cardoso, C.G., Jr.; Gomides, R.S.; Queiroz, A.C.; Pinto, L.G.; da Silveira Lobo, F.; Tinucci, T.; Décio, M., Jr.; de Moraes Forjaz, C.L. Acute and Chronic Effects of Aerobic and Resistance Exercise on Ambulatory Blood Pressure. Clinics 2010, 65, 317–325. [Google Scholar] [CrossRef] [Scilit]
- Zeigler, Z.S.; Swan, P.D. Acute Effects of Whole-Body Vibration with Resistance Exercise on Postexercise Blood Pressure and Oxygen Consumption in Prehypertensive Adults. J. Exerc. Sci. Fit. 2016, 14, 14–23. [Google Scholar] [CrossRef] [Scilit] [PubMed]
- Figueroa, A.; Kalfon, R.; Madzima, T.A.; Wong, A. Whole-Body Vibration Exercise Training Reduces Arterial Stiffness in Postmenopausal Women with Prehypertension and Hypertension. Menopause 2014, 21, 131–136. [Google Scholar] [CrossRef] [Scilit]
- Games, K.E.; Sefton, J.M.; Wilson, A.E. Whole-Body Vibration and Blood Flow and Muscle Oxygenation: A Meta-Analysis. J. Athl. Train. 2015, 50, 542–549. [Google Scholar] [CrossRef] [Scilit] [PubMed]
- Persichini, R.; Lai, C.; Teboul, J.L.; Adda, I.; Guérin, L.; Monnet, X. Venous return and mean systemic filling pressure: Physiology and clinical applications. Crit. Care 2022, 26, 150. [Google Scholar] [CrossRef] [Scilit]
- Cesanelli, L.; Cesanelli, F.; Degens, H.; Satkunskiene, D. Obesity-Related Reduced Spirometry and Altered Breathing Pattern Are Associated with Mechanical Disadvantage of the Diaphragm. Respir. Physiol. Neurobiol. 2024, 325, 104267. [Google Scholar] [CrossRef] [Scilit]
- Sousa-Gonçalves, C.R.; Tringali, G.; Tamini, S.; De Micheli, R.; Soranna, D.; Taiar, R.; Sá-Caputo, D.; Moreira-Marconi, E.; Paineiras-Domingos, L.; Bernardo-Filho, M.; et al. Acute Effects of Whole-Body Vibration Alone or in Combination with Maximal Voluntary Contractions on Cardiorespiratory, Musculoskeletal, and Neuromotor Fitness in Obese Male Adolescents. Dose-Response 2019, 17, 1559325819890492. [Google Scholar] [CrossRef] [Scilit]
- Gloeckl, R.; Jarosch, I.; Bengsch, U.; Claus, M.; Schneeberger, T.; Andrianopoulos, V.; Christle, J.W.; Hitzl, W.; Kenn, K. What’s the Secret behind the Benefits of Whole-Body Vibration Training in Patients with COPD? A Randomized, Controlled Trial. Respir. Med. 2017, 126, 17–24. [Google Scholar] [CrossRef] [Scilit] [PubMed]
- Tamura, T. Current Progress of Photoplethysmography and SpO2 for Health Monitoring. Biomed. Eng. Lett. 2019, 9, 21–36. [Google Scholar] [CrossRef] [Scilit]
- Della Rocca, Y.; Fonticoli, L.; Rajan, T.S.; Trubiani, O.; Caputi, S.; Diomede, F.; Pizzicannella, J.; Marconi, G.D. Hypoxia: Molecular Pathophysiological Mechanisms in Human Diseases. J. Physiol. Biochem. 2022, 78, 739–752. [Google Scholar] [CrossRef] [Scilit]
- Madan, A. Correlation between the Levels of SpO2 and PaO2. Lung India 2017, 34, 307–308. [Google Scholar] [CrossRef] [Scilit]
- Tamini, S.; De Micheli, R.; Tringali, G.; Bernardo-Filho, M.; Sartorio, A. Acute Effects of Whole-Body Vibration Exercises at 2 Different Frequencies Versus an Aerobic Exercise on Some Cardiovascular, Neuromotor and Musculoskeletal Parameters in Adult Patients with Obesity. Dose-Response 2020, 18, 1559325820965005. [Google Scholar] [CrossRef] [Scilit] [PubMed]
- Gojanovic, B.; Henchoz, Y. Whole-Body Vibration Training: Metabolic Cost of Synchronous, Side-Alternating or No Vibrations. J. Sports Sci. 2012, 30, 1397–1403. [Google Scholar] [CrossRef] [Scilit]
- Abercromby, A.F.; Amonette, W.E.; Layne, C.S.; McFarlin, B.K.; Hinman, M.R.; Paloski, W.H. Variation in Neuromuscular Responses during Acute Whole-Body Vibration Exercise. Med. Sci. Sports Exerc. 2007, 39, 1642–1650. [Google Scholar] [CrossRef] [Scilit] [PubMed]
- Oliveira, M.P.; Menzel, H.K.; Cochrane, D.J.; Drummond, M.D.M.; Demicheli, C.; Lage, G.; Couto, B.P. Individual Responses to Different Vibration Frequencies Identified by Electromyography and Dynamometry in Different Types of Vibration Application. J. Strength Cond. Res. 2021, 35, 1748–1759. [Google Scholar] [CrossRef] [Scilit]
- Williams, D.M. Exercise, Affect, and Adherence: An Integrated Model and a Case for Self-Paced Exercise. J. Sport Exerc. Psychol. 2008, 30, 471–496. [Google Scholar] [CrossRef] [Scilit]
- Çevik Saldıran, T.; Atıcı, E.; Öztürk, Ö.; Akgöl, A.C.; Özkeskın, M.; Aydın, G.; Gülere, B.; Yeşilkayae, B.; Naz taşçila, L. Lower Limb Injury History in Elite Athletes: Relationship with Kinesiophobia and Effect on Physical Performance. Turk. Klin. J. Sports Sci. 2020, 12, 1–8. [Google Scholar] [CrossRef] [Scilit]
- Van Ruymbeke, B.; Boone, J.; Coorevits, P.; Vanderstraeten, G.; Bourgois, J. Whole-Body Vibration in Breast Cancer Survivors: A Pilot Study Exploring Its Effects on Muscle Activity and Subjectively Perceived Exertion. Int. J. Rehabil. Res. 2014, 37, 371–374. [Google Scholar] [CrossRef] [Scilit]
- Rendos, N.K.; Jun, H.P.; Pickett, N.M.; Lew Feirman, K.; Harriell, K.; Lee, S.Y.; Signorile, J.F. Acute Effects of Whole-Body Vibration on Balance in Persons with and without Chronic Ankle Instability. Res. Sports Med. 2017, 25, 391–407. [Google Scholar] [CrossRef] [Scilit]
- Freitas, E.D.S.; Frederiksen, C.; Miller, R.M.; Heishman, A.; Anderson, M.; Pardo, G.; Fjeldstad, C.; Bemben, D.A.; Bemben, M.G. Acute and Chronic Effects of Whole-Body Vibration on Balance, Postural Stability, and Mobility in Women with Multiple Sclerosis. Dose-Response 2018, 16, 1559325818816577. [Google Scholar] [CrossRef] [Scilit]
- Lee, K.; Lee, S.; Song, C. Whole-Body Vibration Training Improves Balance, Muscle Strength and Glycosylated Hemoglobin in Elderly Patients with Diabetic Neuropathy. Tohoku J. Exp. Med. 2013, 231, 305–314. [Google Scholar] [CrossRef] [Scilit]
- Paillard, T. The Optimal Method for Improving Postural Balance in Healthy Young and Older People: Specific Training for Postural Tasks Encountered in Personal Physical Practice. Front. Physiol. 2023, 14, 1188496. [Google Scholar] [CrossRef] [Scilit]
- Zhuang, M.; Gu, Y.; Wang, Z.; He, X.; Chen, N. Effects of 12-Week Whole-Body Vibration Training versus Resistance Training in Older People with Sarcopenia. Sci. Rep. 2025, 15, 6981. [Google Scholar] [CrossRef] [Scilit] [PubMed]
- Paineiras-Domingos, L.L.; da Cunha Sá-Caputo, D.; Reis, A.S.; Francisca Santos, A.; Sousa-Gonçalves, C.R.; Dos Anjos, E.M.; Dos Santos Pereira, M.J.; Sartorio, A.; Bernardo-Filho, M. Assessment Through the Short Physical Performance Battery of the Functionality in Individuals with Metabolic Syndrome Exposed to Whole-Body Vibration Exercises. Dose-Response 2018, 16, 1559325818794530. [Google Scholar] [CrossRef] [Scilit]
- Donini, L.M.; Busetto, L.; Bischoff, S.C.; Cederholm, T.; Ballesteros-Pomar, M.D.; Batsis, J.A.; Bauer, J.M.; Boirie, Y.; Cruz-Jentoft, A.J.; Dicker, D.; et al. Definition and Diagnostic Criteria for Sarcopenic Obesity: ESPEN and EASO Consensus Statement. Obes. Facts 2022, 15, 321–335. [Google Scholar] [CrossRef] [Scilit] [PubMed]
- García-Gutiérrez, M.T.; Rhea, M.R.; Marín, P.J. A Comparison of Different Vibration Exercise Techniques on Neuromuscular Performance. J. Musculoskelet. Neuronal Interact. 2014, 14, 303–310. [Google Scholar] [PubMed]
- Santos, L.M.M.; Oliveira, A.C.C.; Fonseca, S.F.; Silva, A.F.; Santos, J.N.V.; Souza, A.L.C.; Santos, J.M.; Ribeiro, V.G.C.; Arrieiro, A.N.; Prates, A.C.N.; et al. Whole-Body Vibration Exercise in Different Postures on Handgrip Strength in Healthy Women: A Cross-Over Study. Front. Physiol. 2021, 11, 469499. [Google Scholar] [CrossRef] [Scilit] [PubMed] [PubMed Central]
- Avelar, N.C.; Salvador, F.S.; Ribeiro, V.G.; Vianna, D.M.; Costa, S.J.; Gripp, F.; Coimbra, C.C.; Lacerda, A.C. Whole Body Vibration and Post-Activation Potentiation: A Study with Repeated Measures. Int. J. Sports Med. 2014, 35, 651–657. [Google Scholar] [CrossRef] [Scilit]
- Dipla, K.; Kousoula, D.; Zafeiridis, A.; Karatrantou, K.; Nikolaidis, M.G.; Kyparos, A.; Gerodimos, V.; Vrabas, I.S. Exaggerated Haemodynamic and Neural Responses to Involuntary Contractions Induced by Whole-Body Vibration in Normotensive Obese versus Lean Women. Exp. Physiol. 2016, 101, 717–730. [Google Scholar] [CrossRef] [Scilit]
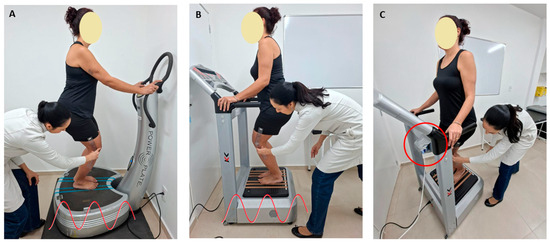
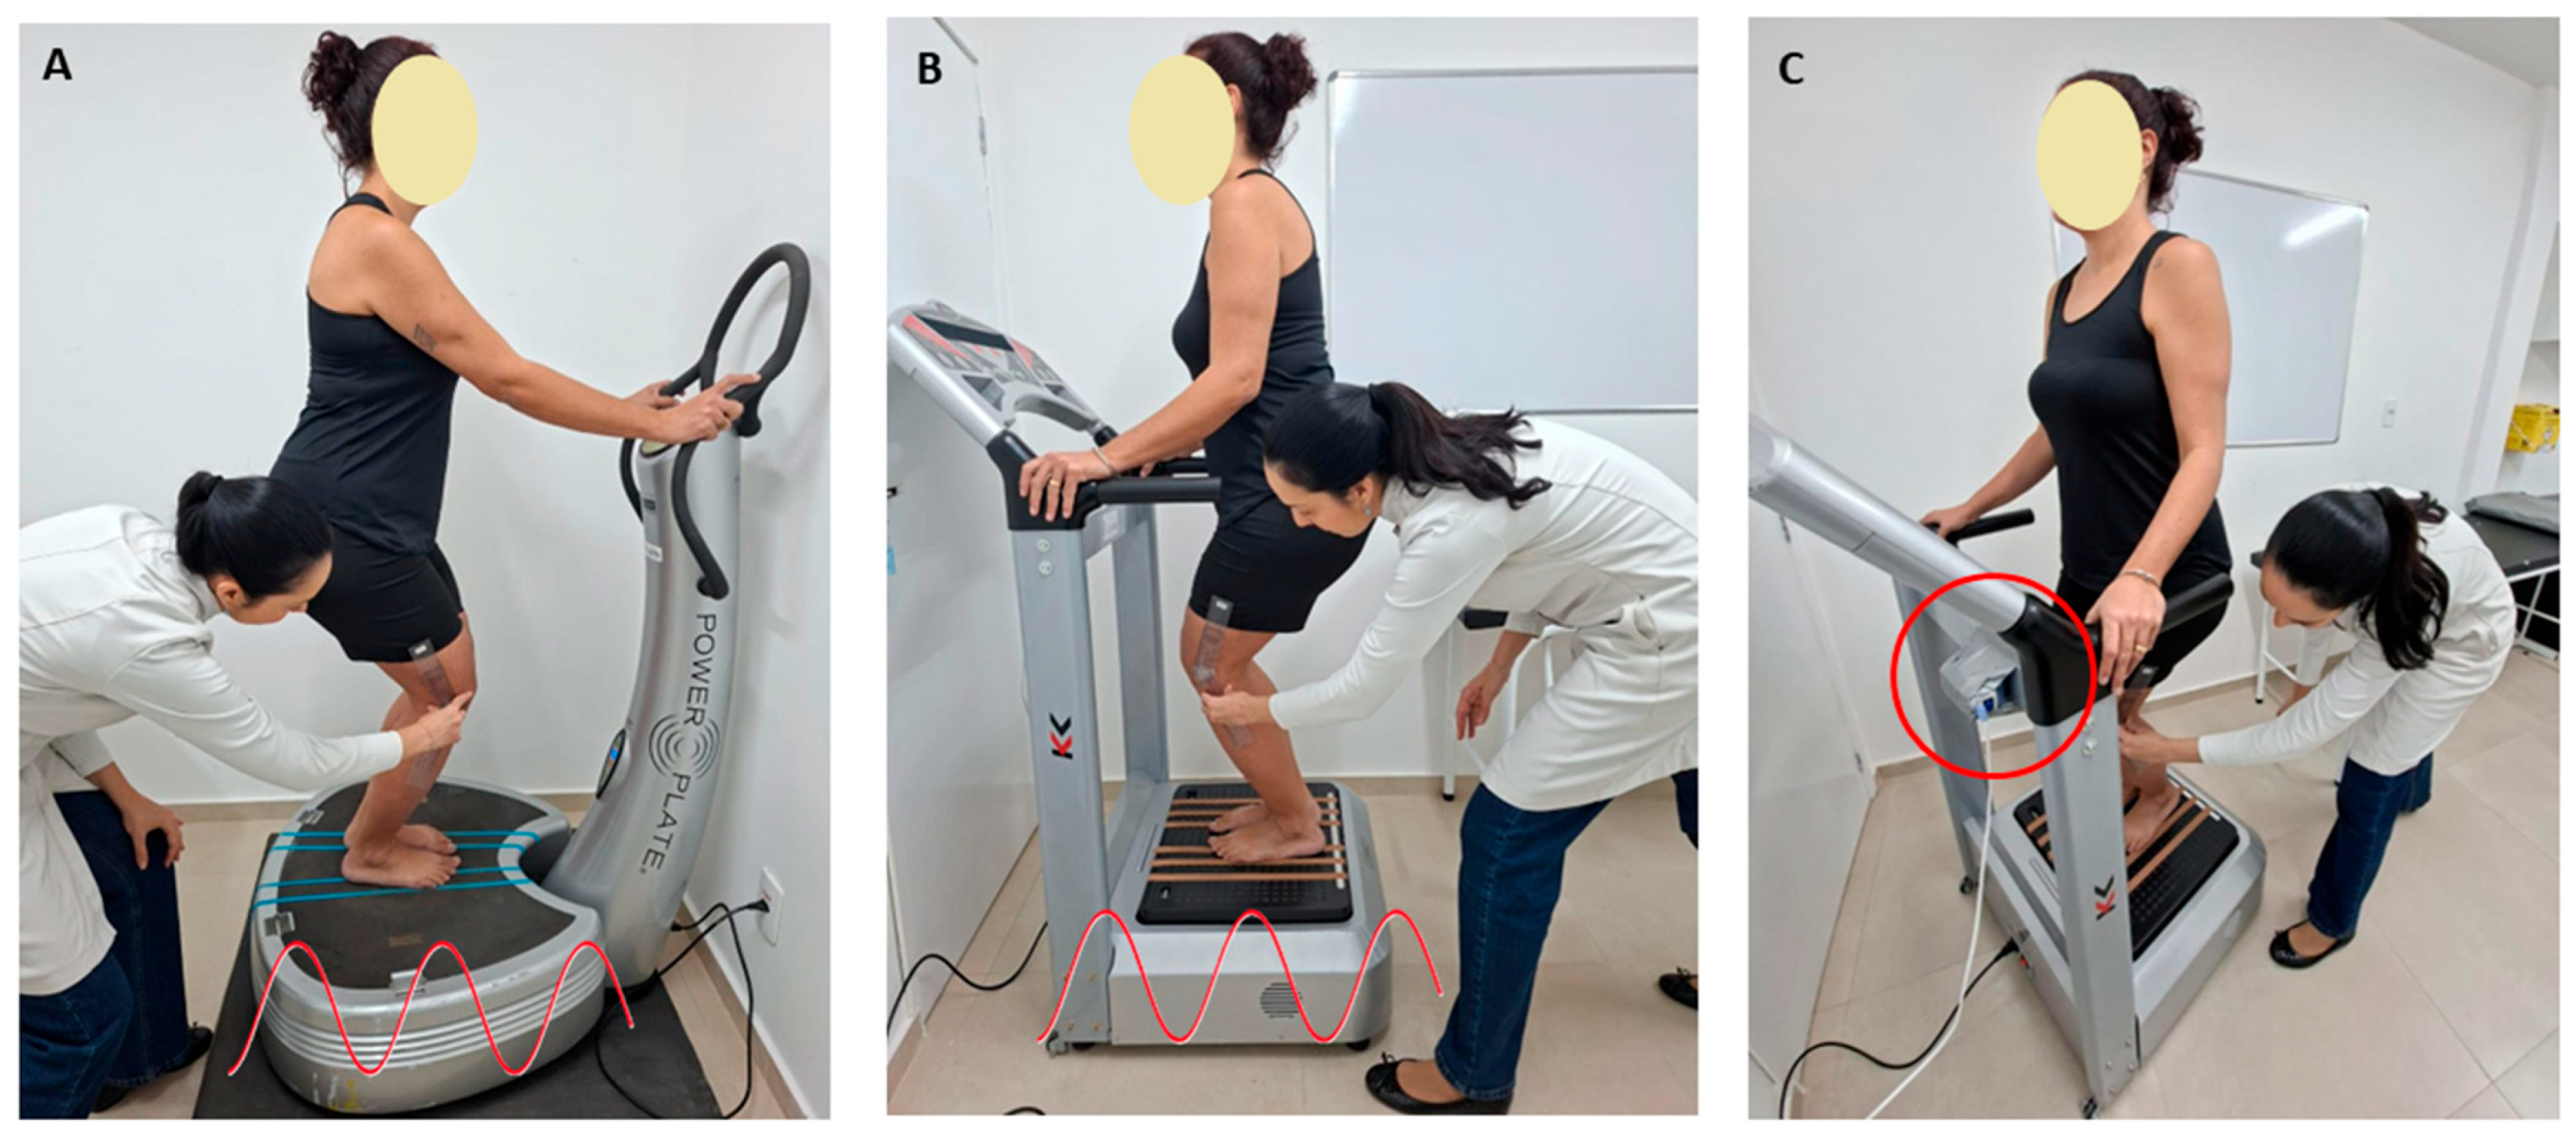
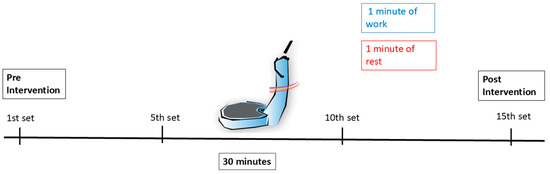
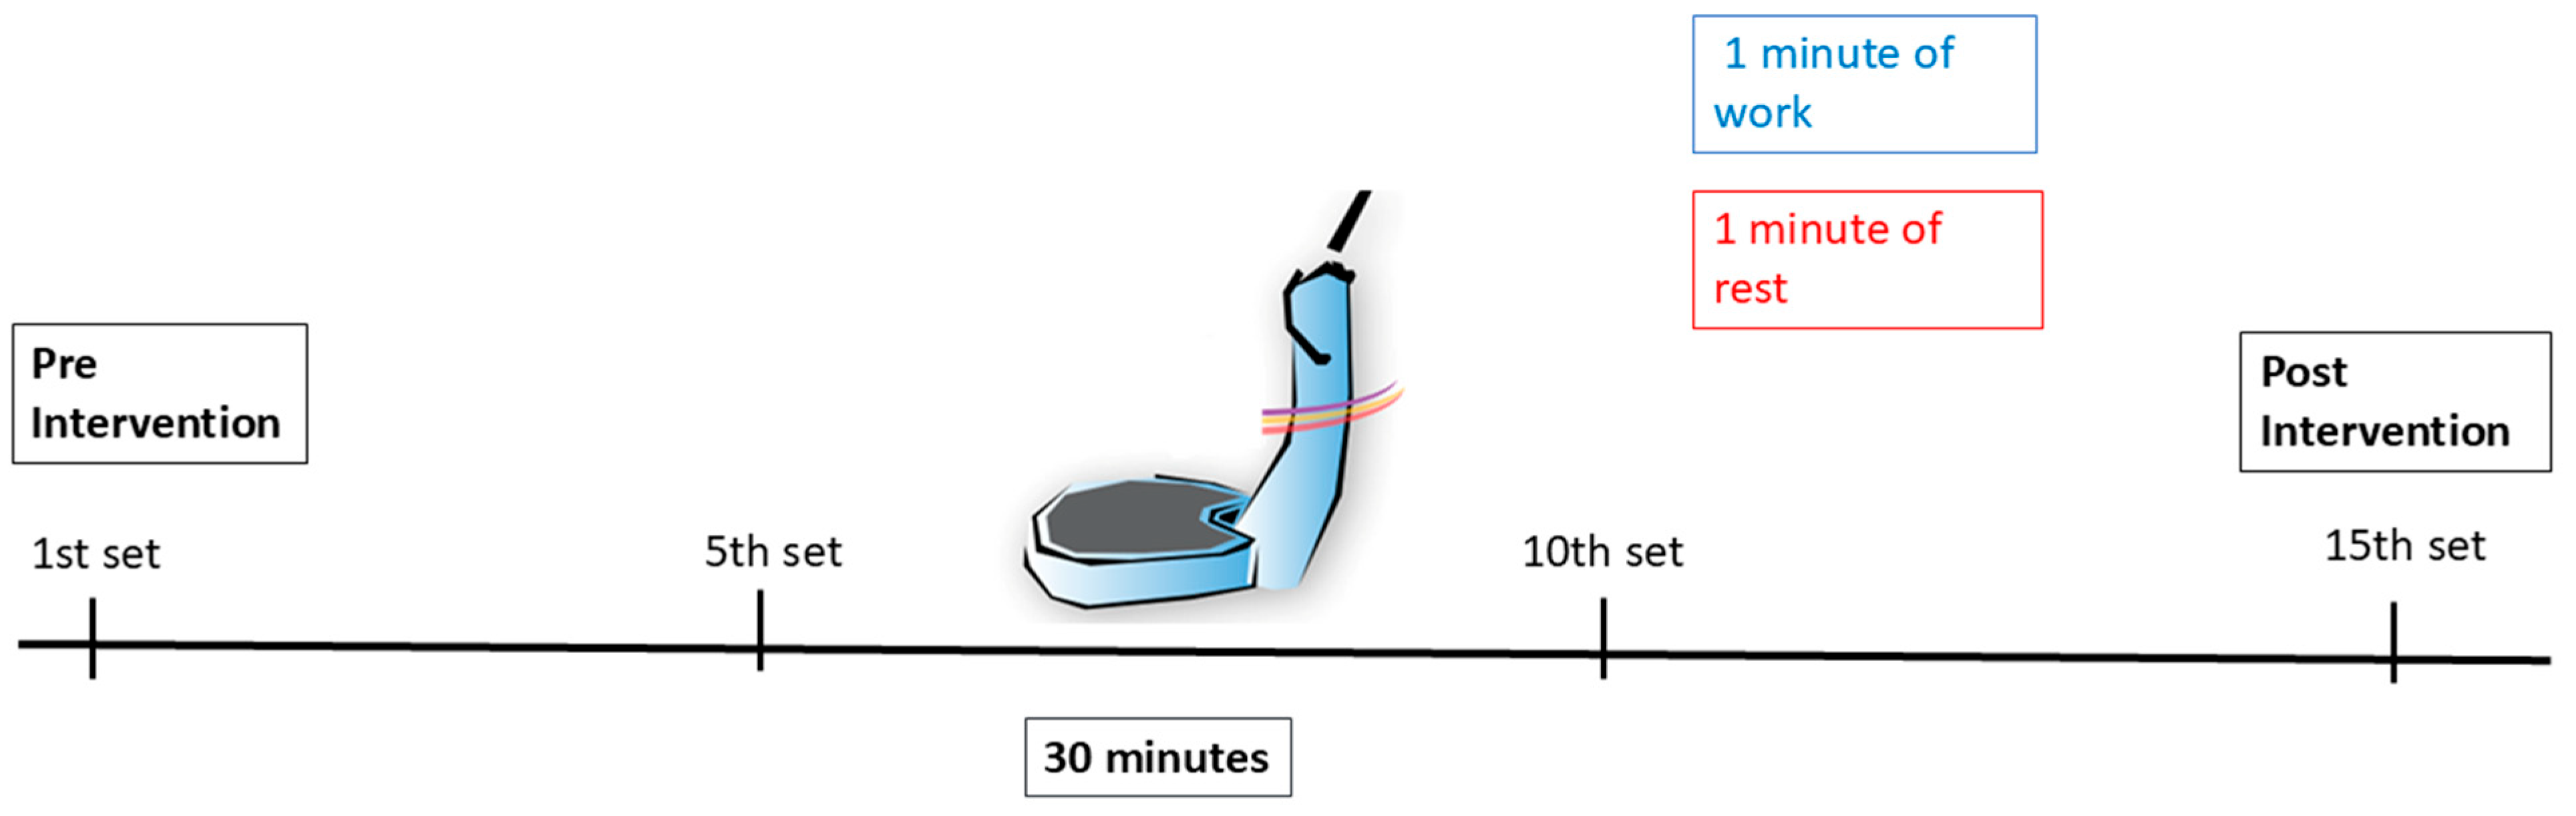

Disclaimer/Publisher’s Note: The statements, opinions and data contained in all publications are solely those of the individual author(s) and contributor(s) and not of MDPI and/or the editor(s). MDPI and/or the editor(s) disclaim responsibility for any injury to people or property resulting from any ideas, methods, instructions or products referred to in the content. |
© 2026 by the authors. Licensee MDPI, Basel, Switzerland. This article is an open access article distributed under the terms and conditions of the Creative Commons Attribution (CC BY) license.