Article

IgG Subclass Profiles of HLA Antibodies Enhance Prediction of C1q-Binding in Kidney Transplant Recipients


1
Department of Laboratory Medicine, Korea University Anam Hospital, Korea University College of Medicine, Seoul 02841, Republic of Korea
2
Department of Laboratory Medicine, Seoul St. Mary’s Hospital, College of Medicine, The Catholic University of Korea, Seoul 06591, Republic of Korea
3
Research and Development Institute for In Vitro Diagnostic Medical Devices, College of Medicine, The Catholic University of Korea, Seoul 06591, Republic of Korea
*
Author to whom correspondence should be addressed.
Diagnostics 2026, 16(2), 207; https://doi.org/10.3390/diagnostics16020207
Submission received: 25 November 2025 / Revised: 29 December 2025 / Accepted: 6 January 2026 / Published: 9 January 2026
(This article belongs to the Section Clinical Laboratory Medicine)

Abstract

Background/Objectives: While standard Luminex single antigen bead (SAB) detects total IgG antibodies, qualitative differences among IgG subclasses may influence their immunologic risk. In particular, complement fixing ability, assessed via C1q binding, is linked to poor transplant outcomes. This study aimed to evaluate the relationship between IgG subclasses and C1q-binding activity in HLA antibodies and to define clinically relevant subclass-specific mean fluorescence intensity (MFI) thresholds for predicting complement binding. Methods: We analyzed 4189 HLA IgG bead reactions from sera of 37 kidney transplant recipients using SAB assays for total IgG, IgG1-4 subclasses, and C1q-binding. IgG subclasses were assessed using a modified SAB assay with subclass-specific monoclonal secondary antibodies. Results: IgG reactivity (MFI ≥ 1000) was observed in 15.3% of beads (639/4189), with 31.0% (198/639) also positive for C1q binding. IgG+C1q+ beads exhibited significantly higher MFIs compared with IgG+C1q beads. IgG1 showed positive correlations with both total IgG (rs = 0.5439, p < 0.0001) and C1q MFIs (rs = 0.4042, p < 0.0001), with the strongest correlations at HLA-DQ. Among subclass-positive beads, IgG1 predominated and was strongly associated with C1q binding, whereas isolated IgG2 or IgG4 positivity was rarely C1q-binding. ROC analysis identified an IgG1 MFI threshold of >837 to predict C1q positivity with 73.2% sensitivity and 92.3% specificity, while the cutoff for total IgG MFI was >7881 with 85.4% sensitivity and 88.9% specificity. At the patient level, IgG1-positive immunodominant DSAs were more frequent in antibody-mediated rejection than in non-rejection biopsies Conclusions: IgG1 predominates among complement-fixing antibodies and correlates strongly with total IgG and C1q binding. Quantitative IgG subclass assessment, especially IgG1, may serve as a useful predictor of complement activation.

1. Introduction

Donor specific HLA antibody (DSA) is associated with antibody mediated rejection (AMR) and graft loss in kidney transplant recipients [1]. Currently, single antigen bead (SAB) assays using Luminex technology have been used to detect total IgG antibody against HLA antigens, providing a semi-quantitative measure of antibody strength through mean fluorescence intensity (MFI) [2]. However, evidence suggests that DSAs vary in their immunologic risk, emphasizing the need to assess qualitative features to improve risk stratification and outcome prediction [3,4,5].
Complement-binding DSAs are strongly associated with AMR and reduced graft survival, highlighting the clinical relevance of complement-activating capacity [6,7,8,9]. C1q and C3d assays allow detection of HLA antibodies capable of initiating the classical complement pathway and provide risk stratification beyond conventional IgG SAB results [10,11]. Loupy et al. reported substantially lower 5-year graft survival among recipients with C1q-positive DSAs, corresponding to a several-fold increase in the risk of graft loss [6]. In addition, the persistence of C1q-positive DSAs after treatment was identified as a strong and independent predictor of inferior graft survival and ongoing antibody-mediated injury in kidney transplant recipients with ABMR [12]. Collectively, these observations highlight the limitations of MFI-based assessment alone and emphasize the need for functional evaluation of DSAs.
IgG subclasses play distinct roles in immune responses and may influence the pathogenicity of DSAs [13]. IgG3 is the most potent activator of complement, followed by IgG1, while IgG2 and IgG4 rarely bind C1q or activate complement [14]. IgG3 and IgG1 also have the highest affinity for the FcgRIIIa activating receptor, mediating NK cell-dependent ADCC [15]. Prior studies have linked IgG1 and IgG3 DSA subclasses to acute rejection, whereas IgG2 and IgG4 are more often associated with subclinical or chronic rejection [3,13,16,17,18,19]. Although subclass profiling of HLA antibodies may have important clinical implications, there is currently no standardized method or widely accepted method for IgG subclass detection in transplantation setting [1]. Previous study has used a modified Luminex SAB assay, in which the conventional pan-IgG secondary antibody is replaced with monoclonal antibodies specific to each IgG subclass (IgG1–IgG4) [20]. However, data on the relationship between IgG subclass distribution and complement-binding activity remain limited.
In this study, we employed a modified Luminex assay to characterize the IgG subclass composition of HLA antibodies in kidney transplant recipients and to evaluate its utility for predicting C1q-binding capacity. By comparing subclass distribution with C1q assay results, we aimed to better define the immunologic features of complement-fixing HLA antibodies and assess the potential value of subclass analysis in improving clinical risk assessment.

2. Materials and Methods

2.1. Study Design and Samples

This study analyzed remnant serum samples from 37 sensitized kidney transplant recipients with assigned HLA antibody specificities, collected at Seoul St. Mary’s Hospital between March 2018 and September 2019. Patients were included if HLA antibodies were detected in prior SAB screening and adequate serum volume was available. The study comprised 23 men (62.2%) and 14 women (37.8%), with a median age of 46 years (range, 22–64 years). Serum samples were obtained around the time of indication biopsies performed for the evaluation of suspected allograft dysfunction. All serum samples were stored at −70 °C until testing. Only a single freeze–thaw cycle was permitted for all SAB procedures. This study was approved by the Seoul St. Mary’s hospital Institutional Review Board (KC18SESI0856, date of approval: 11 January 2019).

2.2. Single Antigen Bead (SAB)-Total IgG Assay

HLA antibodies were detected by LABScreen Single Antigen (One Lambda, Canoga Park, CA, USA) at the time of biopsy. Assay was tested after pretreatment with EDTA as previously described [2]. HLA antibody specificity was interpreted based on baseline mean fluorescence intensity (MFI) values using HLA Fusion™ software (v4.7.1). MFI threshold of >1000 was used to define positivity. The immunodominant DSA of each patient was defined as the DSA with the highest intensity [21].

2.3. Single Antigen Bead (SAB)-C1q Assay

The complement-binding activity of anti-HLA antibodies was assessed using the commercial C1qScreen™ assay (One Lambda, Canoga Park, CA, USA). The HLA LABScreen™ and C1qScreen™ platforms enable the detection and characterization of IgG antibodies directed against HLA class I and class II antigens with the ability to bind C1q. These bead-based assays rely on antigen–antibody interactions that are recognized by C1q molecules, and the subsequent binding events are visualized using fluorophore-conjugated detection antibodies. Fluorescence signals were acquired with a dedicated analyzer and interpreted using HLA Fusion™ software version, which assigns antibody specificity by comparing bead fluorescence intensities with the known antigen targets on each bead [7,22]. All procedures were performed according to the instructions provided by the manufacturer. C1q positivity was defined using MFI threshold of 1000.

2.4. IgG Subclass Analysis

IgG subclass profiling was conducted using an investigational Luminex-based SAB assay provided by One Lambda. The assay was adapted from the standard SAB protocol, replacing the conventional PE-labeled polyclonal anti-human IgG antibody with PE-conjugated murine monoclonal antibodies specific to each IgG subclass. Millipore. The capture antibodies used were anti-IgG1 (clone HP6001), anti-IgG2 (clone HP6002), anti-IgG3 (clone HP6047), and anti-IgG4 (clone HP6023) (SouthernBiotech, Birmingham, AL, USA). Subclass-specific antibody detection was performed for both HLA Class I and Class II antigens. Antibodies with subclass-specific MFIs above 500 were designated positive according to prior validation studies [16,18,19,23,24,25].

2.5. Statistical Analysis

Continuous variables were expressed as mean ± standard deviation or as median with interquartile range, according to distributional characteristics. Group comparisons used Student’s t-test or the Mann–Whitney U test, while categorical variables were analyzed with the chi-square test. Correlations among total IgG, IgG subclasses, and C1q MFIs were examined using spearman’s rank correlation coefficient (rs). Receiver operating characteristic (ROC) curves were used to identify the IgG1 and total IgG MFI cutoff values that best predicted C1q positivity. p < 0.05 were considered significant. All analyses were performed with MedCalc® Statistical Software version 23.4.0 (MedCalc Software Ltd., Ostend, Belgium) and GraphPad Prism 10.5.0 for Windows (GraphPad, San Diego, CA, USA).

3. Results

3.1. Distribution of HLA Antibody Bead Reactions by Total IgG, IgG Subclass and C1q Binding Status

A total of 4189 HLA antibody bead reactions were included, consisting of 1820 (43.5%) HLA class I and 2369 (56.5%) HLA class II beads (Table 1). Of all bead reactions, 15.3% (639/4189) were positive for total IgG antibodies (MFI ≥ 1000), with the highest positivity observed for HLA-DQ (41.3%), followed by HLA-B (22.4%) and HLA-DR (17.4%). Median total IgG MFI values varied markedly by HLA locus, ranging from 2441 for HLA-A to 17,672 for HLA-C. Of the IgG-positive beads, 198 (4.7% of all beads; 31.0% of IgG-positive beads) were also positive for C1q binding, most abundantly within HLA-DQ (54.5%), followed by HLA-DR (19.7%) and HLA-B (15.7%). In contrast, no HLA-DP bead exhibited C1q positivity. Median MFIs for C1q-positive beads exceeded those for C1q-negative beads across nearly all loci, with the highest values noted among HLA-DR and HLA-DQ beads.
Figure 1 compares the MFI distributions of total IgG and each IgG subclass between IgG+C1q+ (n=198) and IgG+C1q (n = 441) bead groups. Compared with IgG+C1q beads, IgG+C1q+ beads demonstrated significantly higher MFIs for total IgG, IgG1, IgG3, and IgG4 (all p < 0.0001). The median total IgG MFI values [min–max] for IgG+C1q+ and IgG+C1q beads were 17,660 [1288–31,091] and 2922 [1011–20,530], respectively. The median IgG1 MFI was also markedly higher in C1q-positive than in C1q-negative beads (2082 vs. 19, p < 0.0001), with comparable differences observed for IgG3 and IgG4 (both p < 0.0001). In contrast, IgG2 MFIs were significantly higher in IgG+C1q beads (p < 0.0001), showing an inverse pattern relative to other subclasses.

3.2. Correlation of IgG Subclass MFI with Total IgG and C1q Reactivity by HLA Locus

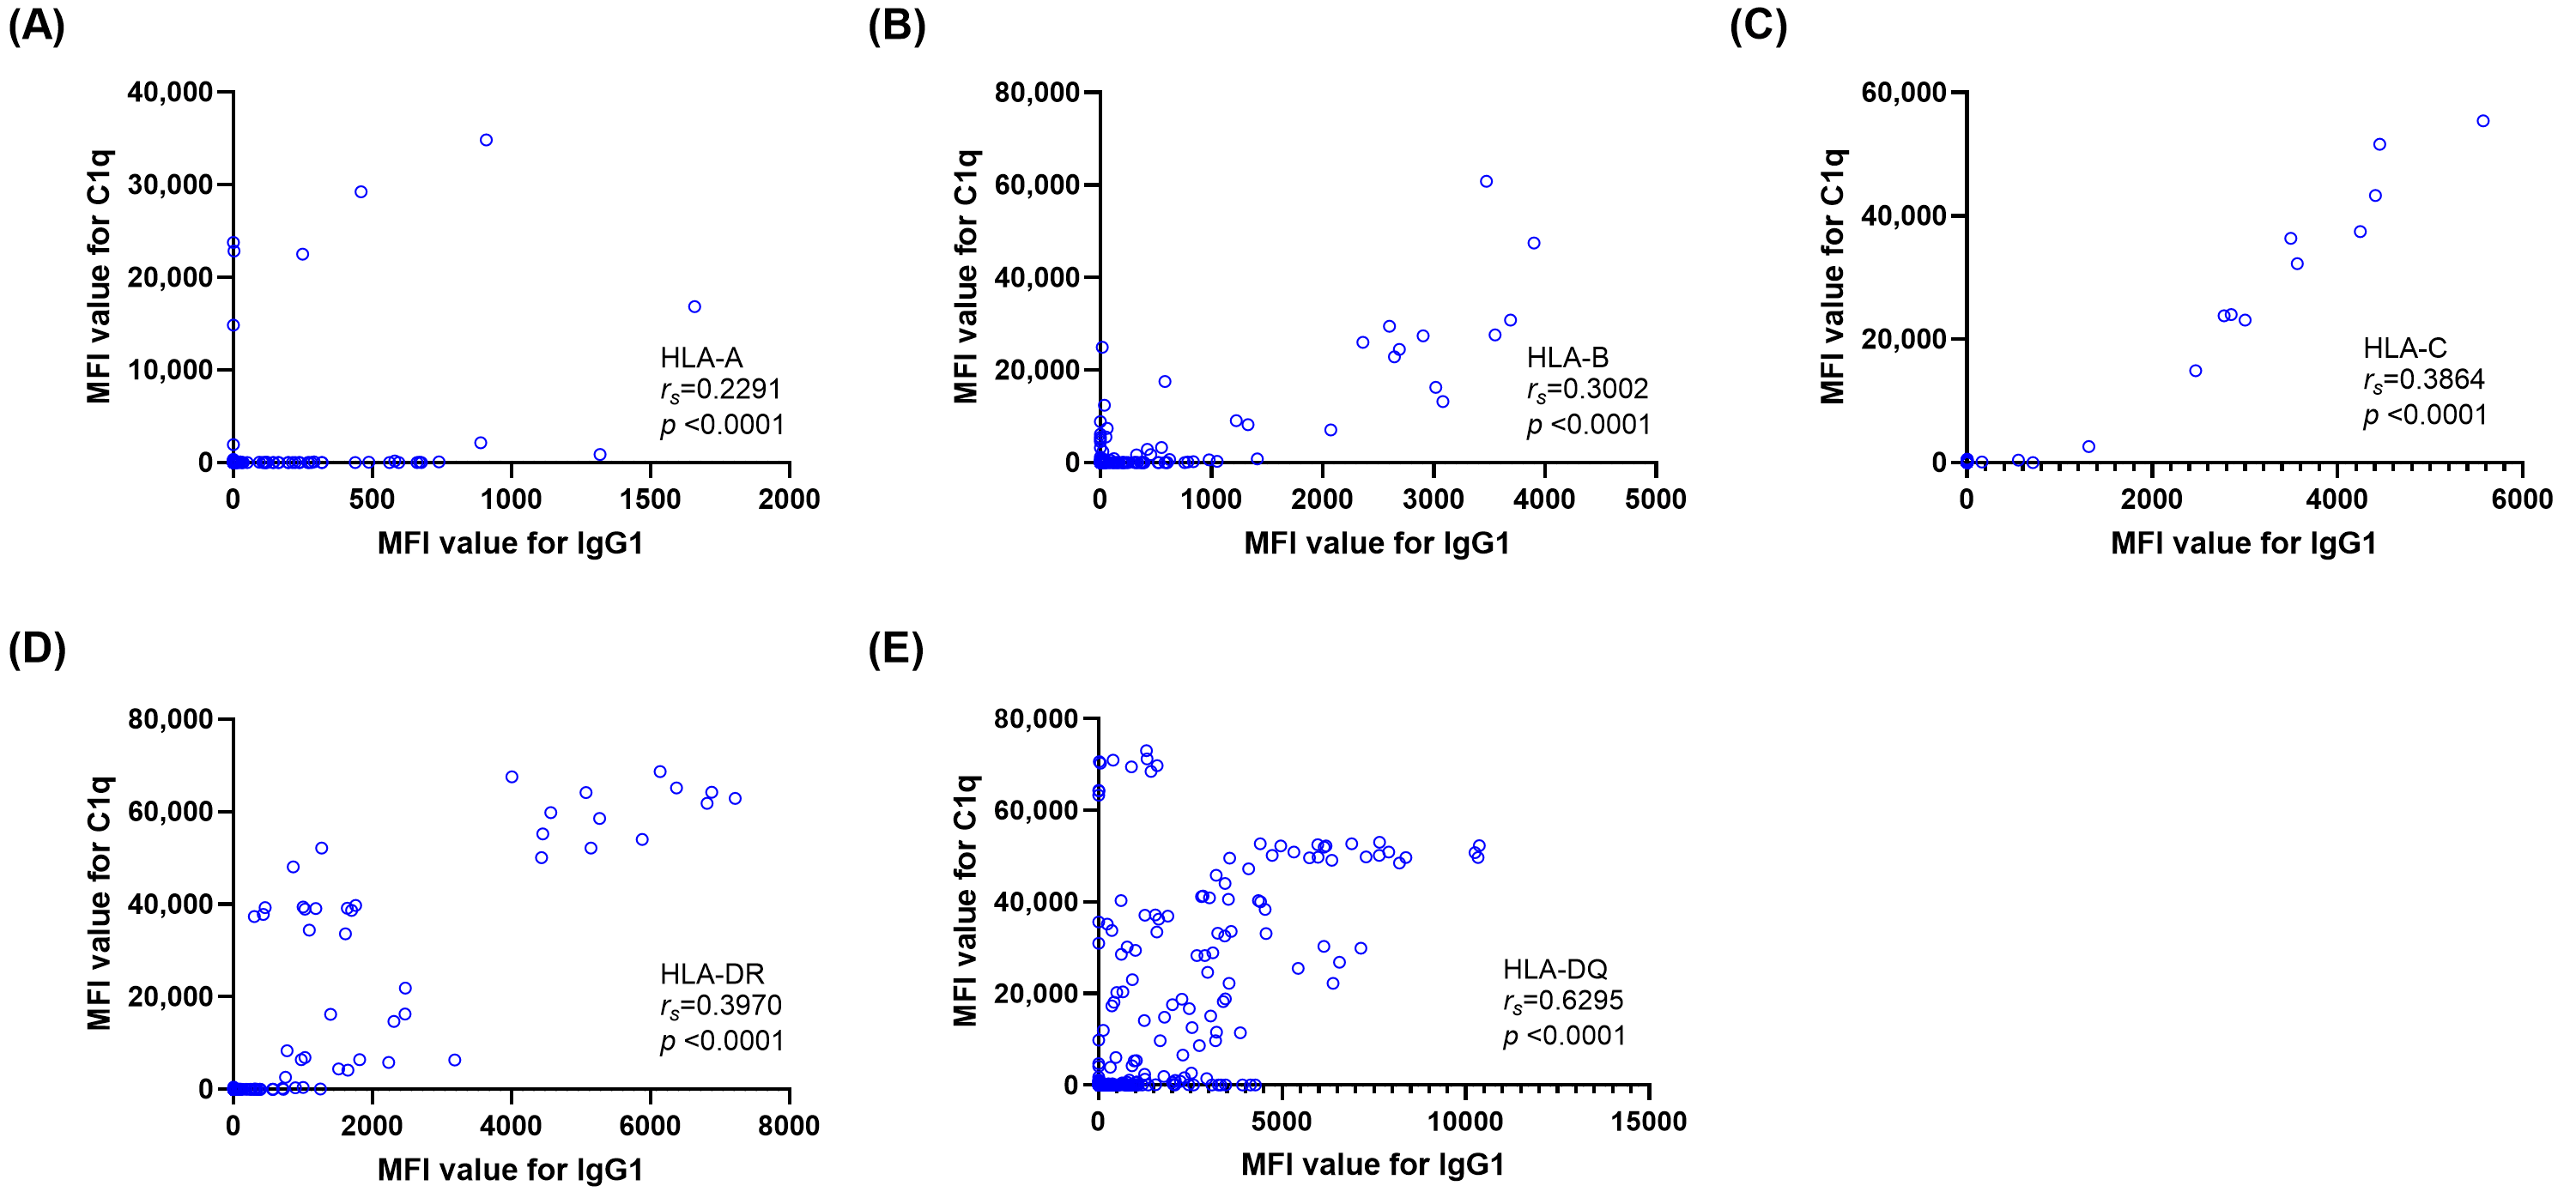
To evaluate the contribution of each IgG subclass to overall antibody reactivity and complement-binding capacity, we assessed the correlations of subclass-specific MFI values and total IgG or C1q MFI values. Among subclass beads, IgG1 MFI showed strong correlation with total IgG MFI (rs= 0.5439, p < 0.0001), with weak to moderate correlation for IgG2 (rs = 0.1287, p <0.0001), IgG3 (rs = 0.2220, p <0.0001), and IgG4 (rs = 0.2091, p < 0.0001) (Figure 2). For C1q-positive beads, IgG1 also showed the strongest correlation with C1q (rs = 0.4042, p <0.0001), while with weak correlation for IgG2 (rs = 0.0903, p <0.0001), IgG3 (rs = 0.1690, p <0.0001), and IgG4 (rs = 0.0916, p <0.0001) (Figure 3). Correlation analyses between IgG1 MFI and total IgG MFI levels by HLA locus showed consistently positive relations across HLA loci (Figure 4). Correlations between IgG1 and total IgG MFI were as follows: HLA-DQ (rs = 0.7982, p < 0.0001), HLA-B (rs = 0.5077, p < 0.0001), HLA-A (rs = 0.5045, p < 0.0001), HLA-DR (rs = 0.4624, p < 0.0001), and HLA-C (rs = 0.4504, p < 0.0001), with the weakest at HLA-DP (rs = 0.1772, p < 0.0001). Similar correlation trends were observed for IgG1 and C1q MFI levels. Correlations between IgG1 and C1q MFI were HLA-DQ (rs = 0.6295, p < 0.0001), HLA-DR (rs = 0.3970, p < 0.0001), HLA-C (rs = 0.3864, p < 0.0001), HLA-B (rs = 0.3002, p < 0.0001), and HLA-A (rs = 0.2291, p < 0.0001), with no correlation with HLA-DP (Figure 5).

3.3. IgG Subclass Positivity in Relation to Total IgG and C1q Binding Activity

Of the 639 total IgG-positive beads, 242 (37.9%) exhibited positive for at least one IgG subclass using an MFI cutoff of ≥500 (Table 2). Among these IgG subclass-positive beads, the majority involved IgG1, either alone or in combination with other subclass beads (n = 227, 93.8%). Among subclass-positive beads, 66.5% (161/242) were also positive for C1q binding. Notably, all IgG3-positive beads (15/15) were C1q-positive, whereas 67.4% (153/227) of IgG1 containing beads showed C1q positivity. Specifically, beads positive for IgG1-alone showed 65.4% (134/205) C1q positivity, compared to 20.0% (1/5) for IgG4-alone beads; none of the IgG2-only positive beads (n = 3) were C1q-positive.
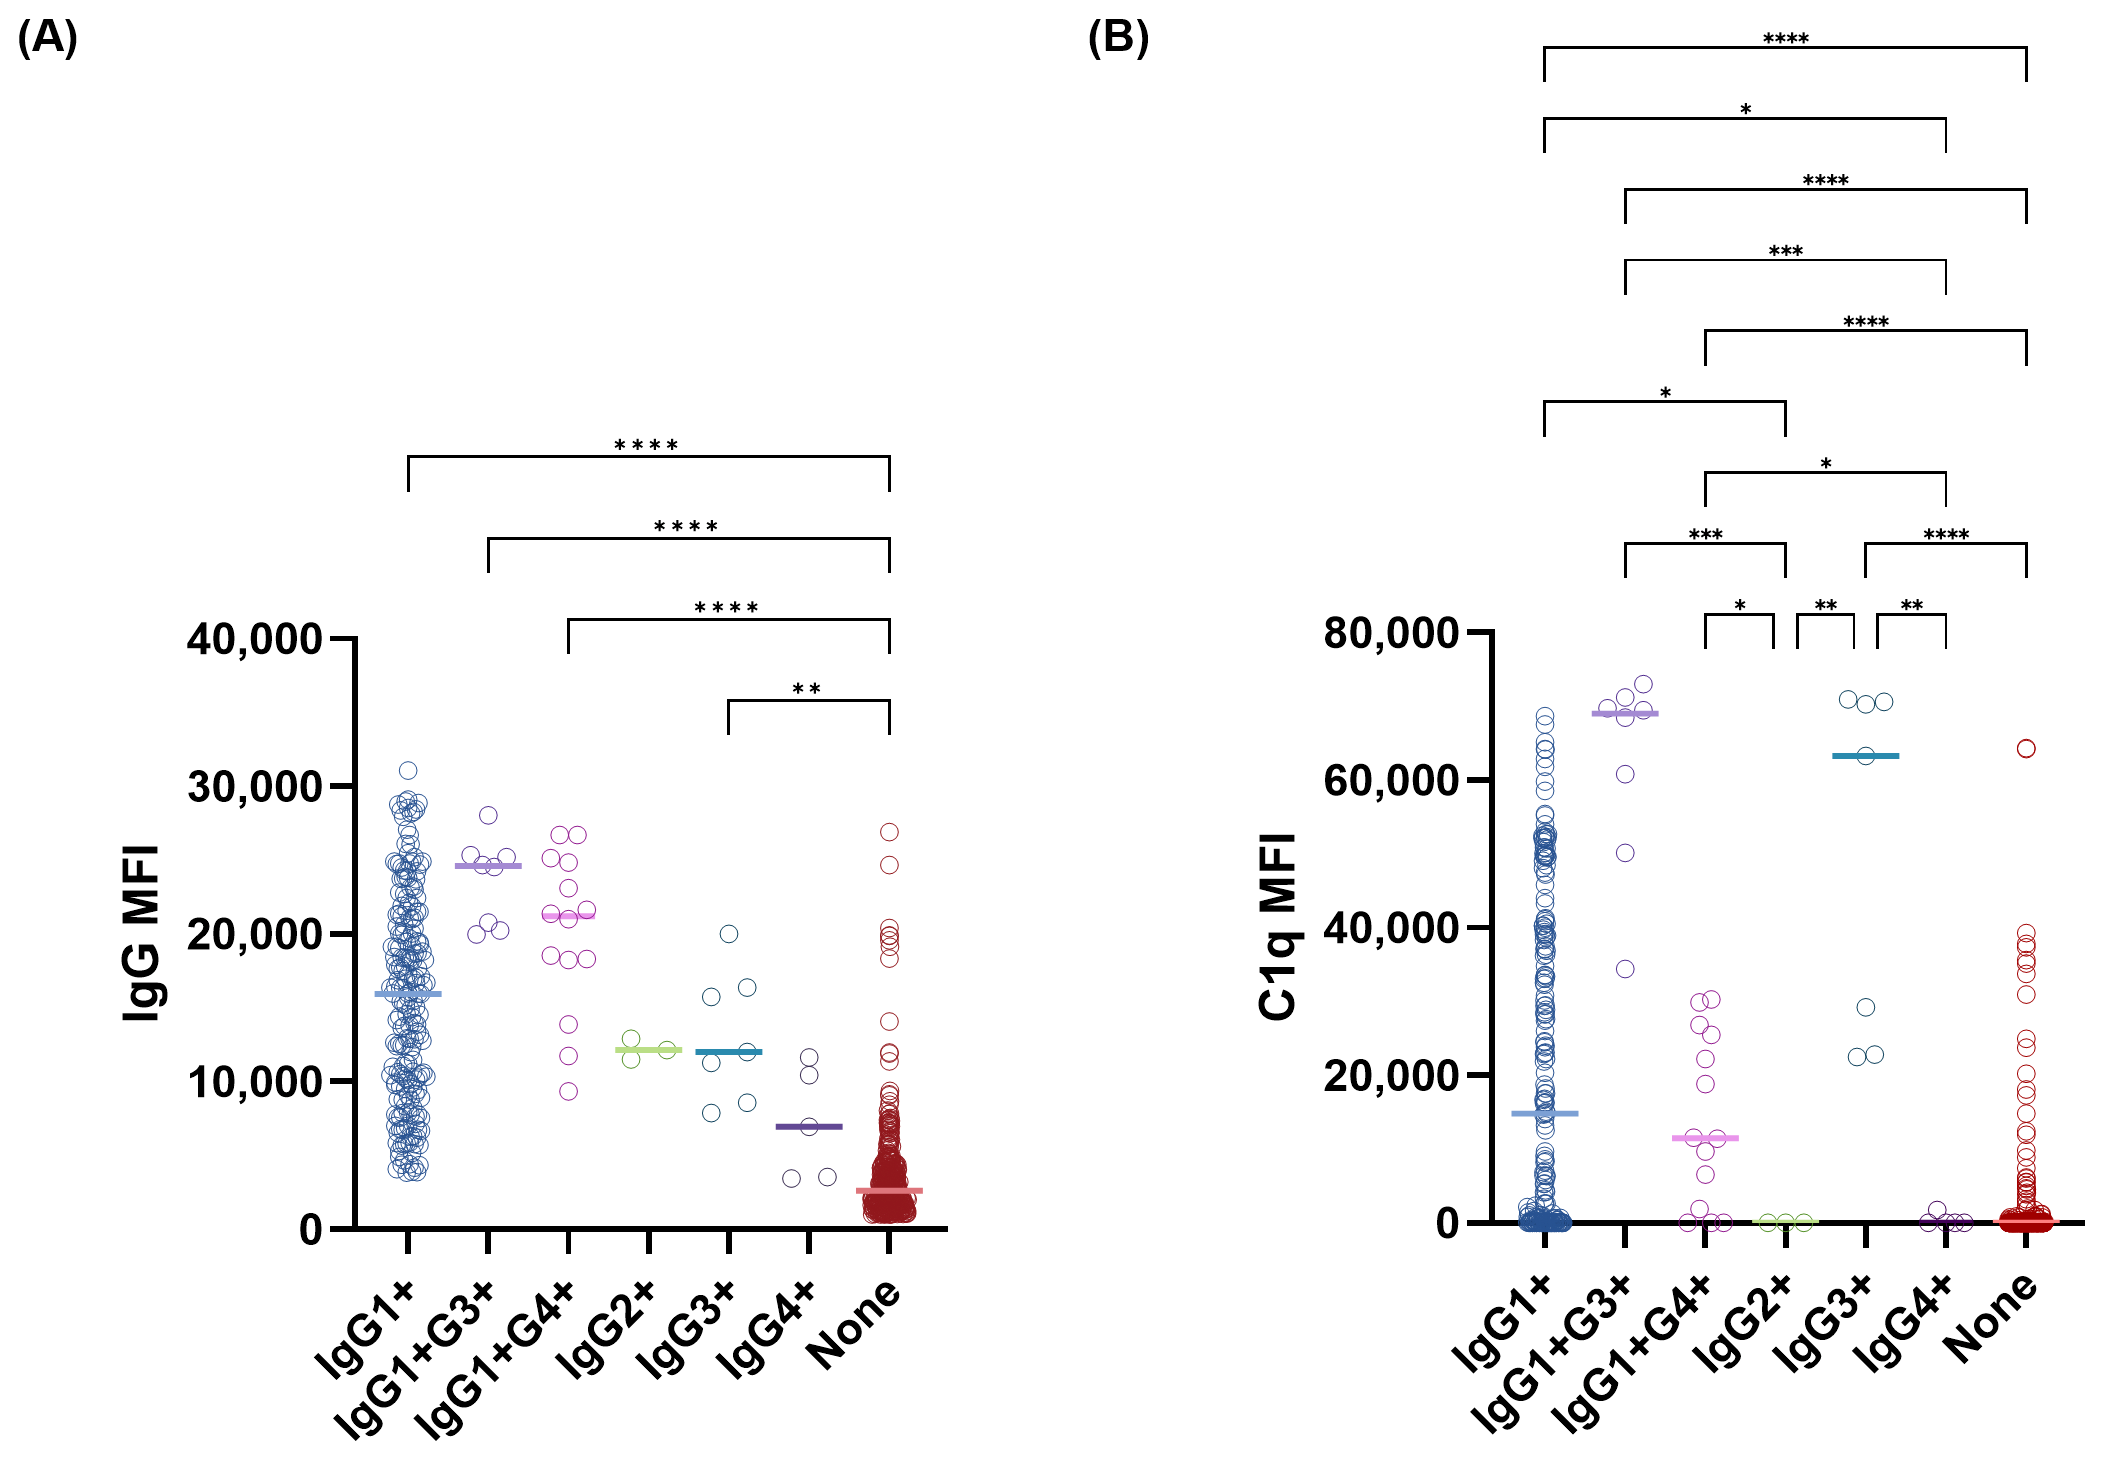
Total IgG MFI values were compared across IgG subclass patterns (Figure 6). Although, there was no statistically significant differences, beads positive for IgG1+G3+ and IgG1+G4+ demonstrated substantially higher total IgG MFIs (median [min–max], 24,628 [19,970–28,044] and 21,201 [9349–26,716], respectively). In contrast, IgG3 single-positive beads showed only intermediate total IgG intensity (median 12,004 [7900–20,002]), while IgG4+ and IgG2+ beads exhibited low reactivity. The subclass-negative group showed the lowest signal levels overall. A similar distributional trend was observed for C1q-binding MFIs. IgG1+G3+ and IgG3+ beads demonstrated the strongest C1q reactivity (median [min–max], 69,006 [34,420–73,037] and 63,302 [22,507–70,948], respectively), followed by IgG1 and IgG1+G4+, whereas IgG2+, IgG4+, and subclass-negative groups showed negligible C1q activation. Notably, the IgG1+G4+ group demonstrated significantly higher C1q MFI compared with the IgG4-only group (11,480 [13–30,322] vs. 0 [0–1771], p <0.05).

3.4. Predictive Performance of Total IgG and IgG Subclasses for C1q Binding Activity

To evaluate the predictive performance of total IgG and IgG subclasses for C1q-binding activity, ROC curve analysis was performed (Figure 7). Among 639 total IgG-positive beads (198 C1q-positive, 441 C1q-negative), total IgG revealed the best discrimination with an optimal cutoff > 7881, yielding 85.4% sensitivity and 88.9% specificity (AUC = 0.927, 95% CI: 0.904–0.946). The IgG1 subclass MFI also showed good predictive ability, with a cutoff > 837 yielding 73.2% sensitivity and 92.3% specificity (AUC = 0.865, 95% CI: 0.836–0.891). In contrast, IgG2, IgG3, and IgG4 yielded lower AUCs (0.549, 0.625, and 0.580, respectively). When stratified by HLA locus, IgG1 MFI showed perfect predictive capacity at HLA-C (AUC = 1.0), with 100% sensitivity and specificity at a cutoff of ≥731. HLA-DR followed closely (AUC = 0.983), achieving 92.3% sensitivity and 95.8% specificity at ≥716. HLA-DQ showed moderate predictive performance (AUC = 0.842), with 70.4% sensitivity and 90.4% specificity at a cutoff of ≥1187.

3.5. Patient-Level Characteristics of Immunodominant DSA According to Biopsy Diagnosis and Pre-Transplant DSA Status

Patient-level characteristics of immunodominant DSAs were compared between patients with AMR (n = 27) and those without AMR (n = 10), the latter including cases of T cell–mediated rejection, acute tubular necrosis, myocardial infarction, BK virus nephropathy, and interstitial fibrosis/tubular atrophy (Table 3). The median immunodominant DSA MFI was higher in the AMR group than in the non-AMR group (9938 [IQR, 4875–19,766] vs. 3879 [IQR, 3402–12,004]), although this difference did not reach statistical significance (p = 0.0873). C1q-positive immunodominant DSAs were detected in 11 patients (40.7%) with AMR and in 3 patients (30.0%) without AMR (p = 0.5566). In contrast, IgG1-positive immunodominant DSAs were significantly more frequent among patients with AMR compared with those without AMR (66.7% vs. 30.0%, p = 0.0484). The proportion of immunodominant DSAs that were both IgG1-positive and C1q-positive did not differ significantly between the AMR and non-AMR groups (33.3% vs. 30.0%, p = 0.8510).
Subgroup analysis according to pre-transplant DSA status revealed distinct patterns. Among patients with pre-transplant DSA (n = 8), 6 (75.0%) developed biopsy-proven AMR. Within this subgroup, IgG1-positive immunodominant DSAs were present in 4 of the 6 AMR cases, whereas none exhibited C1q-positive immunodominant DSAs, indicating the absence of detectable complement-binding activity despite prior sensitization. In contrast, among patients without pre-transplant DSA (n = 29), 21 (72.4%) developed AMR. In this group, IgG1-positive immunodominant DSAs were observed in 14 patients, and C1q-positive immunodominant DSAs in 11 patients, demonstrating the emergence of functionally active, complement-binding antibodies de novo after transplantation. It should be noted that IgG subclass and C1q analyses were performed only on post-transplant biopsy-era sera, as pre-transplant samples were not available for functional profiling Overall, these findings indicate that pre-transplant DSA status alone did not reliably predict IgG subclass composition or complement-binding capacity at the time of biopsy. This highlights the substantial heterogeneity in functional antibody profiles and demonstrates the importance of post-transplant functional antibody characterization

4. Discussion

This study provides a comprehensive evaluation of HLA-specific IgG subclass profiles and C1q-binding activity in kidney transplant recipients. Our findings reinforce the immunologic heterogeneity of HLA antibodies and offer valuable insights into their functional relevance in complement activation.
Although literature on IgG subclass roles in solid organ transplantation remains limited and heterogeneous regarding study design, patient selection, and outcome measures, the predominance of IgG1 subclass was consistently observed [16,18,20,23,24,26,27,28,29]. Our findings align with this consensus, confirming IgG1 as the most prevalent subclass, despite variable proportions of other subclasses across studies.
IgG3, known for its potent complement-fixing ability owing to its extended hinge region and highest affinity for C1q, was infrequently detected in this study. This observation is consistent with a previous study by Navas et al. [24]. The low detectability of IgG3 may be explained by its early expression during class-switch recombination and relatively short half-life in circulation, both of which may reduce its presence in peripheral blood and limit its detection by standard solid-phase assays [30,31].
Among IgG1-positive beads, a significant subset (33.8%) lacked C1q-binding capacity, highlighting that subclass presence alone is insufficient to predict complement activation. Previous reports similarly indicated that C1q positivity occurs predominantly in sera with high MFI IgG1 or the presence of all four subclasses [20]. Schaub et al. demonstrated that C1q binding correlates with antibody density, where many antibodies bearing complement-binding subclasses fail to induce C1q binding in vitro [32].
Notably, IgG1 MFI responses varied across HLA loci, with the highest levels at HLA-DQ suggesting that DSA specificity and subclass distribution jointly influence the risk of complement-mediated injury. HLA-DQ is especially important due to its immunogenicity and strong association with chronic AMR and graft loss [33,34]. These findings underscore the clinical importance of detailed subclass profiling in post-transplant humoral response evaluation.
A major limitation in the wider adoption of IgG subclass analysis remains the lack of standardized, commercially available assays and universal cutoffs. As a result, there is no universally accepted cut-off value for each subclass, and previous studies have used a variety of criteria, including fixed MFI thresholds as 500 [16,18,19,23,24,25,35,36,37], negative control-based calculations [38], and proportional adjustments [39]. Recent advancements, such as the development of novel flow cytometric methods enabling direct detection of recipient IgG subclass antibodies binding to donor cells, offer promising avenues for accurate subclass-specific analysis in a donor-specific context [40].
Importantly, our ROC curve analysis demonstrated that IgG1 MFI is a robust predictor of C1q positivity, with high sensitivity and specificity at optimized thresholds. This finding highlights the clinical utility of subclass-specific quantification, particularly for IgG1, in identifying patients at increased risk for complement-mediated antibody injury. However, total IgG exhibited an even higher AUC for predicting C1q binding, demonstrating the limitations of using subclass data alone—an observation consistent with a previous study [41].
The patient-level analyses based on immunodominant donor-specific antibodies indicate that IgG subclass composition, particularly IgG1, is associated with biopsy-proven AMR, whereas immunodominant DSA MFI and C1q-binding positivity were not. These findings suggest that functional characteristics of DSAs may provide clinically relevant information beyond conventional quantitative or complement-binding metrics. In addition, the heterogeneous IgG subclass and C1q-binding profiles observed irrespective of pre-transplant DSA status underscore the dynamic nature of humoral alloimmune responses and highlight the potential value of functional antibody profiling in interpretating biopsy findings.
The present study has several limitations. The modest sample size from a single center may restrict generalizability, and the IgG subclass assay used was a modified research-use-only platform without inter-laboratory standardization. In addition, the lack of longitudinal clinical outcome data precluded assessment of long-term graft function and survival. Pre-transplant sera were not available for subclass or C1q analysis, preventing longitudinal evaluation of antibody functional evolution. Detailed information regarding individual sensitizing events was also incomplete due to the retrospective study design, limiting stratified analyses by sensitization pathway.
Future prospective studies incorporating serial immunologic assessment with clinical outcomes, including biopsy-proven rejection, graft function, and survival, are needed to validate these findings. Furthermore, systematic documentation of sensitizing histories and temporal analysis of antibody functional changes will be essential to clarify how distinct sensitization pathways influence IgG subclass distribution and complement-binding capacity.
In conclusion, our study highlights the value of integrating IgG subclass analysis with C1q-binding assays in assessing HLA antibodies. IgG1 emerges as the dominant subclass linked to complement-fixing activity, offering improved granularity beyond total IgG quantification. These findings pave the way for functional antibody profiling to enhance risk assessment and ultimately improve transplant outcomes.

5. Conclusions

This study demonstrates that IgG subclass profiling provides important qualitative insights into the heterogeneity of HLA antibodies and their complement-fixing potential in kidney transplant recipients. IgG1 emerged as the dominant subclass associated with high total IgG burden and C1q-binding activity, and quantitative subclass assessment—particularly IgG1 MFI—enhanced the prediction of complement activation beyond standard total IgG SAB results. These findings underscore the potential value of integrating functional antibody characterization into post-transplant immunologic risk assessment.

Author Contributions

Conceptualization, E.-J.O.; methodology, A.-R.C.; validation, J.J.; formal analysis, H.L.; investigation, H.L.; data curation, J.J.; writing—original draft preparation, H.L. and E.-J.O.; writing—review and editing, H.L. and E.-J.O.; visualization, H.L.; supervision, E.-J.O.; project administration, E.-J.O.; funding acquisition, H.L. All authors have read and agreed to the published version of the manuscript.

Funding

This study was supported by a young researcher grant from Korea Society for Transplantation.

Institutional Review Board Statement

The study was conducted in accordance with the Declaration of Helsinki and approved by the Institutional Review Boards of both Seoul St. Mary’s Hospital (KC18SESI0856); date of approval: 11 January 2019.

Informed Consent Statement

Informed consent was waived as the study performed using leftover blood samples.

Data Availability Statement

The data presented in this study are available on request from the corresponding author, subject to ethical and institutional restrictions.

Conflicts of Interest

The authors declare no conflicts of interest.

Abbreviations

The following abbreviations are used in this manuscript:
SABSingle antigen bead 
MFIMean fluorescence intensity 
DSADonor specific HLA antibody 
HLAHuman Leukocyte Antigen 

References

  1. Jucaud, V.; Nguyen, A.; Tran, B.; Hopfield, J.; Pham, T. Validation and cross-reactivity pattern assessment of monoclonal antibodies used for the screening of donor-specific IgG antibody subclasses in transplant recipients. J. Immunol. Methods 2020, 486, 112847. [Google Scholar] [CrossRef] [PubMed]
  2. Kim, H.S.; Choi, A.R.; Yang, M.; Oh, E.J. EDTA Treatment for Overcoming the Prozone Effect and for Predicting C1q Binding in HLA Antibody Testing. Ann. Lab. Med. 2019, 39, 572–576. [Google Scholar] [CrossRef]
  3. Butler, C.L.; Valenzuela, N.M.; Thomas, K.A.; Reed, E.F. Not All Antibodies Are Created Equal: Factors That Influence Antibody Mediated Rejection. J. Immunol. Res. 2017, 2017, 7903471. [Google Scholar] [CrossRef] [PubMed]
  4. Jiang, X.; Shi, Q.S.; Wu, C.-Y.; Xu, L.; Yang, H.; MedhatAskar. Investigative and laboratory assays for allogeneic rejection—A clinical perspective. Transplant. Rep. 2023, 8, 100133. [Google Scholar] [CrossRef]
  5. Lee, H.; Lee, H.; Eum, S.H.; Ko, E.J.; Min, J.W.; Oh, E.J.; Yang, C.W.; Chung, B.H. Impact of Low-Level Donor-Specific Anti-HLA Antibody on Posttransplant Clinical Outcomes in Kidney Transplant Recipients. Ann. Lab. Med. 2023, 43, 364–374. [Google Scholar] [CrossRef]
  6. Loupy, A.; Lefaucheur, C.; Vernerey, D.; Prugger, C.; Duong van Huyen, J.P.; Mooney, N.; Suberbielle, C.; Fremeaux-Bacchi, V.; Mejean, A.; Desgrandchamps, F.; et al. Complement-binding anti-HLA antibodies and kidney-allograft survival. N. Engl. J. Med. 2013, 369, 1215–1226. [Google Scholar] [CrossRef]
  7. Lee, H.; Han, E.; Choi, A.R.; Ban, T.H.; Chung, B.H.; Yang, C.W.; Choi, Y.J.; Oh, E.J. Clinical impact of complement (C1q, C3d) binding De Novo donor-specific HLA antibody in kidney transplant recipients. PLoS ONE 2018, 13, e0207434. [Google Scholar] [CrossRef]
  8. Sicard, A.; Ducreux, S.; Rabeyrin, M.; Couzi, L.; McGregor, B.; Badet, L.; Scoazec, J.Y.; Bachelet, T.; Lepreux, S.; Visentin, J.; et al. Detection of C3d-binding donor-specific anti-HLA antibodies at diagnosis of humoral rejection predicts renal graft loss. J. Am. Soc. Nephrol. 2015, 26, 457–467. [Google Scholar] [CrossRef]
  9. Cozzi, E.; Biancone, L. C1q-binding donor-specific antibody assays help define risk and prognosis in antibody-mediated rejection. Kidney Int. 2018, 94, 657–659. [Google Scholar] [CrossRef]
  10. Moreno Gonzales, M.A.; Mitema, D.G.; Smith, B.H.; Schinstock, C.A.; Stegall, M.D.; Wakefield, L.L.; Henderson, N.A.; DeGoey, S.R.; Kreuter, J.D.; Gandhi, M.J. Comparison Between Total IgG, C1q, and C3d Single Antigen Bead Assays in Detecting Class I Complement-Binding Anti-HLA Antibodies. Transpl. Proc. 2017, 49, 2031–2035. [Google Scholar] [CrossRef]
  11. Taylor, C.J.; Kosmoliaptsis, V.; Martin, J.; Knighton, G.; Mallon, D.; Bradley, J.A.; Peacock, S. Technical Limitations of the C1q Single-Antigen Bead Assay to Detect Complement Binding HLA-Specific Antibodies. Transplantation 2017, 101, 1206–1214. [Google Scholar] [CrossRef]
  12. Viglietti, D.; Bouatou, Y.; Kheav, V.D.; Aubert, O.; Suberbielle-Boissel, C.; Glotz, D.; Legendre, C.; Taupin, J.L.; Zeevi, A.; Loupy, A.; et al. Complement-binding anti-HLA antibodies are independent predictors of response to treatment in kidney recipients with antibody-mediated rejection. Kidney Int. 2018, 94, 773–787. [Google Scholar] [CrossRef]
  13. Pernin, V.; Beyze, A.; Szwarc, I.; Bec, N.; Salsac, C.; Perez-Garcia, E.; Mourad, G.; Merville, P.; Visentin, J.; Perrochia, H.; et al. Distribution of de novo Donor-Specific Antibody Subclasses Quantified by Mass Spectrometry: High IgG3 Proportion Is Associated With Antibody-Mediated Rejection Occurrence and Severity. Front. Immunol. 2020, 11, 919. [Google Scholar] [CrossRef]
  14. Damelang, T.; de Taeye, S.W.; Rentenaar, R.; Roya-Kouchaki, K.; de Boer, E.; Derksen, N.I.L.; van Kessel, K.; Lissenberg-Thunnissen, S.; Rooijakkers, S.H.M.; Jongerius, I.; et al. The Influence of Human IgG Subclass and Allotype on Complement Activation. J. Immunol. 2023, 211, 1725–1735. [Google Scholar] [CrossRef] [PubMed]
  15. Bruhns, P.; Iannascoli, B.; England, P.; Mancardi, D.A.; Fernandez, N.; Jorieux, S.; Daeron, M. Specificity and affinity of human Fcgamma receptors and their polymorphic variants for human IgG subclasses. Blood 2009, 113, 3716–3725. [Google Scholar] [CrossRef] [PubMed]
  16. Lefaucheur, C.; Viglietti, D.; Bentlejewski, C.; Duong van Huyen, J.P.; Vernerey, D.; Aubert, O.; Verine, J.; Jouven, X.; Legendre, C.; Glotz, D.; et al. IgG Donor-Specific Anti-Human HLA Antibody Subclasses and Kidney Allograft Antibody-Mediated Injury. J. Am. Soc. Nephrol. 2016, 27, 293–304. [Google Scholar] [CrossRef]
  17. Valenzuela, N.M.; Hickey, M.J.; Reed, E.F. Antibody Subclass Repertoire and Graft Outcome Following Solid Organ Transplantation. Front. Immunol. 2016, 7, 433. [Google Scholar] [CrossRef]
  18. Kaneku, H.; O’Leary, J.G.; Taniguchi, M.; Susskind, B.M.; Terasaki, P.I.; Klintmalm, G.B. Donor-specific human leukocyte antigen antibodies of the immunoglobulin G3 subclass are associated with chronic rejection and graft loss after liver transplantation. Liver Transpl. 2012, 18, 984–992. [Google Scholar] [CrossRef]
  19. Arnold, M.L.; Ntokou, I.S.; Doxiadis, I.I.; Spriewald, B.M.; Boletis, J.N.; Iniotaki, A.G. Donor-specific HLA antibodies: Evaluating the risk for graft loss in renal transplant recipients with isotype switch from complement fixing IgG1/IgG3 to noncomplement fixing IgG2/IgG4 anti-HLA alloantibodies. Transpl. Int. 2014, 27, 253–261. [Google Scholar] [CrossRef]
  20. Ponsirenas, R.V.G.; Cazarote, H.B.; Araújo, S.A.; Wanderley, D.C.; Shimakura, S.; Valdameri, J.S.; Contieri, F.L.C.; von Glehn, C.; Susin, M.F.; Sotomaior, V.S. Anti-HLA Donor-Specific IgG Subclasses and C1q-binding Evolution in Posttransplant Monitoring. Transpl. Direct 2018, 4, e385. [Google Scholar] [CrossRef] [PubMed]
  21. Bertrand, D.; Dard, C.; Kaveri, R.; Jouve, T.; Malvezzi, P.; Rostaing, L.; Guerrot, D.; Lemoine, M.; Laurent, C.; Noble, J.; et al. Optimizing HLA desensitization: Serum dilution strategies and platform-specific MFI thresholds for antibody-mediated rejection risk in kidney transplantation. Front. Immunol. 2025, 16, 1661977. [Google Scholar] [CrossRef]
  22. Muñoz-Herrera, C.M.; Gutiérrez-Bautista, J.F.; López-Nevot, M. Complement Binding Anti-HLA Antibodies and the Survival of Kidney Transplantation. J. Clin. Med. 2023, 12, 2335. [Google Scholar] [CrossRef] [PubMed]
  23. Cicciarelli, J.C.; Lemp, N.A.; Chang, Y.; Koss, M.; Hacke, K.; Kasahara, N.; Burns, K.M.; Min, D.I.; Naraghi, R.; Shah, T. Renal Transplant Patients Biopsied for Cause and Tested for C4d, DSA, and IgG Subclasses and C1q: Which Humoral Markers Improve Diagnosis and Outcomes? J. Immunol. Res. 2017, 2017, 1652931. [Google Scholar] [CrossRef] [PubMed]
  24. Navas, A.; Molina, J.; Agüera, M.L.; Guler, I.; Jurado, A.; Rodríguez-Benot, A.; Alonso, C.; Solana, R. Characterization of the C1q-Binding Ability and the IgG1-4 Subclass Profile of Preformed Anti-HLA Antibodies by Solid-Phase Assays. Front. Immunol. 2019, 10, 1712. [Google Scholar] [CrossRef] [PubMed]
  25. Freitas, M.C.; Rebellato, L.M.; Ozawa, M.; Nguyen, A.; Sasaki, N.; Everly, M.; Briley, K.P.; Haisch, C.E.; Bolin, P.; Parker, K.; et al. The role of immunoglobulin-G subclasses and C1q in de novo HLA-DQ donor-specific antibody kidney transplantation outcomes. Transplantation 2013, 95, 1113–1119. [Google Scholar] [CrossRef]
  26. Jackson, A.M.; Kanaparthi, S.; Burrell, B.E.; Lucas, D.P.; Vega, R.M.; Demetris, A.J.; Feng, S. IgG4 donor-specific HLA antibody profile is associated with subclinical rejection in stable pediatric liver recipients. Am. J. Transpl. 2020, 20, 513–524. [Google Scholar] [CrossRef]
  27. Hönger, G.; Hopfer, H.; Arnold, M.L.; Spriewald, B.M.; Schaub, S.; Amico, P. Pretransplant IgG subclasses of donor-specific human leukocyte antigen antibodies and development of antibody-mediated rejection. Transplantation 2011, 92, 41–47. [Google Scholar] [CrossRef]
  28. Hamdani, G.; Goebel, J.W.; Brailey, P.; Portwood, E.A.; Hooper, D.K.; Girnita, A.L. IGG3 anti-HLA donor-specific antibodies and graft function in pediatric kidney transplant recipients. Pediatr. Transpl. 2018, 22, e13219. [Google Scholar] [CrossRef]
  29. Lowe, D.; Higgins, R.; Zehnder, D.; Briggs, D.C. Significant IgG subclass heterogeneity in HLA-specific antibodies: Implications for pathogenicity, prognosis, and the rejection response. Hum. Immunol. 2013, 74, 666–672. [Google Scholar] [CrossRef]
  30. Hickey, M.J.; Valenzuela, N.M.; Reed, E.F. Alloantibody Generation and Effector Function Following Sensitization to Human Leukocyte Antigen. Front. Immunol. 2016, 7, 30. [Google Scholar] [CrossRef]
  31. Almagro, J.C.; Daniels-Wells, T.R.; Perez-Tapia, S.M.; Penichet, M.L. Progress and Challenges in the Design and Clinical Development of Antibodies for Cancer Therapy. Front. Immunol. 2017, 8, 1751. [Google Scholar] [CrossRef]
  32. Schaub, S.; Hönger, G.; Koller, M.T.; Liwski, R.; Amico, P. Determinants of C1q binding in the single antigen bead assay. Transplantation 2014, 98, 387–393. [Google Scholar] [CrossRef]
  33. Das, R.; Greenspan, N.S. Understanding HLA-DQ in renal transplantation: A mini-review. Front. Immunol. 2025, 16, 1525306. [Google Scholar] [CrossRef]
  34. Tambur, A.R.; Kosmoliaptsis, V.; Claas, F.H.J.; Mannon, R.B.; Nickerson, P.; Naesens, M. Significance of HLA-DQ in kidney transplantation: Time to reevaluate human leukocyte antigen-matching priorities to improve transplant outcomes? An expert review and recommendations. Kidney Int. 2021, 100, 1012–1022. [Google Scholar] [CrossRef] [PubMed]
  35. Yang, J.J.; Park, B.G.; Choi, H.W.; Song, E.Y.; Yang, J.; Park, J.B.; Kang, E.S. Status quo of histocompatibility testing and prospects for virtual crossmatching within the Korean kidney allocation system: Survey of laboratory directors. Clin. Transpl. Res. 2025, 39, 259–268. [Google Scholar] [CrossRef]
  36. Park, B.G.; Lee, S. Deceased organ donation: Laboratory testing and histocompatibility assessment in Korea. Clin. Transpl. Res. 2025, 39, 243–249. [Google Scholar] [CrossRef]
  37. Kim, T.S.; Oh, I.; Choi, Y.J.; Nam, M.; Lee, H.; Song, E.Y. Effects of Various Concentrations of Pronase on Flow Cytometric Crossmatching Patients Treated With Rituximab and Donor HLA-Specific Antibodies. Ann. Lab. Med. 2024, 44, 545–552. [Google Scholar] [CrossRef] [PubMed]
  38. Khovanova, N.; Daga, S.; Shaikhina, T.; Krishnan, N.; Jones, J.; Zehnder, D.; Mitchell, D.; Higgins, R.; Briggs, D.; Lowe, D. Subclass analysis of donor HLA-specific IgG in antibody-incompatible renal transplantation reveals a significant association of IgG4 with rejection and graft failure. Transpl. Int. 2015, 28, 1405–1415. [Google Scholar] [CrossRef] [PubMed]
  39. Goldsmith, P.; Lowe, D.; Wong, C.; Ridgway, D.; Howse, M.; Hammad, A.; Mehra, S.; Christmas, S.; Jones, A. Investigating the relationship between class I HLA-specific immunoglobulin-G subclasses, Pan-IgG single antigen bead assays and complement mediated interference in sera from renal transplant recipients. Transpl. Immunol. 2020, 63, 101332. [Google Scholar] [CrossRef]
  40. Rao, P.N.; Deo, D.D.; Gaur, A.; Baran, D.A.; Zucker, M.J.; Kapoor, S.; Marchioni, M.A.; Almendral, J.; Kandula, P.; Patel, A. A new flow cytometry assay identifies recipient IgG subtype antibodies binding donor cells: Increasing donor availability for highly sensitised patients. Clin. Transl. Immunol. 2022, 11, e1415. [Google Scholar] [CrossRef]
  41. Harnois, M.J.; Drabik, A.; Snyder, L.; Reed, E.F.; Chen, D.; Li, Y.; Valenzuela, N.M.; Jackson, A.M. Interrogating post-transplant donor HLA-specific antibody characteristics and effector functions using clinical bead assays. Hum. Immunol. 2024, 85, 111094. [Google Scholar] [CrossRef] [PubMed]
Figure 1. Distribution of mean fluorescence intensity (MFI) levels for total IgG (A) and IgG subclasses (BE) in kidney transplant recipient sera classified by IgG and C1q-binding status. (A) MFI levels of total IgG compared between C1q-positive (C1q+) and C1q-negative (C1q) groups. (BE) MFI levels for IgG1 (B), IgG2 (C), IgG3 (D), and IgG4 (E) are shown according to antibody profiles: IgG+/C1q+, IgG+/C1q, and IgG/C1q. Statistical significance is denoted by asterisks (* p < 0.05, ** p < 0.01, **** p < 0.0001).
Diagnostics 16 00207 g001
Figure 2. Correlation between total IgG MFI and IgG subclasses. Correlations between total IgG mean fluorescence intensity (MFI) and subclass-specific MFI for IgG1 (A), IgG2 (B), IgG3 (C), and IgG4 (D) MFIs, respectively. Spearman correlation coefficients (rs) and associated p-values are presented within each panel.
Diagnostics 16 00207 g002
Figure 3. Correlation between C1q MFI and IgG subclasses. Correlations between C1q mean fluorescence intensity (MFI) and subclass-specific MFI for IgG1 (A), IgG2 (B), IgG3 (C), and IgG4 (D) MFIs, respectively. Spearman correlation coefficients (rs) and associated p-values are presented within each panel.
Diagnostics 16 00207 g003
Figure 4. Correlations between total IgG mean fluorescence intensity (MFI) and IgG1 subclass MFI values across HLA loci. Six scatterplots show correlations across HLA-A (A), -B (B), -C (C), -DR (D), -DQ (E), and -DP (F) bead groups. Spearman correlation coefficients (rs) and corresponding p-values are shown in each panel.
Diagnostics 16 00207 g004
Figure 5. Correlations between C1q mean fluorescence intensity (MFI) and IgG1 subclass MFI values across HLA loci. Scatterplots show correlations across HLA-A (A), -B (B), -C (C), -DR (D), and -DQ (E) bead groups. Spearman correlation coefficients (rs) and corresponding p-values are shown in each panel.
Diagnostics 16 00207 g005
Figure 6. Total IgG MFI and C1q MFI distributions according to IgG subclass patterns. Plots illustrate total IgG MFI (A) and C1q MFI (B) distributions according to IgG subclass patterns, including IgG1-only, IgG2-only, IgG3-only, IgG4-only, multi-subclass combinations, and subclass-negative beads. Statistical significance is denoted by asterisks (* p < 0.05, ** p < 0.01, *** p < 0.001, **** p < 0.0001).
Diagnostics 16 00207 g006
Figure 7. Receiver operating characteristic (ROC) curve analysis for prediction of C1q binding by total IgG and IgG subclasses. (A) ROC curves showing predictive performance of total IgG and IgG subclasses for C1q-binding positivity. Total IgG MFI yielded the highest AUC (0.927), followed by IgG1 (0.865). (B) Subanalysis by HLA locus showing highest predictive accuracy for IgG1 at HLA-C (AUC = 1.0) and HLA-DR (0.983). The red diagonal line indicates the line of no discrimination (AUC = 0.5).
Diagnostics 16 00207 g007
Table 1. Distribution of HLA antibody bead reactions by total IgG, and C1q binding status.
TotalHLA Class IHLA Class II
ABCDRDQDP
Total bead numbers 4189589 (14.0%)950 (22.7%)281 (6.7%)900 (21.5%)694 (16.6%)775 (18.5%)
Total IgG positivitybead, no (%)63989 (13.9%)143 (22.4%)15 (2.3%)111 (17.4%)264 (41.3%)17 (2.7%)
 MFI, Median (min-max)4236 (1011–31,091)2441 (1012–14,391)3566 (1053–22,111)17,672 (1357–24,762)4250 (1011–31,091)7810 (1029–29,118)3534 (1064–4431)
Total IgG+C1q+bead, no (%)1989 (4.5%)31 (15.7%)11 (5.6%)39 (19.7%)108 (54.5%)0
 MFI, Median (min-max)17,660 (1288–731,091)8589 (1282–12,645)9450 (2630–22,111)19,165 (8772–24,762)23,013 (5691–31,091)18,226 (2521–29,118)0
Total IgG+C1q-bead, no (%)44180 (18.1%)112 (25.4%)4 (0.9%)72 (16.3%)156 (35.4%)17 (3.9%)
 MFI, Median (min-max)2922 (1011–20,530)2226 (1012–14,391)2869 (1053–12,909)2956 (1357–6544)2324 (1011–12,455)3903 (1029–20,530)3534 (1064–4431)
Abbreviations: MFI, mean fluorescence intensity; min, minimum; max, maximum.
Table 2. IgG subclass and C1q profiles of IgG positive beads (n = 639).
IgG SubclassTotal (n = 639)%C1q Negative (n = 441)%C1q Positive (n = 198)%p Value
None subclass detected, n (%)39762.136090.7379.3<0.0001
Any subclass detected, n (%)24237.98133.516166.5
IgG subclass pattern, n (%)
G1 alone 20584.77134.613465.4<0.0001
G1+G372.900.07100.00.0004
G1+G3+G410.400.01100.0NS
G1+G4145.8321.41178.60.0003
G2 alone 31.23100.000.0NS
G3 alone 72.900.07100.00.0004
G4 alone 52.1480.0120.0NS
Abbreviations: NS, non-significant.
Table 3. Patient-level characteristics of immunodominant DSA according to biopsy diagnosis.
Immunodoninant DSA CharacteristicsAMR (n = 27)Non-AMR (n = 10) *p Value
MFI, median (IQR)9938 (4875–19,766)3879 (3402–12,004)0.0873
C1q positivity, n (%)11 (40.7%)3 (30.0%)0.5566
IgG1 positivity, n (%)18 (66.7%)3 (30.0%)0.0484
IgG1 and C1q positivity, n (%)9 (33.3%)3 (30.0%)0.8510
Abbreviations: MFI, mean fluorescence intensity; AMR, antibody mediated rejection, IQR Interquartile Range. * Non-AMR includes T cell–mediated rejection, acute tubular necrosis, microinflammation, BK virus nephropathy, and interstitial fibrosis/tubular atrophy.
Disclaimer/Publisher’s Note: The statements, opinions and data contained in all publications are solely those of the individual author(s) and contributor(s) and not of MDPI and/or the editor(s). MDPI and/or the editor(s) disclaim responsibility for any injury to people or property resulting from any ideas, methods, instructions or products referred to in the content.