1. Introduction
Orbital fracture assessment requires simultaneous interpretation of bony disruption, soft-tissue behavior, globe position, and ocular function. Conventional recommendations continue to cite substantial floor involvement, commonly more than half of the floor or an area near 2 cm
2, along with clinical findings such as enophthalmos, diplopia, and tissue entrapment, as indications for reconstruction [
1,
2]. These criteria implicitly treat defect magnitude as a marker of overall fracture severity. However, the biological consequences of a larger bony opening are not equivalent to those of direct injury to muscle or connective tissue.
Recent evidence has exposed the limits of size-based reasoning. A systematic review of computed tomography (CT) parameters concluded that fracture size, location, orbital volume, soft-tissue involvement, and craniocaudal dimensions each provide distinct information and are more useful in combination than in isolation [
3]. A critical review of two decades of literature found that reported size cut-offs varied substantially and were only weakly predictive of symptomatic fractures, whereas inferior rectus displacement was more consistently associated with symptoms [
4]. Conversely, a meta-analysis of 36 studies confirmed that fracture area and changes in orbital volume are useful predictors of post-traumatic enophthalmos, linking approximately 3.12 cm
2 of fracture area to 2 mm of enophthalmos [
5]. These apparently divergent conclusions are reconcilable if defect size performs differently depending on the phenotype being predicted.
Small series have reported elements of this structural-functional dissociation. Ploder et al. found that fracture area was associated with enophthalmos but not with limitation of ocular motility in 38 isolated floor fractures [
6]. Kunz et al. reported a correlation between defect size and globe position but not with diplopia or motility among conservatively managed patients [
7]. Others have shown that soft-tissue herniation, herniation height, extraocular muscle position, and orbital volume change can be more informative than area alone for functional symptoms [
8,
9,
10,
11,
12,
13]. This literature is heterogeneous, usually restricted to isolated fractures, and generally underpowered to compare several structural and functional phenotypes within one cohort.
The purpose of this study was to determine whether the magnitude of orbital defects provides comparable information about structural displacement and ocular motor dysfunction in a large, unselected cohort of orbital fractures. We hypothesized that increasing estimated defect area would be strongly associated with orbital content herniation and globe-position abnormality, and substantially less so with extraocular movement (EOM) abnormality and preoperative diplopia.
2. Materials and Methods
2.1. Study Design and Setting
This retrospective observational cohort study used the institutional orbital fracture registry of the Department of Oral and Maxillofacial Surgery at Rambam Health Care Campus, a level 1 tertiary trauma center in Haifa, Israel. The registry includes CT-confirmed orbital fractures managed from September 2001 to November 2023. Reporting was guided by the STROBE statement [
14] (
Tables S1–S3).
2.2. Data Structure and Unit of Analysis
The registry is organized by case record, and a single orbital injury may generate more than one row. The source file contained 1489 rows, which were reduced to 1463 after removing 26 exact duplicates, representing 1084 unique patients. Repeated rows were therefore adjudicated before analysis rather than treated as independent observations: rows sharing a patient identifier were assigned to the same injury if they had the same recorded age or dates within 90 days of one another, and rows recording opposite orbits on the same date were treated as one bilateral injury. This yielded 1103 distinct orbital injuries. The analytic unit was the index (earliest) injury for each patient, yielding 1084 observations, of which 1083 had measurable defect dimensions. An analysis of all 1103 injuries with patient-level clustering was retained as a sensitivity analysis.
2.3. Defect Morphometry and Covariates
Maximum sagittal and coronal defect dimensions were recorded in millimeters from multiplanar facial CT. All defect dimensions were measured directly by the study team from the original CT images acquired at our institution, using the Sectra IDS7 Workstation picture archiving and communication system (PACS), version 28.1.4.10543 (Sectra AB, Linköping, Sweden), rather than extracted from prior radiology reports. The estimated two-dimensional (2D) defect area—hereafter, defect area—was calculated as an ellipse, (π/4) × sagittal × coronal, and modeled continuously for each 50 mm2 increase; this planar approximation is well established for isolated orbital floor defects, and its limitations for complex multi-wall fractures are addressed in the Discussion. Records with 0 × 0 mm entries were treated as non-measurable sentinel values rather than true zero-area defects. When records for a single injury conflicted, the largest recorded dimension was used rather than an average, on the basis that a partial or obliquely angled measurement is more likely to underestimate than to overestimate the true defect. The fracture pattern was grouped as isolated orbital floor, floor with inferior orbital rim, floor with medial wall, complex multi-wall, or other. Adjustment covariates were age, sex, fracture pattern, mechanism of injury (fall, assault, road traffic, sport, ballistic, workplace, and other), and the presence of an associated facial fracture.
2.4. Structural and Functional Phenotypes
Four prespecified primary phenotypes were analyzed. The structural phenotypes were CT-documented orbital content herniation and documented enophthalmos; the functional phenotypes were documented EOM abnormality and preoperative diplopia. Per departmental and institutional protocol, every patient with a CT-confirmed orbital fracture is evaluated by both the maxillofacial surgery team and ophthalmology (oculoplastics) before any intervention, with a further joint evaluation after intervention for operated patients; diplopia is registered only when both specialties concur. EOM abnormality and preoperative diplopia, therefore, reflect this dual-specialty, concordance-based assessment rather than a single examiner’s impression, although the registry does not capture a standardized gaze-specific grading scale, forced-duction testing, or the exact examination interval in hours or days. Enophthalmos is assessed within this same dual-specialty evaluation structure, but because the registry does not standardize the timing of enophthalmos assessment beyond it, that outcome is termed documented enophthalmos rather than late or postoperative enophthalmos: entries were abstracted from clinical and imaging documentation created at any point from the initial (preoperative) joint evaluation through postoperative follow-up, and because acute periorbital edema and retrobulbar hematoma can obscure true globe position in the immediate post-injury period, documented enophthalmos in this cohort should be read as a composite of early and late findings rather than as a measure of stable, late post-traumatic enophthalmos. Hypoglobus was analyzed as a secondary globe-position phenotype because it was not recorded across the entire cohort: it was marked not applicable in 402 records, all from non-operated patients, and those observations were treated as missing rather than negative.
Three coding conventions in the registry required explicit handling and were reported rather than resolved silently. Two records documented exophthalmos, the opposite of the phenotype of interest, and were not counted as enophthalmos. Ten records documented hyperglobus, which was likewise not counted as hypoglobus. Seven records had an uninterpretable mark in the enophthalmos field and were treated as missing rather than assigned to either category. Postoperative diplopia trajectories were deliberately excluded from this analysis and are reported separately.
2.5. Statistical Analysis
Continuous variables were summarized as medians and interquartile ranges (IQR), and categorical variables as counts and percentages. Because the analytic cohort contains exactly one observation per patient, associations were estimated using logistic regression; population-averaged generalized estimating equations with patient-level clustering and robust covariance were used only in the all-injury sensitivity analysis. Each model included estimated defect area, age, sex, fracture pattern, associated facial fracture, and mechanism of injury. Adjusted odds ratios (OR) with 95% confidence intervals (CI) and two-sided p-values are reported, with Benjamini–Hochberg false discovery rate correction applied across the four primary phenotypes.
To avoid imposing a linear exposure-response assumption, the defect area was also modeled with restricted cubic splines, and overall and nonlinearity likelihood ratio tests were computed against models without area and with linear area, respectively. Adjusted probabilities were standardized over the observed covariate distribution at fixed defect areas, with 95% CIs obtained by the delta method. We summarized discrimination attributable to defect area alone by the area under the receiver operating characteristic curve (AUC), with percentile intervals from 2000 bootstrap replicates. These AUCs quantify the information in a single continuous variable and do not evaluate diagnostic accuracy against a reference standard; no diagnostic or prediction model was developed, and STARD and TRIPOD are therefore not applicable. Prespecified sensitivity analyses examined a conventional 200 mm2 threshold, isolated floor fractures, patients contributing a single registry record, and all adjudicated injuries with clustering. A further sensitivity analysis, added post hoc at revision, stratified the cohort by scan era (2001–2010 versus 2011–2023), tested an area-by-era interaction by likelihood ratio, and refitted the primary models with scan era as an additional covariate. Missing data were not imputed. All statistical analyses were performed using IBM SPSS Statistics, version 32.0 (IBM Corp., Armonk, NY, USA).
4. Discussion
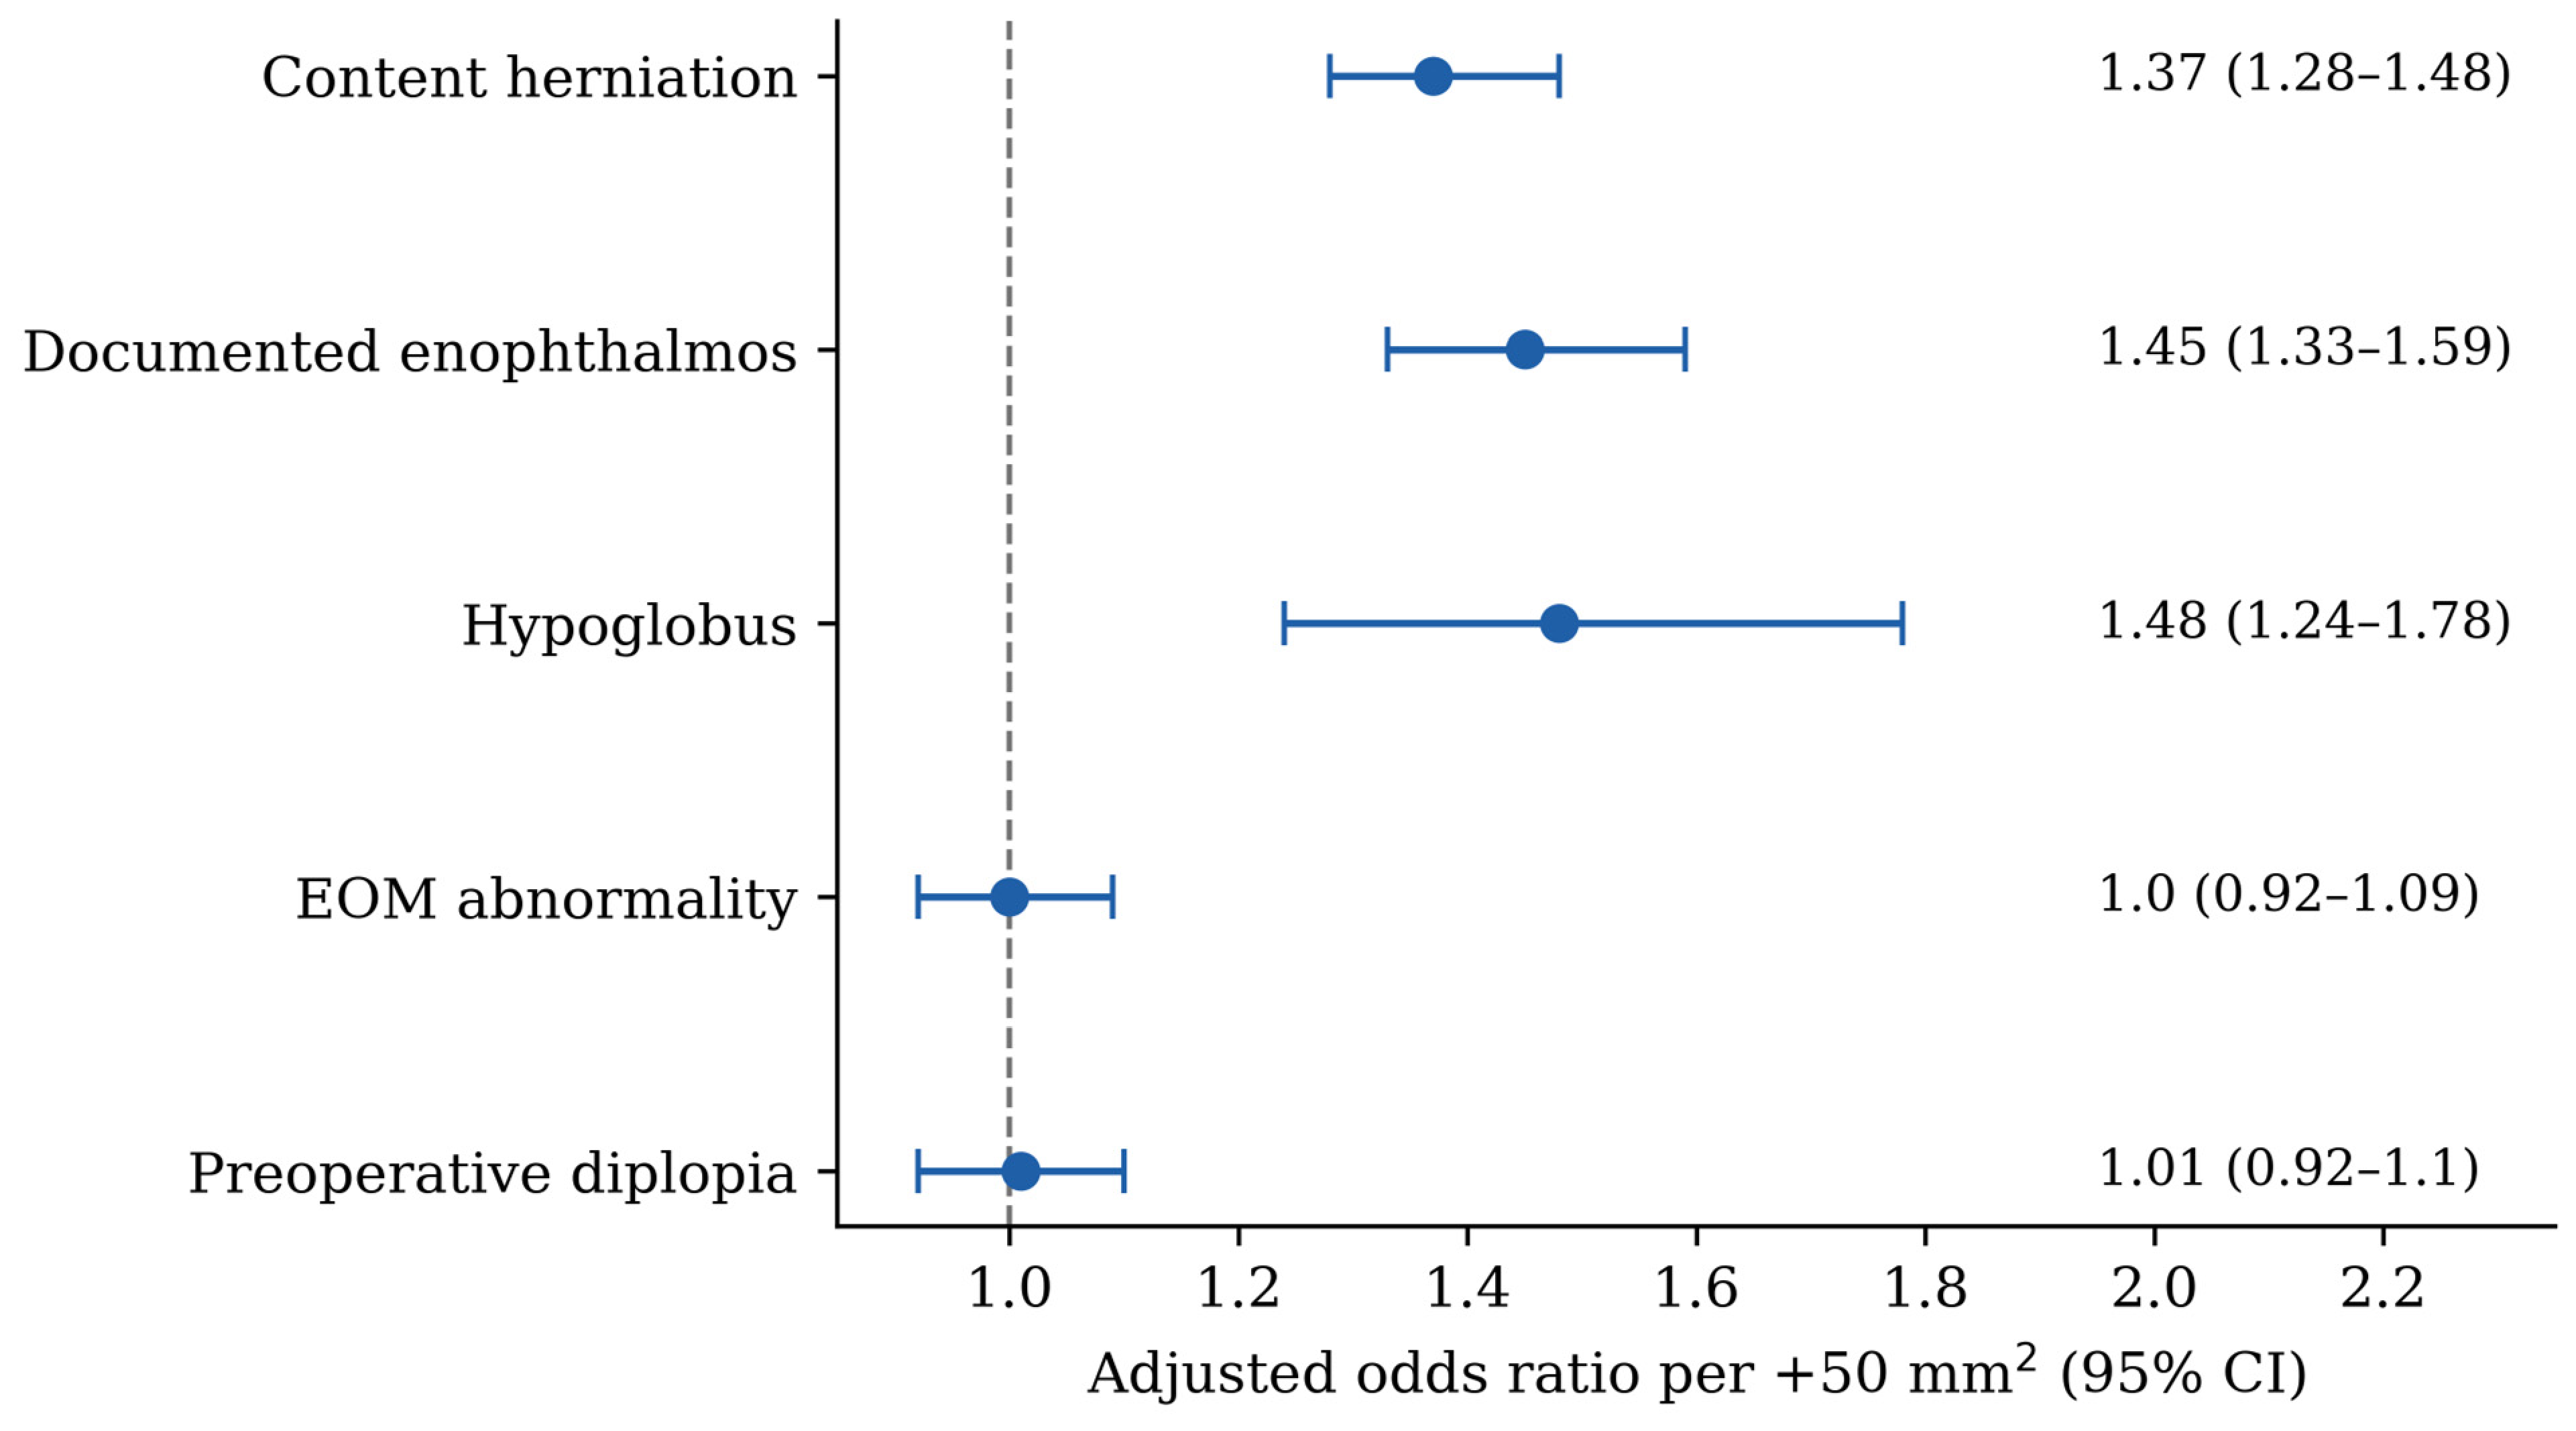
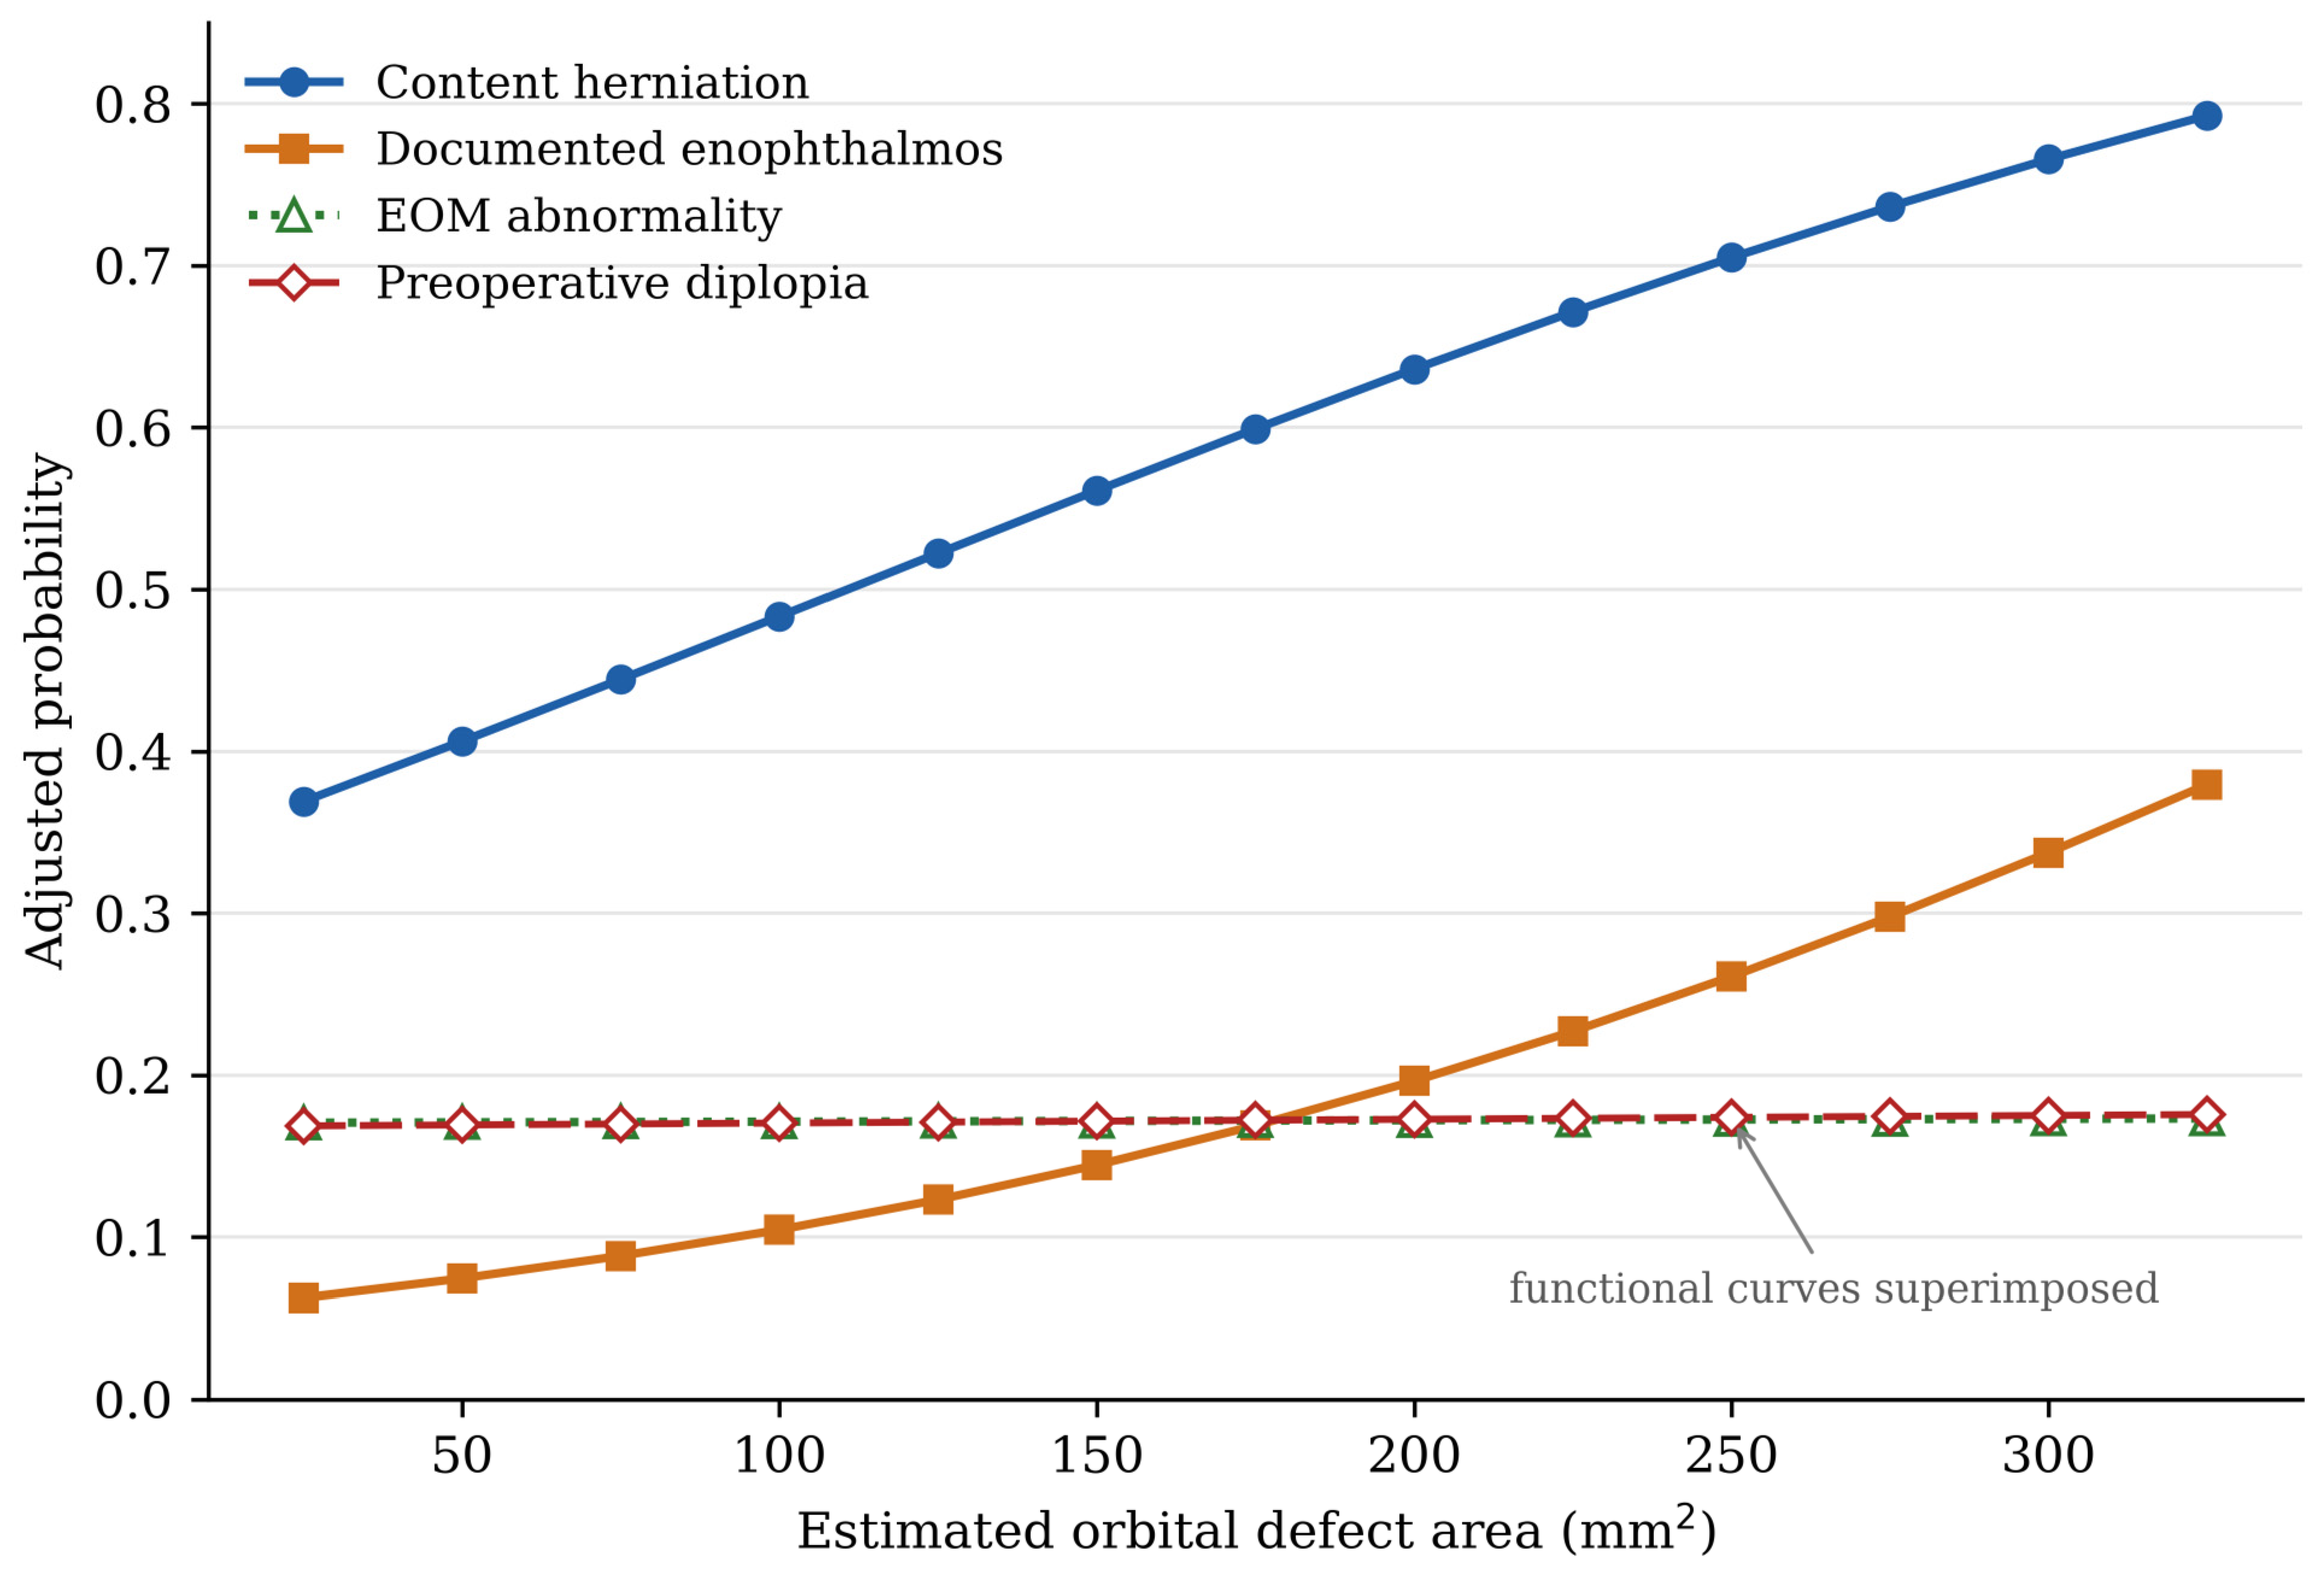
Orbital defect magnitude does not serve as a global measure of fracture severity. Across 1084 patients, increasing defect area was strongly and reproducibly associated with orbital content herniation and globe-position abnormality, whereas associations with EOM abnormality and preoperative diplopia were centered almost exactly on the null. The same separation was evident in absolute standardized risks, spline models, AUC analyses, and across all sensitivity cohorts. Defect size carried substantial information about structural displacement and showed little to no association with ocular motor dysfunction in this retrospective cohort.
The structural component aligns with the established relationship among defect magnitude, orbital volume change, and enophthalmos. Lentskevich et al. synthesized 36 studies and confirmed that fracture area and orbital volume change predict post-traumatic enophthalmos, estimating that approximately 3.12 cm
2 of fracture area corresponds to 2 mm of enophthalmos [
5]. Earlier CT studies linked greater defect area or displaced tissue volume to increased globe recession [
6,
13]. These data extend that evidence across a full-spectrum cohort and show that the adjusted probability of enophthalmos rises from 7.4% at 50 mm
2 to 33.7% at 300 mm
2. Because the registry does not standardize the timing of assessment, this should not be interpreted as a model of late enophthalmos.
The functional findings help reconcile inconsistent prior literature. Kunz et al. found a good correlation between defect size and globe position but not with diplopia or motility in 48 conservatively managed fractures [
7]. Ploder et al. likewise found no correlation between fracture area and motility limitation in 38 isolated floor fractures [
6]. Shah et al. showed that small and medium floor fractures with soft-tissue herniation could produce more diplopia than larger fractures without it [
8], and Bruneau et al. found the floor-area ratio predictive of enophthalmos, whereas herniation height was more informative for diplopia [
9]. Taken together with the present data, bony dimensions and functional ocular injury are related but non-equivalent domains.
A plausible mechanical account is that the size of the bony opening determines the potential for tissue displacement and volume change, whereas ocular motor dysfunction depends on the behavior and integrity of the extraocular muscles and their connective-tissue apparatus. Basta et al. reported that orbital volume increase and inferior rectus displacement were more informative than area alone for symptom development [
10], and Furuta et al. related motility restriction to muscle position rather than fracture size [
11]. Oku et al. similarly identified muscle-related rather than size-related factors as associated with diplopia before and after repair [
12]. A defect can be large without deforming the muscle and small while incarcerating it.
This dual sensitivity offers a mechanistic explanation for the flat discrimination observed here, rather than a simple absence of effect. If small, so-called trapdoor defects disproportionately entrap the inferior rectus muscle or its fascial sleeve with little bony displacement, while large defects disproportionately produce diffuse contusion, hemorrhage, and edema of the extraocular muscles or their innervation regardless of the size of the bony opening, then entrapment risk and contusion/edema risk move in opposite directions across the range of defect area. Averaged across a cohort, these two opposite, size-discordant mechanisms would cancel any monotonic size-outcome gradient—precisely the pattern observed: flat restricted cubic splines, near-superimposed probability curves for EOM abnormality and diplopia, and AUCs indistinguishable from 0.50. A flat area-outcome curve, therefore, does not indicate that the extraocular apparatus is unaffected by defect size; it indicates that two opposing, size-dependent injury mechanisms are being averaged into a single null association. Two recent series point the same way. In 155 patients, preoperative diplopia was associated on multivariable analysis with the anatomical region of the fracture, in particular the middle and posterior thirds of the orbital floor [
15]; and in a 14-year series of pure blowout fractures, fracture type rather than fracture size emerged as the dominant independent predictor of diplopia [
16].
The clinical implication is narrow but practical. A large defect should raise concern about volume-related sequelae, that is, herniation, enophthalmos, and hypoglobus, and the AUCs of about 0.70 indicate that the area carries real but modest information even for those. A large defect should not by itself raise concern about motility, and, more importantly, a small defect should not be taken to exclude it: at 50 mm2 the adjusted probability of EOM abnormality was 17.1%, essentially identical to the 17.3% at 300 mm2. Motility must always be assessed clinically, regardless of defect size. This is not evidence that CT is uninformative about the extraocular apparatus: cross-sectional imaging remains essential for identifying muscle position, soft-tissue herniation, and fracture configuration. What the present data show is narrower and, we believe, more clinically useful: estimated defect area alone is not a meaningful predictor of ocular motility disturbance, and this null association should not be extended into a claim that CT findings in general are uninformative for motility.
This dual-mechanism model is most vivid in children. The overall cohort had a median age of 31 years (IQR 22–50), but 130 patients (12.0%) were younger than 18 years, and the youngest was 11 months old. Pediatric orbital floor fractures characteristically present as ‘white-eyed’ trapdoor fractures: a linear, minimally displaced fracture with little or no periorbital ecchymosis and an often unremarkable-appearing CT, in which the inferior rectus muscle or its fascial sleeve is nonetheless incarcerated in the fracture line, producing severe motility restriction, marked diplopia, and occasionally an oculocardiac reflex (bradycardia, nausea, and vomiting) that constitutes a surgical emergency regardless of how small the radiographic defect appears. Contemporary pediatric series bear this out: in a multi-center cohort of trapdoor fractures, outcome turned on what had become entrapped and on how quickly it was released, with surgery within 48 h associated with markedly better recovery of ocular motility [
17], and a more recent cohort with systematic review found the same advantage for repair within 24 h [
18]. This phenotype is the clinical archetype of the structural-functional dissociation reported here: the smallest, most benign-appearing defects can carry the greatest functional risk. It is consistent with the companion analysis of this registry addressing pediatric inferior rectus entrapment, noted below, in which entrapment was concentrated at ages 8–11 years and was not associated with CT defect area, mirroring the null functional signal reported in the present all-ages analysis.
This study has several limitations. It is retrospective and single-center. Ocular assessment did follow an institutional protocol requiring joint evaluation by maxillofacial surgery and ophthalmology (oculoplastics) before, and for operated patients after, intervention, with diplopia registered only on concordance between the two specialties; however, the registry does not capture a standardized gaze-specific grading scale, forced-duction testing, or the exact examination interval in hours or days, and the timing of enophthalmos assessment relative to injury was likewise not fixed beyond this protocol structure. A two-dimensional elliptical area is a crude summary of a three-dimensional defect and does not capture gap geometry, herniation height, or muscle position, which the literature suggests are the measurements that matter functionally; in complex multi-wall fractures involving both the orbital floor and medial wall, this planar approximation is expected to systematically underestimate the true surface area spanning two perpendicular anatomical planes—an underestimation demonstrated directly when orbital floor defects are measured in two rather than three dimensions [
19]—and area estimates in this subgroup should be interpreted with this in mind. We similarly did not model defect location within the orbital floor (anterior versus posterior) or the specific contribution of medial wall extension beyond the categorical fracture-pattern adjustment; fractures of similar total area but different location or wall involvement may carry different functional risk [
15], and this remains an important direction for more granular morphometric analysis of this registry. Hypoglobus was recorded only in operated patients, so its estimate applies to that subgroup. The registry spans more than two decades (2001–2023), during which CT acquisition technology changed substantially, from thick-slice (3–5 mm) helical scans with limited multiplanar reformation in the early 2000s to sub-millimeter isotropic acquisition with routine coronal and sagittal reconstruction today, a shift that measurably improves the precision of volumetric defect assessment [
20]; we therefore compared the 2001–2010 and 2011–2023 subperiods directly (
Table 3). Both the structural associations and the functional nulls were reproduced within each era, and no area-by-era interaction approached significance, which argues against scan-era measurement precision as an explanation for the dissociation reported here. Any residual imprecision in the earlier era would in any case be expected to bias associations toward, rather than away from, the null. Finally, the analysis is cross-sectional with respect to phenotype and cannot establish that a larger defect causes herniation or enophthalmos.
The registry that supports this analysis has also supported three companion manuscripts, addressing the epidemiology of the full series, the age distribution of inferior rectus entrapment in children, and postoperative diplopia trajectories in operated patients. Those analyses use different units, denominators, and endpoints, and no table, figure, or result is shared with the present study; the overlap is declared to the editor.
Prospective work should pair standardized gaze-specific motility assessment with three-dimensional morphometry, including gap width, herniation height, and inferior rectus position, and should record the timing of globe-position assessment. Automated segmentation of orbital fractures is now feasible and would make such three-dimensional morphometry practical at scale [
21]. The value of the defect area likely lies in combination with those measurements rather than as a stand-alone index of severity.




 ,
,