1. Introduction
Estimating the post-mortem interval (PMI) of human skeletal remains is a central challenge in forensic medicine, forensic anthropology, and medico-legal death investigation. In skeletal remains, conventional PMI estimation is particularly difficult because soft-tissue-based indicators are no longer available and bone undergoes complex post-mortem changes influenced by biological, chemical, physical, and environmental factors. These processes include decomposition, diagenesis, mineral dissolution and recrystallisation, collagen degradation, hydration changes, microbial activity, soil composition, pH, temperature, humidity, burial conditions, and exposure to scavengers or weathering. Consequently, PMI estimation from skeletal remains has been imprecise, and no universally accepted single method is available for reliable dating across early forensic, later forensic, and archaeological time intervals [
1,
2,
3].
Bone diagenesis is especially relevant for PMI assessment because post-mortem alteration affects both the organic and inorganic components of bone. The mineral phase, mainly represented by hydroxyapatite, and the organic matrix, especially collagen and associated proteins, may change at different rates depending on intrinsic bone properties and extrinsic environmental conditions. Histological studies have shown that post-mortem degradation can produce recognisable microscopic changes in bone tissue, but these alterations are highly context-dependent and may not be sufficient for precise PMI classification when used alone [
4]. Experimental spectroscopic studies have likewise demonstrated that post-mortem diagenesis involves dynamic alterations of both the mineral and organic bone matrices and that these changes are influenced by environmental conditions [
5]. Therefore, objective, reproducible, and preferably non-destructive methods are needed to complement conventional forensic assessment. As a consequence, in recent years imaging and spectroscopic techniques have gained increasing attention for PMI estimation because they provide different types of structural, chemical, molecular and spatial information from skeletal material.
Previous work has demonstrated that different analytical approaches capture distinct aspects of post-mortem bone alteration and may therefore provide complementary information rather than competing diagnostic outputs. Indeed, micro-computed tomography (micro-CT) provides high-resolution three-dimensional information on cortical bone architecture, porosity, bone volume fraction, and density-related parameters, and is therefore suited to assess structural degradation and mineral-density-related changes in human skeletal remains. Work from our group further indicated that parameters such as BV/TV and density-related grey-value measures may serve as candidate structural markers of post-mortem bone alteration. Thus micro-CT primarily reflects structural consequences of decomposition and diagenesis, and this approach may be limited when skeletal remains in early PMI categories show overlapping morphology [
6].
Alternatively, vibrational spectroscopic techniques provide complementary molecular information. For example, Raman spectroscopy assesses mineral- and matrix-related bone components, including phosphate, carbonate, amide, and collagen-associated bands. Previous Raman-based studies demonstrated that PMI-associated spectral changes can be detected in bone tissue and that chemometric analysis may support discrimination between PMI categories [
7]. Our previous work comparing handheld and microscopic Raman spectroscopy indicated that even portable Raman systems detect relevant mineral-associated PMI signatures, particularly in the phosphate region around 953–960 cm
−1 [
7]. At the same time, these studies highlighted important limitations, including fluorescence interference, spectral variability, and overlap between adjacent PMI classes. Raman spectroscopy therefore provides biologically interpretable molecular information, but may require a combination with additional analytical methods for robust multiclass PMI estimation [
8,
9].
Another technique, near-infrared (NIR) spectroscopy, represents a rapid, non-destructive point-based optical approach as NIR spectra contain broad overtone and combination bands related to O–H, C–H, and N–H bonds. Thus NIR spectroscopy may reflect PMI-associated changes in hydration, organic matrix composition, and mineral-associated properties. Previous work with handheld NIR spectrometry showed promising results for the classification of human skeletal remains into PMI categories using machine-learning approaches, supporting the feasibility of rapid optical PMI screening. Nevertheless, NIR spectroscopy alone may be limited in resolving closely adjacent early PMI intervals because early PMI classes may share overlapping hydration- and matrix-related spectral characteristics [
10]. However, the previous NIR study primarily addressed overall class prediction, whereas the present reanalysis evaluates wavelength-specific and task-specific diagnostic behaviour at the physical-sample level.
Finally, hyperspectral imaging (HSI) extends point-based spectroscopy by combining spectral and spatial information. This enables surface-level visualisation of optical heterogeneity and the generation of device-derived spectral parameter maps conventionally labelled as perfusion, oxygenation/StO
2, tissue haemoglobin, and water indices. In post-mortem skeletal material, these outputs should be interpreted as system-derived optical indices rather than physiological measurements. Previous HSI work demonstrated that classification performance increased with longer PMI and was particularly strong for differentiating archaeological material from forensic samples. Thus, HSI may be especially valuable as a rapid first-line spatial screening modality, whereas detailed molecular or structural confirmation may still be required in ambiguous cases [
11]. The present study therefore re-analysed HSI-derived sample-level parameters, including oxygenation/StO
2, tissue haemoglobin index and tissue water index, rather than relying solely on previously reported image-classification outputs.
Taken together, previous modality-specific studies indicate that micro-CT, Raman spectroscopy, NIR spectroscopy and HSI capture distinct aspects of post-mortem bone alteration. However, it remains unclear whether their diagnostic value is uniform across the full PMI range or depends on the specific forensic question. The present retrospective multimodal study therefore aimed to perform a harmonised physical-sample-level reanalysis and to address four task-specific questions: (i) which parameters are most informative for distinguishing archaeological class 5 from classes 1–4; (ii) which modalities best differentiate early PMI classes 1 + 2 from later classes 4 + 5; (iii) which Raman-derived molecular parameters are informative for differentiation within the forensic range, particularly classes 1 + 2 versus class 4; and (iv) whether class 1 can be reliably distinguished from class 2. Given the forensic relevance of distinguishing later forensic from substantially older skeletal material, an additional exploratory pairwise analysis directly comparing class 4 and class 5 was also performed to assess this specific temporal boundary. We hypothesised that diagnostic performance would be task-dependent and that a selective hierarchical workflow would be more informative than a uniform all-modality classifier.
2. Materials and Methods
2.1. Study Design
This study was designed as a retrospective, multimodal diagnostic study to develop and internally evaluate a hierarchical framework for PMI estimation in human skeletal remains. The study integrated structural, molecular, point-spectroscopic, and spatial hyperspectral information obtained from micro-CT, Raman spectroscopy, near-infrared spectroscopy using the NIR-ONE platform, and hyperspectral imaging (HSI). Microscopic Senterra Raman spectroscopy was considered as an exploratory complementary Raman modality within the overall five-method framework. The primary analyses were organised around forensically interpretable binary contrasts rather than a single global multiclass endpoint.
The four principal task-specific contrasts were specified before calculation of the corresponding task-specific ROC and model-performance results in the present harmonised reanalysis and were based on the predefined PMI class structure and forensic interpretability rather than on optimisation of observed discrimination. C1 and C2 jointly represent the first six months after death, whereas C4 and C5 represent clearly later forensic and archaeological-compatible intervals in the present classification scheme. C3 (>6 months–1 year) lies directly between these windows and was therefore retained in descriptive class-wise analyses but was not assigned to either side of the deliberately separated early-versus-later contrast. This design was intended to evaluate a high-level triage question and does not imply that C3 represents a biologically homogeneous or diagnostically irrelevant interval. Because omission of the intermediate class can increase apparent separation between the remaining groups, performance from this contrast should not be extrapolated directly to an unselected population spanning the complete PMI continuum. The additional direct C4-versus-C5 comparison was performed after the primary task-specific analyses and is therefore explicitly considered post-analysis, exploratory, and hypothesis-generating.
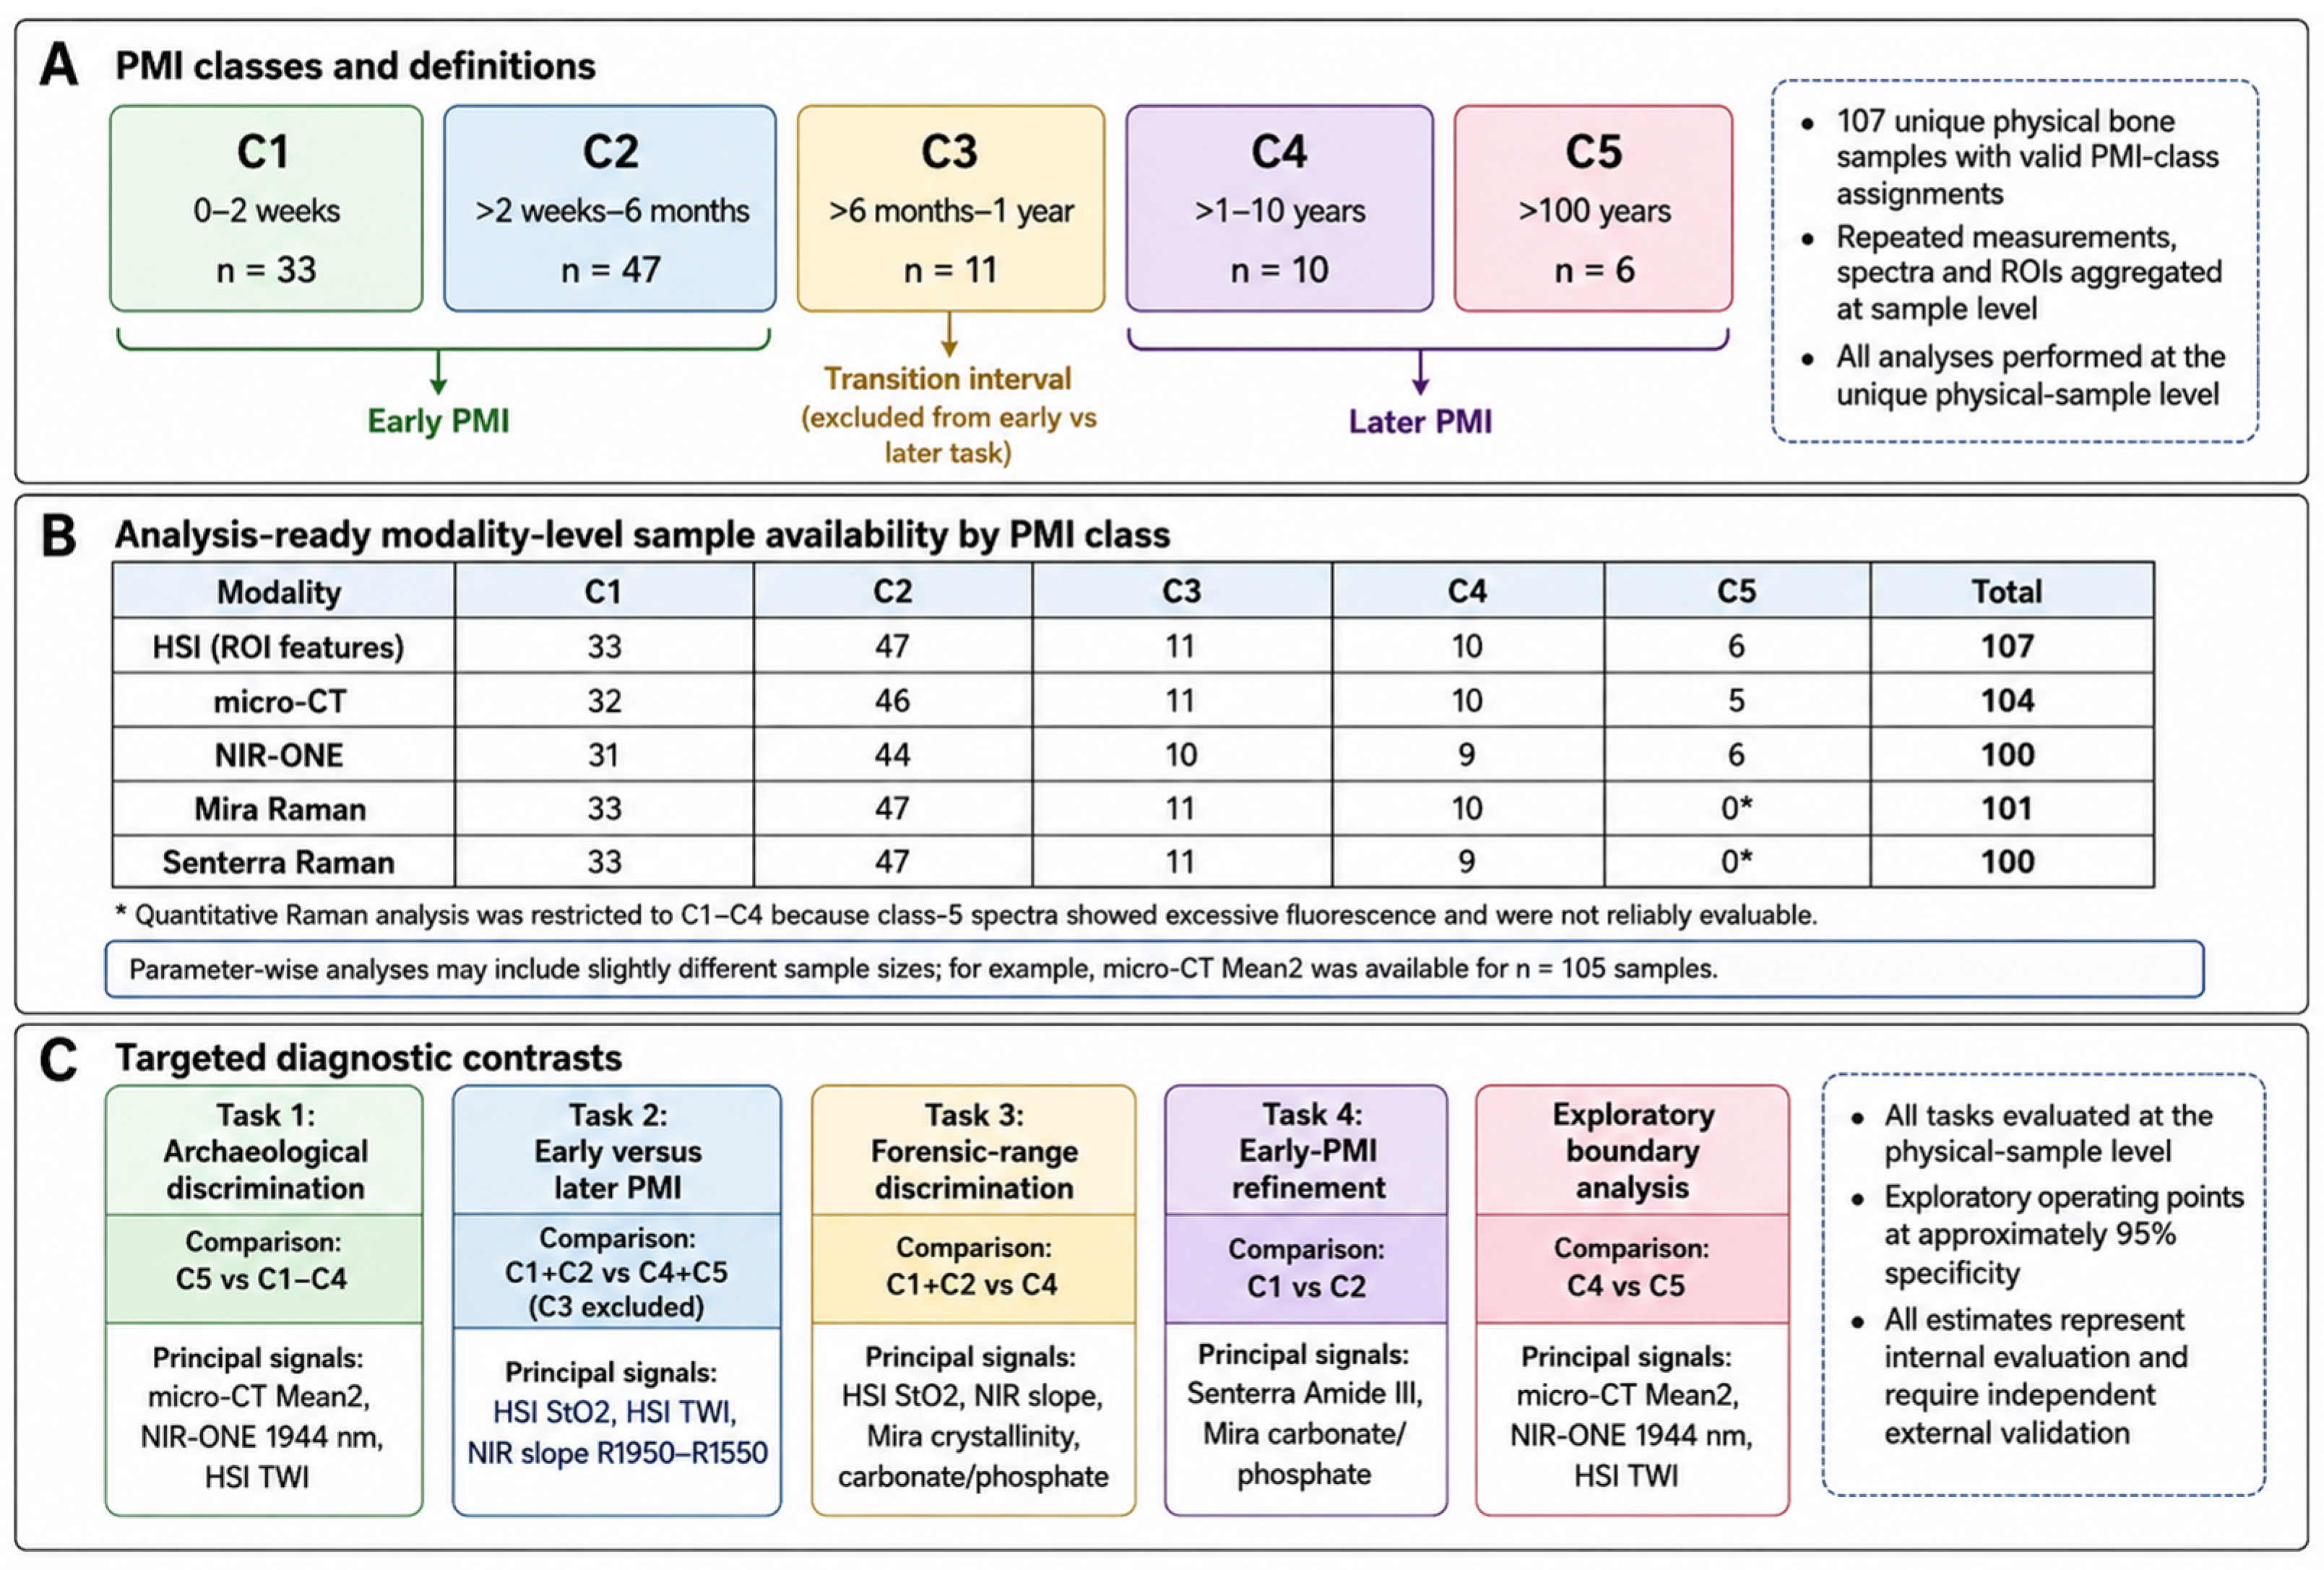
Four targeted contrasts were defined for the present harmonised reanalysis: class 5 versus classes 1–4, classes 1 + 2 versus classes 4 + 5, classes 1 + 2 versus class 4 for Raman-compatible analyses, and class 1 versus class 2. Class 3 was retained in descriptive class-wise analyses but treated as a transition interval and excluded from the targeted early-versus-later binary contrast. In addition, an exploratory direct pairwise comparison of class 4 versus class 5 was performed after the primary task-specific analyses to specifically examine the boundary between the latest forensic interval and archaeological material. This analysis was considered exploratory because it was motivated by the forensic interpretation of the pooled C5-versus-C1–C4 results and because the number of class-5 samples was small.
2.2. Human Bone Samples and PMI Classification
The analysed material consisted of human femoral diaphyseal cortical bone samples with assigned PMI categories, originating from forensic and archaeological contexts and available across the underlying modality-specific datasets [
6,
7,
10,
11,
12]. The samples originated from forensic and archaeological contexts and were categorised into the following five PMI classes: (1) 0–2 weeks, (2) >2 weeks–6 months, (3) >6 months–1 year, (4) >1–10 years, and (5) >100 years. The PMI classification was based on available forensic case information, conventional assessment, and previously established class definitions. Samples were prepared as transverse bone sections, and the periosteum and bone marrow were removed where required for modality-specific measurements. Before spectroscopic and imaging analyses, samples were air-dried at room temperature. The master sample mapping identified 107 unique physical samples with valid PMI-class assignments: class 1,
n = 33; class 2,
n = 47; class 3,
n = 11; class 4,
n = 10; and class 5,
n = 6. Modality availability differed because not every physical sample had been examined using every technique. Therefore, all modality-specific and multimodal analyses report their respective analysis-ready sample sizes. Repeated measurements, spectra and regions of interest were aggregated at the physical-sample level before statistical modelling.
The harmonised cohort consisted of femoral diaphyseal cortical bone samples prepared as transverse sections. Because the present study retrospectively integrates modality-specific legacy datasets, donor age, sex, and detailed skeletal disease or pathology were not consistently available for every unique physical sample and were therefore neither imputed nor inferred. For HSI, measurements were acquired under standardised conditions at a fixed camera-to-sample distance of 50 cm; however, a harmonised numerical observation-angle variable was not available across the retrospective dataset. Consequently, anatomical sampling level and available acquisition geometry are reported, whereas complete donor-level demographic and pathology characteristics cannot be summarised reliably for all 107 samples.
2.3. Ethical Considerations
The underlying sample collection and analyses were conducted in accordance with the Declaration of Helsinki and applicable institutional requirements. Ethical approval for the analysis of human skeletal remains was obtained from the local ethics committee of the Medical University of Innsbruck under the approval number EK 1357/2021. The archaeological samples were included in accordance with the permissions and institutional regulations applicable to the respective collections.
2.4. Analytical Imaging and Spectroscopic Methods
The analytical methods applied in this study were grouped into structural imaging, molecular spectroscopy, point-based near-infrared (NIR) spectroscopy, and spatial hyperspectral imaging. Detailed device specifications, acquisition settings, calibration procedures and modality-specific measurement protocols for micro-CT, Raman spectroscopy, NIR-ONE spectroscopy and hyperspectral imaging have been reported in the corresponding original publications [
6,
7,
10,
11], whereas the harmonised physical-sample-level preprocessing and task-specific statistical reanalysis were performed specifically for the present study.
2.4.1. Micro-CT
Micro-CT was used to assess quantitative parameters for structural and density-related properties of cortical bone. The predefined micro-CT parameter set included Mean1, Mean2, bone volume fraction (BV/TV), cortical porosity, trabecular number and trabecular separation. These variables represented density-related and architectural properties of cortical and trabecular bone and were analysed consistently across the available samples. Additional voxel- and porosity-related variables were reviewed as exploratory structural markers.
2.4.2. Raman Spectroscopy
Raman spectroscopy was used to characterise post-mortem alterations of the mineral and organic bone matrices. Handheld Mira Raman spectra and microscopic Senterra Raman spectra were analysed separately. Raw spectra were preprocessed using endpoint baseline correction, Savitzky–Golay smoothing with a 15-point window and area normalisation. Repeated spectra were aggregated at the physical-sample level.
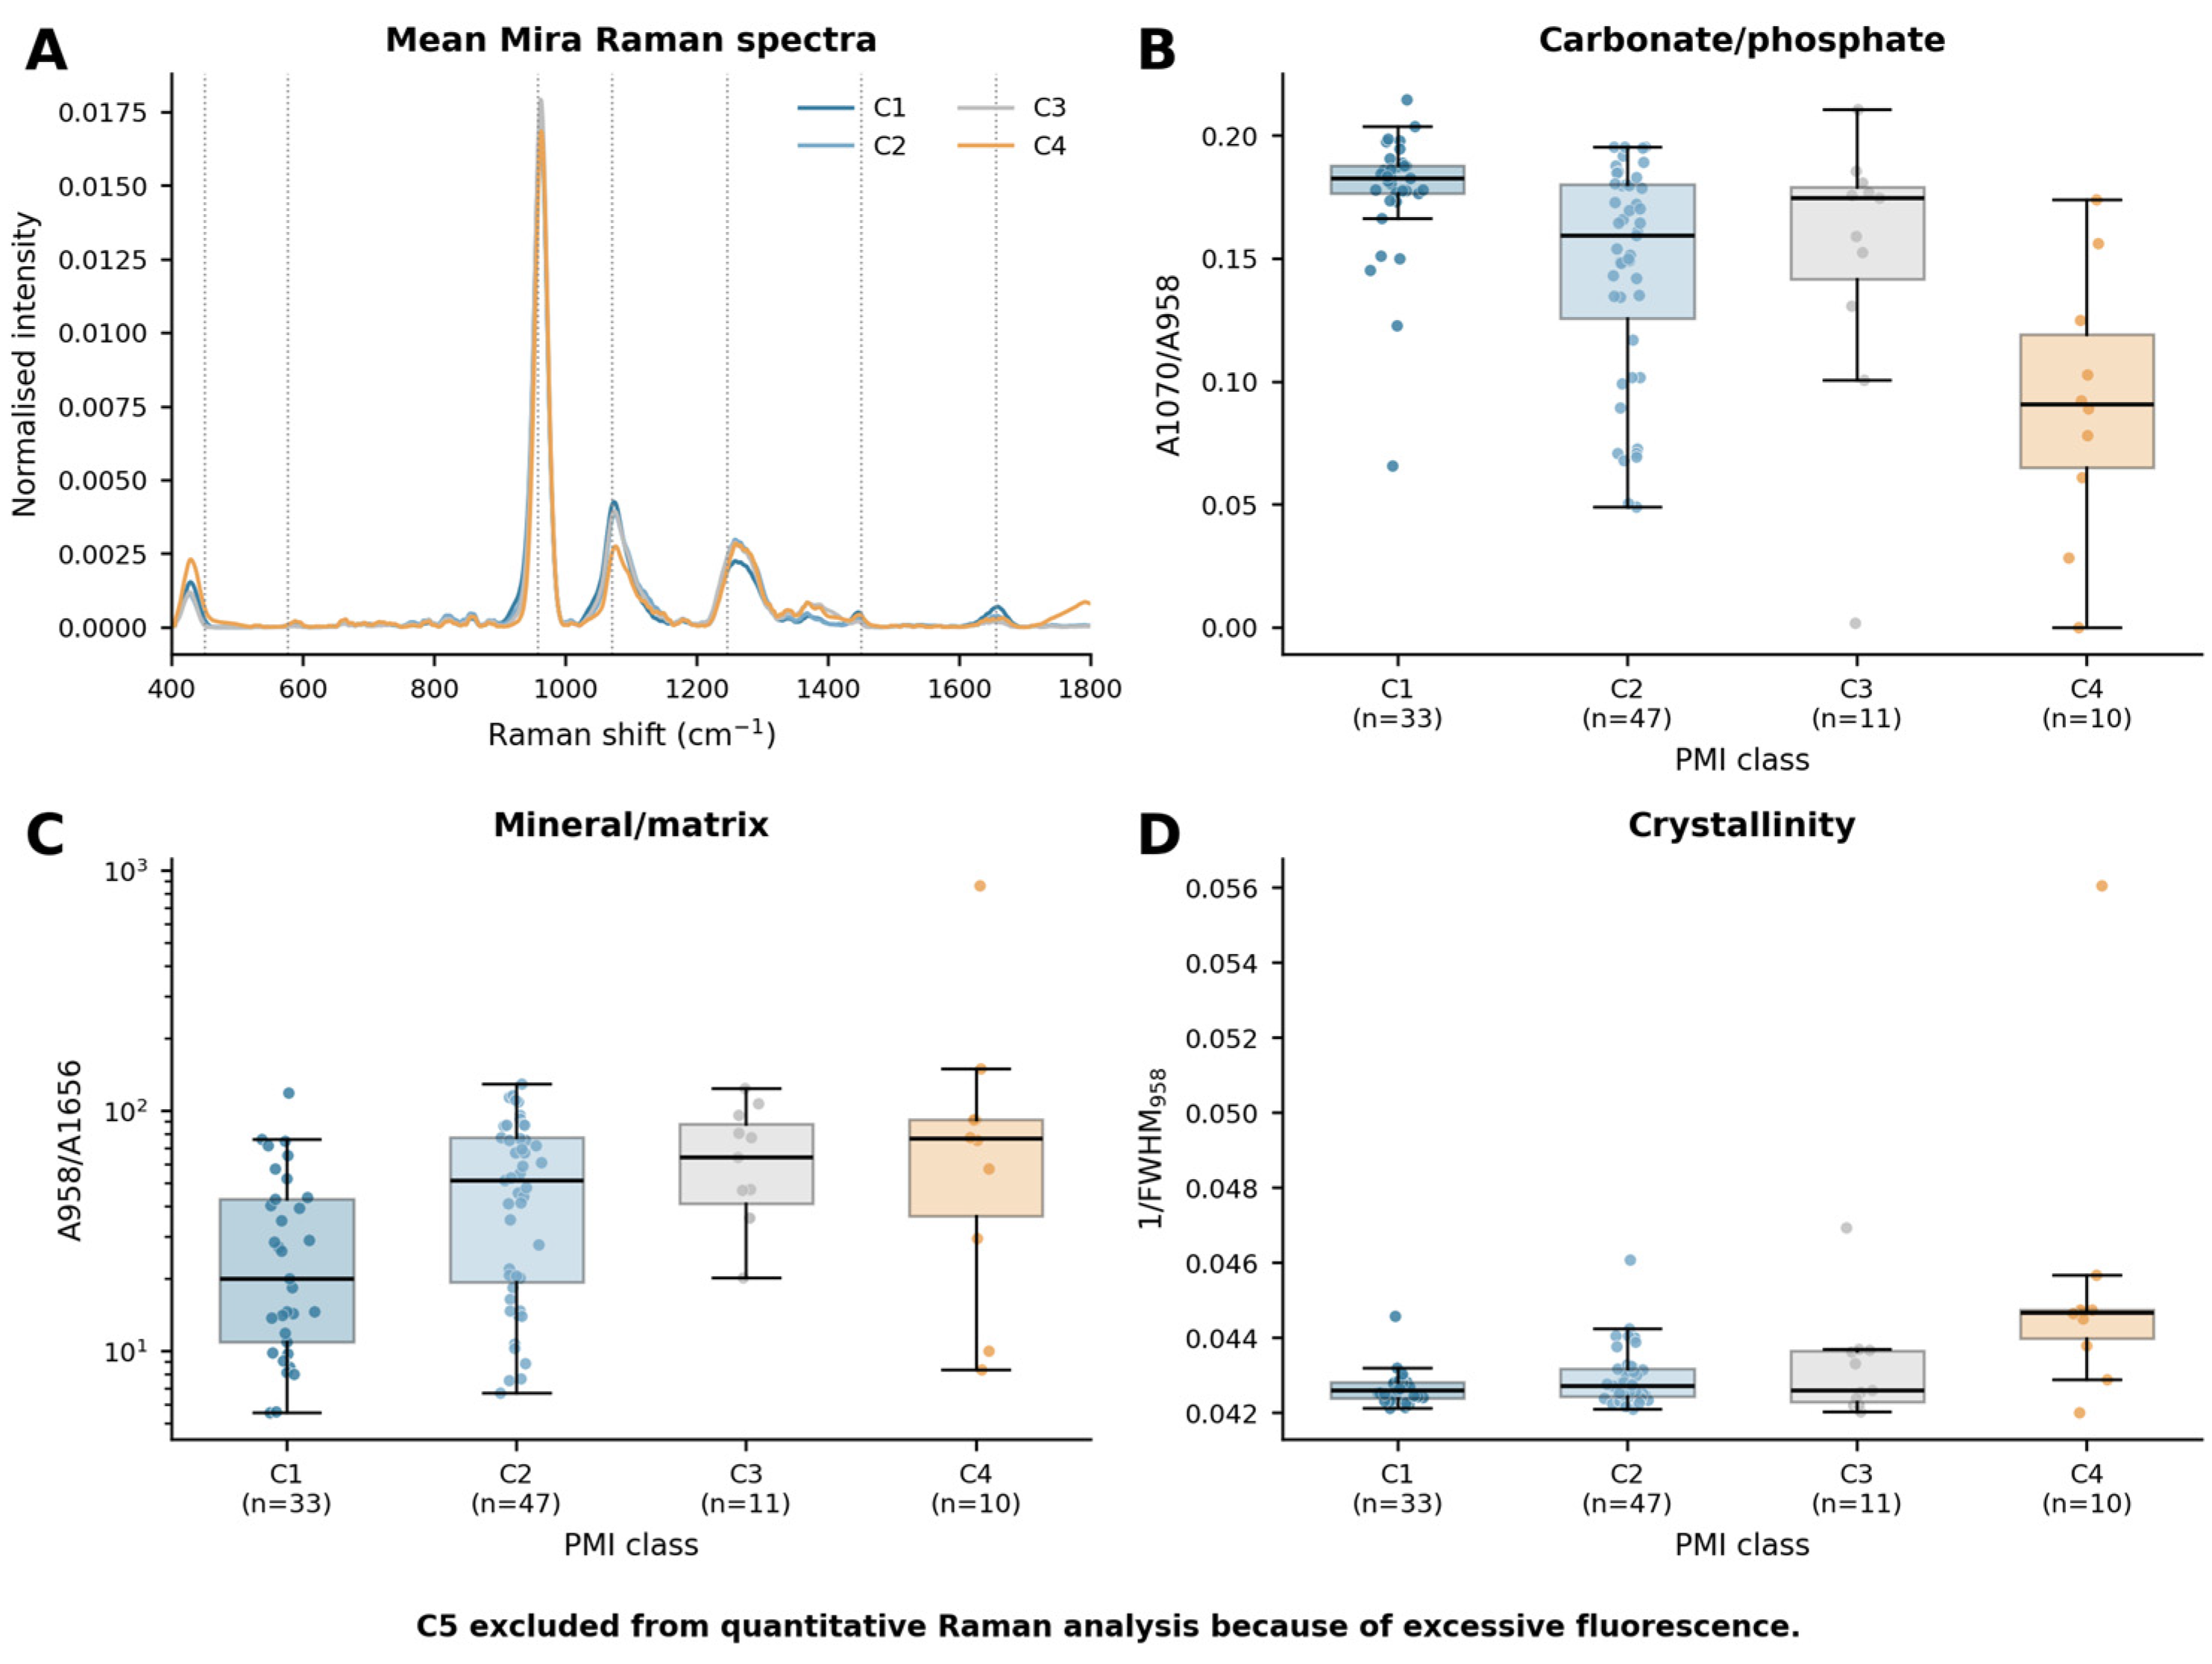
Quantitative Raman analysis was restricted to PMI classes 1–4 because spectra from class 5 showed excessive fluorescence that obscured the Raman signal and prevented reliable peak extraction. The analysis-ready class distribution was reported separately for each Raman platform.
For repeated cross-validated Raman modelling, the primary feature set was defined before model fitting and contained six biologically interpretable parameters: phosphate-associated intensity I958, crystallinity index 1/FWHM958, mineral-to-matrix ratio A958/A1656, carbonate-to-phosphate ratio A1070/A958, mineral-carbonate-related ratio A1070/A1450, and Amide-I-associated intensity I1656. No LASSO, recursive feature elimination, or other automated data-driven variable-selection algorithm was applied to this primary six-parameter model. Additional interpretable Raman variables, including Amide-III-associated intensity, were evaluated in parameter-wise exploratory analyses. Senterra-derived A577/A958 was retained as an explicitly post-hoc exploratory parameter and was not treated as a prespecified primary model variable.
Class-wise Raman spectra were used for descriptive visualisation, while targeted ROC analysis and repeated stratified cross-validation were restricted to contrasts for which valid Raman data were available. In particular, Raman was assessed for classes 1 + 2 versus class 4 and for class 1 versus class 2. Raman was not included in any quantitative task involving class 5.
2.4.3. Near-Infrared Spectroscopy Using the NIR-ONE Platform
NIR-ONE spectra covered the wavelength range from 1550 to 1950 nm at 2-nm intervals. A total of 36,164 individual acquisitions were available. Repeated acquisitions were averaged at the physical-sample level before statistical analysis, resulting in 104 unique NIR-ONE samples, of which 100 could be mapped unambiguously to the master PMI metadata. Four unmapped samples were excluded.
Both raw sample-level spectra and standard normal variate-transformed spectra were evaluated. Wavelength-specific analyses focused on reflectance at 1944 nm, reflectance at 1586 nm and the spectral slope R1950–R1550. For multivariate modelling, the complete 201-variable sample-level NIR-ONE spectrum was retained as the input spectral vector, without supervised wavelength selection. Scaling and, where applicable, SNV preprocessing were followed by principal component analysis retaining a fixed 10 principal components. PCA was fitted exclusively using the training data within each cross-validation split, and the corresponding held-out samples were projected into the PCA space defined by that training fold.
2.4.4. Hyperspectral Imaging
Hyperspectral imaging was performed using the previously established acquisition protocol [
11]. The HSI dataset comprised co-registered maps of NIR perfusion, oxygenation/StO
2, RGB appearance, tissue haemoglobin index (THI), and tissue water index (TWI). Because the measurements were performed on post-mortem, air-dried bone, these HSI-derived output parameters were interpreted as device-derived spectral indices rather than as physiological measurements. Accordingly, the labels NIR perfusion, oxygenation/StO
2, THI, and TWI refer to the established nomenclature of the HSI system and do not imply actual tissue perfusion, physiological oxygen saturation, haemoglobin concentration, or physiological water status in the investigated bone samples. Samples were measured three times at a fixed camera-to-sample distance of 50 cm under standardised acquisition conditions. The original HSI acquisition documentation comprised 125 acquisition records. After reconciliation with the central sample metadata and aggregation of repeated acquisition records at the physical-sample level, 107 unique physical samples were available for the present HSI analysis. The class-specific distribution was C1,
n = 33; C2,
n = 47; C3,
n = 11; C4,
n = 10; and C5,
n = 6. Thus, the HSI sample-level dataset corresponded to the complete master cohort, whereas the number of analysis-ready samples varied in individual targeted comparisons according to the PMI classes included. For the present sample-level reanalysis, three standardised regions of interest were defined on representative cortical bone surfaces using the RGB image and were transferred consistently to the corresponding HSI parameter maps. Regions containing background, glare, shadow, cut-edge artefacts, visible contamination, or damaged areas were excluded. For each region of interest, the corresponding device-derived NIR perfusion, oxygenation/StO
2, THI, and TWI index values were recorded. ROI-derived measurements were aggregated at the physical-sample level by calculating the mean, standard deviation, minimum, maximum, and range for each HSI parameter. In addition, two exploratory ratios derived from the device-generated perfusion and THI indices were evaluated. The direct Perfusion/THI ratio was calculated only for samples with THI > 0, whereas the bounded index Perfusion/(Perfusion + THI) was calculated for all samples to avoid instability caused by zero or near-zero THI values. The resulting sample-level HSI parameters were used for descriptive class-wise analyses, parameter-wise ROC analyses, single-modality modelling, and matched multimodal analyses. The present sample-level reanalysis was based on standardised HSI parameter maps generated from the original hyperspectral image data rather than on the proprietary raw hyperspectral image cubes.
2.5. Statistical Analysis
Continuous variables are reported as medians and interquartile ranges. Class-wise differences were assessed using Kruskal–Wallis tests. Pairwise non-parametric comparisons were performed using Mann–Whitney U tests, and false-discovery-rate adjustment was applied within each modality where multiple related comparisons were performed. Spearman rank correlations were used to evaluate ordered class trends. All statistical tests were two-sided.
Targeted discrimination was quantified using receiver operating characteristic (ROC) analysis and the area under the ROC curve (AUC). Ninety-five per cent confidence intervals for selected ROC AUC estimates were obtained using 20,000 stratified bootstrap resamples at the physical-sample level, with a fixed random seed of 20,260,811 to ensure reproducibility. Exploratory operating points were determined using a constrained high-specificity criterion rather than Youden’s J statistic. Candidate thresholds were restricted to those achieving a specificity of at least approximately 0.95, after which the threshold yielding the highest sensitivity within this constrained set was selected. Because achievable specificity values are discrete in small datasets, the realised specificity could exceed 0.95. These operating points were generated solely to illustrate the internal sensitivity–specificity trade-off and were not interpreted as externally validated forensic cut-offs.
Single-modality and multimodal multivariate models were evaluated using repeated stratified cross-validation. Five folds were used where permitted by the minority-class size, with 20 repetitions. The independent statistical unit was the unique physical bone sample; repeated measurements, spectra, regions of interest, and technical replicates were aggregated at the physical-sample level before modelling. All fold-dependent preprocessing steps, including scaling, standard normal variate transformation where applicable, and principal component analysis, were fitted exclusively using the corresponding training fold and subsequently applied unchanged to the held-out fold. This procedure was used to prevent information leakage between training and evaluation data.
The primary low-dimensional model inputs were predefined, biologically interpretable feature sets rather than variables selected through an automated supervised feature-selection procedure. The micro-CT model used six predefined structural and density-related parameters, the HSI model used four primary device-derived sample-level optical indices, and the primary Mira and Senterra Raman models each used six predefined molecular parameters. No LASSO, recursive feature elimination, or comparable automated outcome-driven variable-selection algorithm was applied to these primary feature sets. Additional individual parameters were investigated separately in exploratory univariate analyses and were not retrospectively substituted into the predefined primary models on the basis of their observed performance.
NIR-ONE spectroscopy was handled differently because each sample-level spectrum contained 201 reflectance variables covering 1550–1950 nm in 2-nm increments. For multivariate NIR-ONE modelling, the complete spectral vector was retained without supervised wavelength selection. Dimensionality reduction was performed using principal component analysis with a fixed specification of 10 retained principal components. Scaling, standard normal variate preprocessing where applicable, and PCA were fitted exclusively to the training data within each cross-validation split, and held-out samples were projected into the PCA space defined by the corresponding training fold. Raw and SNV-preprocessed NIR-ONE models were evaluated separately.
Linear support-vector machines with class-balanced weights were used to provide a consistent supervised modelling framework across modalities. The SVM regularisation parameter was fixed at C = 1.0, corresponding to the implementation default, and was not optimised using a data-driven hyperparameter search. Consequently, no inner hyperparameter-selection procedure or nested cross-validation was performed for C. Model settings were not selected on the basis of performance in the held-out evaluation folds. All fold-dependent preprocessing steps, including scaling, SNV transformation where applicable, and PCA, were fitted exclusively on the corresponding training fold and subsequently applied unchanged to the held-out fold.
The available cohort size was determined by retrospective physical-sample availability rather than by a prospective power calculation. Conventional events-per-variable heuristics developed primarily for regression modelling are not directly transferable to PCA-reduced support-vector classifiers; nevertheless, predictor dimensionality was deliberately restricted relative to the available number of independent samples. The primary HSI model contained four predictors, the primary micro-CT and Raman models contained six predictors each, and the 201-variable NIR-ONE spectrum was reduced to 10 principal components before classification. Despite these dimensionality controls, the relatively small and imbalanced cohort, particularly the six C5 samples, entails a substantial risk of model instability and overfitting. All multivariate classification results were therefore regarded as exploratory internal estimates requiring independent external validation.
Single-modality models were evaluated separately for micro-CT, HSI, NIR-ONE, Mira Raman spectroscopy, and Senterra Raman microscopy. Raman spectroscopy was excluded from C5-containing quantitative models because C5 spectra were not quantitatively evaluable owing to excessive fluorescence. Multimodal models were restricted to physical samples with complete feature availability for every modality included in the respective model. For the corrected global five-class HSI + micro-CT + NIR-ONE analysis, complete information was available for 97 of the 107 unique physical samples; consequently, 10 samples (9.3%) were excluded from this complete-case model because at least one required modality block was unavailable. For the targeted C1 + C2-versus-C4 + C5 analysis, 96 physical samples were eligible after exclusion of C3, and 87 of these had complete HSI, micro-CT, and NIR-ONE information; thus, 9 of 96 task-eligible samples (9.4%) were excluded owing to incomplete modality availability.
No imputation of entirely missing modality blocks was performed. Missingness predominantly reflected non-acquisition or technical non-evaluability of an analytical modality rather than isolated missing scalar values within an otherwise complete measurement. Imputation of an entire imaging or spectroscopic modality would therefore require strong assumptions regarding relationships between analytically distinct data sources and could introduce synthetic cross-modal information. Complete-case multimodal estimates were consequently interpreted specifically for the corresponding analysis-ready subsets, and potential selection bias resulting from differential modality availability was considered when comparing model performance.
Because the PMI classes were imbalanced, balanced accuracy was defined as the primary multivariate performance metric. Accuracy and macro-F1 score were reported as secondary metrics for all applicable models, whereas ROC AUC, sensitivity, and specificity were additionally reported for binary classification tasks. For parameter-wise analyses, Mann–Whitney U statistics, ROC AUC values, bootstrap confidence intervals where applicable, and exploratory high-specificity operating points were used to characterise task-specific discrimination. The corrected global five-class analysis was treated as a secondary benchmark rather than as the primary diagnostic endpoint because the principal objective of the study was to evaluate task-specific analytical strengths across distinct forensic questions.
For each targeted comparison, the analysis-ready sample size depended on the PMI classes and modalities included in the respective task. For HSI, n = 107 samples were available for C5 versus C1–C4, n = 96 for C1 + C2 versus C4 + C5, n = 90 for C1 + C2 versus C4, and n = 80 for C1 versus C2. Modality-specific sample sizes differed according to analytical availability and are therefore reported together with the corresponding results rather than assuming identical cohorts across modalities.
All reported performance estimates represent internal evaluation only. Parameter-wise ROC analyses were performed at the physical-sample level with bootstrap confidence intervals where applicable, whereas multivariate classifiers were assessed using repeated stratified cross-validation. No independent external validation cohort was available. Consequently, the reported AUC values, operating points, and multivariate classification metrics should be interpreted as exploratory estimates of discrimination within the present cohort and not as externally validated measures of forensic diagnostic performance.
2.6. Development of the Exploratory Decision-Support Framework
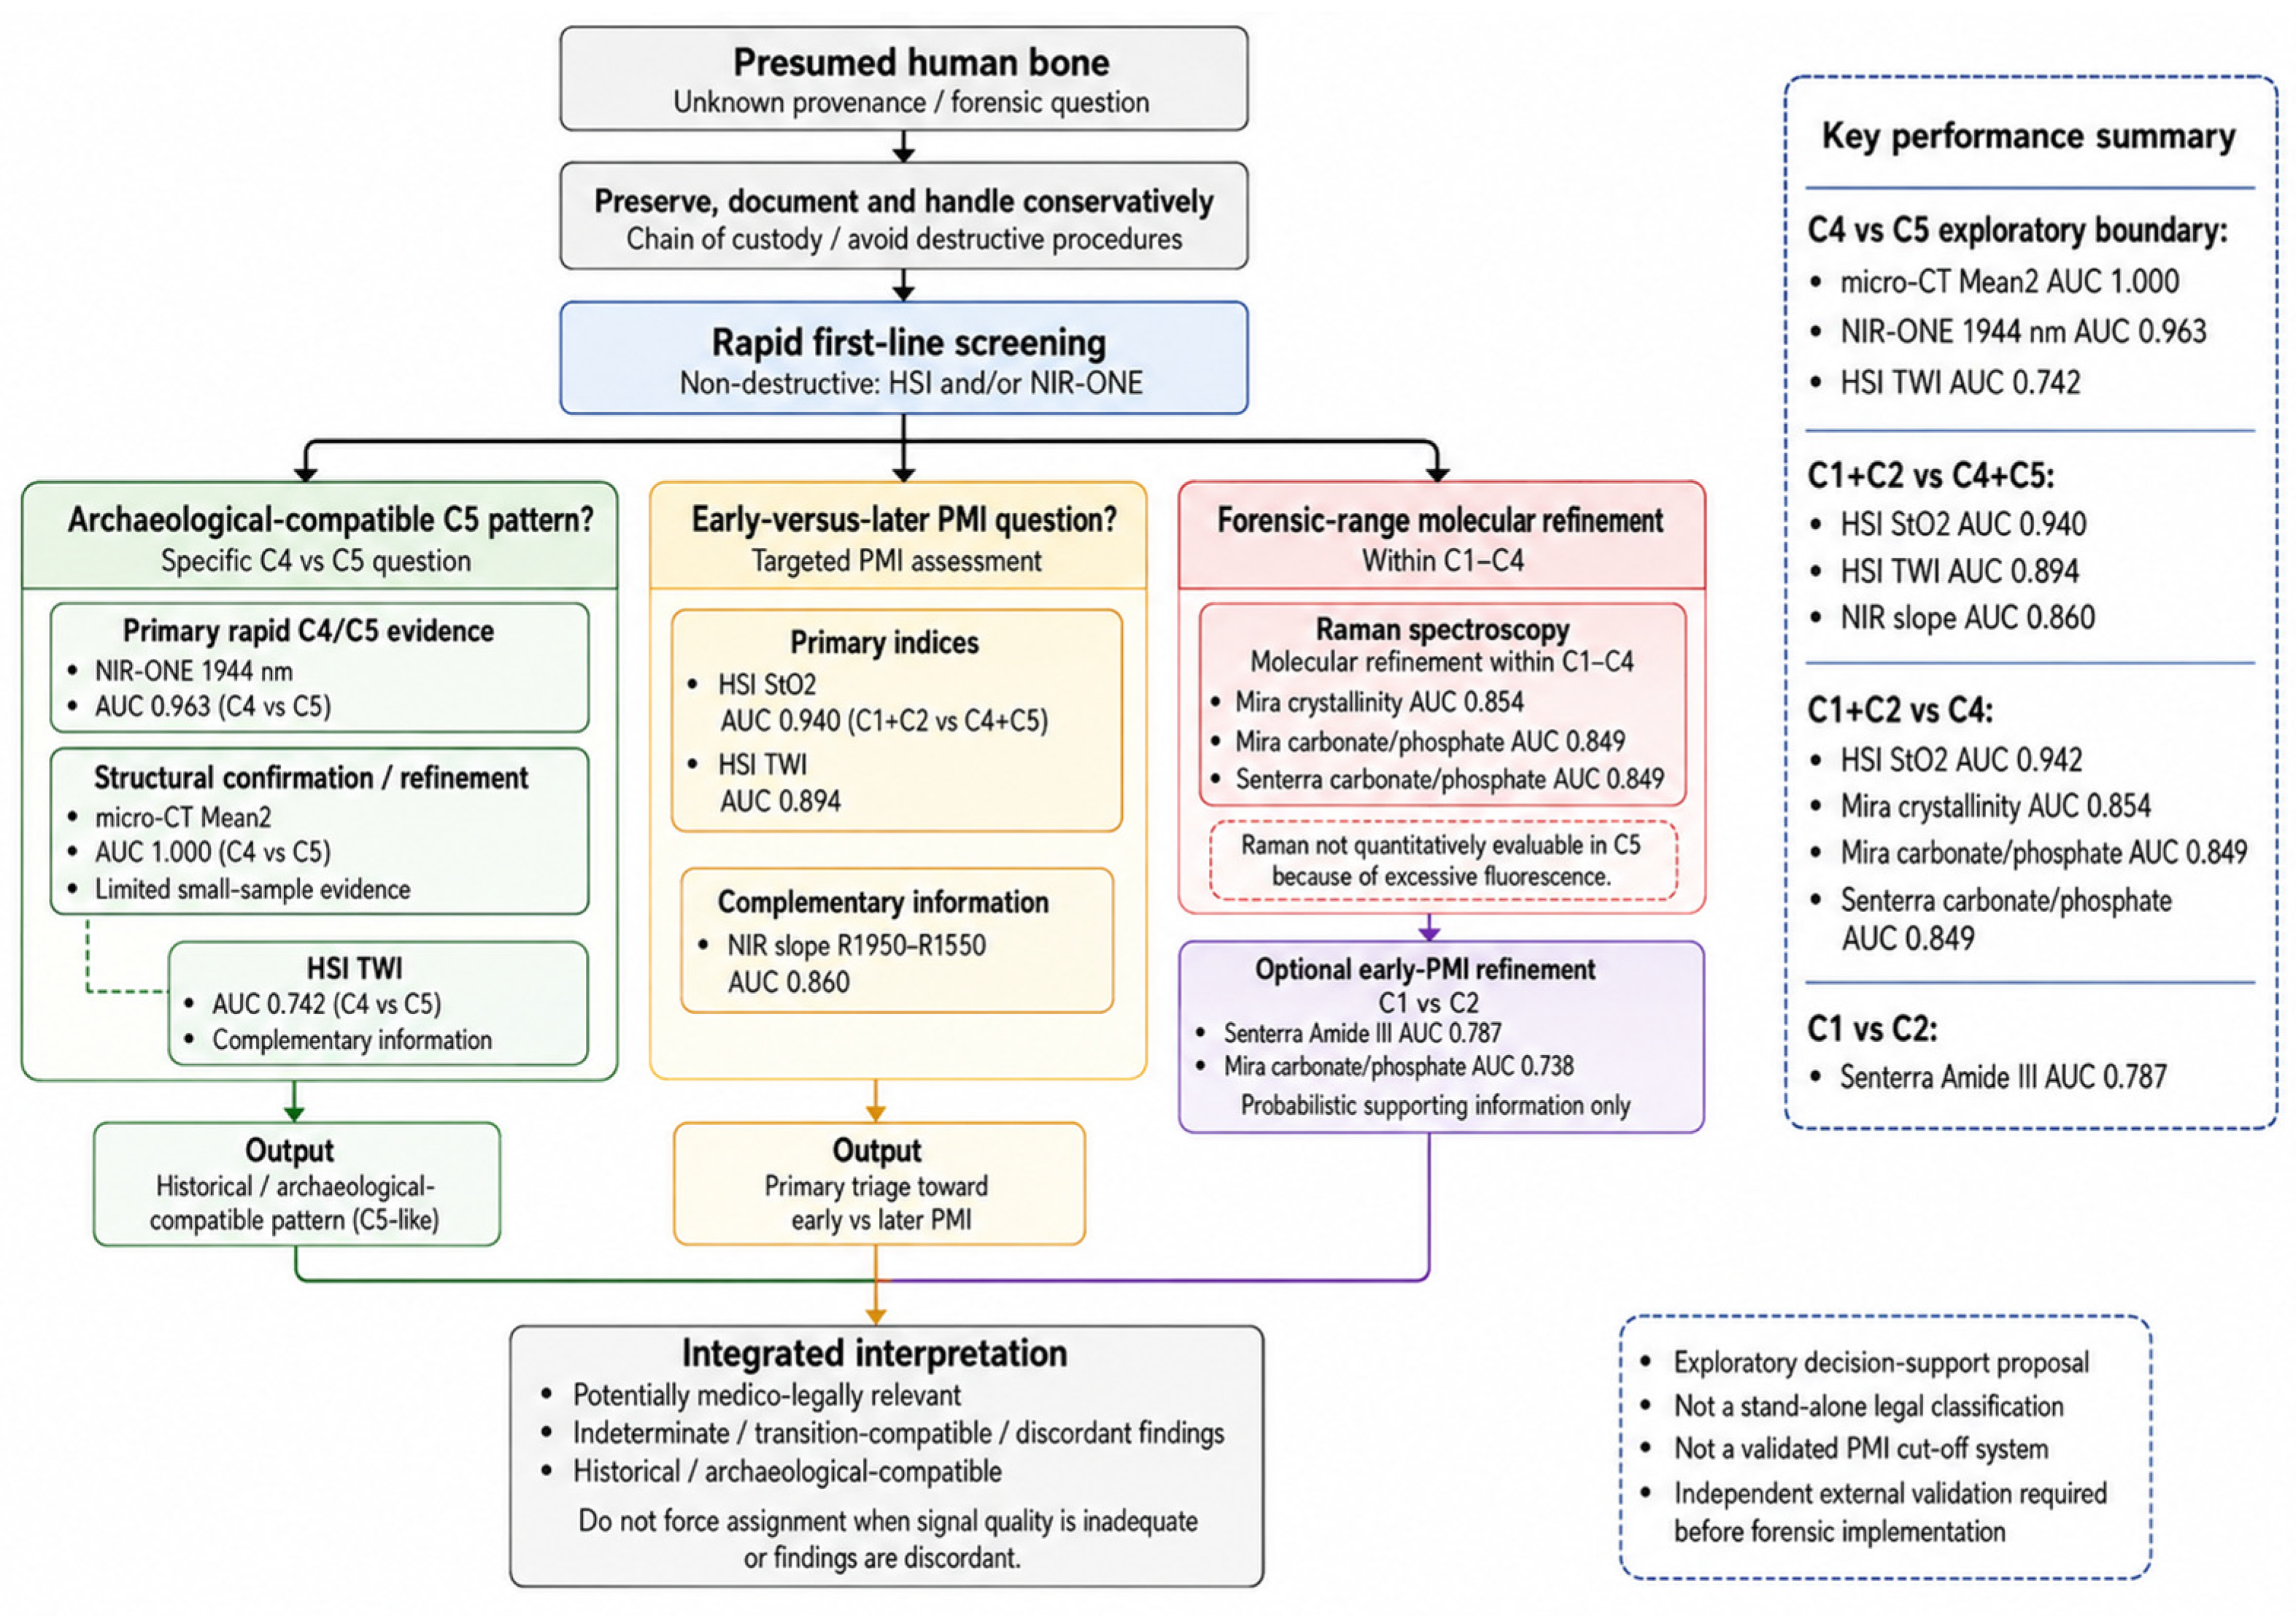
The hypothesis-generating exploratory decision-support framework was derived after completion of the targeted analyses and was not prespecified or evaluated as a validated sequential classifier. For each forensic task, the modality or parameter with the strongest internally evaluated performance was identified. Modalities were then ordered according to diagnostic performance, non-destructiveness, acquisition burden, biological interpretability and sample availability. The resulting framework distinguished between rapid screening, archaeological C5 assessment, early-versus-later PMI assessment, molecular characterisation within classes 1–4 and probabilistic early-PMI refinement.
4. Discussion
The principal finding of the present study is that the diagnostic value of multimodal imaging and spectroscopy for post-mortem interval assessment is strongly task-dependent. Rather than identifying one universally superior modality or one optimal global five-class model, the present reanalysis demonstrated distinct modality-specific strengths for different forensic questions. Micro-CT Mean2, NIR-ONE reflectance at 1944 nm, and HSI-derived TWI showed strong internal performance for distinguishing archaeological class 5 from the pooled C1–C4 reference group. Importantly, the additional exploratory direct C4-versus-C5 analysis refined this interpretation: micro-CT Mean2 showed complete separation of the available samples (AUC 1.000), and NIR-ONE reflectance at 1944 nm retained excellent performance (AUC 0.963), whereas HSI-derived TWI showed only moderate direct discrimination (AUC 0.742). Thus, the modality ranking depended not only on whether archaeological material was included, but also on the precise forensic boundary being assessed. Conversely, the device-derived HSI StO2 and TWI indices were most informative for differentiating early classes 1 + 2 from later classes 4 + 5, while Raman-derived mineral and matrix parameters provided complementary molecular information within classes 1–4. Discrimination between class 1 and class 2 remained moderate, and corrected global five-class modelling did not consistently outperform the strongest single-modality model. Taken together, these findings indicate that PMI assessment should be organised according to the specific forensic decision task rather than as a uniform all-class classification problem.
Post-mortem bone alteration is multidimensional. Structural degradation, mineral-density changes, alterations in collagen and organic matrix, hydration changes, microbial effects, surface heterogeneity and environmental exposure do not occur uniformly and are not captured equally by any single analytical method. Micro-CT provides information on cortical architecture and density-related features. HSI provides spatial surface-level optical information. Mira Raman spectroscopy provides molecular mineral and matrix information, particularly in phosphate-associated spectral regions around 953–960 cm−1. NIR-ONE spectroscopy provides rapid, point-based near-infrared information on hydration, organic matrix composition, and mineral-associated properties. The observed task dependence is biologically plausible because different stages of post-mortem alteration affect bone structure, hydration, optical properties and molecular composition to different extents.
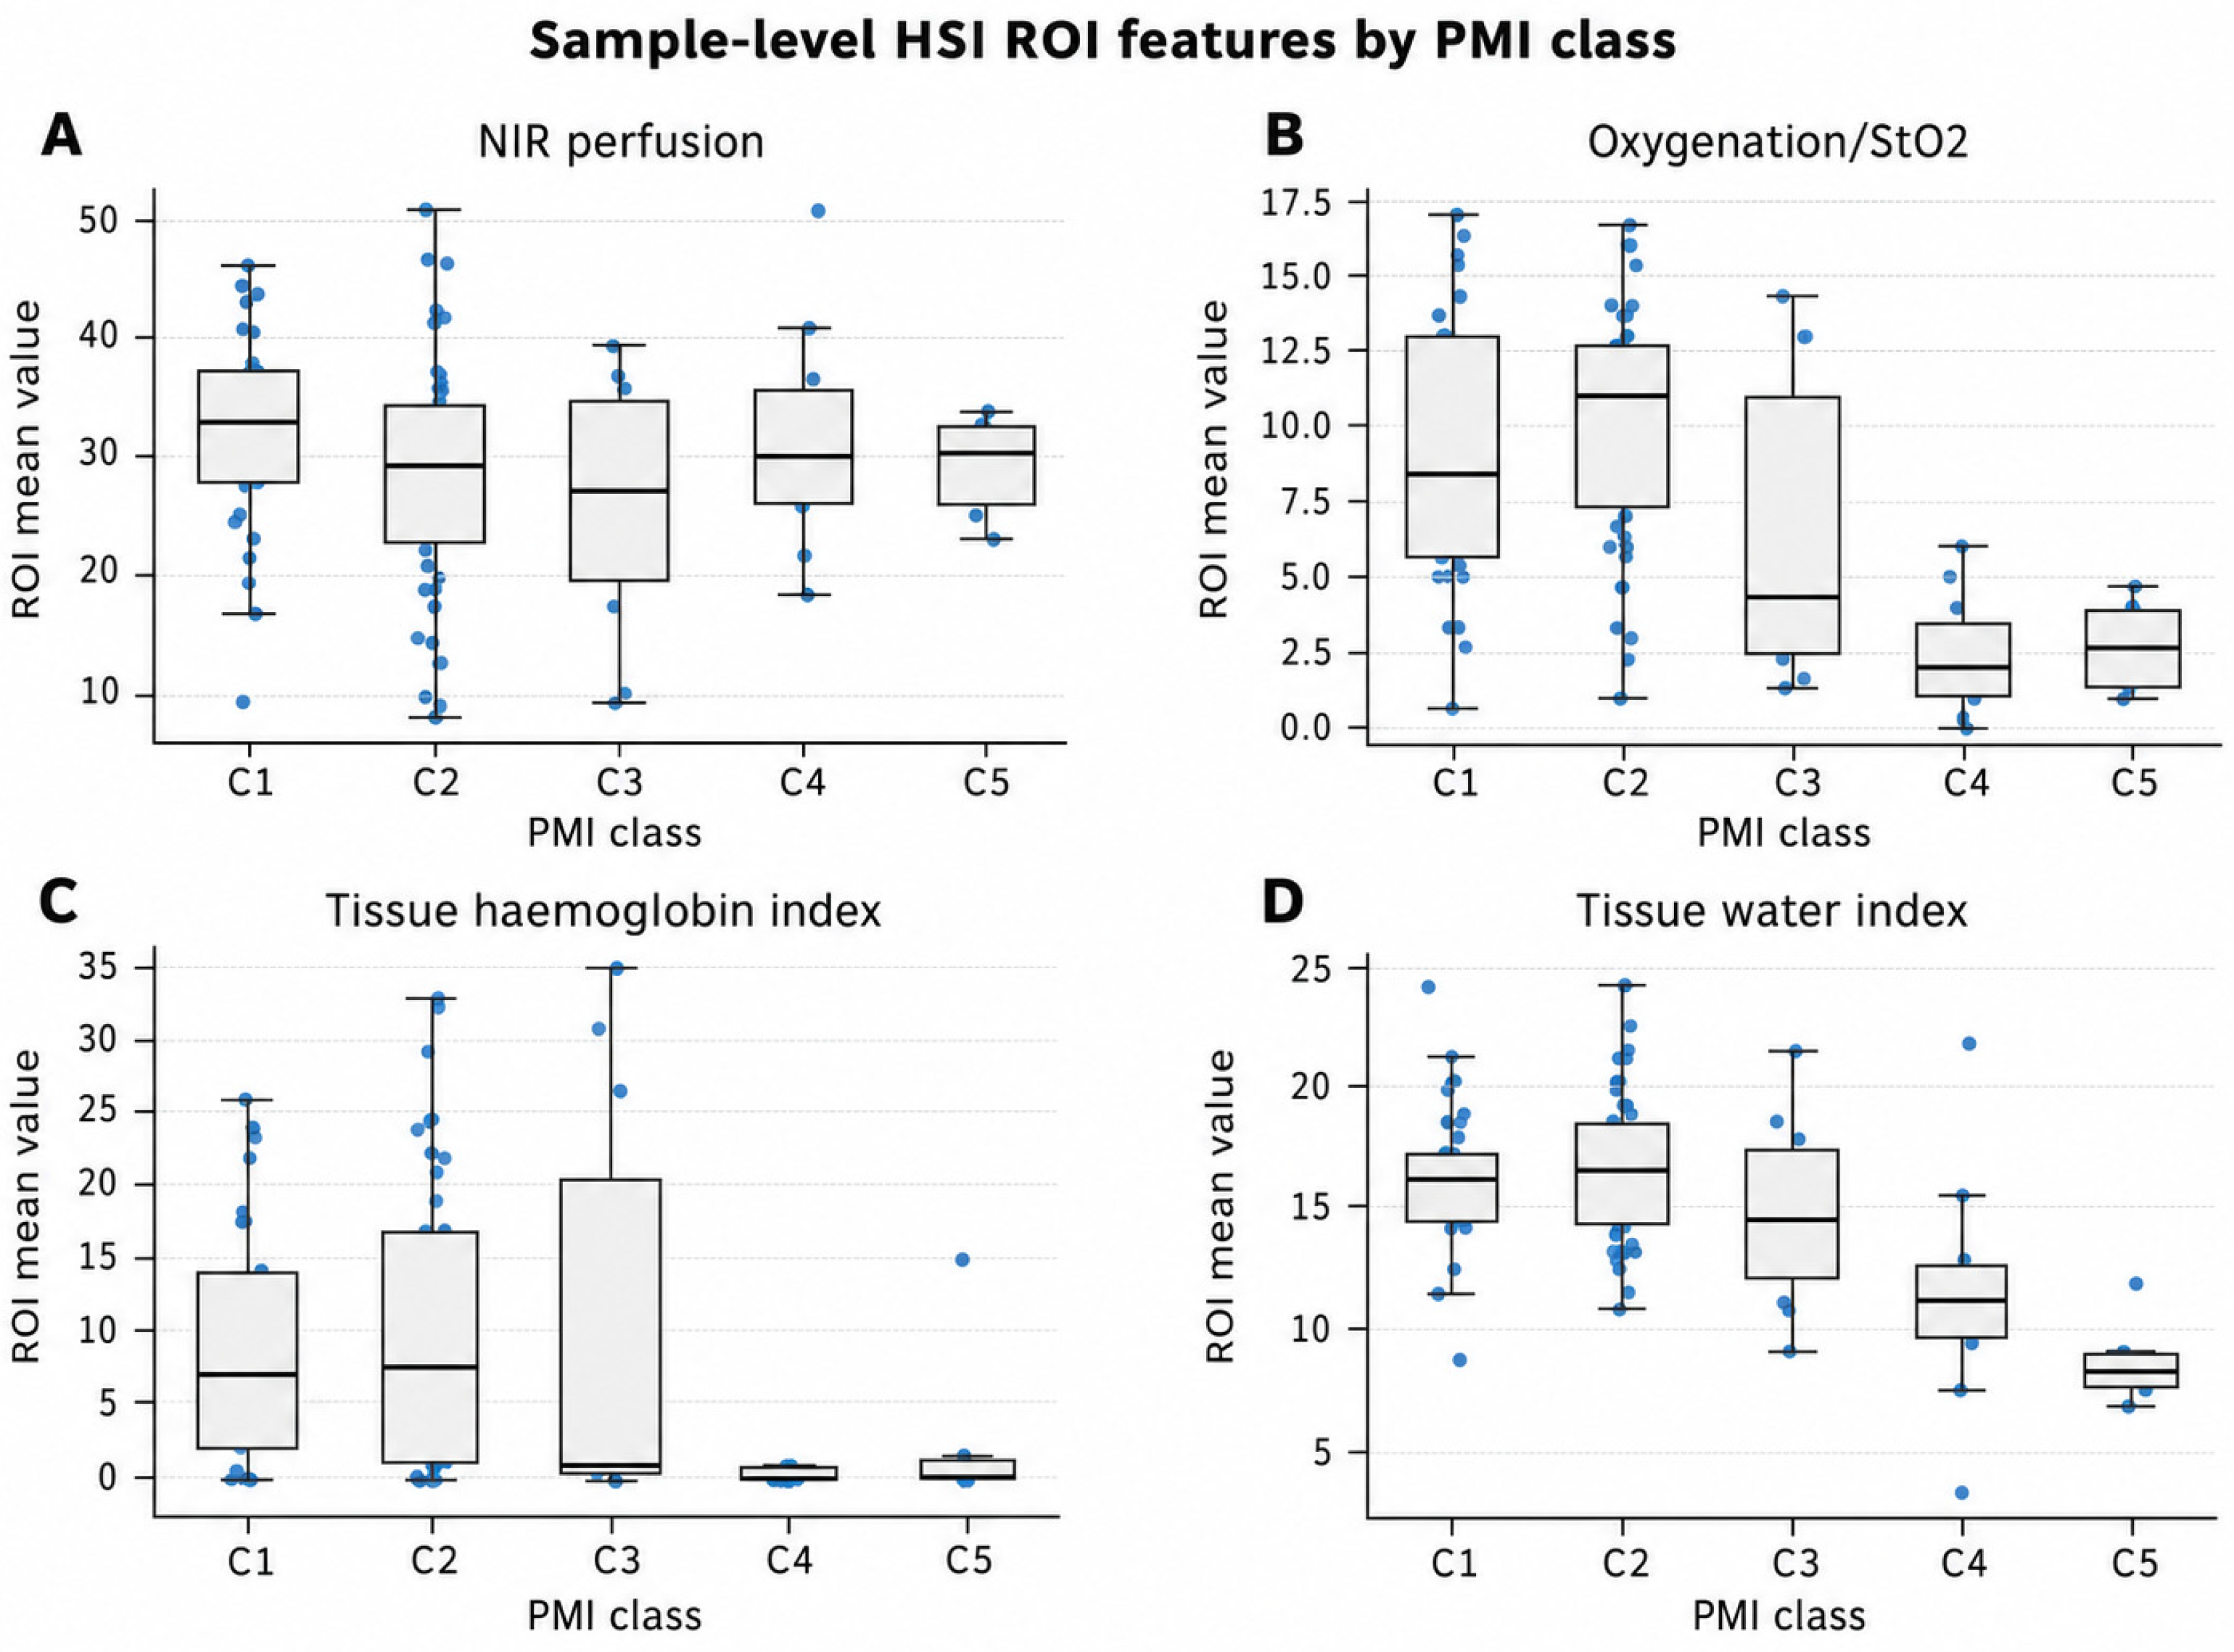
Very-old and archaeological bone may exhibit pronounced density-related and structural changes together with distinct high-wavelength NIR and HSI-derived TWI spectral signatures, which were captured particularly well by micro-CT, NIR-ONE, and HSI in the present dataset. By contrast, differences between early and later PMI intervals may be reflected more strongly in the device-derived StO2 and water-related optical indices generated by HSI. In the context of post-mortem, air-dried skeletal material, these HSI-derived parameters should not be interpreted as physiological measures of tissue oxygenation, perfusion, haemoglobin content or hydration. Rather, they represent algorithm-derived spectral indices whose variation may reflect PMI-associated changes in surface optical properties, water-related spectral characteristics, tissue composition and post-mortem matrix alteration. Raman spectroscopy interrogates phosphate-, carbonate-, crystallinity- and matrix-associated changes and therefore provides complementary molecular information within the Raman-compatible forensic range.
An important interpretive limitation is that C5 differs from the remaining classes not only in assigned PMI but also in archaeological and taphonomic context. Chronological age therefore cannot be disentangled from burial environment, preservation state, microbial exposure, storage conditions, and post-recovery history in the present cohort. The observed C5-associated structural and spectral signatures must consequently be interpreted as archaeological-compatible, context-dependent patterns rather than as biomarkers of elapsed time alone. Furthermore, the classification system contains a substantial unrepresented interval between C4 (>1–10 years) and C5 (>100 years). The present data therefore cannot establish a continuous temporal transition or a validated chronological threshold between later forensic and archaeological material. Future studies should incorporate structured taphonomic metadata and skeletal remains spanning the currently unrepresented interval between approximately 10 and 100 years.
No single modality can be expected to capture all these processes equally well across the full PMI spectrum. This interpretation is consistent with recent reviews that emphasise that late PMI estimation remains unresolved because multiple intrinsic and environmental factors influence skeletal decomposition and diagenesis, and that no single, universally accepted method currently provides reliable dating across broad forensic and archaeological intervals [
1,
3]. It is also consistent with histological evidence showing that bone diagenesis involves early collagen alteration and context-dependent microscopic degradation [
4].
The novelty of the present study lies in the harmonisation of previously modality-specific datasets at the level of the unique physical bone sample and in their direct comparison across defined forensic decision tasks. Rather than reassessing whether each individual modality contains PMI-associated information, the present analysis integrates structural, molecular, point-spectroscopic and spatial optical information within a common sample-level analytical framework. In particular, the study newly combines interpretable HSI-derived ROI parameters, wavelength-specific NIR-ONE features, predefined micro-CT parameters and molecular Raman markers in task-specific diagnostic comparisons.
A further methodological contribution is the aggregation of repeated measurements, spectra and regions of interest at the physical-sample level before statistical analysis and model development, thereby reducing the risk of information leakage from technical replicates. Importantly, the corrected analyses also demonstrated that multimodal fusion did not inherently improve diagnostic performance. The strongest global five-class multimodal model did not outperform the best single-modality model, whereas individual modalities showed distinct strengths for specific forensic contrasts. Thus, the added value of multimodality in the present study lies not in universal feature fusion, but in the selective use of complementary analytical information according to the forensic question being addressed.
A central finding of the present reanalysis is the added value of HSI-derived ROI features. In earlier HSI work, classification was based on deep-learning analysis of hyperspectral image data. In the present study, the available standardised HSI parameter maps were reprocessed into sample-level ROI features, including NIR perfusion, oxygenation/StO2, tissue haemoglobin index, and tissue water index.
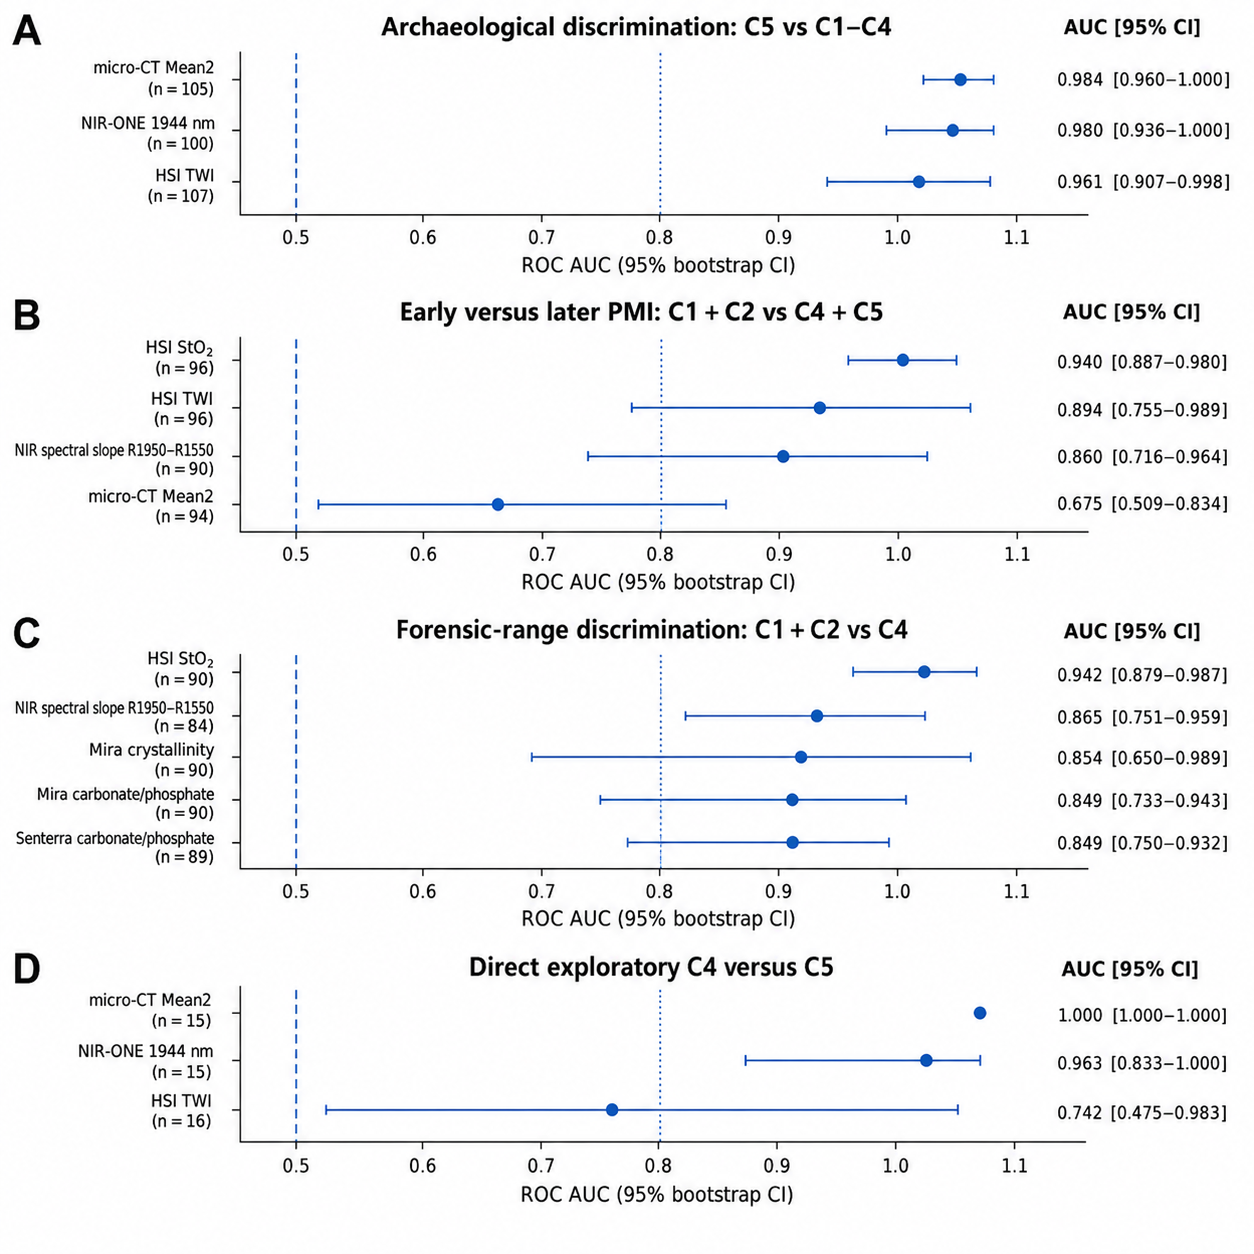
The targeted analysis showed, however, that the value of HSI was not limited to multimodal feature fusion. HSI-derived StO2 achieved an AUC of 0.940 for classes 1 + 2 versus classes 4 + 5, and TWI achieved an AUC of 0.894. Thus, HSI was the strongest modality for the early-versus-later PMI contrast. This suggests that the spectral characteristics captured by the device-derived HSI StO2 index and TWI indices may change earlier or more consistently than gross structural features during the transition from early to later PMI. These changes should be interpreted as alterations in post-mortem optical and compositional properties rather than as changes in physiological tissue oxygenation or perfusion. The exploratory Perfusion/(Perfusion + THI) index showed directional class-related behaviour but was less informative than StO2 and TWI and should therefore not be prioritised as a primary diagnostic marker. These findings support a direct task-specific role for HSI in early-versus-later PMI assessment, in addition to its complementary value in multimodal models.
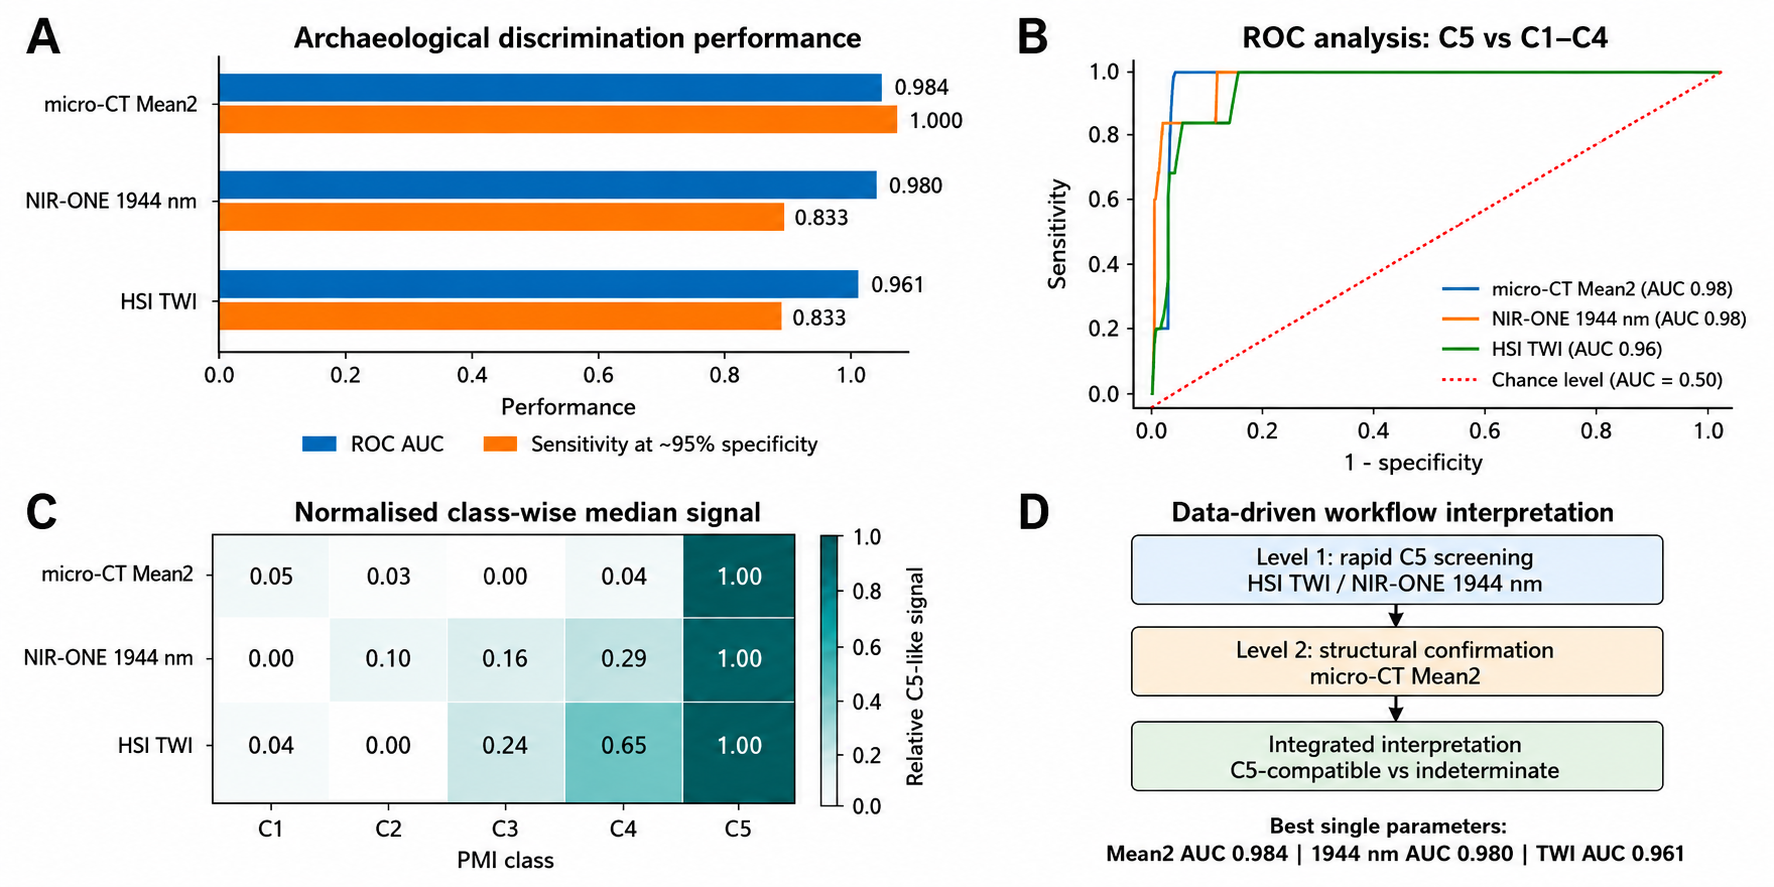
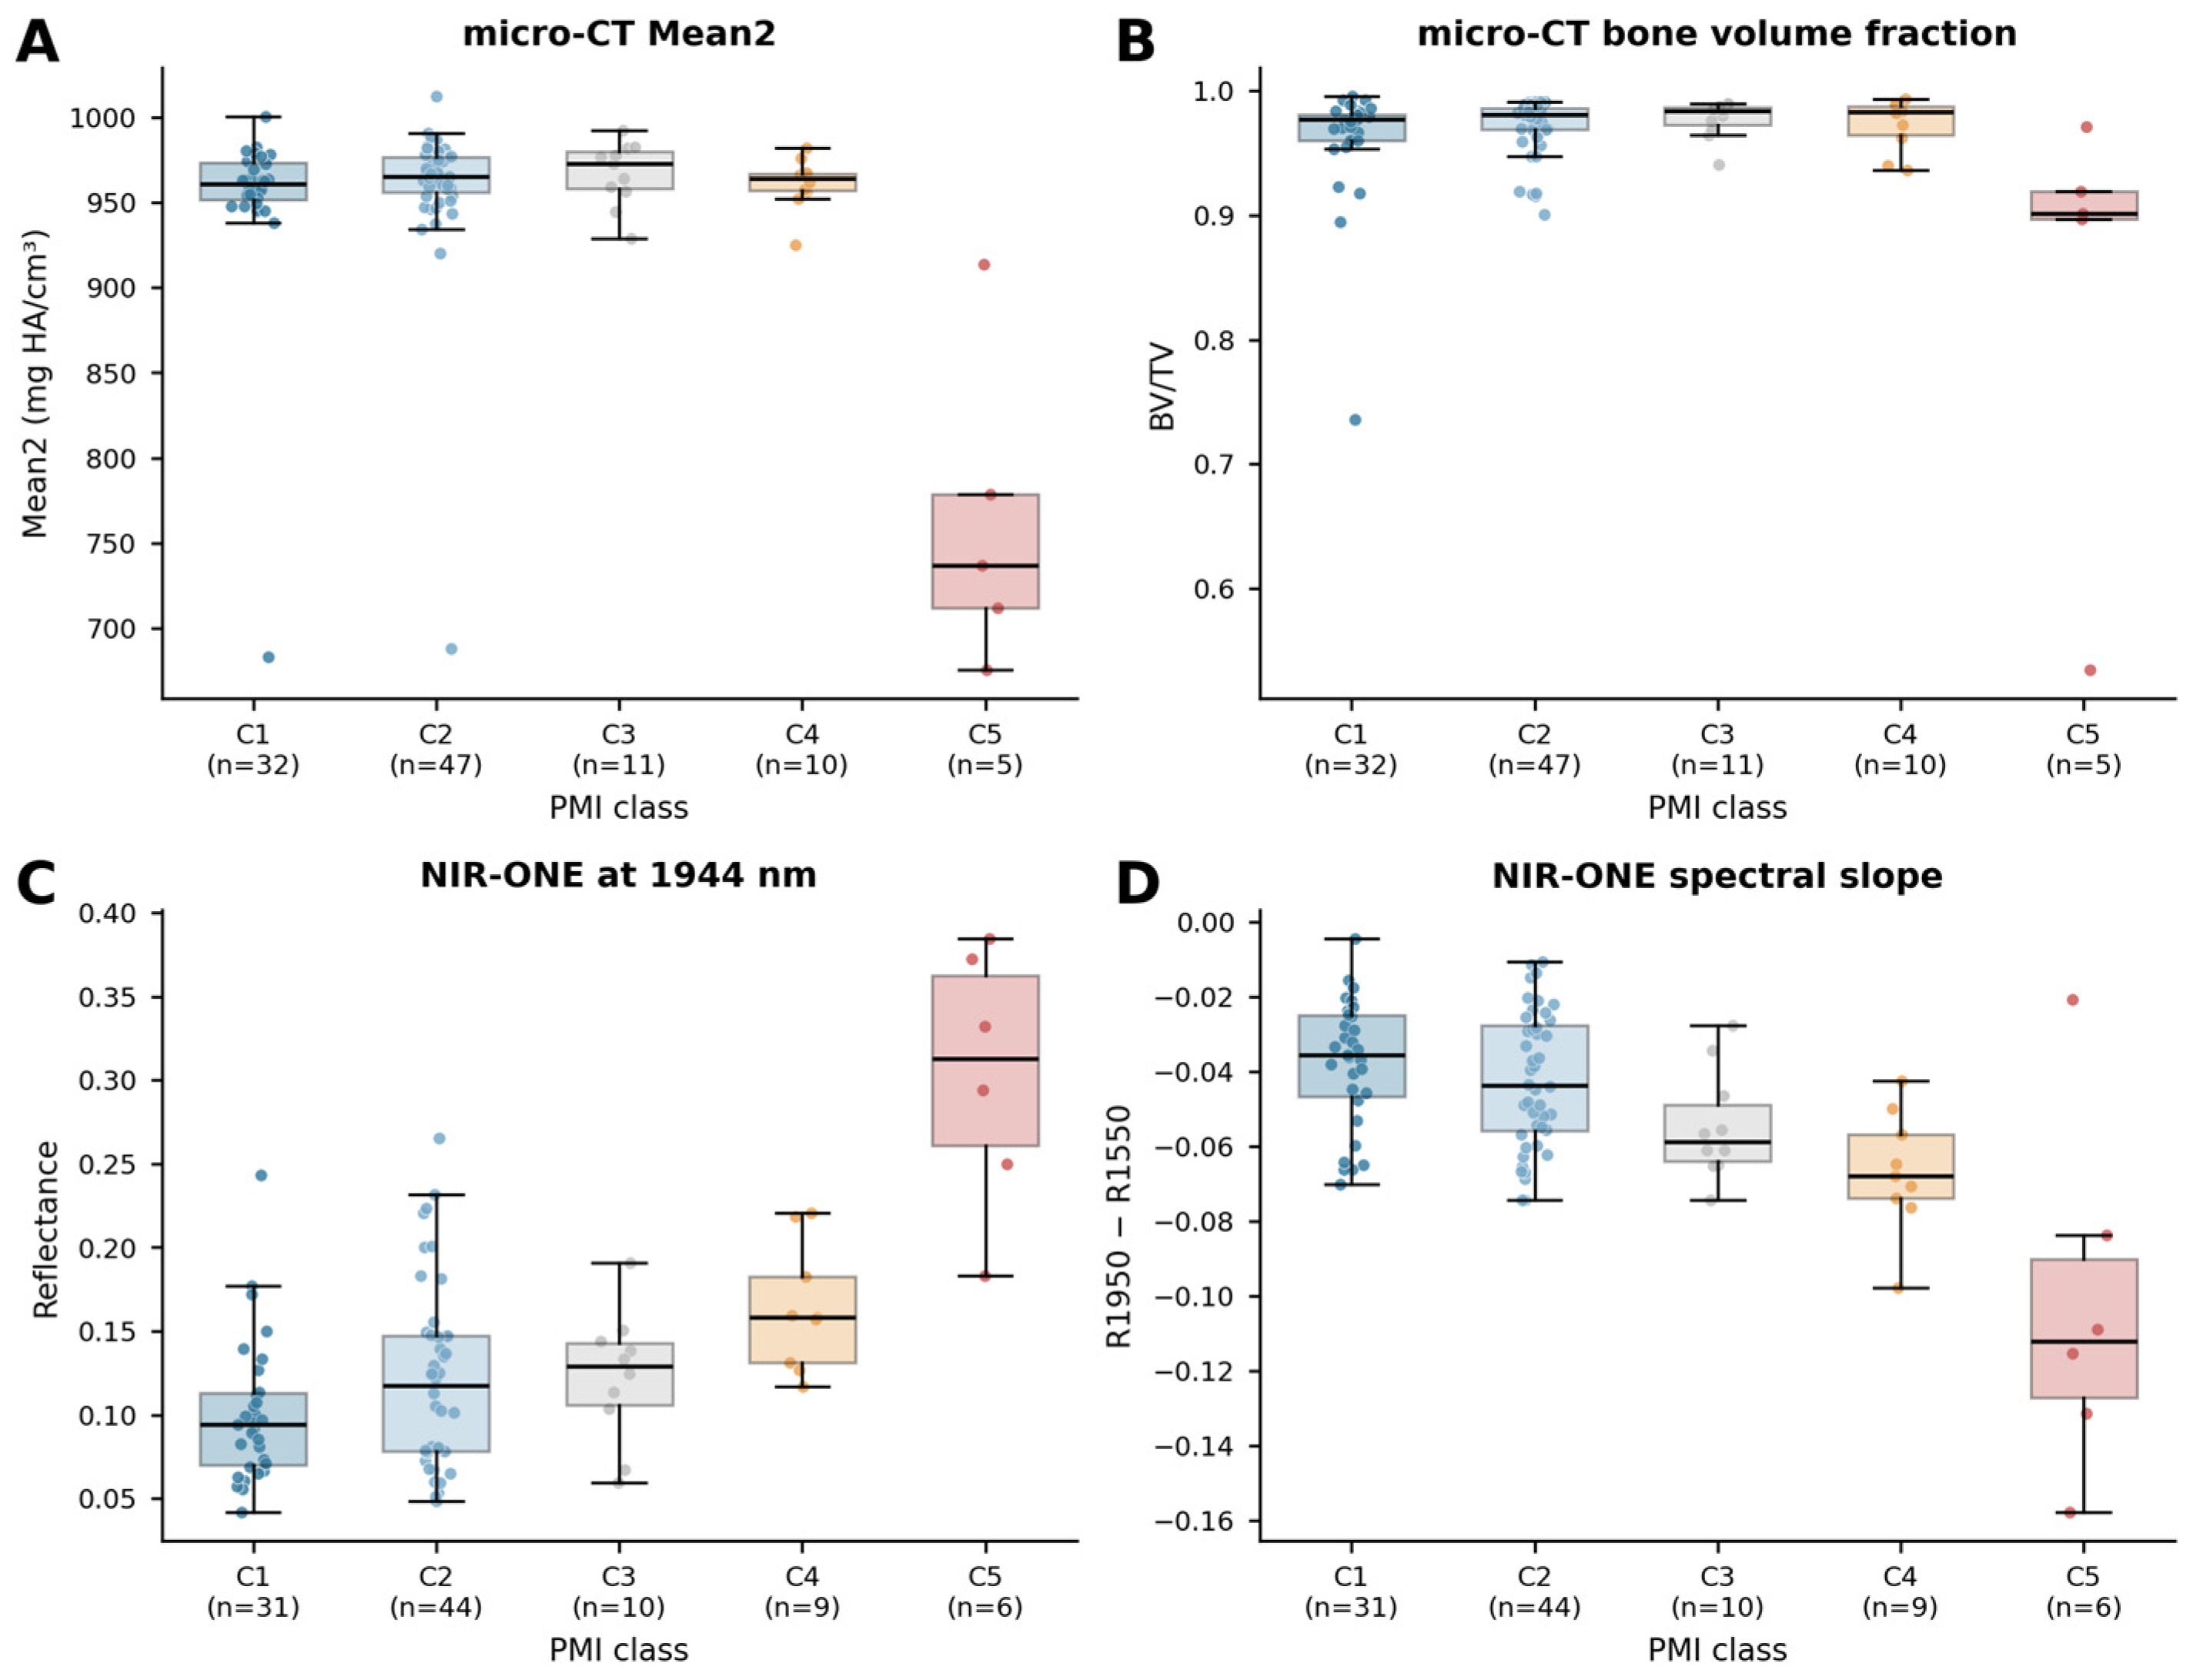
The targeted archaeological analysis provided a more forensically interpretable assessment than the one-vs-rest sensitivity and specificity derived from the previous global five-class model. Micro-CT Mean2 achieved an AUC of 0.984, NIR-ONE reflectance at 1944 nm an AUC of 0.980 and HSI TWI an AUC of 0.961 for class 5 versus classes 1–4. At exploratory operating points requiring approximately 95% specificity, micro-CT Mean2 retained a sensitivity of 1.000, whereas NIR-ONE 1944 nm and HSI TWI each retained a sensitivity of approximately 0.833. These findings address the forensically relevant trade-off between avoiding false archaeological assignments and preserving sensitivity. Nevertheless, class 5 comprised only six unique physical samples. The resulting confidence intervals, sensitivity estimates and operating points are therefore unstable and must not be interpreted as validated forensic thresholds.
The distinction between later forensic C4 and archaeological C5 material deserves particular consideration because it represents a forensically relevant temporal boundary within the present classification scheme. Class 4 comprised skeletal remains with an assigned PMI of 1–10 years, whereas class 5 represented archaeological material older than 100 years. Although the primary archaeological analysis compared C5 with the pooled C1–C4 reference group rather than with C4 alone, C4 constituted the temporally closest forensic class included in that comparator group. The high discriminatory performance observed for C5 therefore indicates that the C5-associated structural and optical pattern remained detectable despite the inclusion of later forensic C4 samples.
From a forensic triage perspective, this finding is particularly relevant for skeletal remains of unknown provenance, for which one of the first analytical questions may be whether the observed pattern is compatible with a potentially medico-legally relevant forensic interval or with a substantially older, archaeological context. The exploratory direct C4-versus-C5 analysis showed complete separation for micro-CT Mean2 in the available samples (AUC 1.000; C4, n = 10; C5, n = 5) and excellent discrimination for NIR-ONE reflectance at 1944 nm (AUC 0.963; 95% bootstrap CI, 0.833–1.000; C4, n = 9; C5, n = 6), whereas HSI-derived TWI showed only moderate discrimination (AUC 0.742; 95% bootstrap CI, 0.475–0.983; C4, n = 10; C5, n = 6). These findings refine the pooled C5-versus-C1–C4 analysis and demonstrate that performance at the specific C4–C5 boundary is modality dependent. Because class sizes were small and the evaluated parameters were selected following the pooled analysis, these findings should be regarded as hypothesis-generating and require independent replication in larger cohorts before any threshold-based forensic application.
The role of Senterra Raman microscopy should be interpreted cautiously. In the targeted analysis, Senterra-derived carbonate/phosphate and Amide III parameters showed potentially useful discrimination within classes 1–4. However, the apparently strong performance of the A577/A958 ratio should be regarded as exploratory because this parameter was identified post hoc and was not a prespecified primary endpoint. Senterra provided complementary high-resolution Raman information but showed lower stand-alone robustness than the primary Mira Raman feature set in the present sample-wise comparison. This finding does not argue against microscopic Raman spectroscopy in general but indicates that improved fluorescence management, harmonised preprocessing, prespecified feature selection and independent replication are required.
A further important finding was the limited applicability of Raman spectroscopy to archaeological class-5 samples. Excessive fluorescence obscured the Raman signal and prevented reliable quantitative peak extraction. Raman was therefore excluded from all quantitative tasks involving class 5. This limitation is analytically relevant because it demonstrates that the absence of usable Raman parameters is itself dependent on sample age, preservation and diagenetic state. Raman spectroscopy should consequently be positioned as a molecular characterisation technique within classes 1–4 rather than as a universal modality across the entire PMI range. Within this restricted range, crystallinity and carbonate/phosphate parameters provided complementary information for differentiating classes 1 + 2 from class 4, but class 1 versus class 2 remained only moderately separable.
NIR-ONE spectroscopy showed distinct task-specific strengths. Reflectance at 1944 nm was highly informative for class-5 discrimination against the pooled C1–C4 reference group and retained excellent performance in the exploratory direct C4-versus-C5 comparison (AUC 0.963). The spectral slope between 1550 and 1950 nm, in contrast, contributed primarily to early-versus-later differentiation. The wavelength-resolved analysis further indicated that the 1944-nm finding was located within a broader discriminatory high-wavelength region rather than representing an isolated single-wavelength effect.
From a practical forensic perspective, the decision-support pathway shown in
Figure 7 supports selective escalation rather than a fixed requirement to apply every modality to every sample. HSI and NIR-ONE are suitable for rapid, non-destructive first-line screening, but the subsequent analytical step should depend on the forensic question. A strong C5-like optical or NIR pattern may warrant structural confirmation using micro-CT. In contrast, a non-C5 or uncertain sample requiring differentiation within the forensic range may benefit from Raman-based molecular characterisation. Micro-CT is therefore not invariably the final step, and Raman is not universally the second step. The optimal sequence is task-dependent.
For bone samples of unknown provenance, conservative pre-analytical handling remains essential. The sample should initially be treated as potentially medico-legally relevant, destructive procedures should be avoided, contextual information should be documented and chain-of-custody requirements should be maintained. Within this conservative pathway, the analytical results should support one of three interpretive categories: potentially medico-legally relevant, indeterminate, or compatible with historical/archaeological origin. The wording “compatible with” is important because the analytical framework cannot independently establish archaeological provenance or legal status. Discordant results, insufficient signal quality, fluorescence interference, values outside the observed training range or uncertain sample preparation should result in an indeterminate classification rather than a forced PMI assignment.
Several limitations must be considered. First, the study was retrospective and internally evaluated. Although sample-wise harmonisation was used to reduce the risk of data leakage, external validation in independent cohorts is still required. This is particularly relevant because transparent reporting and independent validation are central requirements for prediction-model and AI-assisted diagnostic studies, as emphasised by TRIPOD + AI and imaging-AI reporting guidance [
13,
14]. Second, the dataset was imbalanced, with relatively few samples in the later PMI classes, especially class 5. Class 5 comprised only six unique physical samples. Consequently, the very high AUC estimates and exploratory operating points for archaeological discrimination may be optimistic and are associated with considerable uncertainty. Accordingly, AUC values approaching 1.0 in the present dataset should not be interpreted as evidence of near-perfect performance in independent forensic material. They represent internally derived hypothesis-generating estimates whose stability must be established in substantially larger and independent C5 cohorts. This limits the stability of class-wise sensitivity estimates and reduces the precision with which performance for archaeological material can be estimated.
More generally, the relatively small cohort, class imbalance, and predictor dimensionality create a risk of model instability and overfitting that cannot be eliminated by internal cross-validation or bootstrap resampling alone. Although the effective dimensionality of the multivariate models was deliberately constrained through predefined low-dimensional feature sets for micro-CT, HSI, and Raman spectroscopy and through training-fold PCA for NIR-ONE, these procedures primarily reduce rather than eliminate the risk of optimistic performance estimation. The primary HSI model contained four sample-level optical indices, the primary micro-CT and Raman models contained six predefined parameters each, and the 201-variable NIR-ONE spectra were reduced to 10 principal components before classification. Nevertheless, the number of independent physical samples remained limited relative to the complexity and heterogeneity of the analytical data, particularly for the smallest PMI classes. Consequently, the reported cross-validated classification metrics and parameter-wise AUC estimates may remain optimistic until replicated in larger independent cohorts. Internal resampling should therefore be regarded as an assessment of model stability within the present dataset rather than as evidence of external generalisability.
In addition, although the exploratory direct C4-versus-C5 analysis provided important information on this specific boundary, it was based on very small class sizes, particularly for C5, and the evaluated parameters were selected following the preceding pooled C5-versus-C1–C4 analysis. The corresponding AUC estimates may therefore be optimistic and should be interpreted as hypothesis-generating rather than as independently validated performance estimates. The complete separation observed for micro-CT Mean2 in the available samples is particularly susceptible to instability in a small dataset and should not be interpreted as evidence of perfect diagnostic performance in independent material. Third, the modalities differed in acquisition structure, preprocessing, dimensionality, and feature availability. Although harmonisation was performed at the physical-sample level, the individual modalities were not acquired prospectively under one uniform protocol. Differences in acquisition date, sample preparation, device characteristics, preprocessing and missingness may therefore have influenced apparent cross-method performance. Furthermore, modality-specific analyses were based on partly different analysis-ready subsets. Consequently, differences in apparent performance between modalities may partly reflect differences in sample availability and subset composition. The cross-method results should therefore be interpreted as task-specific comparative evidence rather than as a definitive matched-sample ranking of analytical technologies. A further limitation concerns incomplete donor-level baseline metadata. Because the present study retrospectively harmonised several modality-specific legacy datasets, donor age, sex, detailed skeletal disease or pathology, and a harmonised numerical observation-angle variable were not consistently available for all 107 unique physical samples. These variables were therefore neither imputed nor inferred, and their potential influence on the observed structural, molecular, or optical differences could not be assessed systematically. Anatomical sampling was more consistent, as the harmonised cohort comprised femoral diaphyseal cortical bone samples prepared as transverse sections, and HSI acquisition was performed under standardised conditions at a fixed camera-to-sample distance of 50 cm. Nevertheless, residual confounding by donor demographic characteristics, skeletal pathology, or acquisition geometry cannot be excluded. Future prospective studies should therefore collect these covariates systematically and evaluate their potential effects on PMI-associated analytical signatures. Environmental and taphonomic metadata were also not available in sufficient detail to model their influence systematically. Burial conditions, temperature, humidity, soil composition, microbial exposure, storage conditions and post-recovery handling may produce spectral or structural changes that overlap with PMI-associated effects [
3,
5]. Furthermore, PMI class and sample context were not fully separable at the oldest end of the dataset, because class-5 material originated from archaeological contexts. Consequently, differences attributed to the C5 interval may reflect a combination of chronological age, burial history, preservation conditions, environmental exposure, and other taphonomic factors. The present analytical signatures should therefore be interpreted as archaeological-compatible patterns rather than as age-specific biomarkers or proof of archaeological provenance. The classification scheme also contains a substantial temporal gap between C4 (>1–10 years) and C5 (>100 years). Therefore, the present results do not establish how the identified structural or spectral patterns behave in remains with PMIs between approximately 10 and 100 years, and the C4-versus-C5 analysis should not be interpreted as defining a continuous temporal threshold between forensic and archaeological material.
An additional analytical limitation is that quantitative Raman analysis was not possible in class 5 because of excessive fluorescence, preventing direct cross-modality comparison across the full PMI range. Sixth, wavelength-specific NIR features and exploratory Raman ratios were identified within the present dataset and require independent replication. Seventh, the operating points requiring approximately 95% specificity were internally derived and were not prespecified or externally calibrated. Eighth, discrimination between class 1 and class 2 remained moderate and should not be interpreted as a reliable binary forensic test. Ninth, model calibration, inter-device reproducibility, inter-operator reproducibility and prospective out-of-distribution performance were not evaluated.
Future studies should use prospective multicentre cohorts, balanced PMI distributions, harmonised acquisition protocols, donor- or case-wise validation, prespecified parameters and thresholds, structured taphonomic metadata, representation of intermediate late-PMI intervals, and independent external test sets. In particular, the exploratory C4-versus-C5 findings should be replicated in larger cohorts before the proposed modality-specific decision pathway is translated into forensic casework. The framework should therefore be regarded as an internally evaluated exploratory decision-support proposal rather than a forensic guideline or legal classification standard.
In summary, the present study advances previous modality-specific work by demonstrating that diagnostic performance depends on the forensic question being addressed. Micro-CT Mean2 and high-wavelength NIR-ONE reflectance were particularly informative for archaeological class-5 discrimination and retained excellent performance in the exploratory direct C4-versus-C5 analysis. HSI-derived StO2 and TWI indices were strongest for early-versus-later PMI assessment, whereas HSI TWI was less informative for specifically resolving the C4–C5 boundary. Raman-derived molecular parameters provided complementary information within classes 1–4. Class 1 versus class 2 remained difficult, and corrected global five-class fusion did not consistently outperform the strongest single-modality approach. The resulting framework therefore recommends task-specific modality selection, explicit uncertainty reporting, and selective analytical escalation rather than universal application of all methods.




 ,
,