1. Introduction
A p53 signature represents a continuous region of morphologically bland fallopian-tube epithelium containing at least 12 consecutive secretory-cell nuclei with strong p53 immunoreactivity [
1]. It should not be confused with serous tubal intraepithelial carcinoma (STIC): the defining p53 staining can be present without the cytological atypia and high proliferative activity required for STIC. This distinction matters because an image-level model that estimates the extent of an already identified p53 signature is neither a cancer detector nor a patient-risk model.
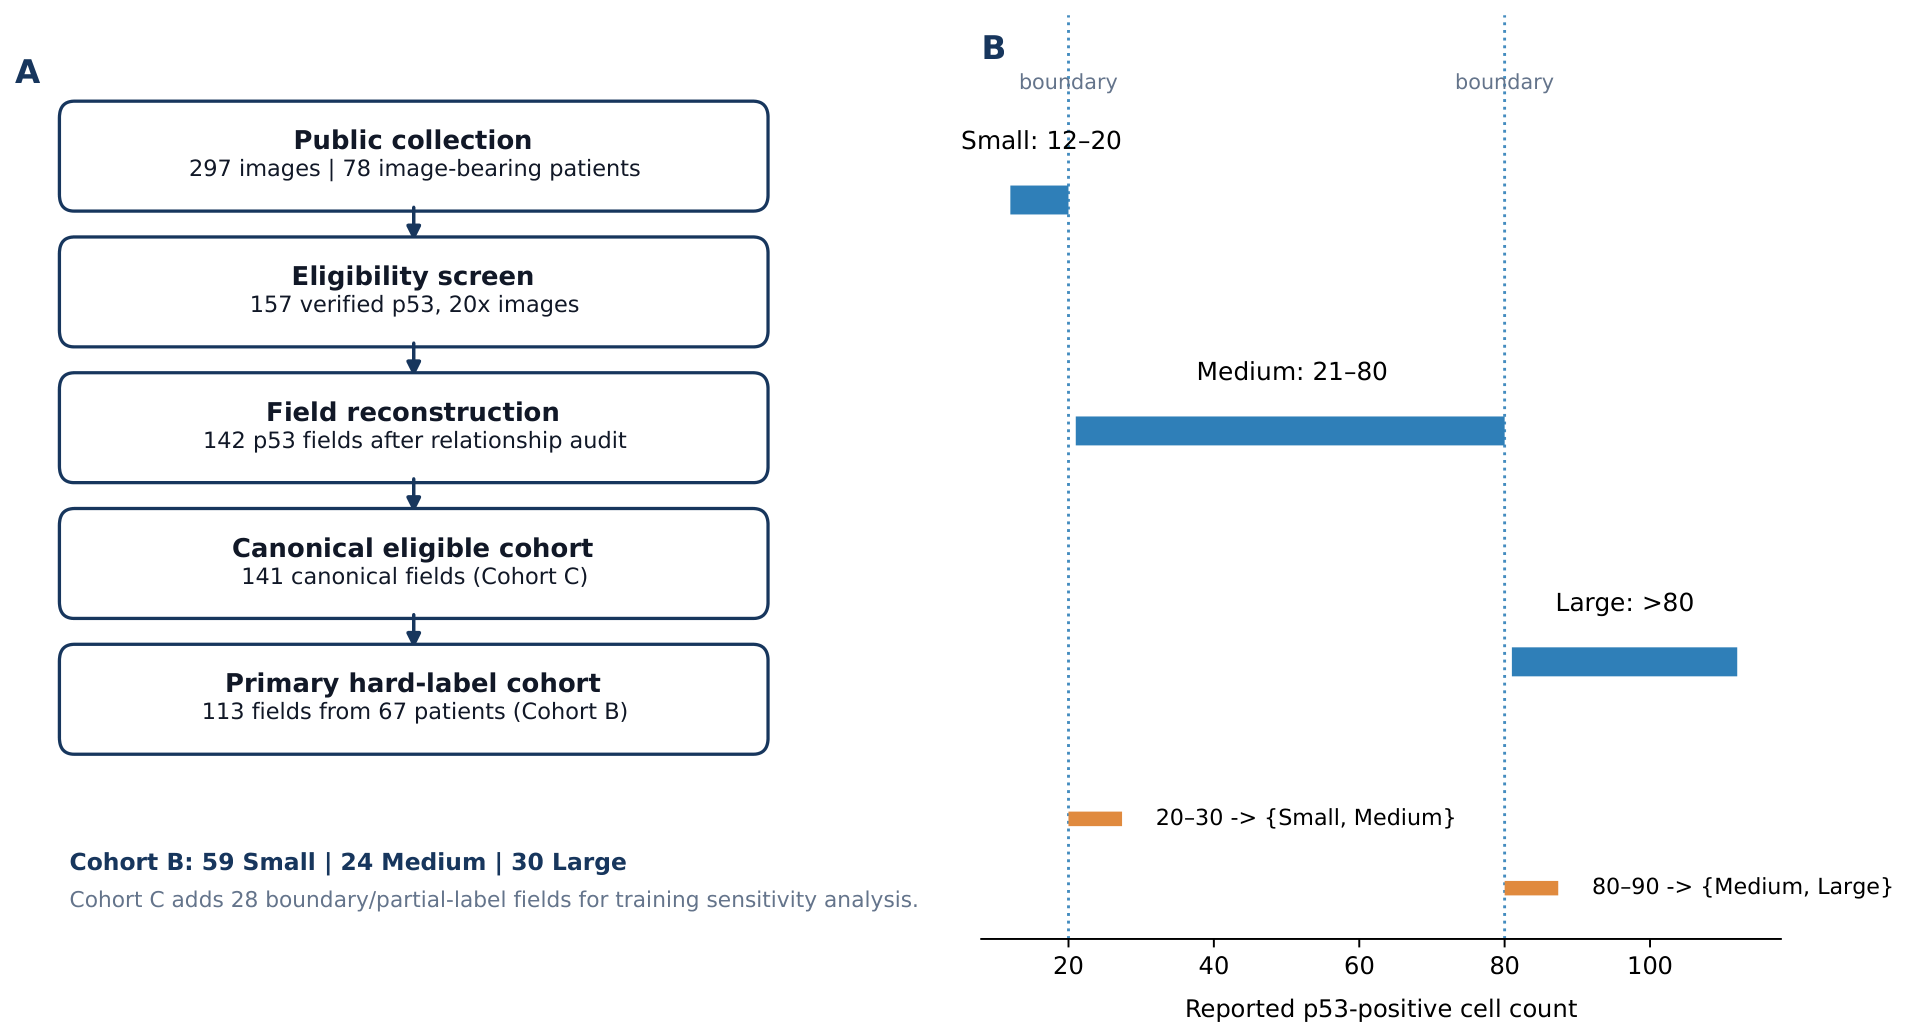
The physical extent of a p53 signature is nevertheless a meaningful research phenotype. In the 250-subject retrospective cohort that formed the basis of the public image collection, Gibbard et al. categorized p53 lesions as Small (12–20 cells), Medium (21–80 cells), and Large (>80 cells) and related lesion-size distribution to oral-contraceptive exposure [
2]. The present outcome is a computational fit to these dataset-derived ordinal categories; it is not an independently validated measurement of lesion size.
This setting creates methodological problems that can be easy to miss in a conventional image-classification pipeline. Several images may depict the same field at different focal planes; filename annotations may give an interval rather than an exact count; one patient can contribute multiple lesions; and the classes are ordered. If related views cross partitions, performance can be inflated. If a boundary-spanning interval such as 20–30 is forced into a single class, the reference standard becomes artificially certain. Finally, a Small-to-Large error is more consequential for an ordinal endpoint than a Small-to-Medium error, although nominal cross-entropy treats both as simply wrong.
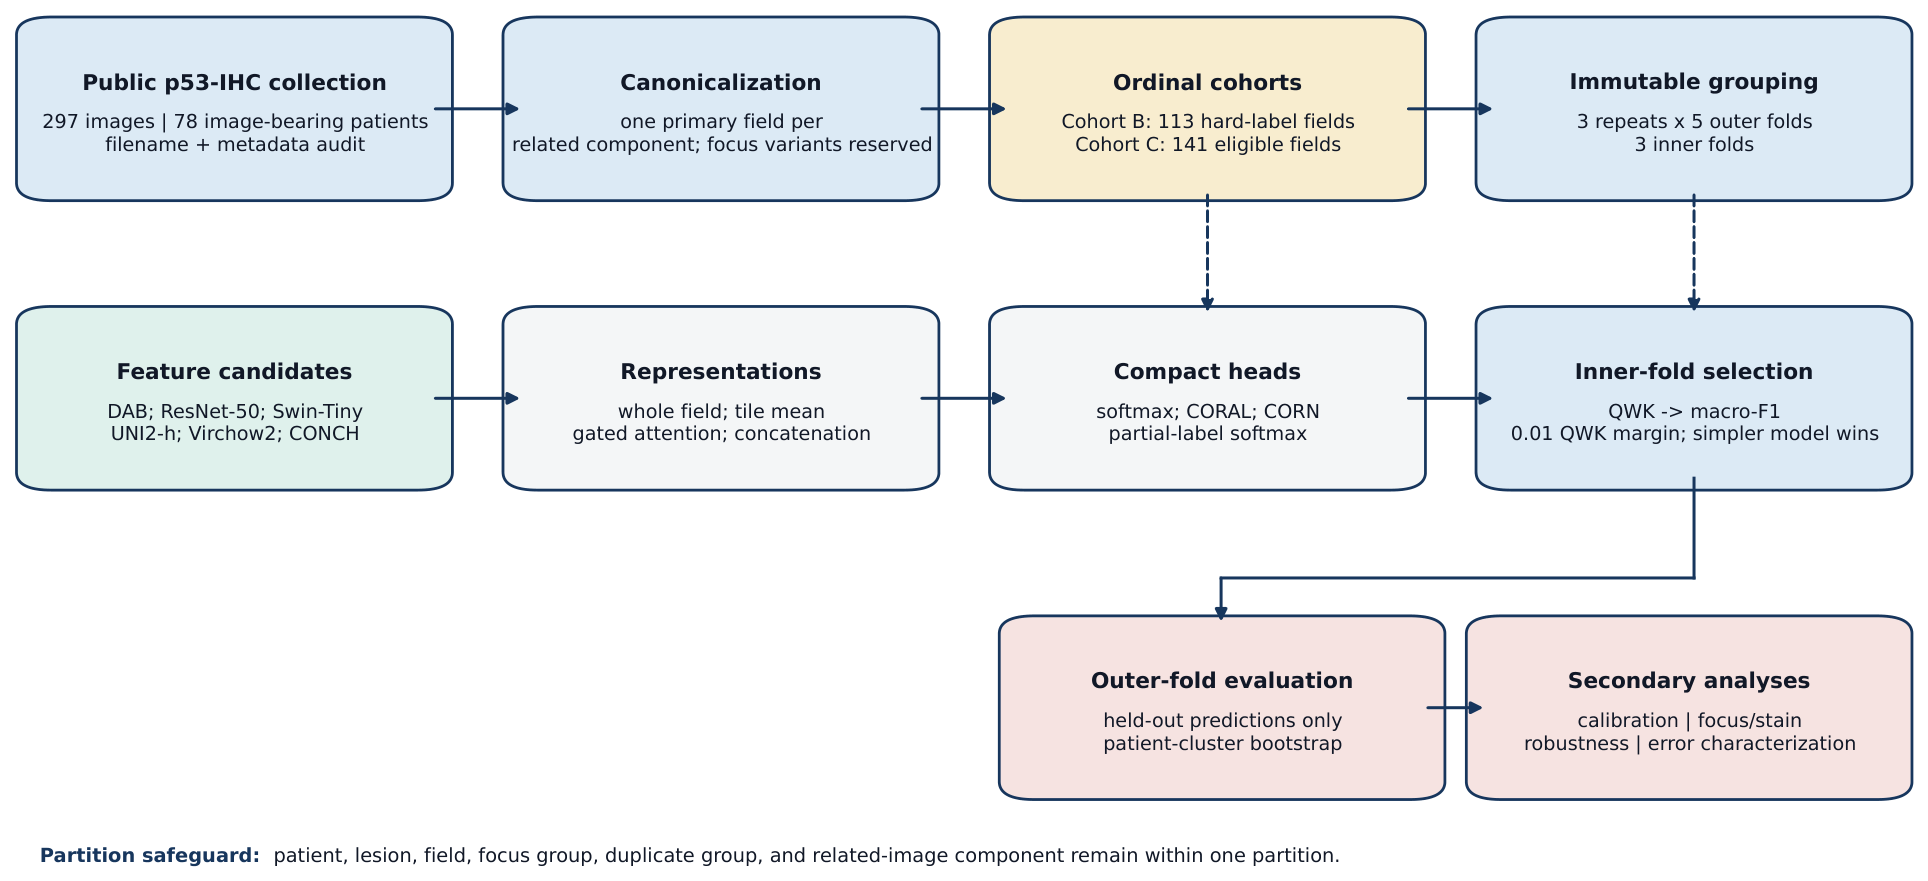
The present study addresses these issues through a focused computational design: deterministic cohort reconstruction, patient- and relationship-aware nested validation, standardized fixed-feature comparison across ImageNet and pathology foundation encoders, ordinal learning, patient-cluster uncertainty, calibration, and acquisition-oriented robustness testing. The objective was to assess how reliably a compact fixed-feature framework could recover the ordered size phenotype in this p53-IHC collection and to describe the conditions under which performance changed.
The biological basis of this task is more focused than the broader literature on tubo-ovarian precursor detection. Folkins et al. operationalized p53 signatures as at least 12 consecutive strongly stained secretory nuclei [
1]; Gibbard et al. later used the three ordered size bands adopted in this study [
2]. Earlier digital IHC work showed that color deconvolution and cell segmentation can quantify stain burden and p53-positive structures [
3,
4], making a DAB-based proportional-odds model an appropriate task-specific baseline rather than relying only on generic neural networks.
Bogaerts et al. addressed a clinically different problem: detecting STIC/STIL in H&E whole-slide images. Their study included 323 STIC/STIL cases, 359 controls, and an external test set, and reported internal and external AUROCs of 0.98 and 0.95, respectively [
5]. These results demonstrate the feasibility of AI for fallopian-tube pathology, but they should not be compared numerically with the present three-class p53-IHC size task, which uses preselected fields and interval-derived size labels rather than lesion-presence labels.
Large pretrained encoders have changed the practical trade-off for small datasets in computational pathology. UNI was developed as a general-purpose pathology representation [
6], while CONCH introduced vision-language pretraining on more than one million histology image–caption pairs [
7]. Virchow2 expanded self-supervision with mixed-magnification and was trained on a diverse corpus of histopathological slides [
8]. Independent benchmarks caution against assuming that any single encoder is universally optimal. Campanella et al. compared public self-supervised pathology foundation models across clinical tasks [
9], and Neidlinger et al. evaluated 19 models on 31 tasks from 13 cohorts, finding that relative performance varied with task and that advantages could narrow in low-data settings [
10].
The stain domain is also relevant. Most widely used pathology foundation models were developed primarily from H&E-rich corpora, whereas p53 IHC encodes phenotype through both tissue morphology and chromogenic staining. StainNet, reported in 2026, was explicitly pretrained on more than 1.4 million patches from 20,231 IHC and special-stain whole-slide images, underscoring the emerging need for non-H&E-specific representation learning [
11]. Recent ovarian-pathology studies likewise show that foundation-model rankings depend on endpoint and cohort [
12,
13]. These observations motivated a standardized fixed-feature comparison rather than selecting a foundation model a priori.
The size labels form an ordered response,
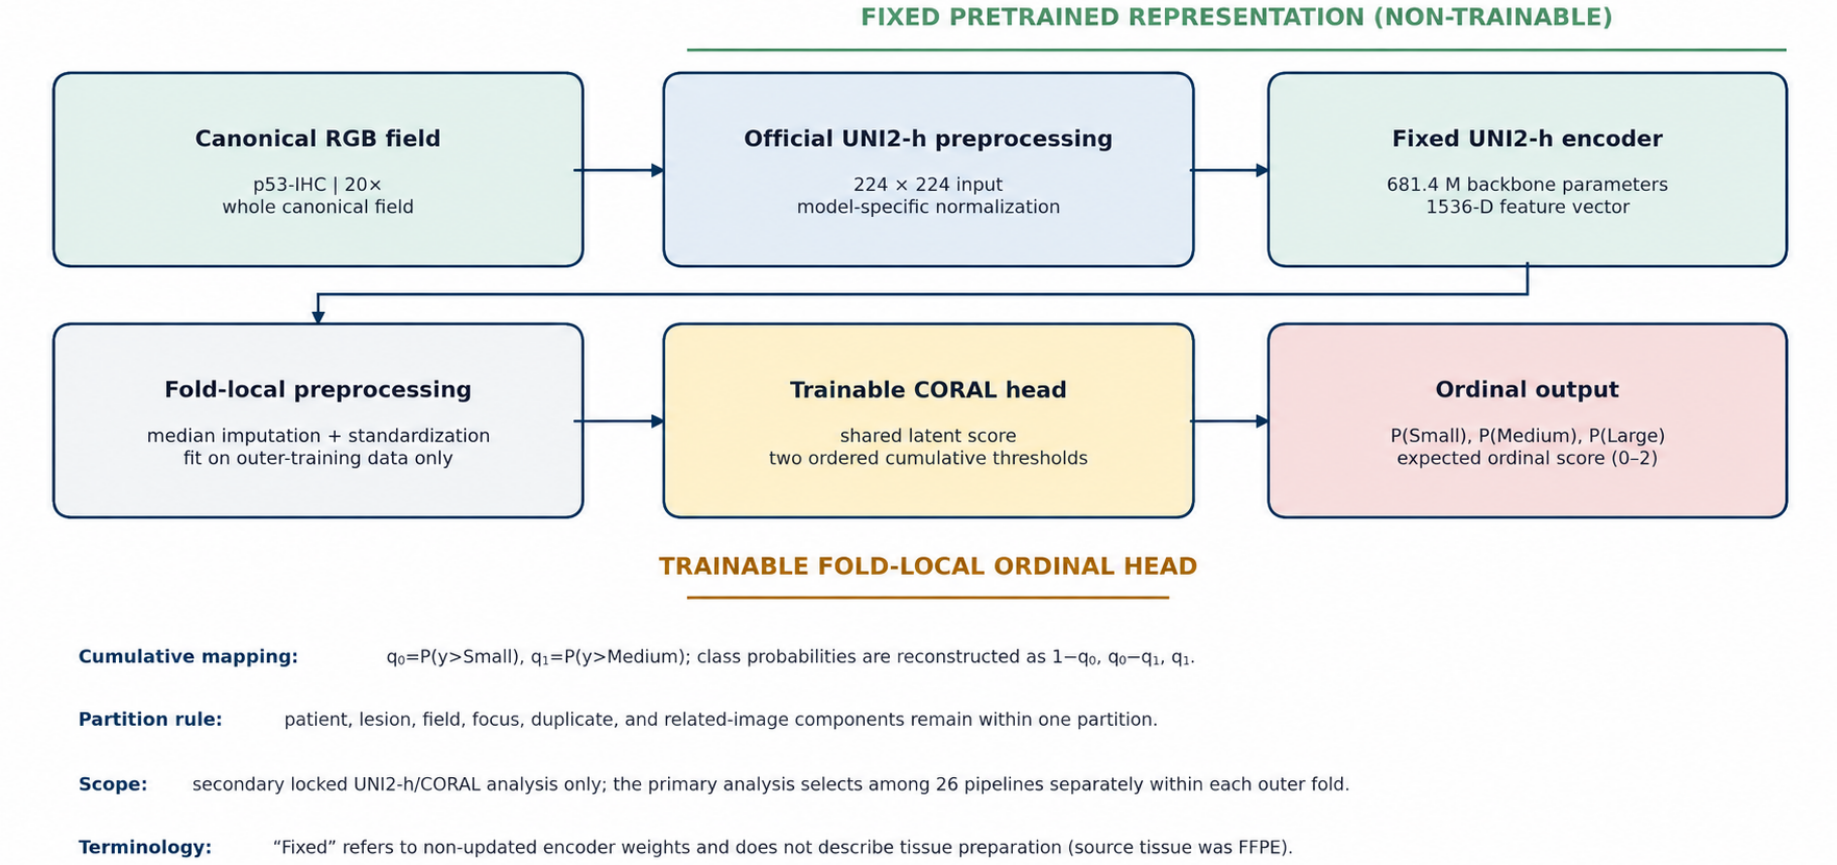
. CORAL models the outcome through rank-consistent cumulative thresholds [
14], and CORN estimates ordinal probabilities through conditional tasks [
15]. The literature supports pathology-pretrained transfer and ordinal modeling as relevant components, but it does not establish their behavior for these interval-derived p53-IHC categories and related focus variants. This task-specific gap motivated the present benchmark. A focused comparison with prior studies is provided in
Table 1; the validation design is described in
Section 2.
3. Results
All primary values come from the fold-wise pipeline selected using inner validation in each outer fold. Confidence intervals are patient-cluster intervals conditional on the recorded selections and held-out predictions unless stated otherwise.
3.1. Evaluation Metrics
QWK was the primary metric because it penalizes more distant ordinal disagreements more strongly. For
classes, quadratic weights were
where
O and
E are observed and chance-expected confusion matrices [
23]. We also reported macro precision, macro-F1, balanced accuracy (macro sensitivity), macro specificity, macro-AUROC, macro-AUPRC, mean absolute ordinal error
and severe-error rate
. Calibration used ECE, multiclass Brier score, and negative log-likelihood. Unless explicitly stated otherwise, repeated-validation performance estimates were calculated by computing each metric separately on the 113 held-out fields in each repeat and then averaging the three repeat-level values. Patient-cluster bootstrap intervals used the same repeat-averaged estimand. The pooled confusion-matrix display described later in the Results is intentionally different: it pools all 339 held-out predictions (113 fields × 3 repeats) to show integer confusion counts and row-normalized proportions. Therefore, nonlinear metrics such as precision and F1 recomputed directly from that pooled matrix need not equal the repeat-averaged per-class values reported later. Sensitivities coincide here because every repeat contains the same class supports.
3.2. Primary Fold-Wise Nested Selection
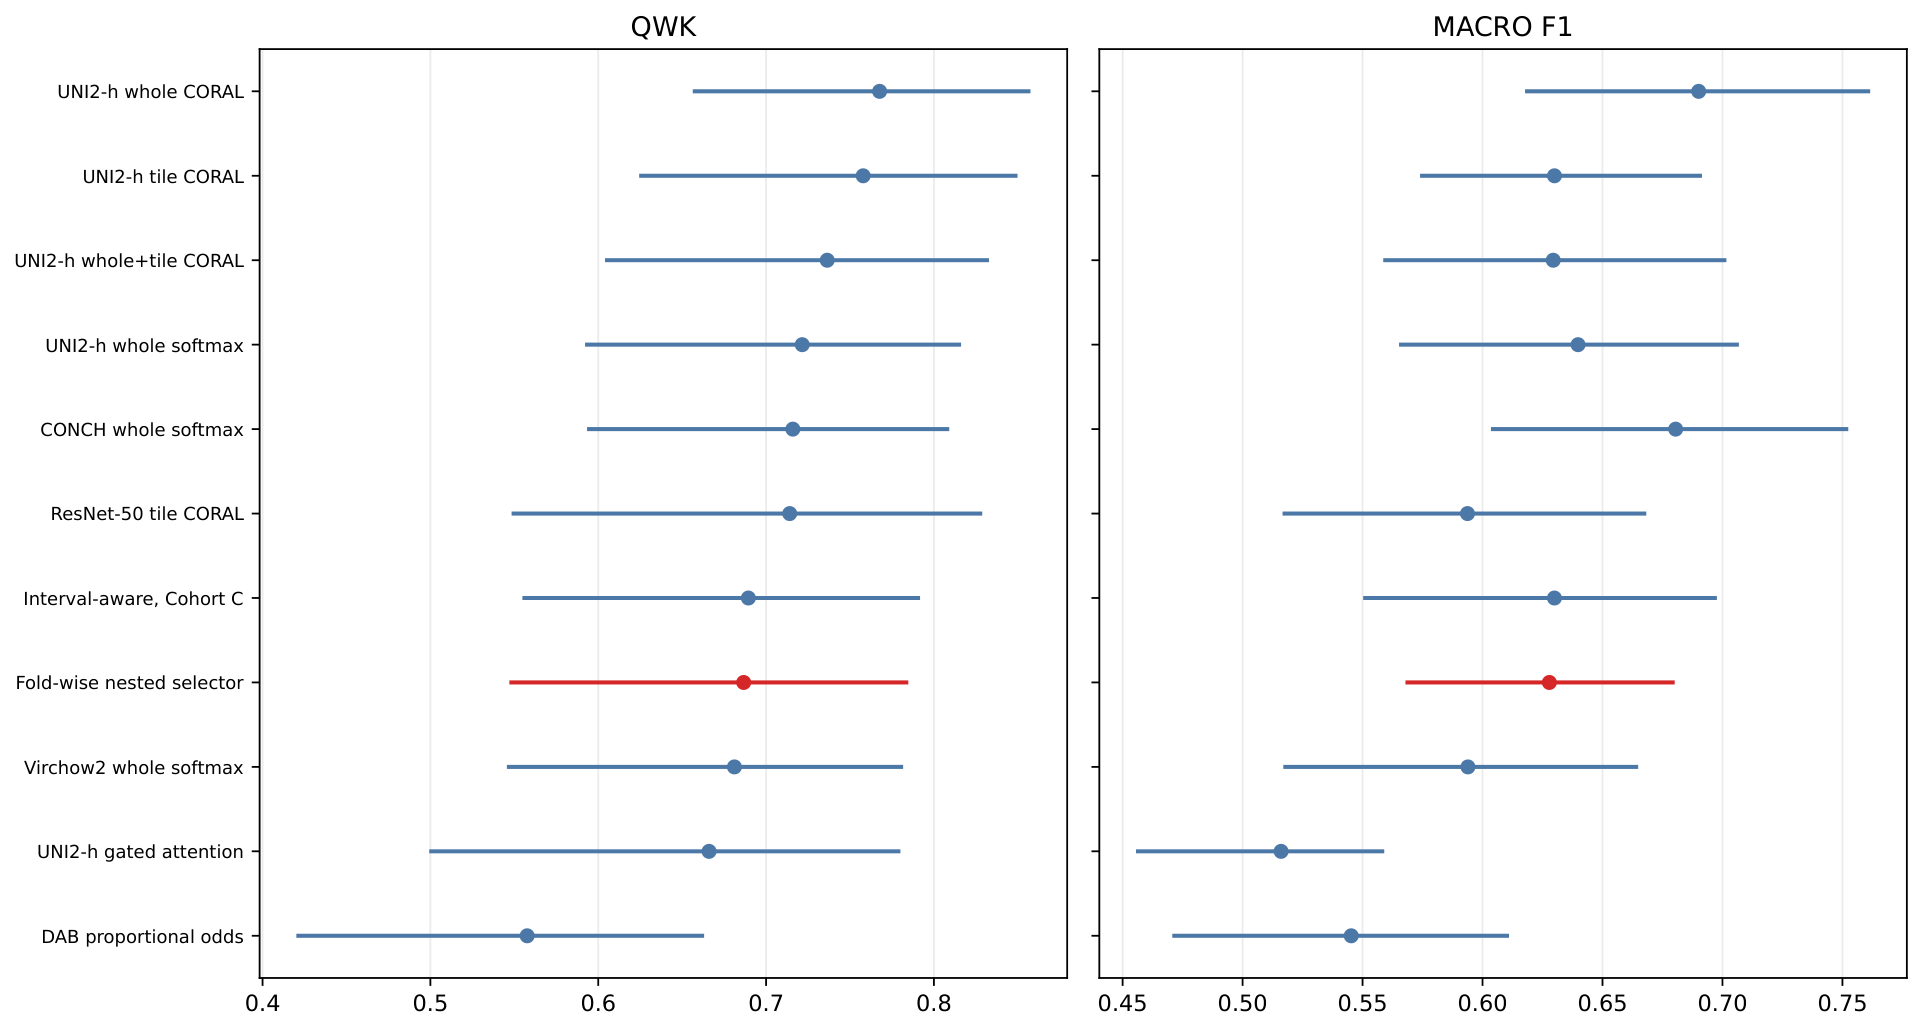
The fold-wise nested selector yielded repeat-averaged QWK 0.687 (95% CI 0.547–0.785) and macro-F1 0.628 (0.568–0.680), with balanced accuracy 0.637 (0.581–0.693), macro-AUROC 0.805 (0.750–0.855), macro-AUPRC 0.681 (0.633–0.754), MAOE 0.348 (0.264–0.439) classes, and a 6.5% (2.9–10.6%) severe Small–Large error rate (
Table 4). The selected pipeline differed across folds: Virchow2 gated attention was chosen in 6/15 folds, UNI2-h whole-field CORAL in 2/15, and seven other pipelines in one fold each.
Supplementary Table S5 reports all 15 choices and inner scores. Thus, the previously highlighted fixed UNI2-h/CORAL estimate (QWK 0.768, 0.656–0.858) is retained only as a configuration-specific secondary benchmark, not as the primary post-selection estimate.
Table 4.
Primary performance of the fold-wise nested selector. Each metric was computed separately on the 113 held-out fields in each of the three repeats and then averaged across repeats; 95% patient-cluster bootstrap intervals target the same repeat-averaged estimand using 2000 valid replicates.
Table 4.
Primary performance of the fold-wise nested selector. Each metric was computed separately on the 113 held-out fields in each of the three repeats and then averaged across repeats; 95% patient-cluster bootstrap intervals target the same repeat-averaged estimand using 2000 valid replicates.
| Analysis | QWK | Macro-F1 | Balanced Accuracy | Macro-AUROC | Macro-AUPRC |
|---|
| Fold-wise nested selector | 0.687 | 0.628 | 0.637 | 0.805 | 0.681 |
| 95% CI | 0.547–0.785 | 0.568–0.680 | 0.581–0.693 | 0.750–0.855 | 0.633–0.754 |
Table 5.
Focused ordinal and representation analysis using UNI2-h features. QWK and macro-F1 were computed separately within each repeat and averaged across the three repeats. These are fixed-configuration secondary analyses and are not pooled confusion-matrix estimates.
Table 5.
Focused ordinal and representation analysis using UNI2-h features. QWK and macro-F1 were computed separately within each repeat and averaged across the three repeats. These are fixed-configuration secondary analyses and are not pooled confusion-matrix estimates.
| Configuration | QWK | Macro-F1 |
|---|
| Whole softmax | 0.722 | 0.640 |
| Whole CORAL | 0.768 | 0.690 |
| Whole CORN | 0.740 | 0.670 |
| Interval-aware, Cohort C | 0.689 | 0.630 |
| Tile mean CORAL | 0.758 | 0.630 |
| Gated attention | 0.666 | 0.516 |
| Whole + tile CORAL | 0.736 | 0.629 |
Figure 4.
Held-out QWK and macro-F1 for the primary fold-wise nested selector and configuration-specific secondary benchmarks. Error bars show 95% patient-cluster bootstrap confidence intervals. Fixed-pipeline values must not be interpreted as the performance of a pipeline selected after reviewing this figure.
Figure 4.
Held-out QWK and macro-F1 for the primary fold-wise nested selector and configuration-specific secondary benchmarks. Error bars show 95% patient-cluster bootstrap confidence intervals. Fixed-pipeline values must not be interpreted as the performance of a pipeline selected after reviewing this figure.
Fold-level QWK ranged from 0.386 to 0.918, macro-F1 from 0.426 to 0.796, and balanced accuracy from 0.472 to 0.800. Across repeats, QWK was 0.661, 0.625, and 0.774; corresponding macro-F1 values were 0.610, 0.567, and 0.706. These results show appreciable split sensitivity. Giving each patient equal total weight produced QWK 0.700, macro-F1 0.664, balanced accuracy 0.673, macro-AUROC 0.829, and macro-AUPRC 0.711
(Supplementary Tables S6 and S7).
3.3. Ordinal Objective and Representation Analysis
Among fixed secondary configurations, CORAL improved the UNI2-h whole-field point estimate compared with nominal softmax (QWK 0.768 vs. 0.722; macro-F1 0.690 vs. 0.640), but the paired QWK difference of +0.046 had a 95% CI of to 0.114 and did not survive Holm correction. CORN remained intermediate (QWK 0.740; macro-F1 0.670). In Cohort C, the partial-label objective yielded QWK 0.689, with a paired QWK difference versus hard-label CORAL of (95% CI to ; adjusted ). Under this protocol, retaining boundary-ambiguous fields through the partial-label objective did not improve on the high-certainty hard-label reference.
Increased representation complexity did not yield a consistent benefit among the fixed UNI2-h analyses. UNI2-h tile-mean CORAL reached QWK 0.758, whole-plus-tile fusion reached 0.736, and gated attention reached 0.666. Gated attention was lower than tile mean by
QWK (95% CI
to
; adjusted
at bootstrap resolution). Whole-plus-tile fusion showed no clear improvement over tile mean. These configuration-specific ordinal and representation ablations are summarized in
Table 5.
3.4. Class-Wise Behavior and Ordinal Error
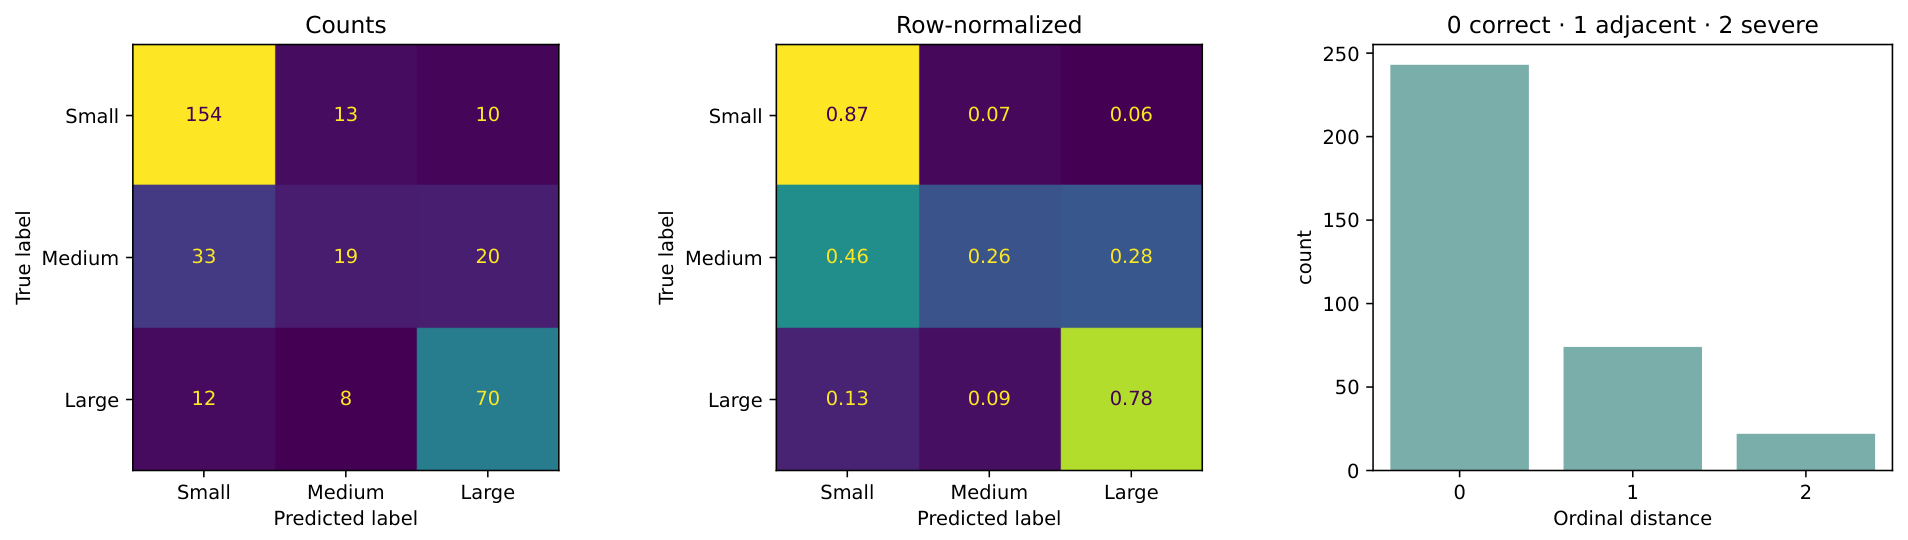
Sensitivity was highest at the two ordinal extremes and lowest for the intermediate category (
Table 6 and
Figure 5). Small sensitivity was 0.870 (95% CI 0.801–0.928) and Large sensitivity was 0.778 (0.617–0.906), whereas Medium sensitivity was 0.264 (0.159–0.386). When the three repeats were pooled solely for the confusion-matrix display, the 339 selected held-out predictions contained 243 correct predictions, 74 adjacent-category errors, and 22 severe Small–Large errors. This pattern is consistent with an intermediate class that has fewer primary fields and is bounded on both sides by approximate count intervals.
3.5. Calibration, Focus Consistency, and Stain Perturbation
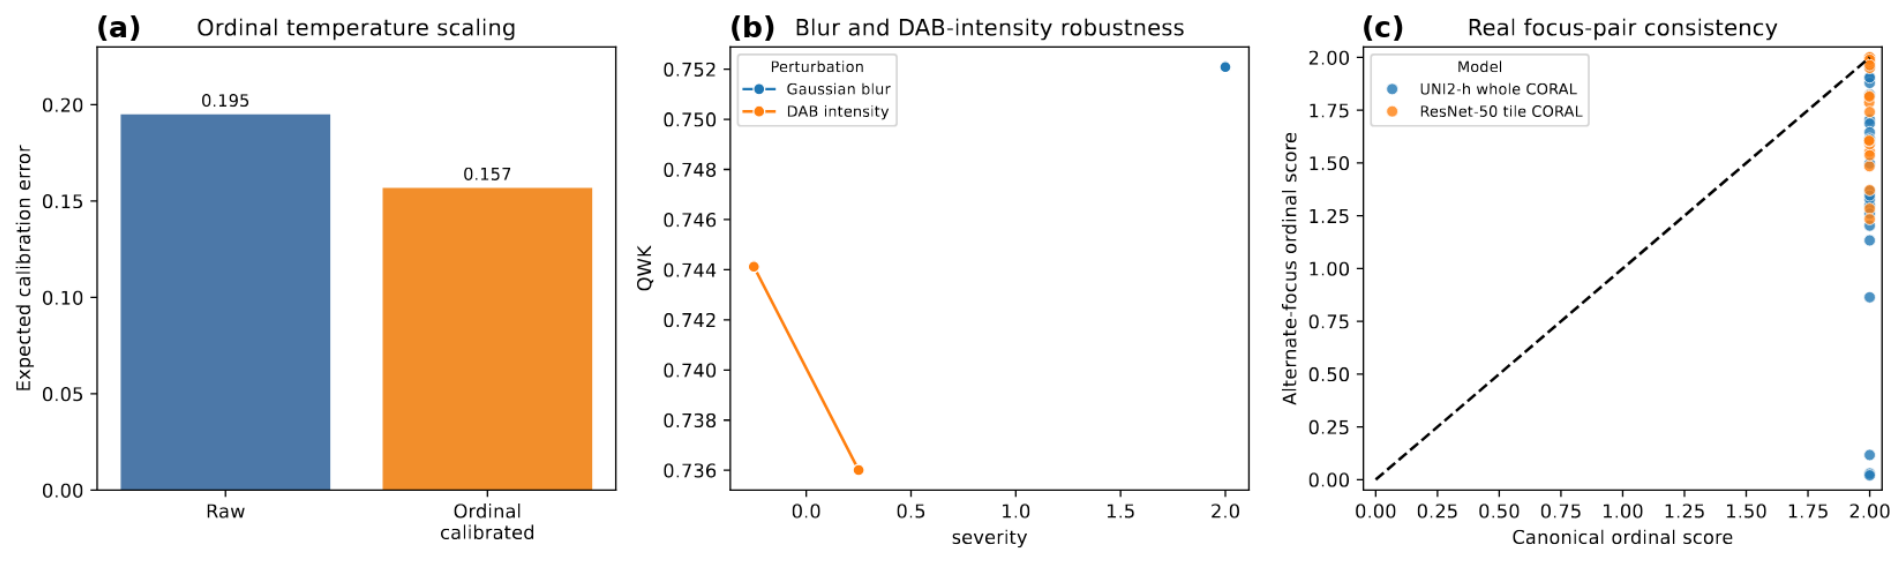
For the secondary locked UNI2-h/CORAL configuration, valid ordinal temperature scaling improved all three calibration summaries: ECE decreased from 0.195 to 0.157, Brier score from 0.391 to 0.385, and NLL from 1.291 to 0.778 (
Table 7 and
Figure 6). Calibration was not assessed for the primary fold-wise selector; the reported calibration results therefore apply only to this locked secondary configuration. Controlled blur caused only a modest QWK reduction, from approximately 0.766 to 0.752, while DAB
and
yielded 0.744 and 0.736. More extensive channel manipulations produced larger reductions: grayscale 0.713, DAB removed 0.611, hematoxylin-only 0.593, and DAB-only 0.435. Tissue-mask-only and background-only controls decreased to 0.029 and 0.042, respectively. This configuration-specific pattern is more consistent with reliance on combined morphology and chromogenic information than on a trivial mask/background shortcut.
Real focus variation changed predictions more than synthetic blur. Across 39 related focus pairs from only four patients, UNI2-h whole CORAL had 71.8% exact class agreement (95% patient-cluster CI 47.1–100.0%), a mean ordinal-score difference of 0.390 (0.047–0.693), and a mean Jensen–Shannon divergence of 0.160 (0.018–0.278). The ResNet-50 tile CORAL comparator showed 92.3% exact agreement (88.2–100.0%). The wide intervals preclude a general stability claim and identify prospective focus replication as a priority.
3.6. Qualitative Image Context and Interpretability Controls
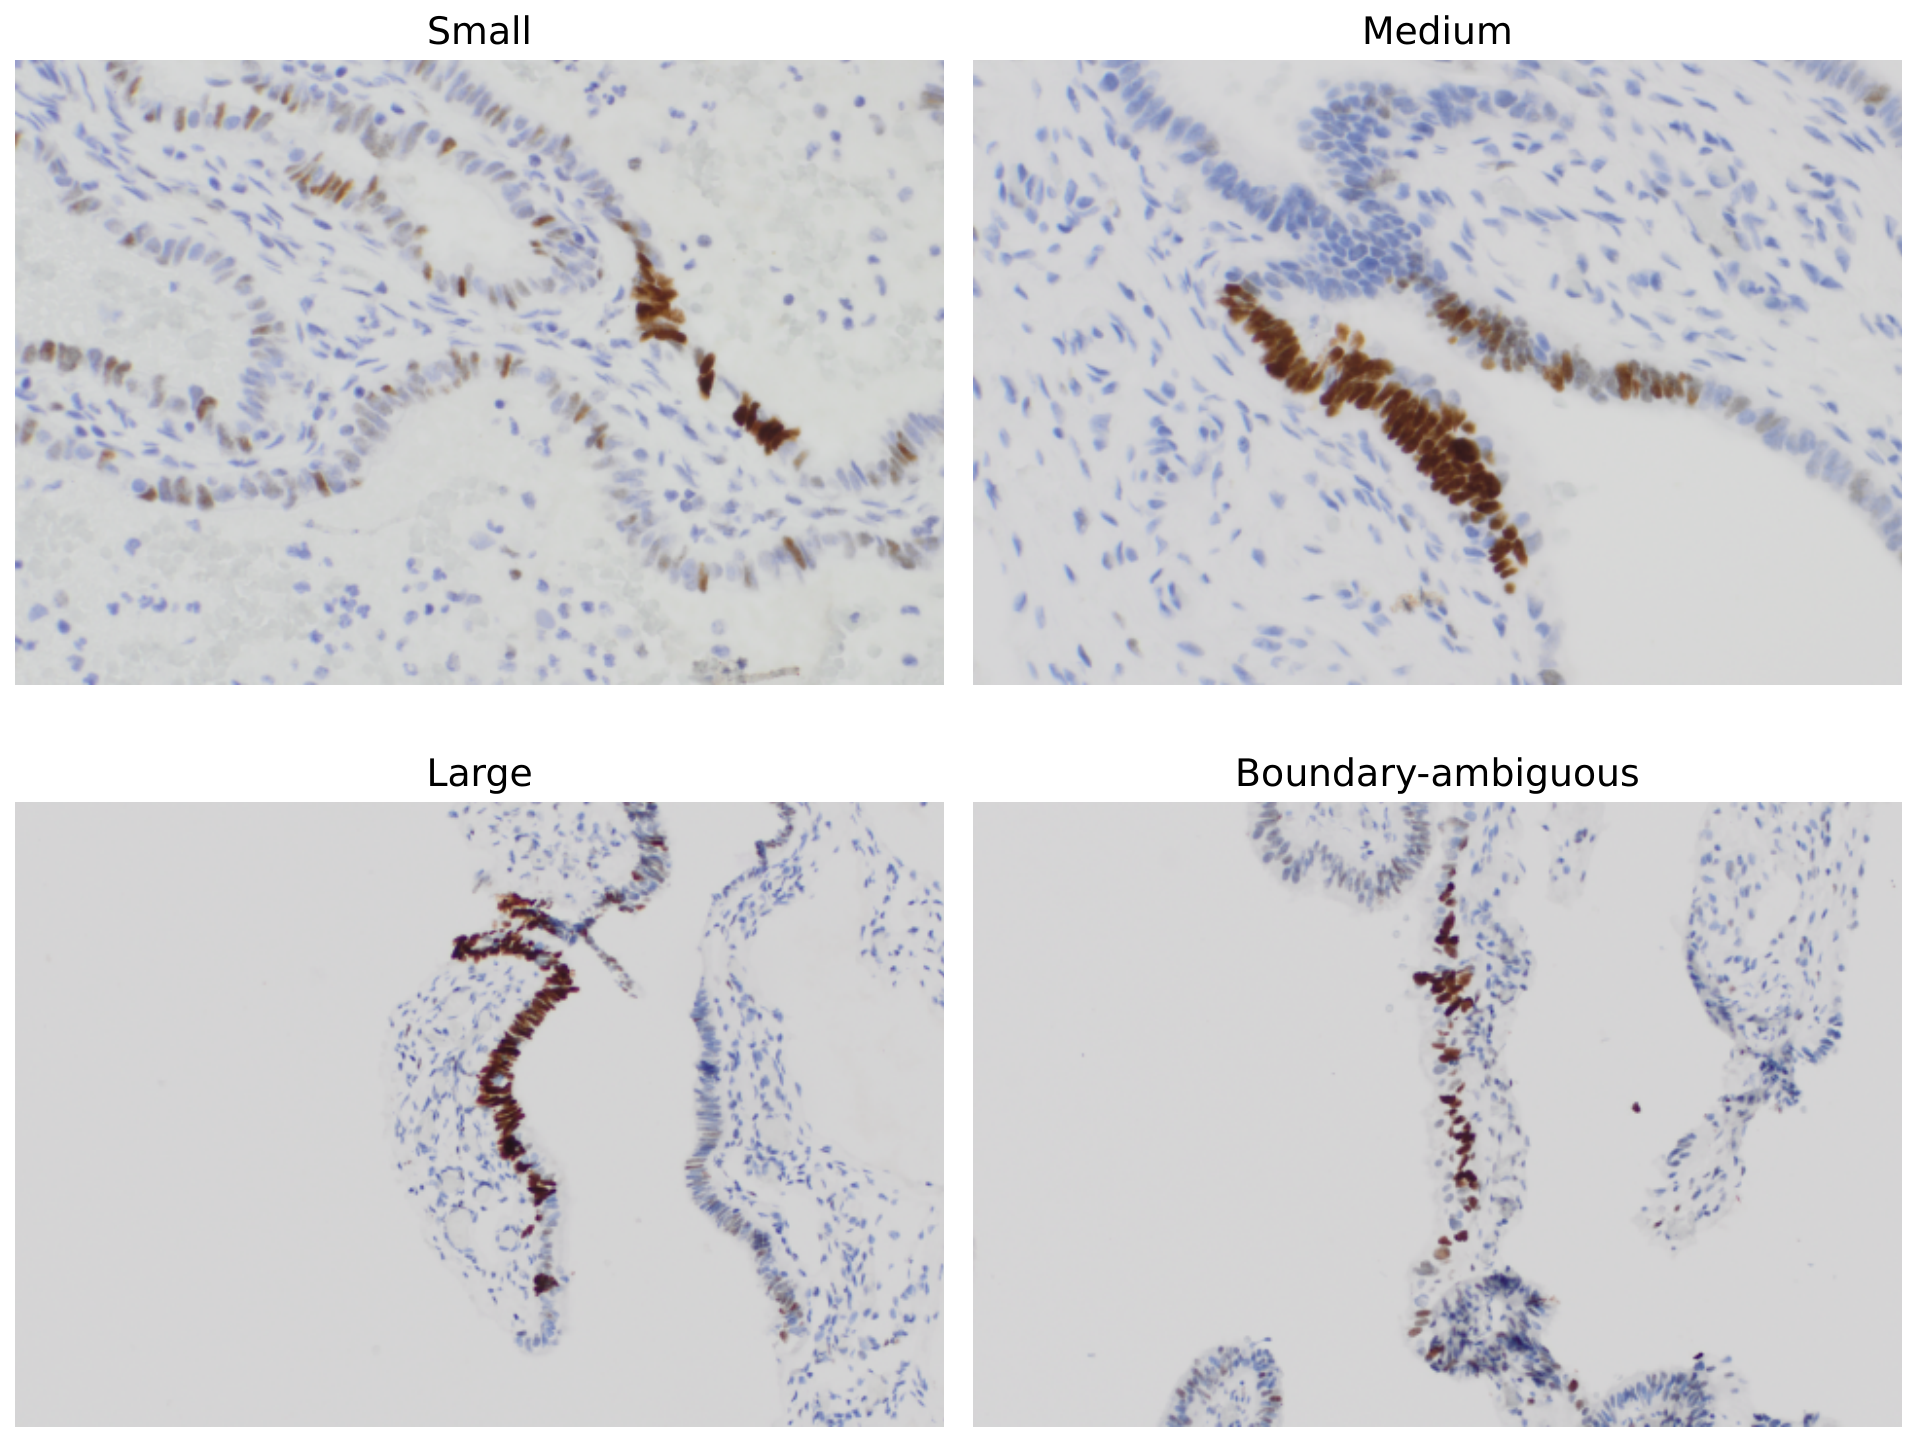
Representative fields are shown in
Figure 7. Interpretability was treated as a secondary sensitivity analysis and was not used to infer pathological reasoning. In the gated-attention analysis, attention had low overlap with the automated DAB proxy (mean attention mass in the proxy 0.0266; pointing-game hit rate 0), while removing DAB altered probabilities (mean
change 0.313) and ordinal scores (mean absolute change 0.279). Because these maps cannot explain a heterogeneous fold-wise selector and the DAB mask is not a pathologist ROI, the findings are reported only as exploratory error characterization
(Supplementary Figure S3).
3.7. Reproducibility and Experiment Traceability
The archived focused experiment package included 32 complete main prediction files with 339 rows each, 450 per-fold checkpoints, 480 structured run/selection records, and content-addressed feature caches. Before Revision 1, that source tree recorded 41/41 automated tests passed and 33/33 focused-protocol completion items. Revision 1 added machine-readable analysis outputs requiring 26 complete candidate pipelines, 15 outer-fold selection records, 339 unique held-out predictions, and zero patient/field/lesion/focus/duplicate/related-component crossings; all requirements were satisfied. The supplied supplement includes the analysis outputs, full outer-fold patient/component manifest, Cohort-C patient-gate audit, Revision 1 analysis source script, and a standalone package validator for the released tables. The original experiments ran with Python 3.12.13, PyTorch 2.12.0+cu130, torchvision 0.27.0+cu130, timm 1.0.16, scikit-learn 1.7.0, and scikit-image 0.25.2 on an NVIDIA RTX 2060 with 12,288 MiB VRAM. Fixed features were extracted with mixed precision and batches of one or two; model weights were pinned by revision and hash.
4. Discussion
The principal finding is that a selector restricted to inner-validation information provided useful but variable internal discrimination of the three dataset-derived categories. Its repeat-averaged QWK was 0.687 and macro-F1 was 0.628, with fold QWK ranging from 0.386 to 0.918. The difference between the strict fold-wise nested estimate and the previously highlighted fixed UNI2-h/CORAL value of 0.768 illustrates the distinction between a configuration-specific benchmark and a selection-aware primary estimate. The fixed results remain informative as secondary configuration benchmarks, while the fold-wise selector is the appropriate primary internal estimate.
The ordinal formulation is aligned with labels that discretize an underlying count continuum. CORAL’s fixed-configuration point-estimate gain over softmax is compatible with that structure, but the paired interval included zero. The evidence therefore supports ordinal modeling as a reasonable inductive bias without establishing a universal advantage for CORAL or any encoder. The variation in fold-wise selections likewise agrees with broader benchmarking evidence that pathology representation rankings are task- and sample-dependent [
9,
10].
The Medium category was the most challenging operating region. It contained 24 primary fields, sat between two decision boundaries, and yielded sensitivity 0.264 compared with 0.870 for Small and 0.778 for Large. The partial-label experiment tested whether retaining 28 additional ambiguous fields would help a fixed UNI2-h/CORAL configuration, but performance declined. A plausible interpretation is that the additional fields did not offset heterogeneous supervision near the thresholds; exact or consensus counts are needed to test that explanation.
Among fixed UNI2-h configurations, tile mean nearly matched whole-field QWK, while gated attention and whole-plus-tile fusion provided no consistent gain. In this cohort, adding a trainable aggregation mechanism may increase estimation variance without reliable benefit. That is a hypothesis rather than a demonstrated mechanism and does not conflict with gated-attention pipelines being selected in some individual folds.
The locked UNI2-h/CORAL robustness analyses provide narrower, configuration-specific evidence. Mild Gaussian blur and moderate DAB-intensity changes caused small QWK reductions, whereas DAB removal and channel isolation caused larger deterioration. Near-chance performance on background-only and tissue-mask-only controls argues against an obvious field-occupancy shortcut for that configuration. However, its real focus-pair agreement was 71.8%, with a very wide patient-cluster interval because all 39 pairs came from only four patients; synthetic blur did not capture all acquisition variation.
The interpretability analyses provide complementary, non-diagnostic evidence. The gated-attention ablation showed low spatial overlap with an automated DAB proxy, and those maps do not explain the heterogeneous fold-wise selector. Counterfactual DAB removal demonstrated sensitivity to stain information for a fixed model, but it does not establish use of the same morphological criteria as a gynecologic pathologist.
4.1. Strengths
The study reconciled biological patients and all identifiable field, lesion, focus, duplicate, and related-image relationships before splitting. Primary selection was performed separately in every outer fold; the full 15-fold choice table and patient/component manifest are released; uncertainty was clustered at the patient level; equal-patient and fold/repeat sensitivity analyses were added; and each reported estimate is traceable to a held-out prediction. The explicit conversion of cumulative CORAL outputs to valid class probabilities also makes the calibration procedure reproducible.
4.2. Limitations
This is a small, single public collection from one source context, with 113 hard-label fields from 67 patients and no independent test cohort. The categories were reconstructed from approximate filename count intervals rather than new blinded pathologist counts; consequently, the endpoint is dataset-derived classification, not validated lesion measurement. Although the revised selector uses no outer label within a fold, its 26-pipeline library was reconstructed from completed study artifacts, so broader analysis-development choices are not protected by an untouched external set. The patient bootstrap is conditional on recorded model selections and predictions and does not include selection/refitting variability. Calibration was not assessed for the heterogeneous primary fold-wise selector; the calibration analysis was limited to the locked UNI2-h/CORAL secondary configuration. Fold performance was heterogeneous; the Medium class was small, and the 39 focus pairs represented only four patients. Immunohistochemical staining was performed by the source investigators rather than within this computational study; the original laboratory conditions are documented in the source publication and its Supplementary Table S1 [
2]. Most encoders were pretrained predominantly in H&E-rich domains. No new pathologist ROIs, reader study, subgroup fairness analysis, prospective assessment, or clinical-utility evaluation was performed. The task also starts after a p53-positive field has been selected; lesion detection, STIC/STIL diagnosis, screening, and patient-risk prediction are outside scope.
4.3. Future Directions
The next step is an independent laboratory/scanner cohort with prospectively specified rules, exact or consensus counts, enrichment of Medium and threshold-adjacent cases, and repeated focus acquisition across many patients. Pathologist ROI or nucleus-level annotation would permit comparison with human counting variability and biologically grounded localization. Nested refitting should be repeated in that cohort, followed only then by whole-slide lesion-localization and reader-assistance studies.