1. Introduction
Cephalometric analysis underpins orthodontic diagnosis and treatment planning, and the manual tracing of anatomical landmarks on lateral cephalograms is time-consuming and subject to inter- and intra-observer variability [
1,
2]. Automated landmark detection has, therefore, been pursued intensively, and on the canonical ISBI 2015 benchmark, recent methods report mean radial errors approaching expert-level precision [
3,
4].
Landmark localization accuracy directly propagates into every downstream cephalometric measurement: an error of a few millimeters at a single point can shift the angular measurements used for skeletal classification, such as ANB and SNA, by clinically meaningful amounts [
1,
2], altering skeletal classification and, in turn, treatment decisions; AI-driven cephalometric analysis is increasingly applied to such downstream tasks, including longitudinal growth assessment [
5]. This sensitivity is why sub-millimeter and low-millimeter accuracy has become the de facto target for automated systems, and why the field has converged on the mean radial error (MRE) and the success detection rate (SDR) at fixed millimetric thresholds as its primary metrics, the 2 mm threshold having been established by the ISBI 2015 challenge [
3] and used throughout subsequent work [
6]. Reported performance on ISBI 2015, however, is now so high that headline numbers alone reveal little about whether a model would remain reliable outside the conditions under which it was trained.
A structural limitation runs through much of this literature: models are typically trained and evaluated on a single dataset, most often the ISBI 2015 Grand Challenge set (IEEE International Symposium on Biomedical Imaging), which was acquired entirely on one device at a fixed 0.1 mm/pixel resolution. A model that excels on its own test split may degrade substantially on images from other scanners, resolutions, or populations, and this degradation is precisely what determines clinical usability. In practice, these factors co-occur: datasets that differ in acquisition equipment typically also differ in the patient populations they were drawn from, so the shift observed between any two public datasets is a composite one. Recent dataset work argues that single-device training data limit generalizability [
7], and a 2025 scoping review identifies dataset standardization, barriers to clinical integration, and cross-architecture performance variability as core unresolved problems [
6]. In medical imaging more broadly, this degradation under acquisition shift across devices and sites is well documented and termed domain shift [
8,
9].
Crucially, domain shift interacts with model architecture in ways that are not captured by in-domain benchmarks. Different architecture families encode different inductive biases: heatmap-regression convolutional neural networks (CNNs) localize points through dense spatial likelihood maps, coordinate-regression networks predict positions directly, cascaded designs refine coarse estimates in stages, and transformer backbones aggregate global context through self-attention. There is no a priori reason to expect that the inductive bias best suited to fitting a single dataset is also the one most resilient to acquisition shift; indeed, the two objectives may be in tension, since a model flexible enough to reach very low in-domain error can also overfit device-specific texture and intensity characteristics that do not transfer. Whether this tension exists in practice for cephalometric landmarking, and if so, how large it is, has not been quantified.
What is missing is a multi-architecture, multi-dataset, clinically calibrated (millimeter-scale) generalization benchmark. Our central question is whether the architecture that performs best on one dataset also performs best on another, and how architecture families—heatmap CNN, two-stage cascade, coordinate-regression Vision Transformer, and a pretrained ResNet-50 backbone—diverge under cross-dataset conditions. The contribution is not a new state-of-the-art model but a systematic quantification, for cephalometry specifically, of how far single-dataset accuracy overstates cross-domain performance, summarized through an interpretable measure we report as the Generalization Drop (GD), a relative form of the generalization gap between in- and out-of-domain error widely studied in machine learning [
8].
Concretely, we make five contributions. First, we train four representative architecture families under a single fixed protocol on each of two independently sourced datasets and evaluate every trained model on both, yielding a full cross-dataset matrix in which architecture is the only deliberately varied factor. Second, we complement this with a within-dataset leave-one-device-out analysis across seven imaging devices, testing whether the same degradation appears at the finer granularity of scanner-to-scanner shift, and we anchor all errors against human inter-observer variability measured on the same landmarks. Third, we test a simple, deployable mitigation—balanced multi-source training—and quantify how much of the cross-domain loss it recovers for each architecture. Fourth, we isolate the contribution of ImageNet pretraining in a controlled ablation in which a single architecture is trained from pretrained and from random initialization, so that the mechanism behind the observed transfer advantage is tested rather than assumed. Fifth, we resolve the aggregate error into its 19 constituent landmarks for two architectures chosen to bracket the effect, so that the clinical reading of the results is anchored to the specific anatomical points on which diagnosis depends. Together, these quantify the cross-dataset and cross-device generalization gap for cephalometry, show how it behaves, and demonstrate that it can be substantially reduced.
3. Results
3.1. In-Domain Accuracy
Trained and tested within the same dataset (mean over three seeds), the four families reached MRE of 2.47–3.04 mm on Aariz and 4.12–5.55 mm on ISBI (
Table 2, diagonal). On Aariz, the HRNet-style network was the most accurate in-domain (2.47 mm), followed closely by the Vision Transformer (2.67 mm) and the cascade (2.75 mm), with the ImageNet-pretrained ResNet-50 last (3.04 mm); the four families spanned only 0.57 mm in-domain, against a spread of 1.43 mm on the smaller single-device ISBI set.
Table 2.
Cross-dataset mean radial error (mm), mean ± SD over three seeds. Each cell is labeled by training dataset then test dataset (e.g., Aariz→Aariz is trained on Aariz, tested on Aariz); A = Aariz, I = ISBI. Diagonal columns (A→A, I→I) are in-domain and off-diagonal columns (A→ISBI, I→Aariz) are cross-domain. The corresponding Generalization Drops are given in
Table 3, and the same values are shown as a matrix in
Supplementary Figure S1. SDR@2 mm from a single illustrative seed (secondary metric, not part of the multi-seed protocol) was 63.7% (HRNet), 59.8% (cascade), 46.1% (ViT), and 37.6% (ResNet-50) in-domain, falling to 5.8–17.4% cross-domain. Inter-observer reference was 0.53 mm.
Table 2.
Cross-dataset mean radial error (mm), mean ± SD over three seeds. Each cell is labeled by training dataset then test dataset (e.g., Aariz→Aariz is trained on Aariz, tested on Aariz); A = Aariz, I = ISBI. Diagonal columns (A→A, I→I) are in-domain and off-diagonal columns (A→ISBI, I→Aariz) are cross-domain. The corresponding Generalization Drops are given in
Table 3, and the same values are shown as a matrix in
Supplementary Figure S1. SDR@2 mm from a single illustrative seed (secondary metric, not part of the multi-seed protocol) was 63.7% (HRNet), 59.8% (cascade), 46.1% (ViT), and 37.6% (ResNet-50) in-domain, falling to 5.8–17.4% cross-domain. Inter-observer reference was 0.53 mm.
| Architecture | A→A (in) | A→ISBI | I→I (in) | I→Aariz |
|---|
| HRNet | 2.47 ± 0.12 | 11.13 ± 1.54 | 4.12 ± 0.94 | 21.25 ± 1.83 |
| Cascade | 2.75 ± 0.31 | 12.01 ± 1.82 | 4.40 ± 0.48 | 22.15 ± 1.61 |
| ViT | 2.67 ± 0.09 | 8.67 ± 0.73 | 5.11 ± 0.29 | 20.15 ± 0.26 |
| ResNet50 | 3.04 ± 0.12 | 7.73 ± 0.39 | 5.55 ± 0.14 | 23.07 ± 1.30 |
Table 3.
Generalization Drop, GD = (MRE_cross − MRE_in)/MRE_in × 100, corresponding to the errors in
Table 2; mean ± SD over three seeds. GD was computed separately within each seed and then averaged; because the average of a ratio is not the ratio of averages, these values differ from the ratio of the seed-averaged errors in
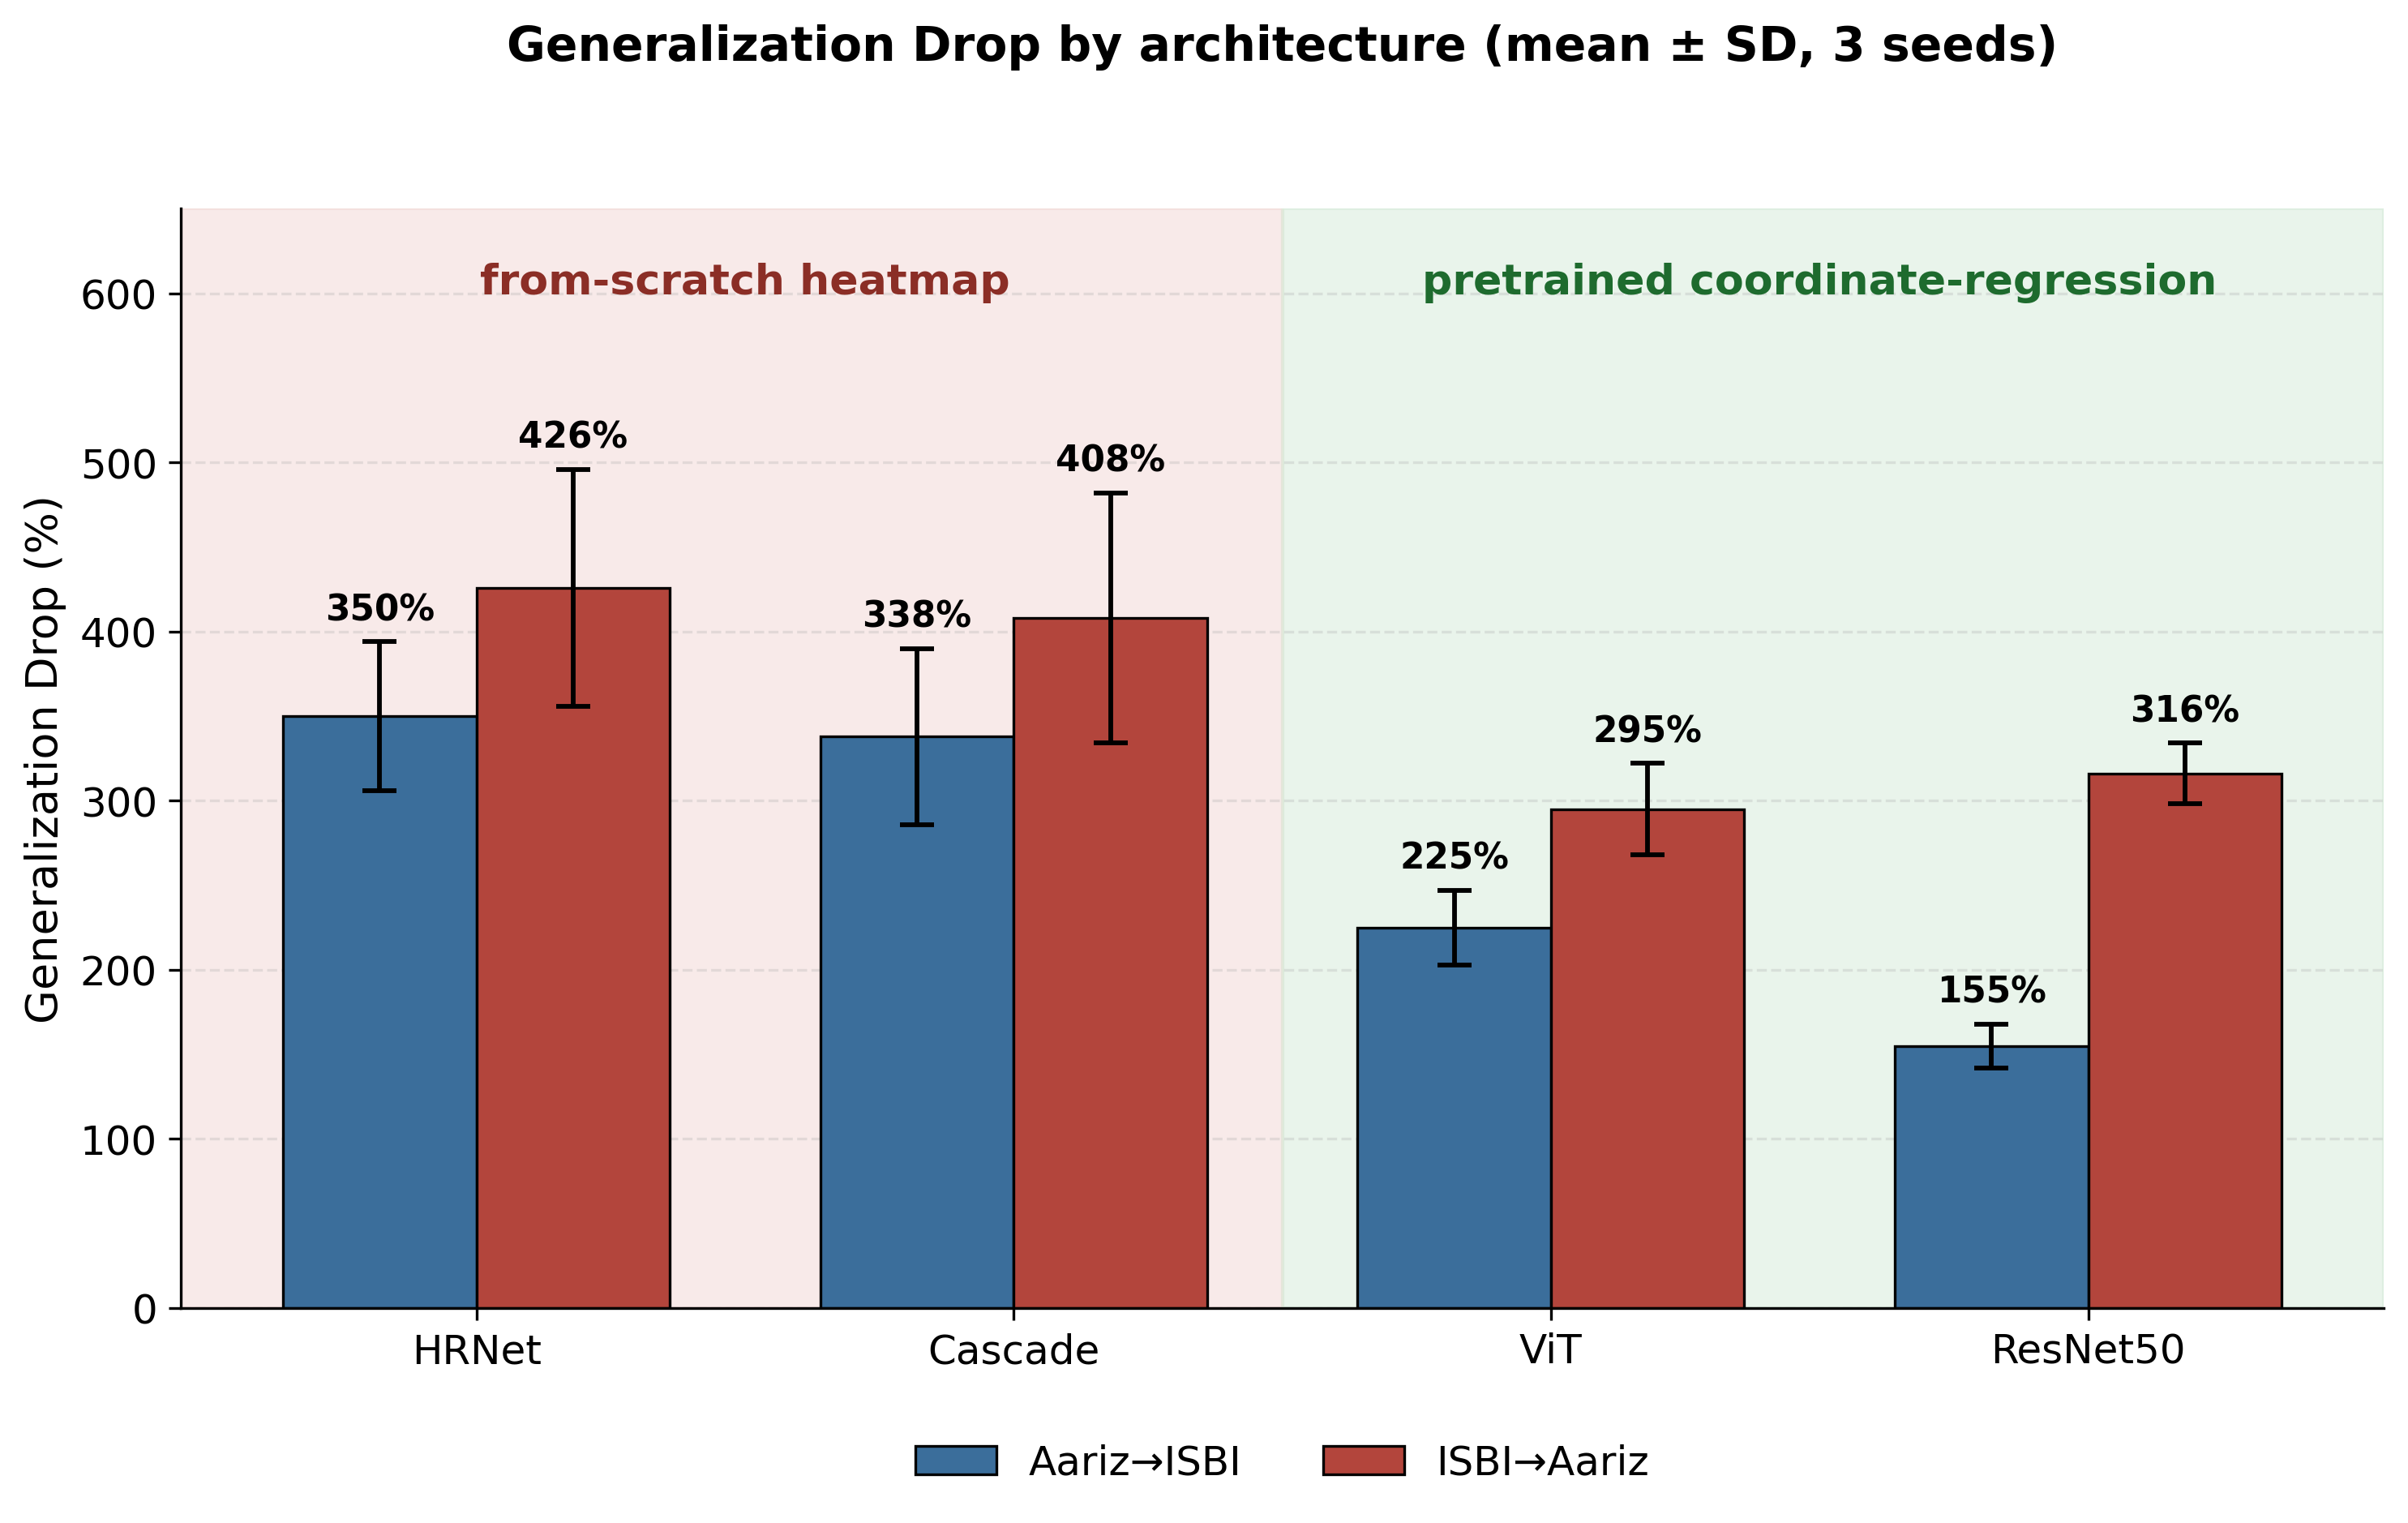
Table 2 by up to about ten percentage points, with the largest divergence where seed variance is highest. GD A→I is the drop when training on Aariz and testing on ISBI; GD I→A is the reverse. The two from-scratch heatmap architectures occupy the four highest values and the two pretrained coordinate-regression architectures the four lowest, with no overlap between the families.
Table 3.
Generalization Drop, GD = (MRE_cross − MRE_in)/MRE_in × 100, corresponding to the errors in
Table 2; mean ± SD over three seeds. GD was computed separately within each seed and then averaged; because the average of a ratio is not the ratio of averages, these values differ from the ratio of the seed-averaged errors in
Table 2 by up to about ten percentage points, with the largest divergence where seed variance is highest. GD A→I is the drop when training on Aariz and testing on ISBI; GD I→A is the reverse. The two from-scratch heatmap architectures occupy the four highest values and the two pretrained coordinate-regression architectures the four lowest, with no overlap between the families.
| Architecture | GD A→I | GD I→A |
|---|
| HRNet | 350 ± 44% | 426 ± 70% |
| Cascade | 338 ± 52% | 408 ± 74% |
| ViT | 225 ± 22% | 295 ± 27% |
| ResNet50 | 155 ± 13% | 316 ± 18% |
3.2. Cross-Dataset Generalization (Axis 1)
Evaluated on the held-out dataset, error increased sharply in every case (
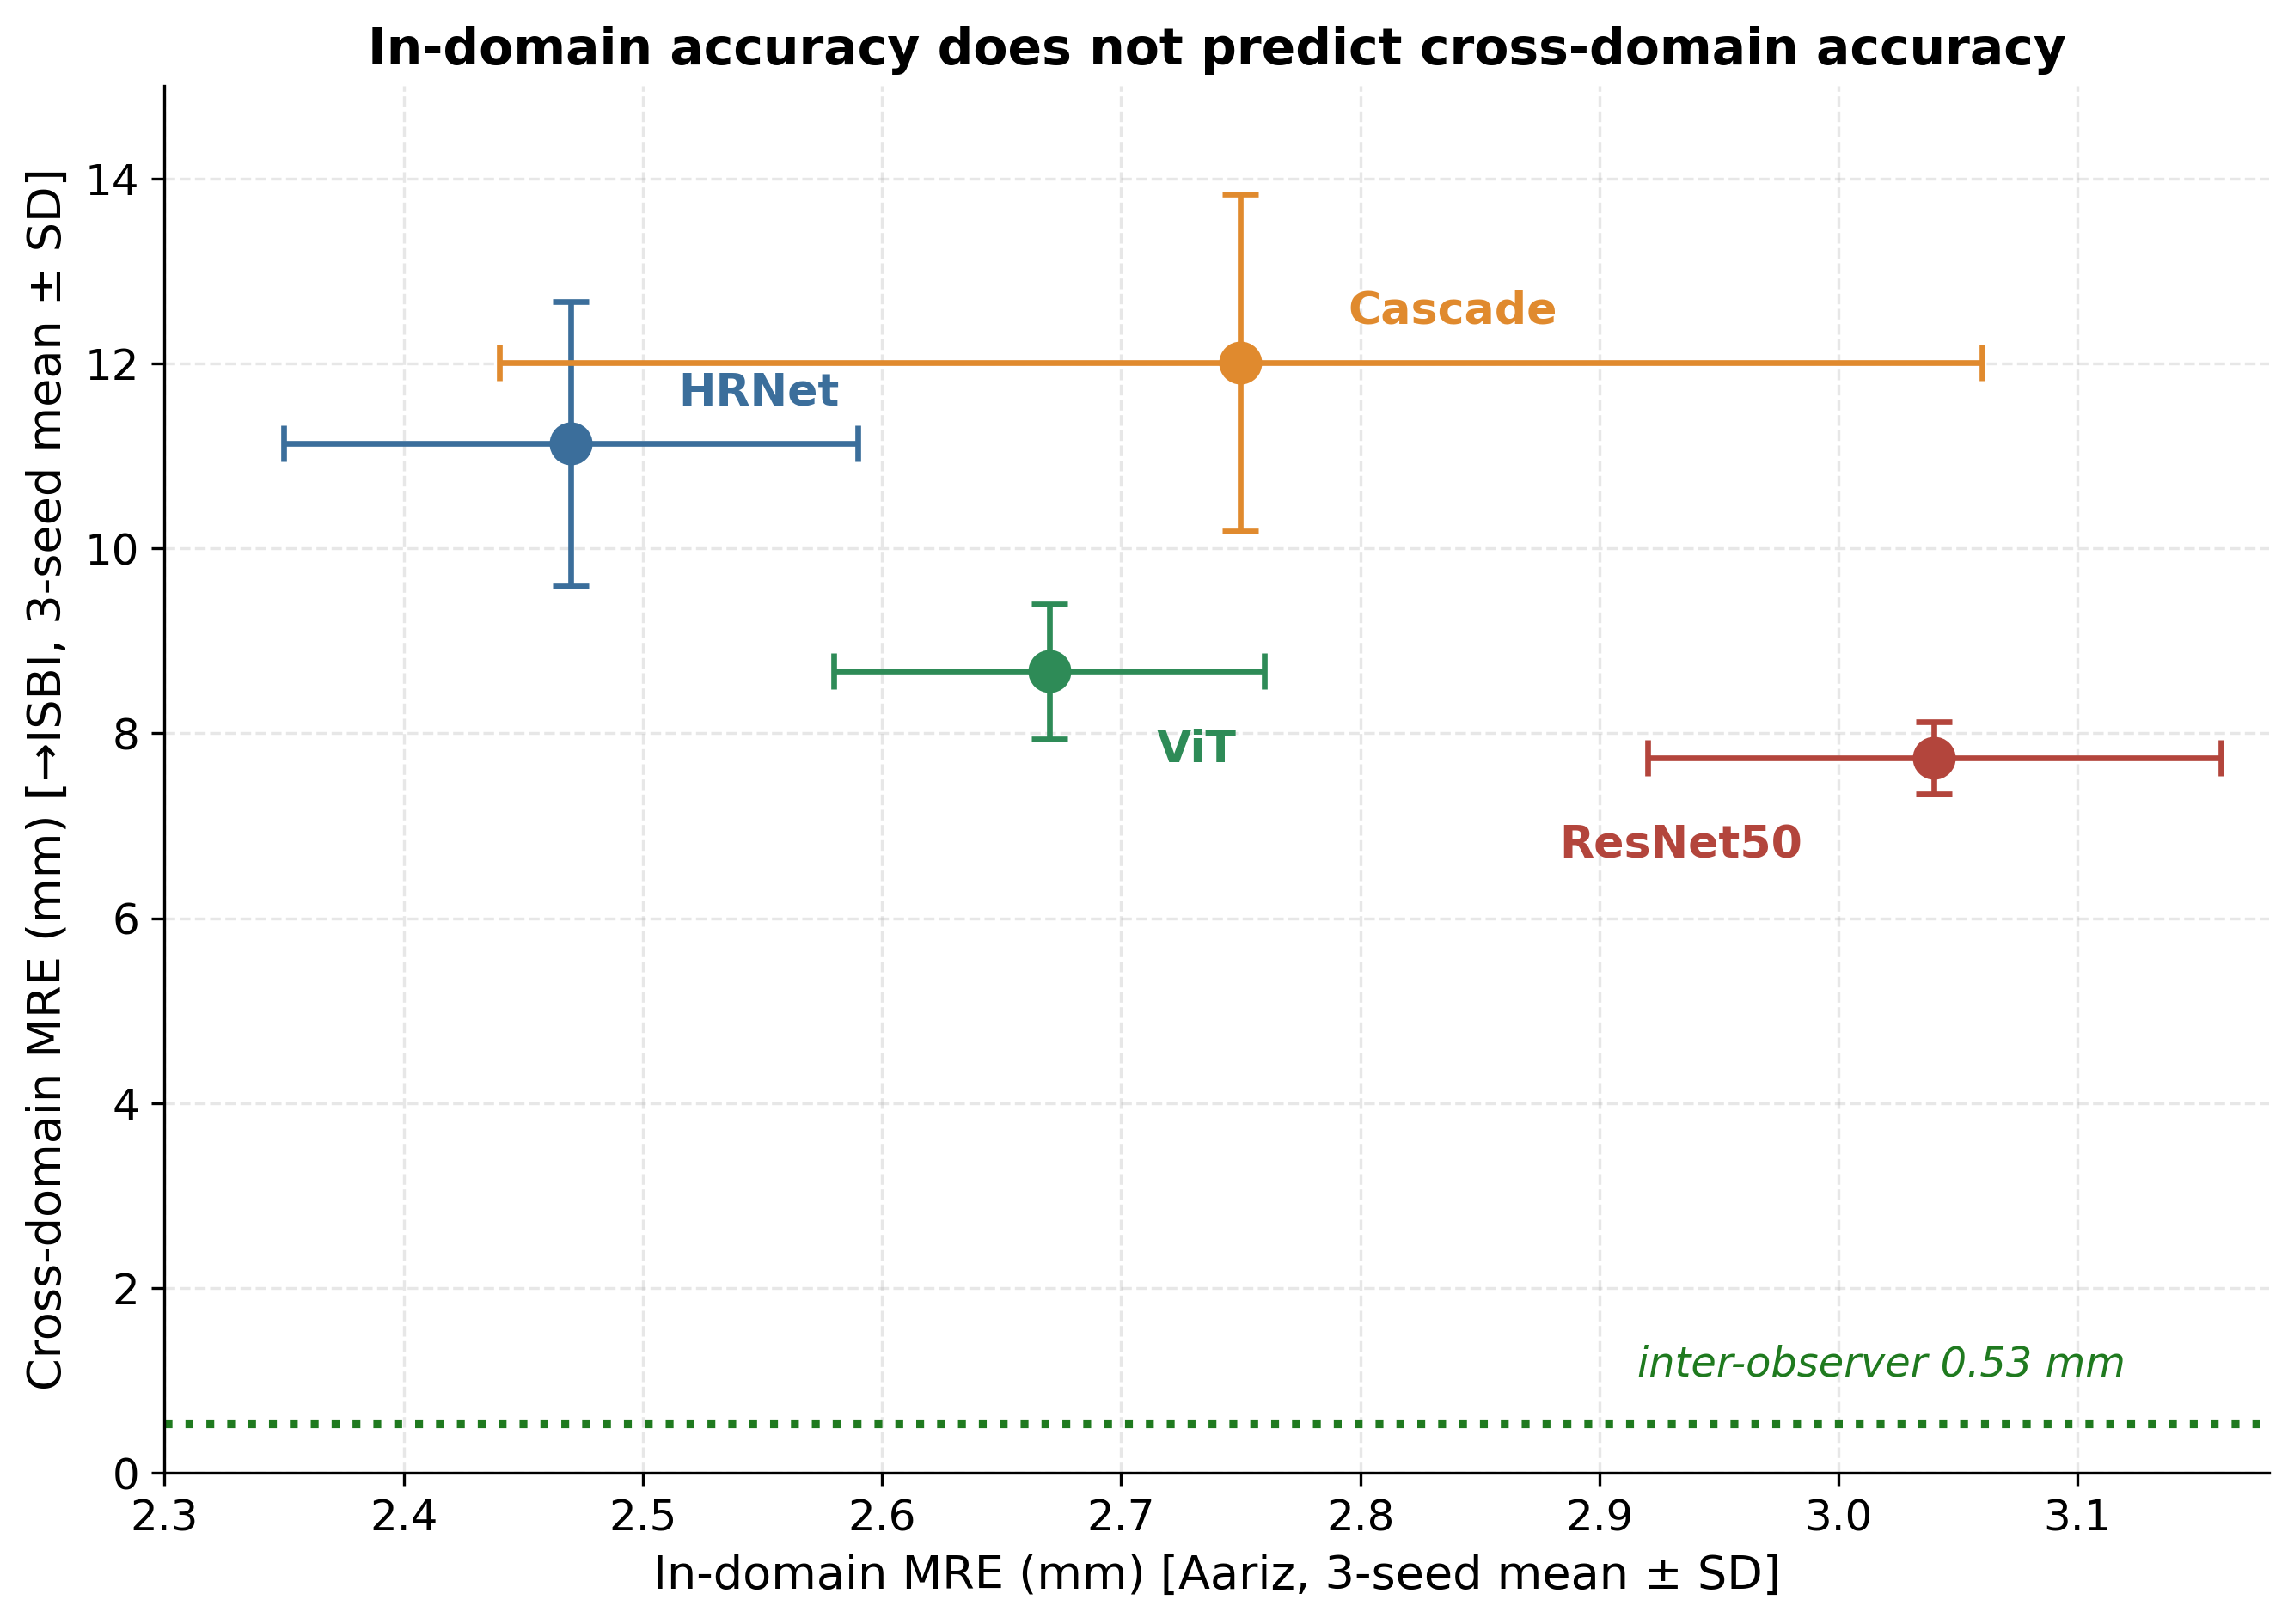
Table 2, off-diagonal). Trained on Aariz and tested on ISBI, MRE rose from 2.47 to 11.13 mm (HRNet), 2.75 to 12.01 mm (cascade), 2.67 to 8.67 mm (ViT), and 3.04 to 7.73 mm (ResNet50). Trained on ISBI and tested on Aariz, the collapse was larger (20.15–23.07 mm).
Figure 1 shows the Generalization Drop for each architecture and direction. Three patterns emerged. First, in-domain accuracy did not predict cross-domain accuracy (
Figure 2): the in-domain and cross-domain orderings were almost exactly inverted. The most accurate model in-domain (HRNet, 2.47 mm) was the second worst on ISBI (11.13 mm), while the least accurate in-domain (ResNet-50, 3.04 mm) transferred best in this direction (7.73 mm); the from-scratch heatmap pair occupied the two worst cross-domain positions, including the architecture that was most accurate in-domain. Second, models trained on the multi-device Aariz set generalized far better than those trained on the single-device ISBI set, across all families; this is not a controlled contrast, however, since Aariz is also the larger set (1000 vs. 400 images) and differs in population and annotation protocol, so device diversity, training set size, and cohort cannot be separated here. Third, the two architecture families separated completely (
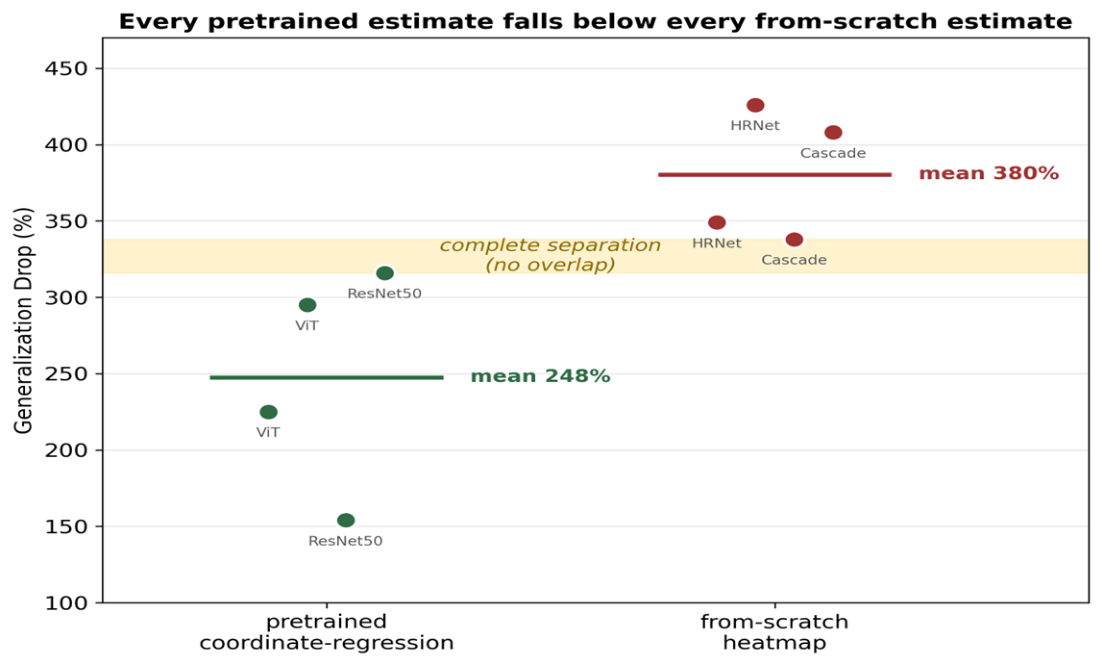
Figure 3). Every one of the four pretrained estimates (one per architecture and direction; range 155–316%) fell below every one of the four from-scratch estimates (range 338–426%), with family means of 248% and 380%, respectively. Because this is a complete ordering, not an overlapping difference, it does not depend on any assumption about the independence of the underlying seeds; we, therefore, report it descriptively, since a pooled
p-value would overstate the effective sample size. The pretrained models were also markedly more reproducible across seeds (mean per-cell SD ~20% vs. ~60% for the from-scratch models), indicating both better and more stable generalization.
3.3. Within-Dataset, Cross-Device Generalization (Axis 2)
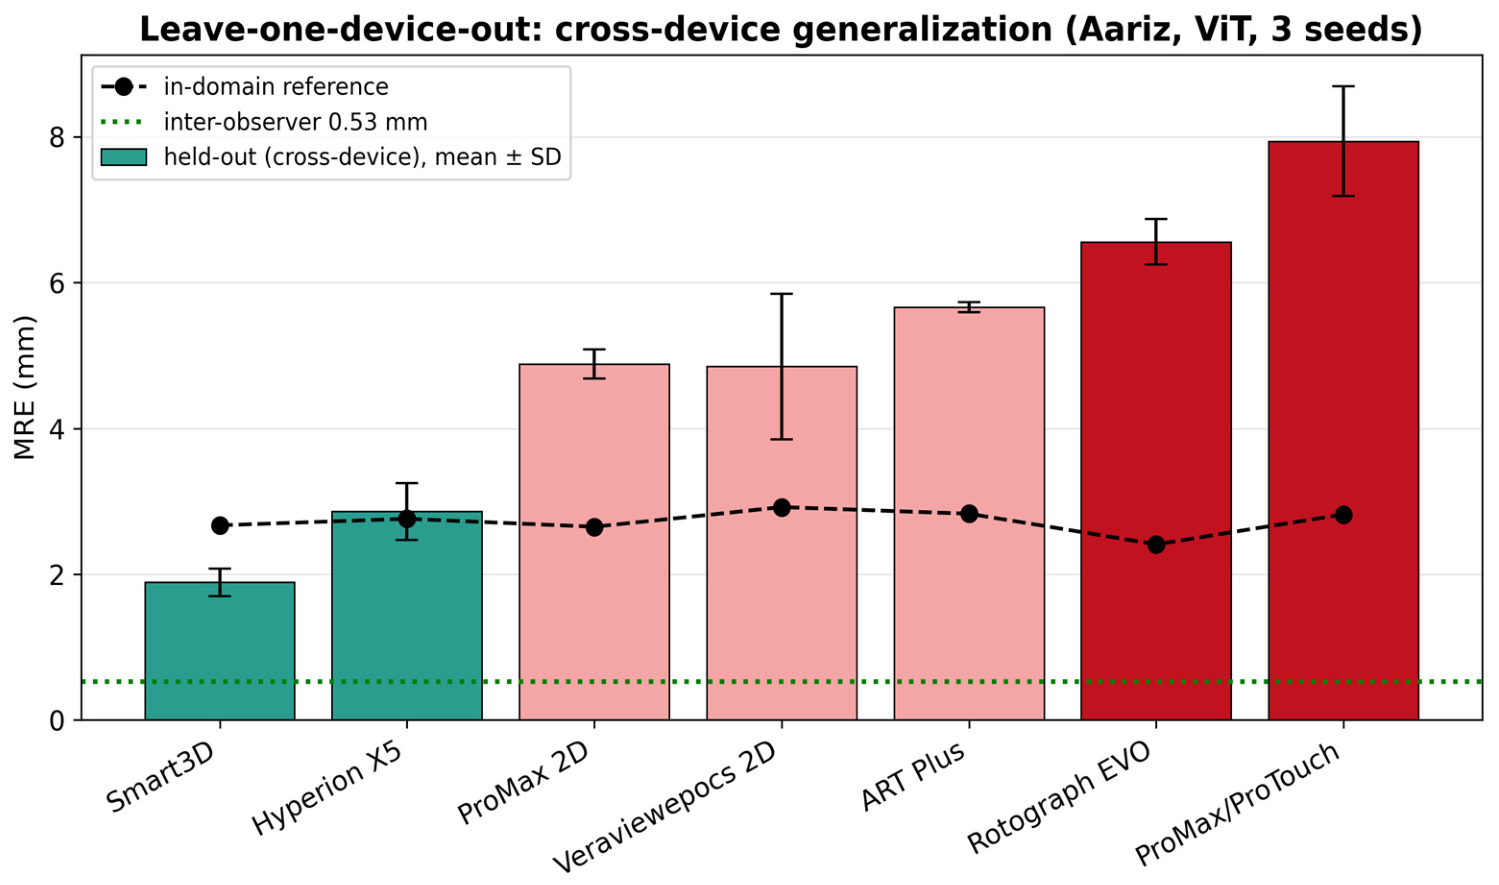
Leave-one-device-out on Aariz (seven devices, ViT, leak-free validation) showed domain shift even within a single dataset (
Table 4,
Figure 4). Held-out-device MRE averaged 4.95 mm against an in-domain reference of ~2.72 mm. This difference did not reach statistical significance (Wilcoxon signed-rank
p = 0.078; Shapiro–Wilk
p = 0.25), which we attribute to the small number of devices (
n = 7) and the heterogeneity of the per-device effect, not to the absence of a shift; we, therefore, treat the leave-one-device-out result as indicative rather than confirmatory. The shift was device-specific, not uniform, and this pattern was reproducible across seeds. The seven devices fell into four bands (
Table 4). One generalized better than in-domain in every seed (Smart3D, GD −29 ± 7%) and one was neutral on average but variable across seeds (Hyperion X5, GD 5 ± 21%). Three were intermediate, with drops of 66–101% (Veraviewepocs 2D, ProMax 2D, ART Plus), and two degraded consistently, more than doubling the in-domain error (Rotograph EVO 6.55 ± 0.30 mm, GD 172 ± 9%; ProMax with ProTouch 7.94 ± 0.75 mm, GD 181 ± 15%). All models were implemented in Python 3.14.5 with PyTorch 2.12.0, timm 1.0.27, NumPy 2.4.6 and SciPy 1.17.1.
The multi-seed replication is informative in two ways. First, the extreme devices are highly reproducible: the best-transferring device (Smart3D) and the two worst (Rotograph EVO, ProMax with ProTouch) show narrow seed-to-seed variation (GD SD ≤ 15 percentage points), so these are genuine device effects rather than sampling noise. Second, the near-neutral device (Hyperion X5) is precisely the one with the widest spread (GD 5 ± 21%, ranging from −8% to +29% across seeds), which illustrates why single-run device analyses can mislead: a single seed would have supported either “no shift” or “moderate shift” for this device. Held-out sets for the two smallest devices were modest (ProMax 2D n = 41, Smart3D n = 59), but their seed-to-seed variability was among the lowest in the panel (GD SD 11 and 7 percentage points, respectively), indicating that their estimates are not dominated by small-sample noise; the overall pattern holds across all seven devices spanning n = 41–366.
3.4. Human-Expert Reference (Inter-Observer Variability)
Senior-versus-junior orthodontist disagreement on Aariz (1000 images, 19 landmarks, 19,000 paired measurements) averaged 0.53 mm (median 0.13 mm; per-landmark means ranged 0.06–1.34 mm; 93.9% of measurements within 2 mm). The right-skewed distribution (mean > median) reflects a few harder landmarks dominating the mean. The mean model error did not approach the mean inter-observer difference even in-domain (best ~2.5 mm, ~5× the 0.53 mm reference), and cross-domain mean errors were 15–44× that reference. The two quantities are not strictly commensurable: the inter-observer figure is the spread between two human tracings of the same image, whereas the model is scored against a fixed ground truth, so the model is held to the stricter standard. The least reproducible landmarks were Porion (1.34 mm) and Gonion (1.32 mm), both bilateral structures whose projection was ambiguous on a lateral radiograph; the most reproducible was Sella (0.06 mm). Two caveats are attached to this reference. First, the inter-observer band is derived from Aariz alone, because ISBI’s public export contains a single tracing; comparing ISBI cross-domain error against an Aariz-derived human band is, therefore, not strictly like-for-like, and the “15–44×” figure should be read as an order-of-magnitude reference rather than a matched comparison. Second, imperfect observer agreement is a general feature of two-dimensional radiographic interpretation in orthodontics and has been documented for other diagnostic tasks on the same imaging modality [
17]; this underlines the difficulty of defining a flawless ground truth for automated landmark detection.
3.5. Mitigation: Balanced Joint Training (Axis 3)
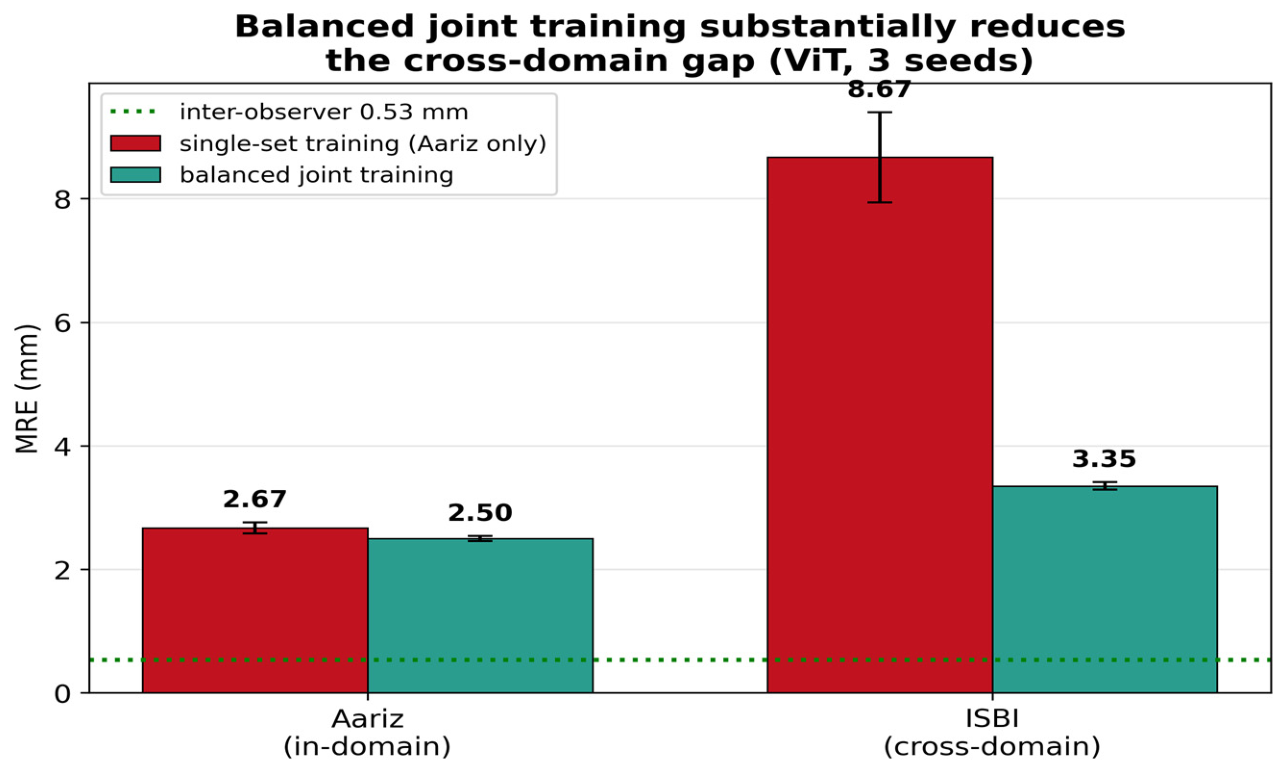
Training on a balanced mixture of both datasets substantially reduced the cross-domain gap for every architecture (
Table 5,
Figure 5; mean ± SD over three seeds per condition). In every case, both domains landed near in-domain accuracy (≈2.1–3.5 mm) without degrading in-domain performance; HRNet, for example, was slightly better on Aariz under joint training than under single-set training (2.21 ± 0.17 mm vs. 2.47 ± 0.12 mm). The from-scratch heatmap models, most fragile under single-set training, became the strongest under joint training (2.53 ± 0.13 mm for HRNet and 2.52 ± 0.05 mm for the cascade on ISBI), indicating that the training distribution is a major driver of cross-domain error, although architecture effects do not vanish entirely under joint training.
3.6. Pretrained-Versus-Scratch Ablation
To test the proposed mechanism directly, we repeated the cross-dataset experiment with a single architecture (coordinate-regression ResNet-50) under two initializations—ImageNet-pretrained and trained from scratch—holding every other setting constant, over three seeds. The pretrained arm uses the same configuration as the ResNet-50 reported in
Table 2, so its agreement with that row (in-domain 3.04 mm and cross-domain 7.73 ± 0.39 mm in both) serves as an internal consistency check rather than as an independent result; the scratch arm is the new comparison.
Pretraining improved in-domain accuracy on Aariz (3.04 mm vs. 3.91 mm from scratch) and produced a large advantage in the Aariz-to-ISBI direction: cross-domain error was 7.73 ± 0.39 mm with pretraining versus 16.36 ± 0.29 mm from scratch, a 2.1-fold reduction, with Generalization Drop 155 ± 13% versus 318 ± 9%. In the opposite direction (ISBI to Aariz), the two initializations performed similarly in absolute terms (23.07 ± 1.30 mm pretrained vs. 20.62 ± 0.22 mm from scratch), and the Generalization Drop was in fact higher for the pretrained model (316 ± 19% vs. 259 ± 4%).
This asymmetry requires care in interpretation. Because Generalization Drop is a ratio normalized by in-domain error, a model that is better in-domain is penalized in the ratio when its absolute cross-domain error is comparable; the pretrained model’s stronger in-domain performance, therefore, inflates its drop in the ISBI-to-Aariz direction even though absolute errors are similar. Averaged over both directions, the pretrained model showed a lower mean drop (235 ± 90%) than the scratch model (288 ± 33%), but the spread is wide, and the intervals overlap.
We, therefore, report this ablation as partial rather than conclusive support for the pretraining mechanism. It establishes that ImageNet initialization confers a substantial and reproducible transfer advantage when training on the larger, multi-device dataset and testing on the single-device one, but not that pretraining improves transfer symmetrically in all directions.
3.7. Landmark-Level Breakdown
Aggregate MRE conceals substantial variation between anatomical points, and clinical tolerance is landmark-specific. We, therefore, repeated the cross-dataset experiment for two architectures chosen to bracket the effect: the from-scratch HRNet-style network, which was the most accurate in-domain yet showed the largest Generalization Drop (388% averaged over both directions), and the Vision Transformer, which had the lowest absolute cross-domain error (14.41 mm). The error was recorded separately for each of the 19 shared landmarks over three seeds (full table in
Supplementary Table S1). These models were retrained under the identical configuration used for the main matrix, and their cross-domain aggregates reproduce it exactly (11.13 mm for the heatmap network and 8.67 mm for the ViT). The exact agreement confirms that the pipeline is deterministic; the breakdown, therefore, resolves the same predictions to landmark level rather than providing independent corroboration. In-domain aggregates ran slightly higher than in
Table 2 (2.58 vs. 2.47 mm and 2.94 vs. 2.67 mm), reflecting seed variation and the fact that the mean of per-landmark means weights landmarks equally; since the clinical comparison below concerns cross-domain error, this does not affect the conclusions drawn.
For the clinically load-bearing points, the answer is unambiguous. A-point, B-point, Nasion, and Menton all exceeded the 2 mm clinical threshold under domain shift, in both architectures and without exception: for the heatmap network, they reached 12.06, 10.57, 7.67, and 5.96 mm, respectively, and for the ViT, they reached 11.92, 5.96, 11.64, and 4.96 mm. Several of these points were comfortably acceptable in-domain—Menton, for instance, was measured at 0.73 ± 0.02 mm by the heatmap network, well inside the 2 mm threshold and among the most precise in-domain values we recorded—yet none remained within tolerance out-of-domain. Cross-domain error is, therefore, not confined to intrinsically difficult landmarks; it reaches the points on which skeletal classification depends.
The breakdown also shows that the two architectures fail in different ways. The heatmap network is highly uneven: in-domain, it spans 0.72 mm (Gnathion) to 5.05 mm (Gonion), and cross-domain, it spans 3.89 mm to 29.21 mm, with Gonion, Porion, Articulare, and Sella deteriorating most. The ViT is far more uniform, spanning 2.13–3.90 mm in-domain and 4.77–12.61 mm cross-domain; at Gonion, the difference between the two is more than threefold (8.04 mm versus 29.21 mm). Notably, the three landmarks the heatmap network localized best in-domain—Gnathion (0.72 mm), Menton (0.73 mm), and Pogonion (1.10 mm)—were also among those with the largest relative degradation (Generalization Drop 626%, 716%, and 661%). Across all 19 landmarks, the rank correlation between in-domain error and Generalization Drop was not statistically significant (Spearman ρ = −0.19, p = 0.42), so we do not claim a general inverse relationship; we note only that the architecture-level pattern reported above—sub-millimeter in-domain precision accompanying the steepest collapse—is visible at the level of individual landmarks as well.
Finally, the landmarks that degraded most under domain shift overlap with those that human observers agree on least: Porion and Gonion, which showed the highest inter-observer variability in
Section 3.4 (1.34 mm and 1.32 mm), were also among the worst cross-domain points for both architectures. Anatomical ambiguity and sensitivity to acquisition shift, therefore, appear to affect the same structures.
4. Discussion
Principal findings. Across four architecture families and two datasets, in-domain superiority did not transfer: the single most accurate model in-domain (the from-scratch HRNet, 2.47 mm on Aariz) was among the worst across datasets, and the from-scratch heatmap family as a whole showed the largest Generalization Drops, while the pretrained coordinate-regression models transferred best despite the least accurate of them ranking last in-domain. The separation between families was complete: all four pretrained estimates fell below all four from-scratch estimates (family means 248% vs. 380%). Generalization degraded in every direction and at every scale tested—between datasets and even between devices within a single dataset—and balanced multi-source training recovered most of the loss for every architecture.
The practical implication of this pattern is worth stating plainly. If in-domain leaderboards do not predict cross-domain ranking, then the standard practice of selecting an architecture on the basis of single-dataset performance is unreliable for any application that will encounter images from new devices or centers—which is to say, essentially all clinical deployment. A model chosen because it tops the ISBI leaderboard may be among the worst choices once it meets images from a different scanner. This inversion, not any single error value, is the central message of our results.
Comparison with prior work. Single-dataset reports approach ~1.2–1.5 mm on ISBI [
4]; our in-domain figures are higher because every architecture used one fixed training budget for fair comparison rather than per-model tuning, and because we report on a strict shared-landmark subset in millimeters. The out-of-domain drop is consistent with the broader literature: the CL-Detection 2023 organizers questioned whether single-center, single-vendor benchmarks generalize and built a multi-center resource for that reason [
4], and transfer learning baselines evaluated on a diverse cephalometric dataset alongside the ISBI benchmark report substantial differences in accuracy between architectures and across image subcategories [
18]. Where external validation exists, reported drops are typically milder than ours: a multi-center three-dimensional model retained approximately 2 mm accuracy across Finnish and Thai cohorts [
19]. Our larger drops reflect a deliberately harsher, fully independent, untuned test rather than a contradiction.
Architecture and generalization. The Vision Transformer, achieving the lowest average cross-domain error (14.41 mm across the two directions), despite ranking second on Aariz and third on ISBI in-domain, aligns with evidence that ViTs are more robust than CNNs under distribution shift [
20]. Whether that robustness stems from self-attention itself is contested: convolutional networks with suitable design choices have been shown to match or exceed transformer robustness [
21], which shifts the explanation toward training regime and architectural detail rather than attention per se. Our own results point the same way, since both of our best out-of-domain models were pretrained coordinate-regression networks—one transformer and one convolutional—and the pretrained-versus-scratch ablation isolated initialization, not architecture, as the operative factor. Across three seeds, the two families separated completely, with no overlap between their Generalization Drop estimates, and the pretrained models were additionally threefold more reproducible across seeds, strengthening this beyond a single-run observation. The mitigation result echoes the domain generalization and domain adaptation literature, which identifies multi-source training as a first-line strategy [
8,
9], and complements the single-source line of work that instead expands training diversity through aggressive augmentation when only one domain is available [
22].
A plausible mechanism ties these observations together. Large-scale pretraining exposes a network to enormous natural image variability before it ever sees a cephalogram, yielding low-level and mid-level features that are comparatively invariant to the intensity and texture idiosyncrasies of a particular scanner. A from-scratch heatmap network, by contrast, learns all of its features from a few hundred images acquired on one device, and can achieve very sharp in-domain localization precisely by exploiting device-specific regularities that do not generalize. On this view, the strong in-domain performance of the scratch models and their poor transfer are two faces of the same phenomenon: features finely tuned to one acquisition distribution. The coordinate-regression formulation of our pretrained models may further help, because directly regressing coordinates couples less tightly to the absolute pixel-intensity patterns that shift most across devices than dense heatmap matching does. To move this from interpretation toward evidence, we performed a controlled pretrained-versus-scratch ablation on an identical architecture (
Section 3.6), holding the network fixed and varying only ImageNet initialization. It shows that pretraining confers a large and reproducible advantage when transferring from the multi-device dataset to the single-device one (cross-domain error 7.73 ± 0.39 mm vs. 16.36 ± 0.29 mm from scratch), while in the reverse direction the two initializations perform comparably; the mechanism is, therefore, supported in one transfer direction rather than uniformly, a claim the ablation tests directly instead of assuming.
Clinical interpretation. Inter-observer variability here was 0.53 mm, and a 2 mm radial error is a common clinical acceptability threshold. In-domain, the best model sat at ~2.5 mm (SDR@2 mm 63.7% on the illustrative seed); cross-domain, SDR@2 mm fell to 6–17%, i.e., fewer than one in five landmarks within tolerance—unusable for unsupervised deployment on a new device or center. The device-specific leave-one-device-out result implies that a model validated on one clinic’s scanner may fail on another’s, and that the devices represented in training should be chosen deliberately. The mitigation result offers a concrete, low-cost remedy: pooling balanced data from the target imaging sources restored ≈ 2.1–3.5 mm across both domains.
These findings carry a specific message for anyone building or procuring such systems. Vendor-reported accuracy, if obtained on a single internal dataset, should be treated as an upper bound that may not hold on local images; acceptance testing on the receiving center’s own devices is essential before clinical reliance. Where a system must serve multiple sites, our mitigation result suggests that assembling even a modest, balanced sample from each target device and retraining is a more dependable route to robustness than selecting a nominally superior architecture trained elsewhere. The broader literature on safe and responsible medical AI stresses caution before clinical reliance on models validated in narrow settings [
23,
24]. Our results provide a concrete quantitative illustration of why in-domain metrics alone are insufficient evidence of fitness for deployment.
Limitations. All four experimental axes—the cross-dataset matrix, the leave-one-device-out analysis, the joint-training mitigation, and the pretrained-versus-scratch ablation—were repeated over three seeds and are reported as mean ± SD. Three seeds nevertheless remain a modest number, and broader replication across more seeds, datasets, and centers would further tighten the estimates; the per-device estimates in particular carry visible seed-to-seed variability for some devices.
A second constraint is the fixed training recipe. Holding the optimizer, schedule, input resolution, and epoch budget constant across architectures equalizes experimenter effort, but it does not isolate architecture as a causal factor, and it means the from-scratch heatmap models were not tuned to their individual optima. Their large generalization drop should, therefore, be read as the behavior of these architectures under a common budget, not as a demonstrated architectural ceiling; under-optimization and intrinsic architectural limits cannot be fully separated in this design. The pretrained-versus-scratch ablation partially addresses this by holding the architecture fixed and varying only initialization, but a full per-architecture tuning study remains outside the scope of this work.
A third constraint is analysis coverage: two analyses were run with a single architecture rather than all four—the leave-one-device-out axis used the Vision Transformer, and the landmark-level breakdown in
Section 3.7 used the two extreme architectures on a single training source (Aariz). The device-level behavior of the remaining architectures is, therefore, not characterized, although running the device axis with the most transferable model makes those estimates conservative. The landmark-level analysis likewise establishes that the clinically load-bearing points exceed the 2 mm threshold under domain shift for the two architectures examined but does not describe the full landmark-by-architecture surface; extending it to the cascade and the pretrained ResNet-50, and to both transfer directions, would complete that picture.
ISBI ground truth is senior-only in the public export, whereas Aariz uses the senior + junior mean; this difference in ground truth definition may contribute to the apparent cross-dataset gap. To bound its magnitude, we note that the reported inter-observer variability on these landmarks is ~0.53 mm, so the senior-versus-mean discrepancy is on the order of a few tenths of a millimeter—more than an order of magnitude smaller than the cross-dataset shifts of 5–18 mm we observe. The ground truth asymmetry, therefore, cannot account for the bulk of the generalization gap, though we retain it as a limitation and note that harmonized annotation would tighten the estimates. Relatedly, the two datasets differ not only in acquisition equipment but also in the patient populations they were drawn from, so the cross-dataset gap reported here reflects the combined effect of device, annotation protocol, and population morphology rather than acquisition shift alone; disentangling these components would require datasets matched on one factor while varying another, which the available public resources do not currently permit.
Several further limitations should be noted. Architecture is confounded with pretraining, output representation, and input resolution: the two families that transferred best were both pretrained, both coordinate-regression, and both trained at 224 × 224, so these attributes cannot be disentangled from one another in the main matrix. The ablation in
Section 3.6 isolates initialization alone and does not resolve the remaining confounds. No inferential test was applied at the landmark level; the breakdown in
Section 3.7 is descriptive, and the rank correlation reported there was not significant. Downstream cephalometric measurements such as SNA, SNB, and ANB were not computed, so the propagation of landmark error into the angular quantities used clinically remains to be quantified. The shared-landmark mapping was confirmed by a single orthodontist who is an author of this work; independent confirmation by two blinded orthodontists with a reported agreement statistic would be preferable, particularly for the soft tissue points.
Finally, the cross-dataset axis rests on two datasets. Two domains are sufficient to demonstrate that in-domain ranking fails to predict cross-domain ranking, but not to characterize how the gap scales with the number or diversity of source domains; incorporating further public datasets as they become available is a natural extension, and the within-Aariz leave-one-device-out analysis, which spans seven devices, partly compensates by providing a second and finer-grained shift axis.